Abstract
The diphtheria toxin translocation (T) domain inserts into the endosomal membrane in response to the endosomal acidification and enables the delivery of the catalytic domain into the cell. The insertion pathway consists of a series of conformational changes that occur in solution and in the membrane and leads to the conversion of a water-soluble state into a transmembrane state. In this work, we utilize various biophysical techniques to characterize the insertion pathway from the thermodynamic perspective. Thermal and chemical unfolding measured by differential scanning calorimetry, circular dichroism and tryptophan fluorescence reveal that the free energy of unfolding of the T-domain at neutral and mildly acidic pH differ by 3–5 kcal/mol, depending on the experimental conditions. Fluorescence correlation spectroscopy measurements show that the free energy change from the membrane-competent state to the interfacial state is approximately −8 kcal/mol and is pH-independent, while that from the membrane-competent state to the transmembrane state ranges between −9.5 to −12 kcal/mol, depending on the membrane lipid composition and pH. Finally, the thermodynamics of transmembrane insertion of individual helices was tested using an in vitro assay that measures the translocon-assisted integration of test sequences into the microsomal membrane. These experiments suggest that even the most hydrophobic helix TH8 has only a small favorable free energy of insertion. The free energy for the insertion of the consensus insertion unit TH8-TH9 is slightly more favorable, yet less favorable than that measured for the entire protein, suggesting a cooperative effect for the membrane insertion of the helices of the T-domain.
INTRODUCTION
The diphtheria toxin is composed of three domains (the catalytic C-domain, the translocation T-domain, and the receptor-binding R-domain), together constituting the necessary machinery to enter and kill the cell. The toxin follows the endosomal pathway of internalization, where the T-domain and the acidic endosomal pH play key roles in allowing the toxin to get translocated across the membrane (Murphy, 2011). In the acidic environment of the endosomal lumen, the T-domain undergoes a pH-triggered refolding that results in its membrane insertion (Ladokhin, 2013) and the translocation of its N-terminus, with the attached C-domain, across the bilayer (Oh et al., 1999; Senzel et al., 1998). The kinetic and structural/topological details of the T-domain’s refolding/insertion process have been extensively studied (Hayashibara & London, 2005; Kurnikov et al., 2013; Kyrychenko et al., 2009; Ladokhin et al., 2004; Rodnin et al., 2010; Rodnin et al., 2011; Rosconi & London, 2002; Rosconi, Zhao & London, 2004; Senzel et al., 2000; Vargas-Uribe et al., 2013a; Wang & London, 2009; Wang et al., 1997); however, detailed information on the thermodynamics behind the process is scarce, limiting our understanding of pH-triggered membrane insertion of proteins and its potential therapeutic applications to deliver cargo into cells. Here, we utilize a set of biophysical techniques to characterize the thermodynamics that drives the action of the T-domain in the membrane.
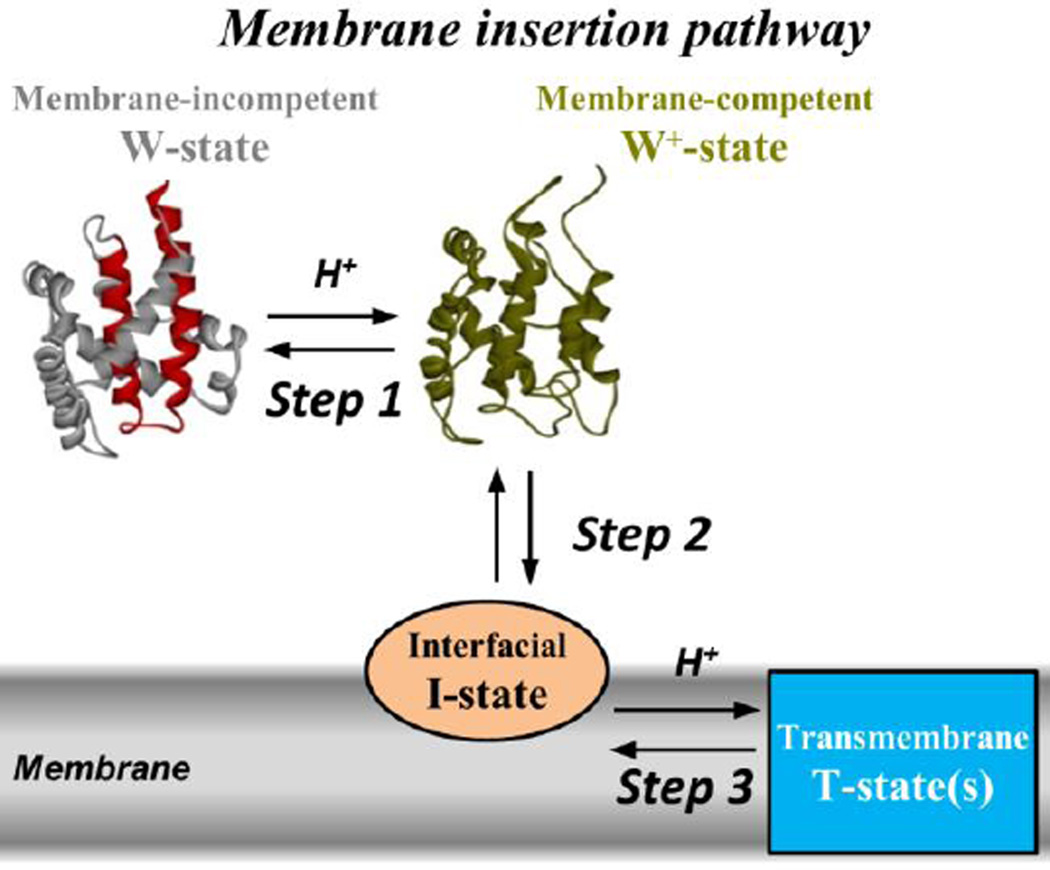
The kinetic pathway for the membrane insertion of the T-domain consists of a series of conformational changes that occur in solution and in the membrane (Kyrychenko et al., 2009). A simplified scheme for this pathway is shown in Fig. 1, where we illustrate the 3 steps under study. Step 1 occurs in solution and comprises the transition from the W-state to the W+-state. The W-state is the only state with known high resolution structure (Bennett & Eisenberg, 1994): a set of nine helices arranged in a globular fold, where the two hydrophobic helices TH8-TH9 (Fig. 1, red helices) form the core of the protein. This state is unable to interact with the membrane and is also known as membrane-incompetent state. The W+-state, on the other hand, is a membrane-competent state formed as a result of a conformational change induced by the protonation of key residues during mild acidification of the medium. While the high resolution structure of the W+-state is not available, application of fluorescence and CD spectroscopy along with molecular dynamic simulations suggests that it retains a relatively compact structure with defined secondary and tertiary elements. Some of the helices (e.g. TH1 and TH2) are partially unfolded and the packing of helices TH1 and TH9 against each other is disrupted, allowing for the partial exposure of the hydrophobic core of the protein (a detailed description of suggested conformational changes can be found in (Kurnikov et al., 2013)). Step 2 corresponds to the partitioning of the W+-state to the membrane interface to form the interfacial I-state, with unknown structure. [For the purpose of this study, we will use interchangeably the terms of partitioning, association and binding to define interaction of the T-domain with the membrane]. Finally, step 3 refers to a series of conformational rearrangements (omitted in the scheme for simplicity) that switch the I-state into the final and functional transmembrane T-state. A high resolution structure for the T-state is not available either; however, it is clear that the hydrophobic helices TH8-TH9 adopt a transmembrane topology (Kyrychenko et al., 2009; Rodnin et al., 2011; Rosconi et al., 2004; Senzel et al., 2000), while the remaining helices may exist in multiple conformations (Hayashibara & London, 2005; Rosconi & London, 2002; Rosconi et al., 2004; Senzel et al., 2000).
Fig. 1.
pH-triggered membrane insertion pathway of the diphtheria toxin T-domain. The scheme depicts the crystal structure of the T-domain in solution at neutral pH (Bennett & Eisenberg, 1994), here referred as the W-state. The consensus insertion unit TH8-TH9 is highlighted in red. The membrane insertion pathway (adapted from reference (Kyrychenko et al., 2009)) starts with the formation of the membrane-competent W+-state (Step 1) as a result of the protonation of key residues during the acidification of the medium. Once bound to the membrane interface (Step 2), the T-domain can be stabilized as an interfacial I-state or converted into a transmembrane T-state (Step 3) depending on the membrane composition and the pH. For simplicity, the transient intermediate states formed by protonation and rearrangements of the I-state have been omitted in this scheme, hence illustrating only the steps where we report the changes in free energy.
To study these three thermodynamic transitions, we use a set of biophysical techniques based on the kinetic and thermodynamic properties known for the T-domain. For step 1 (W-state to W+-state), we use differential scanning calorimetry (DSC), circular dichroism (CD) and intrinsic fluorescence measurements to follow the thermal stability of the protein, as it has been suggested that this transition involves changes in protein stability (Rodnin et al., 2010). For the partitioning to the membrane interface and the transmembrane insertion (steps 1 and 2, W+-state to I-state and T-state) we used fluorescence correlation spectroscopy (FCS). Since FCS is a technique that measures the fluorescence fluctuations due to the diffusion of molecules within a focal volume, it can be used to study the association of the protein labeled with a fluorescent probe to lipid vesicles, which are much bigger in size and therefore diffuse with a different rate. Indeed, we have successfully used this technique to thermodynamically characterize the membrane insertion pathway of annexin B12 (Posokhov et al., 2008b) and to describe the kinetic pathway of membrane association of the T-domain itself (Kyrychenko et al., 2009). Finally, we complement this study with an in vitro study that quantifies the integration of peptides into the microsomal membrane to directly measure the free energy of membrane insertion of the helices of the T-domain.
RESULTS
1. Conformational switching in solution (Step1)
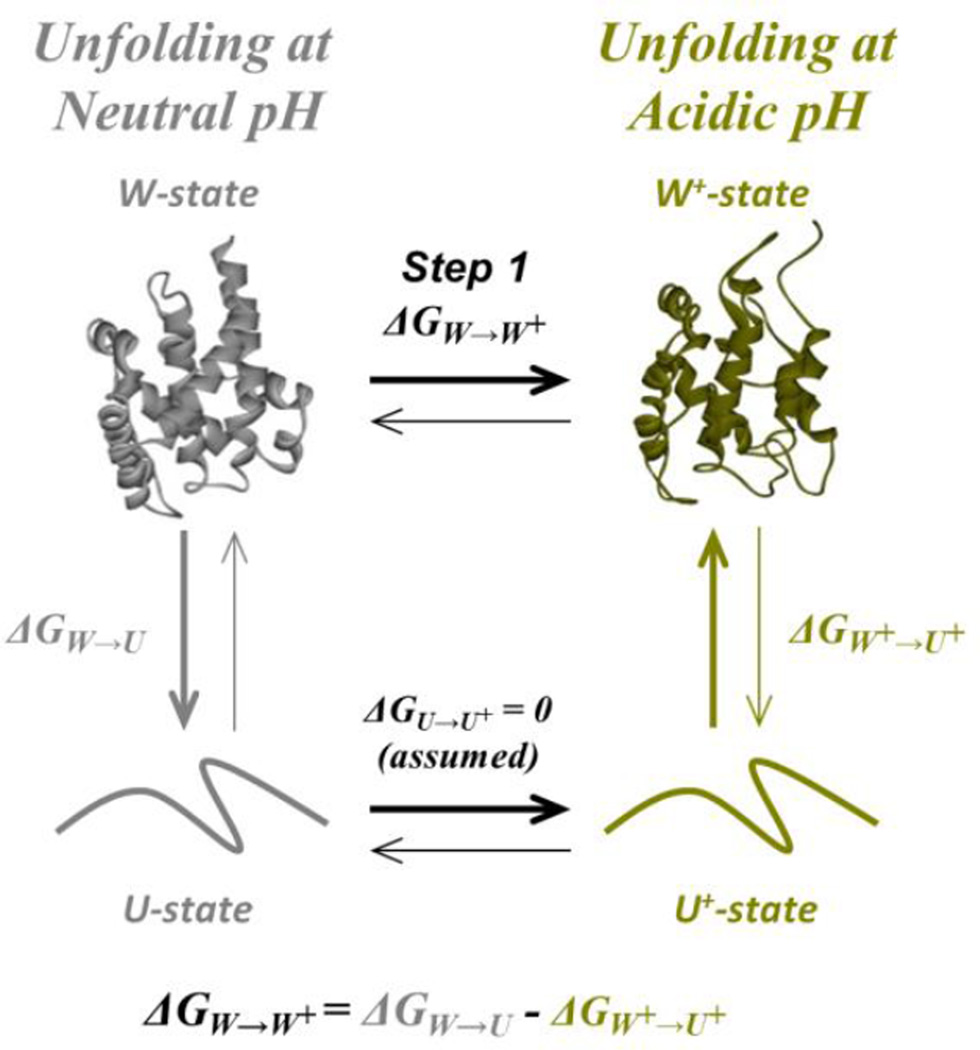
The first step in the membrane insertion pathway of the T-domain corresponds to the conformational switching between the W-state and the W+-state, which is triggered by the protonation of key residues upon acidification (Kurnikov et al., 2013; Rodnin et al., 2010). The structural changes have been evidenced not only through MD simulations (Kurnikov et al., 2013), but also experimentally through differences in thermodynamic stability (Vargas-Uribe et al., 2013a). To estimate the free energy difference between the W- and the W+-state, we followed the thermodynamic cycle shown in Fig. 2. In the cycle, the free energy for the conversion of the W- into the W+-state (ΔGW-to-W+) is equal to the difference in free energy of unfolding of both states (assuming that the free energy difference between the unfolded states is zero). Thus, we performed thermal and chemical unfolding measurements at neutral and mildly acidic pH to estimate the ΔG of unfolding for the W- and W+-state, respectively, following the changes in the signal with circular dichroism (CD), differential scanning calorimetry (DSC) and intrinsic fluorescence measurements.
Fig. 2.
Thermodynamic cycle used to characterize pH-induced changes in ΔG for the conformational switching in T-domain in solution. The free energy change for the transition W-to-W+ can be measured indirectly by following an alternative refolding pathway (thicker arrows). The system is assumed to be at equilibrium, with each transition reversible, and with the unfolded states undistinguishable. The color coding represents the experimental conditions for the measurements, where grey corresponds to neutral pH and dark yellow to mildly acidic pH.
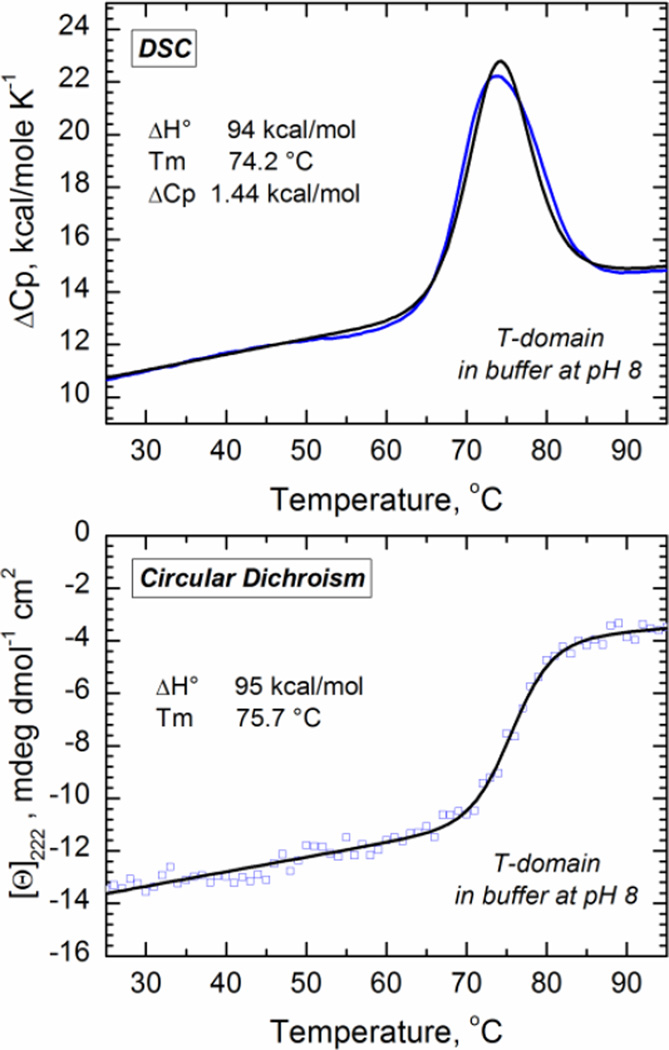
In Fig. 3 we display representative curves for the thermal unfolding transition at neutral pH with CD and DSC, and a summary of the thermodynamic parameters obtained upon fitting of the data to a two-state unfolding transition as described in the methods section (Table 1). The data show that a decrease in the pH is accompanied by a loss of thermostability, as both the melting temperature (Tm) and the enthalpy change (ΔH°) tend to decrease. The magnitude of the changes in the thermal parameters is similar with both techniques. Since the DSC measurement also reports the change in the heat capacity (ΔCp), determined to be 1.44 kcal/molK−1 at pH 8, we estimated the free energy of unfolding at neutral pH to be about −8.2 kcal/mol using the Gibbs-Helmholtz equation. For the W+-state, the measurement is more challenging since the T-domain is prone to aggregate under acidic conditions (Palchevskyy et al., 2006; Rodnin et al., 2008). Consequently, we estimated the free energy of unfolding at pH 6 using previously published CD results (Vargas-Uribe et al., 2013a), assuming that ΔCp does not change in this pH range. The free energy of unfolding at pH 6, calculated under these assumptions is −5.3 kcal/mol, suggesting that the ΔG for the transition W-to-W+ (Step 1 in scheme of Fig. 1) is at least −2.9 kcal/mol Because the thermally unfolded state is prone to aggregation, we could not examine the stability of the T-domain at pH<6 by thermal denaturation. In contrast, chemical denaturation with urea of guanidinium is usually less sensitive to this problem.
Fig. 3.
Thermal unfolding of the T-domain in solution at pH 8 measured by DSC (top panel) and CD (bottom panel). The enthalpy change ΔH°, melting temperature Tm, and change in the calorific capacity ΔCp (for DSC) were estimated by fitting the raw data (blue) to a two state transition model (black) according the procedure previously described (Lopez & Makhatadze, 2002; Rodnin et al., 2008).
Table 1.
Thermodynamic parameters for the thermal unfolding of the T-domain determined by DSC and CD. The ΔG° values were calculated following the Gibbs–Helmholtz equation and assuming the ΔCp value of 1.44kcal/molK-1 obtained in the DSC experiment.
| Differential scanning calorimetry | Circular dichroism | |||||
|---|---|---|---|---|---|---|
| pH | Tm, °C | ΔH°, kcal/mol | ΔG°, kcal/mol | Tm, °C | ΔH°, kcal/mol |
ΔG°, kcal/mol |
| 8* | 74 ± 1 | 94 ± 1 | 8.0 ± 0.2 | 75 ± 1 | 95 ± 7 | 8.2 ± 0.6 |
| 6.5 | 69 ± 1 | 86 ± 1 | 6.8 ± 0.2 | 74 ± 1 | 84 ± 6 | 6.6 ± 0.5 |
| 6* | n.d. | n.d. | n.d. | 58 ± 1 | 78 ± 6 | 5.3 ± 0.4 |
The parameters at pH 8 and pH 6 from the CD measurements were previously published (Vargas-Uribe et al., 2013a).
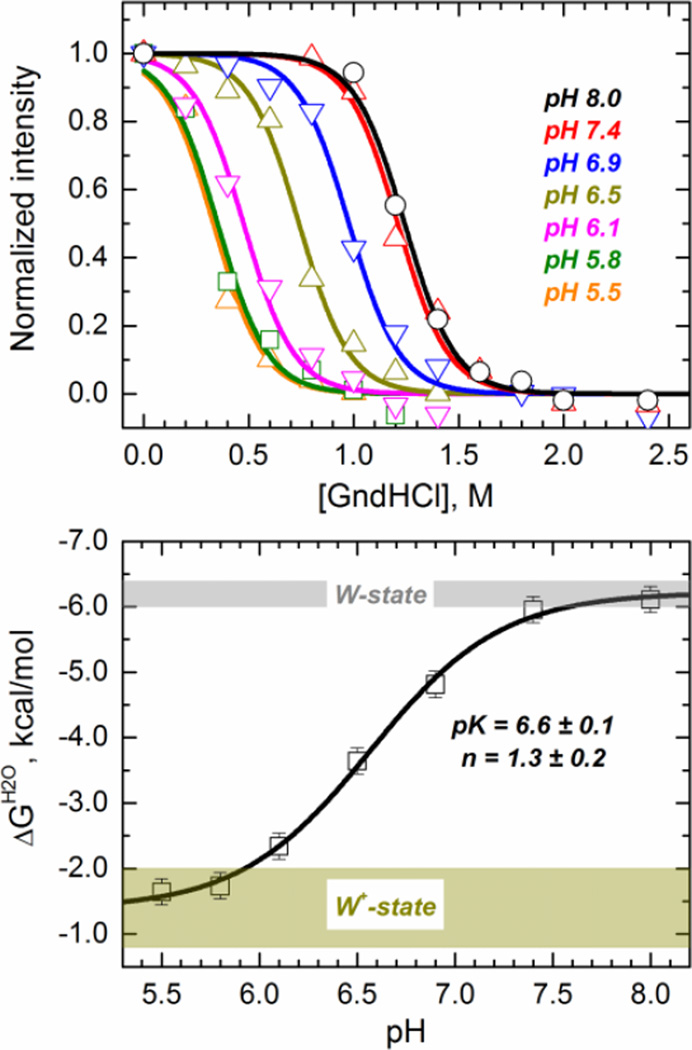
In order to cover sufficiently wide range of pH, required to characterize the entire W-to-W+ transition, we performed a series of chemical unfolding experiments with guanidinium hydrochloride using intensity of tryptophan fluorescence from W206 and W281 as a spectroscopic signal for unfolding. While the nature of chemically and thermally unfolded states might differ from each other, the relative changes in stability of W and W+ states are expected to be the same (i.e., thermodynamic cycle in Fig. 2 still applies). The normalized changes in intensity of intrinsic fluorescence measured as a function of guanidinium concentration at different pH are shown in the top panel of Fig. 4. The data clearly show a shift in the midpoint of the unfolding isotherms as a function of the pH, indicating loss of stability. We calculated the free energy of unfolding in the absence of denaturant (ΔGH2O) by fitting the data to a two-state model of chemical unfolding (Eq. 3), and plotted it as a function of the pH in Fig. 4 (Bottom panel). We have fitted the ΔG vs pH data with Eq. 4 to recover the following parameters: ΔGW+ = 1.4 ± 0.3 kcal/mol, ΔGW = 6.2 ± 0.1 kcal/mol, pK = 6.6 ± 0.1, n = 1.3 ± 0.2. This indicates that the free energy difference between membrane competent and incompetent states ΔGW-to-W+ equals −4.8 ± 0.4 kcal/mol. The pK value calculated from the unfolding experiment is consistent with those reported before using independent FCS and FRET membrane binding measurements (Kurnikov et al., 2013; Kyrychenko et al., 2009).
Fig. 4.
Chemical denaturation of the diphtheria toxin T-domain showing a loss of thermodynamic stability upon acidification. (Top panel) Chemical unfolding monitored by tryptophan fluorescence in the presence of various concentrations of guanidinium hydrochloride (GndHCl) at the indicated pH. Data was fitted to a two-state chemical unfolding model to obtain the ΔG of unfolding in the absence of denaturant (ΔGH2O) under the different pH conditions (Eq. 3). (Bottom panel) ΔGH2O of unfolding of the T-domain as a function of the pH (symbols). The line represent the fit with Eq. 4. The shadowed areas represent the limiting ΔGH2O values (±2 standard deviations) for the W-state (gray) and W+-state (dark yellow).
2. Binding and insertion into the membrane (Steps 2 and 3)
The next step in the membrane insertion pathway of the T-domain is the partitioning to the membrane interface, which is followed by its transmembrane insertion into the lipid bilayer (Steps 2 and 3 of Fig. 1) (Ladokhin, 2013). To thermodynamically characterize these steps, we used FCS measurements that allow us to differentiate between a dye-labeled T-domain free in solution and that associated with large unilamellar vesicles (LUV), based on the difference in their diffusion time. Quantitative analysis of the autocorrelation function (Eqs. 5–8) provides an accurate measure of the fraction of T-domain bound to vesicles, fB. (Note, that FCS measurements themselves do not distinguish between interfacial and inserted states, which is done using independent topology measurements as described in (Kyrychenko et al., 2009)). For pH-triggered membrane protein insertion, two thermodynamic transitions should be considered (Eqs. 9–10) (Ladokhin, 2009): (a) pH-dependent formation of the membrane-competent state (FMC) and (b) its association with the membrane. While both of these processes can be studied by FCS, they require different experimental schemes: (a) pH titration in the presence of large saturating concentration of LUV, and (b) lipid titration at constant pH.
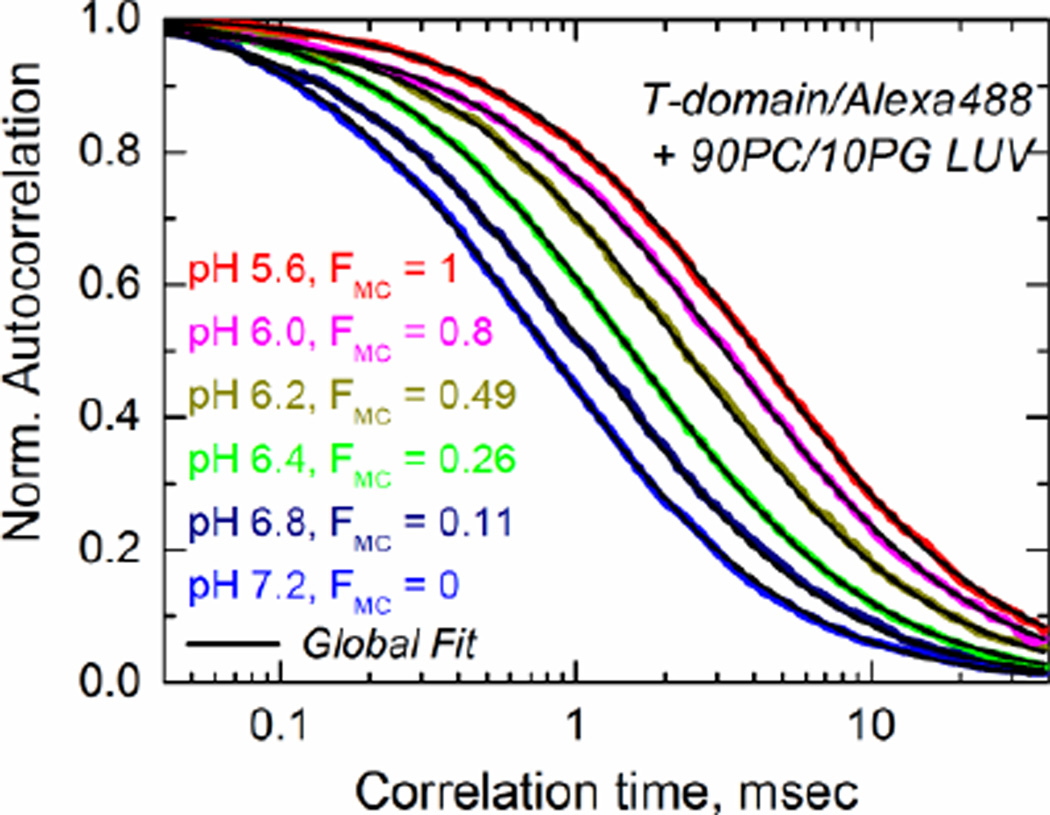
In the first type of FCS measurement, we followed the association of the T-domain under lipid-saturating conditions to determine the pH-dependent formation of the membrane competent form, FMC. According to Eq. 9, fB is equal to FMC at high lipid concentrations (1–4 mM, depending on the value of partitioning coefficient Kx). An infinite large concentration of lipid vesicles over that of the T-domain ensures that the equilibrium is shifted towards the membrane-bound form (Ladokhin, 2009). In other words, the fraction of T-domain bound to the vesicles will be equal to the fraction of membrane competent form because the excess of membrane ensure that the protein reaching the membrane competent form will partition in a monomeric form into the bilayer. In the example shown in Fig. 5, the acidification of the solution results in a progressive shift of mobility from that of free T-domain to that of vesicle-bound T-domain (correlation times are much higher for the vesicle-bound species of the T-domain). The quantitative information of the fraction bound to membranes was extracted by performing a linked analysis (black lines) of the fluorescence autocorrelation curves (color-coded lines) that links the correlation times for all curves and allows free fitting of the pre-exponential amplitudes in Eq. 6 (Posokhov et al., 2008b). These results confirm that the formation of the membrane-competent state occurs in pH range of 6.8-6.0 (Kurnikov et al., 2013; Kyrychenko et al., 2009).
Fig. 5.
Example of pH-dependent binding measurement using FCS performed under conditions of the lipid saturation (4 mM lipid) over fluorescently labeled T-domain (nanomolar concentrations). Acidification results in a progressive shift of mobility from that of free T-domain to that of vesicle-bound domain. Quantitative determination of membrane competent fraction, FMC, is achieved by the linked analysis (black lines) of fluorescence autocorrelation curves (color-coded lines) that links the correlation times for all curves and allows free fitting of the pre-exponential amplitudes in Eq. 6 (Posokhov et al., 2008b). For the purpose of better visual representation all data are normalized to the same number of fluorescent particles in the focal volume (Note that the absolute values of amplitudes are not important under these conditions, but only their relative contributions).
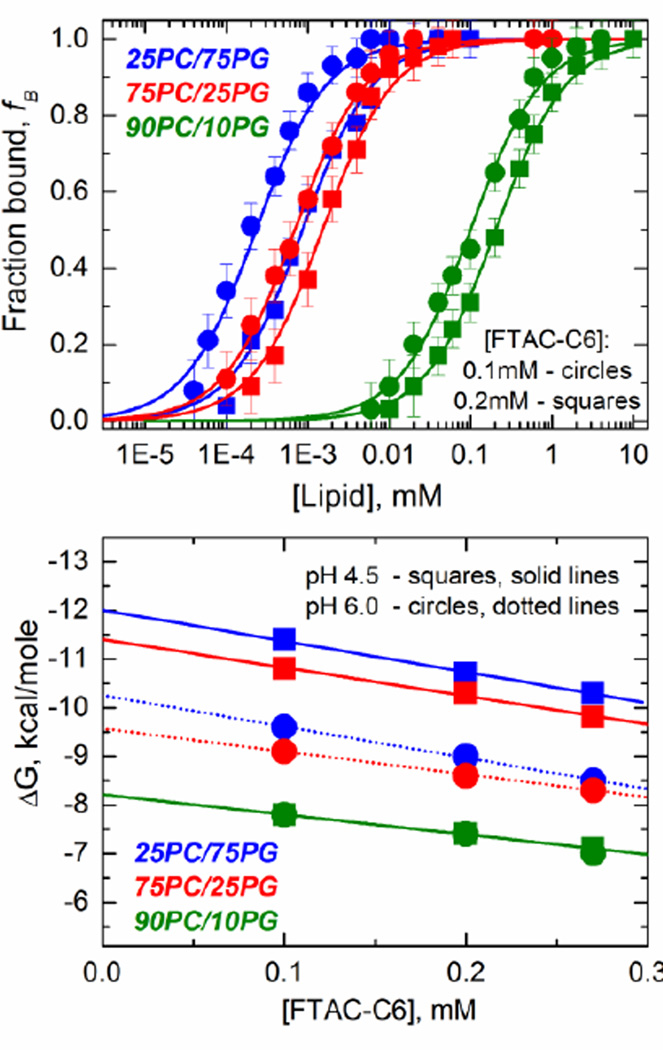
In the second type of FCS measurement, we the used the lipid titration method to estimate the partitioning coefficient, Kx, associated with the binding of the T-domain to the membrane, and consequently the free energy ΔG of the process (Ladokhin, 2009; Ladokhin, Jayasinghe & White, 2000; White et al., 1998). Because this type of experiment requires a fraction of membrane-competent form to be free in solution, it necessitates application of FTAC-C6 fluorinated surfactants, which prevents aggregation of the W+-state of the T-domain in acidic solution (Palchevskyy et al., 2006; Posokhov et al., 2008a; Rodnin et al., 2008). In Fig. 6 (top panel), we display examples of the lipid titration experiments in the presence of two different concentrations of FTAC-C6 and using LUV of different lipid composition. The results show a shift in the partitioning curve (Kx varies) that depends on both the lipid composition and the presence of FTAC-C6. The effect of the surfactant and lipid composition will be discussed separately, as they have a different origin.
Fig. 6.
Determination of the free energy of bilayer insertion chaperoned by FTAC-C6. A combination of FCS methodology and chaperoned membrane insertion protocol utilizing the fluorinated surfactant FTAC-C6 (described in (Posokhov et al., 2008a)). (Top Panel) Lipid titration isotherms for diphtheria toxin T-domain WT in the presence of different concentrations of the fluorinated surfactant FTAC-C6 at pH 4.5. (Bottom panel) Thermodynamic analysis of the bilayer insertion chaperoned by FTAC-C6. Addition of the surfactant results in gradual linear decrease in ΔG. A true value of ΔG of insertion is estimated from the linear extrapolation of the data to zero concentration of the surfactant. The lipid compositions are color coded, and concentration of FTAC-C6 and pH values are coded by symbol shape.
The presence of FTAC-C6 is expected to result in a shift in the partitioning equilibrium because the T-domain not only partitions into the LUV when the solution is acidified, but also into the surfactant. The Kx and therefore ΔG values obtained in the presence of FTAC-C6 are, therefore, only apparent. To correct for the presence of the surfactant, we performed the assays in the presence of several concentrations of FTAC-C6 and the resulting ΔG values were plotted as a function of the surfactant concentration (Fig. 6, bottom panel). The data showed a remarkable linear correlation, where the extrapolation to the zero value for the concentration of FTAC-C6 corresponds to the corrected value for the free energy of partitioning of the W+-state to the LUV.
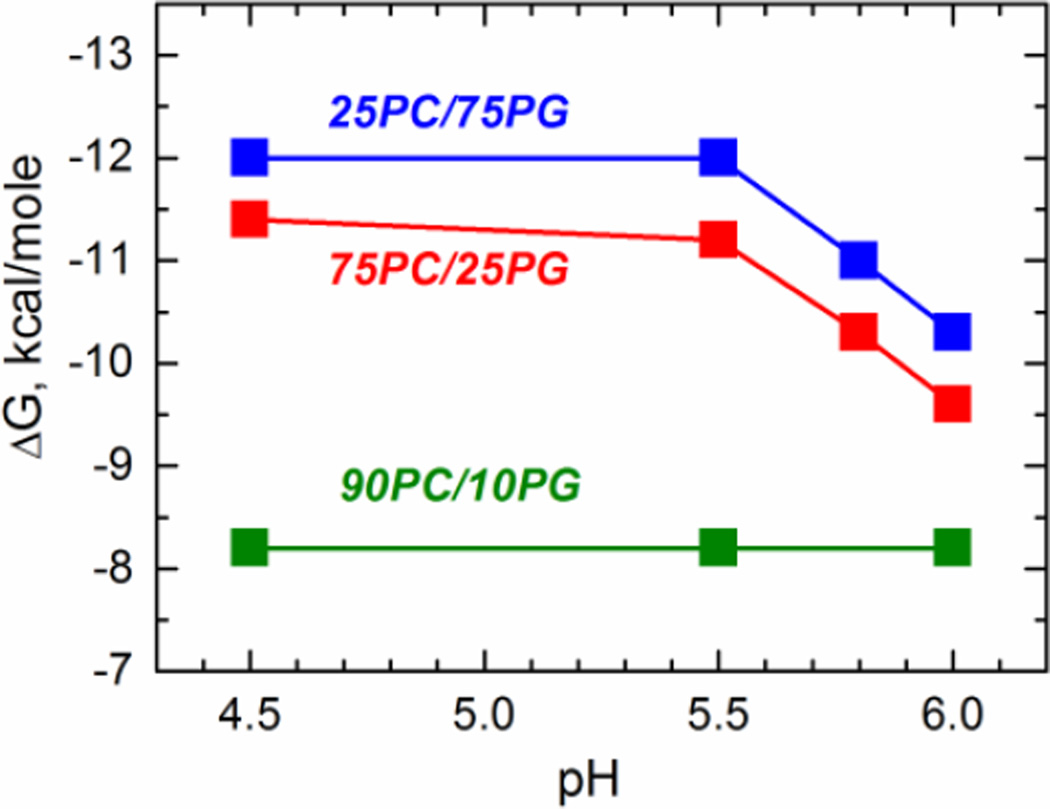
The lipid composition stabilizes different conformations of the T-domain in the membrane, where the proportion of POPG will determine whether or not the T-domain reaches the T-state (Kyrychenko et al., 2009). For instance, when the assay is done in the presence of LUV containing a low proportion of anionic lipids (green curves), the interfacial I-state is stabilized and therefore the apparent free energy would reflect the binding to the membrane. On the other hand, the transmembrane T-state would be stabilized in the presence of higher proportions of anionic lipids (red and blue curves), and the apparent free energy would reflect a process that includes not only the partitioning to the membrane but also the insertion into the bilayer. The results presented in the Fig. 7 reveal that the free energy of binding of the T-domain to the membrane interface (green curve, Step 2 in scheme of Fig. 1) is approximately −8 kcal/mol, and is independent of the pH. The free energy for partitioning changes when the transmembrane insertion step is taken into account (blue and red curves), and it ranges from −9.5 to −12 kcal/mol depending on the membrane composition and the pH. Thus, these results suggest that the binding step contributes with the majority of the free energy of partitioning of the T-domain into the membrane, while the insertion step (Step 3 in scheme of Fig. 1) adds additional −1.5 to −4 kcal/mol.
Fig. 7.
pH-dependence of the free energy of interfacial membrane binding (90PC/10PG, olive) and transmembrane insertion (75PC/25PG, red; 25PC/75PG, blue) for the diphtheria toxin T-domain WT. The free energy of binding to lipid vesicles with formation of trapped interfacial intermediate state is close to −8 kcal/mole, and is pH-independent. The free energy difference between the transmembrane T-state and the interfacial I-state ranges from −1.5 to −4 kcal/mol depending on membrane composition and the pH.
3. Insertion of individual helices
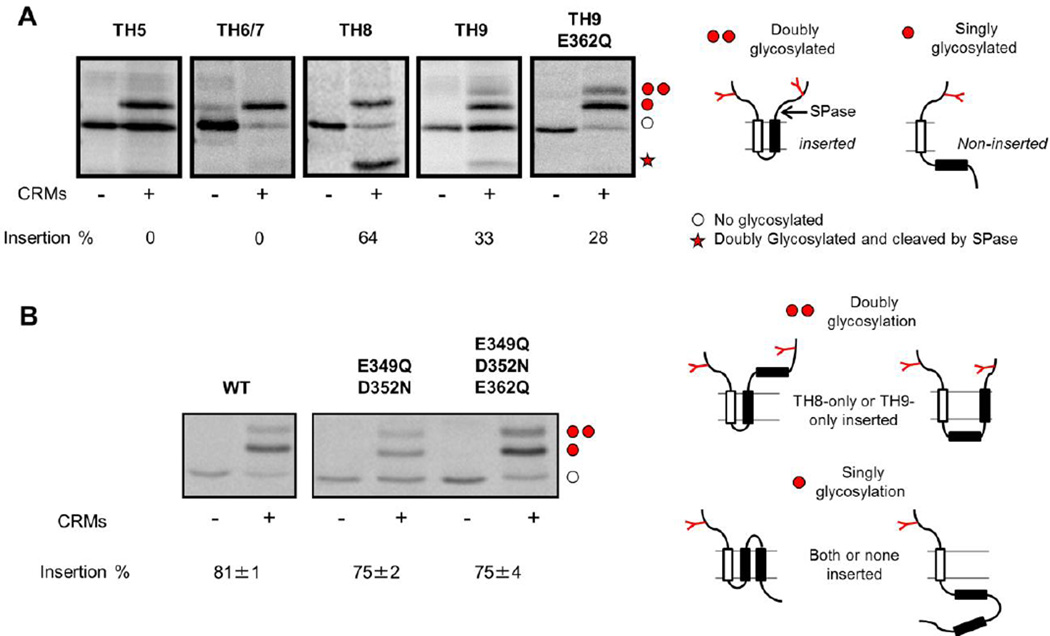
We finally determined the free energy of insertion of the individual helices of the T-domain. To do so, we applied an in vitro assay previously designed to establish a biological hydrophobicity scale for membrane insertion of helices (Hessa et al., 2005; Hessa et al., 2007; Lundin et al., 2008). The principle of the assay is that an individual helix of the T-domain is cloned into the LepH2 reporter protein, with glycosylation sites flanking the T-domain helix (See schemes on the right of Fig. 8). Thus, the glycosylation pattern will reveal whether or not a given T-domain helix adopts a transmembrane topology, and can be visualized and quantified by changes in the electrophoretic mobility and intensity. The results shown in Fig. 8A reveal that the TH5 and TH6 constructs yield only full-length, singly glycosylated product (in addition to non-glycosylated protein that has not been targeted to the microsomes). In contrast, the TH8 construct yields a cleaved form (marked by a red star) representing molecules where TH8 has been inserted into the membrane and cleaved by signal peptidase. Likewise, the TH9 construct yields a cleaved form, plus some doubly glycosylated full-length product. Summing the cleaved and doubly glycosylated full-length products shows that only TH8 inserts favorably into the bilayer (fraction inserted = 0.64), while helices TH5 and TH6/7 shows no insertion and helix TH9 inserts marginally (fraction inserted = 0.33). Interestingly, the mutation E362Q in helix TH9 does not increase the membrane inserted fraction of TH9, suggesting that the protonation of residue E369 during the acidification (the mutation test the potential effect of this protonation in the insertion process) is not directly involved in the transmembrane insertion of the TH9.
Fig. 8.
Integration of individual helices of the T-domain in microsomal membranes. Individual helices of the T-domain were cloned into the LepH2-reporter developed to study the energetics of membrane insertion of transmembrane helices using rough microsomes (CMRs) (Lundin et al., 2008). The translation products were visualized and quantified through electrophoresis. (A) Membrane insertion of individual helices of the T-domain and the mutant helix TH9 E362Q. The single (one red dot) and double glycosylation (two red dots) were considered as non-insertion and insertion of the corresponding helix, respectively, while the red star denotes a product cleaved by signal peptidase (also considered as inserted, see scheme on the right). B) Membrane insertion of TH8-TH9 as a helical hairpin for WT and mutants constructs. The single (one red dot) and double glycosylation (two red dots) were considered as both/none inserted and as TH8-only/TH9-only inserted, respectively (see scheme on the right). The results reveal that only the helix TH8 has favorable insertion into the membrane (inserted fraction > 0.5). The insertion of helix TH9 is thermodynamically unfavorable, but becomes favorable in the presence of an inserted helix TH8 (see Table 1). None of the replacements, either as single helices or as helical hairpin, seem to affect the thermodynamics of membrane insertion of TH8-TH9. *The non-glycosylated products (empty dots) were excluded from the analysis.
Then, we modified the assay to test whether TH9 inserts more efficiently as part of a hairpin with TH8. The results shown in Fig. 8B show that the insertion fraction increases to 0.81, which is higher than both helix TH8 alone and TH9 alone, suggesting a cooperative effect between helices in the insertion process. The replacement of the acidic residues located in the tip of the hairpin does not affect the energetics of transmembrane insertion of the hairpin. To isolate the effect of TH8 in the insertion of TH9, we applied the analysis detailed in the supplementary material. The results are presented in the Table 2 along with predicted ΔG values using the biological hydrophobicity scale (Hessa et al., 2007). It is clear that the ΔG for the insertion of helix TH9 is affected by the co-insertion of helix TH8, as it changes from being thermodynamically unfavorable (+0.43 kcal/mol when TH8 is not inserted) to favorable (−1.26 kcal/mol when TH8 is already inserted). These findings indicate that the insertion of the helices of the T-domain is cooperative, where changes in the conformation of one helix result in modulation of the insertion of another.
Table 2.
Free energy of transmembrane insertion of isolated helices of the T-domain. The prediction of the insertion was made using the ΔG prediction server v1.0 (http://dgpred.cbr.su.se/index.php?p=home) (Hessa et al., 2007). The fraction inserted in the in vitro assay was used to compute the experimental free energy of insertion. For the case of TH9, the ΔG of membrane insertion when TH8 is already inserted was calculated based on the analysis described in the supplementary material (TH9 percentage of insertion 89%).
| Helix | Predicted ΔG, kcal/mol |
Measured ΔG, kcal/mol |
|---|---|---|
| TH5 | + 5.35 | − |
| TH6/7 | + 3.76 | − |
| TH8 | + 2.75 | − 0.35 |
| TH8/TH9 hairpin | − | − 0.87 |
| TH9 | + 5.02 | + 0.43 |
| TH9 (TH8 inserted) |
− | − 1.26 |
DISCUSSION
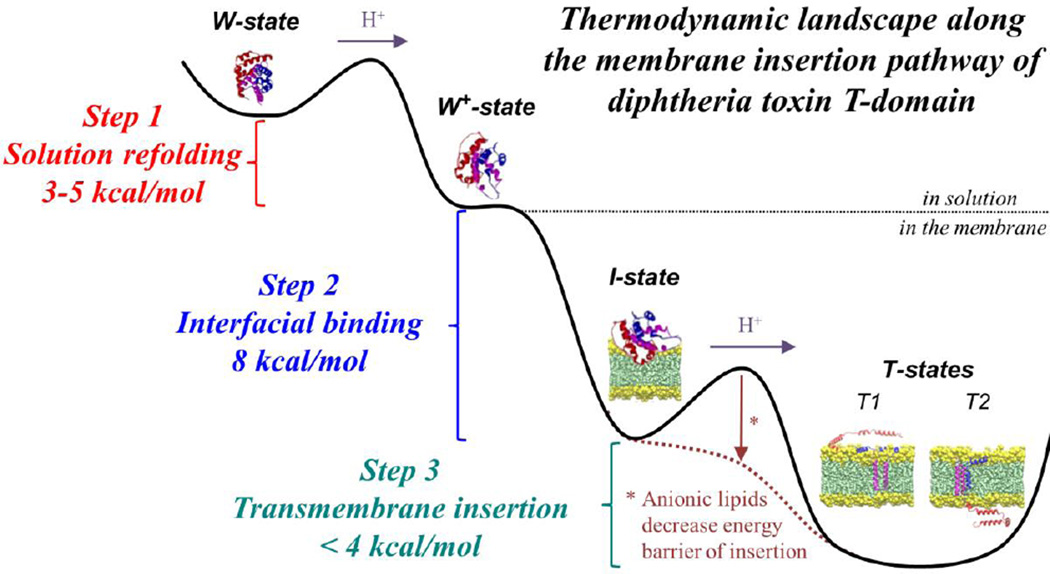
We summarize our results on membrane interactions of the diphtheria toxin T-domain in Fig. 9, which combines the findings of this study with those published previously (Kurnikov et al., 2013; Kyrychenko et al., 2009; Posokhov et al., 2008a; Rodnin et al., 2010; Rodnin et al., 2011; Vargas-Uribe et al., 2013a). The multi-step insertion process starts with a conformational change in solution, in which the water-soluble W-state is converted into the membrane-competent W+-state as a result of protonation of key histidine residues (Kurnikov et al., 2013; Rodnin et al., 2010). According to our measurements of thermal and chemical denaturation, this step has a change in free energy of about −3 to −5 kcal/mol (Fig. 3, Fig. 4 and Table 1). Upon addition of membranes, the T-domain cascades into multiple conformations in the bilayer, including the interfacial I-state and a number of transmembrane T-states. The interfacial I-state, however, can be trapped by manipulating the pH and the lipid composition (Kyrychenko et al., 2009). This allows one to discriminate between the free energy of binding to the membrane interface (ΔGW+-to-I, step 2) from that of the insertion into the bilayer (ΔGW+-to-T, step 2 + step 3) by adjusting the experimental conditions (e.g., changing lipid composition, which affects the kinetic barrier of insertion). According to our FCS results, the free energy of binding is about −8 kcal/mol (Fig. 7, green data), while that of insertion ranges from −9.5 to −12 kcal/mol (Fig. 7, red and blue data). Thus, we estimated the free energy of the transbilayer insertion from the interface (ΔGI-to-T, step 3) to range from −1.5 to −4 kcal/mol, depending on the pH. The presence of multiple T-states may explain this variation of the free energy of transbilayer insertion, however, it is a challenge to determine experimentally the free energy value for the transitions between various T-states.
Fig. 9.
Free energy change along the pH-triggered membrane insertion pathway of the T-domain. Step 1 (red) indicates the conformational change in solution, resulting from the conversion of the water-soluble state (W-state) into the membrane competent state (W+-state). Step 2 (blue) corresponds to the binding of the T-domain to the membrane interface. Step 3 (cyan) represents the formation of a family of transmembrane structures (T-states), in which TH8 and TH9 adopt a transmembrane topology. The kinetic barrier for insertion is affected by the presence of negatively charged lipids in such a way that interfacial state can be trapped in the membranes with low content of anionic lipid (10% POPG). Transmembrane insertion is much faster in membranes containing 75% POPG than in those containing 25% POPG (Kyrychenko et al., 2009), yet the free energy of insertion differs very little for these two lipid compositions (Fig. 7).
According to numerous published results (Ladokhin, 2013; Rodnin et al., 2011; Senzel et al., 2000; Vargas-Uribe et al., 2013a), the transbilayer insertion of TH8-TH9 (T1-state in Fig. 9) is followed by the refolding and the possible insertion of helix 5 to form the so-called open-channel state (T2-state in Fig. 9). To estimate the exact contribution of each helix of the T-domain into the ΔGI-to-T, we independently measured the free energy of insertion of individual helices using an in vitro assay, as illustrated in Fig. 8. Different helices of the T-domain were cloned into the LepH2 reporter, translated using rough microsomes, and the fraction inserted was detected using its glycosylation profile (see Fig. 8 for more details). Surprisingly, only the most hydrophobic helix, TH8, inserted favorable into the membrane (Table 2), with a free energy value much lower than the one obtained for the entire protein using the FCS experiments. The free energy of insertion of the helical hairpin TH8-TH9 was slightly more favorable than that of the individual helices, suggesting that the co-insertion of one helix helps stabilizing the insertion of another helix. Indeed, the free energy of insertion of TH9 changes from unfavorable to favorable by the co-insertion of TH8 (Table 2). We suggest that the transmembrane insertion is cooperative, and therefore, the refolding and insertion of other helices (such as TH5 to form the open-channel state) further stabilize a transmembrane conformation of the T-domain.
MATERIALS AND METHODS
Materials
Palmitoyl-oleoyl-phosphatidylcholine (POPC) and palmitoyl-oleoyl-phosphatidylglycerol (POPG) were purchased from Avanti Polar Lipids (Alabaster, AL). AlexaFluor488-maleimide was obtained from Invitrogen (Carlsbad, CA). Diphtheria toxin T-domain (amino acids 202–378) was cloned into NdeI-EcoRI-treated pET15b vector containing an N-terminal 6xHis-tag (Rodnin et al., 2008).
Cloning of the T-domain individual helices and TH8–9 hairpin
T-domain individual helices TH5 (residues 271–289), TH6/7 (residues 302–320), and TH8 and TH9 (residues 328–378, individually and as a hairpin), were cloned into the LepH2-reporter replacing H2 of Lep (Lundin et al., 2008). Cloning of individual helices (WT and mutants) was performed by ligation of the mixture of complementary oligonucleotides with the sequences corresponding to T-domain segments, designed to form sticky ends for SpeI and KpnI upon complementation, into SpeI/KpnI predigested pGEM1-LepH2 plasmid overnight at 4°C. The TH8-TH9 hairpin was PCR-amplified from the T-domain template using primers containing SpeI and KpnI sites, digested with the corresponding restriction enzymes and ligated into the vector by replacing H2 of Lep as described above. GGPG sequences were inserted flanking the T-domain segments in all constructs. The plasmid DNAs from resulting clones were sequenced using the SP6 promoter primer.
Expression, purification and labeling
The expression, purification and labeling of the T-domain was performed using the previously described procedure (Kyrychenko et al., 2009; Rodnin et al., 2011; Rodnin et al., 2008; Vargas-Uribe, Rodnin & Ladokhin, 2013b; Zhan et al., 1995). The proteins were kept in 50mM phosphate buffer at pH 8, unless indicated. Labeling with Alexa488 was performed using a standard procedure for thiol-reactive derivatives (Haugland, 1996; Kyrychenko et al., 2009; Vargas-Uribe et al., 2013b).
LUV preparation
Large unilamellar vesicles (LUV) containing molar mixtures POPG:POPC (3:1, 1:3 and 1:9) of 0.1 µm diameter were prepared by extrusion as previously described (Hope et al., 1986; Mayer, Hope & Cullis, 1986).
Thermal unfolding experiments
CD thermal unfolding measurements were performed using an upgraded Jasco-720 spectropolarimeter (Japan Spectroscopic Company, Tokyo). The unfolding signal was followed at 222 nm with a scan rate of 1°C per minute. The data was fitted to a two-state transition as previously described (Rodnin et al., 2011; Rodnin et al., 2008) to obtain the transition temperature Tm and the transition enthalpy ΔH° with the equations (Eftink, 1994):
| (Eq. 1) |
| (Eq. 2) |
where Y is the experimentally observed CD signal at a given temperature, YN and YU represent the signals of the pure native and unfolded state at 0K, and mN and mU are the temperature-dependencies of these CD signals for the native and unfolded states, respectively, and XN is the fraction of the native state at temperature T.
The DSC experiments were performed using a MicroCal VP-DSC instrument (GE HealthCare, USA). The thermogram was recorded with a scan rate of 90°C/h in a temperature range of 10°C–110°C. The experiments were performed in a buffer containing 50 mM Na phosphate buffer, pH 8.0. Prior to the measurements the proteins were dialyzed overnight against the buffer described above at 4°C. Protein concentration was determined spectrophotometrically using an extinction coefficient of 17,000 M−1cm−1 at 280 nm. The protein concentration was 0.5–0.6 mg/ml. The specific volume of the protein was calculated to be 0.746 cm3/g (Makhatadze, Medvedkin & Privalov, 1990). Reversibility of unfolding under these conditions was confirmed by comparing heat capacity profiles of first and second scans. The analysis of DSC profiles according to a two-state model was done using in-house written scripts as described previously (Lopez & Makhatadze, 2002).
Chemical unfolding experiments
The guanidinium hydrochloride-induced unfolding reaction of the T-domain was monitored measuring tryptophan fluorescence with a SPEX Fluorolog FL3–22 steady-state fluorescence spectrometer (Jobin Yvon, Edison, NJ) equipped with double-grating excitation and emission monochromators. The measurements were made in a 2×10 mm cuvette oriented perpendicular to the excitation beam and maintained at 25°C using a Peltier device from Quantum Northwest (Spokane, WA). The excitation wavelength was 292 nm and emission was recorded from 300 to 550 nm with slits of 3 nm for both monochromators. Normally, 1µM of T-domain was mixed with the corresponding amount of GndHCl and the target pH was reached by adding a small amount of acetic acid. Samples were incubated for 30 min before the fluorescence measurement to ensure equilibration. The fluorescence spectra were corrected with blank solutions containing GndHCl. For the analysis, the data was fitted to a one-step unfolding mechanism with GndHCl using the following equation (Walters, Milam & Clark, 2009):
| (Eq. 3) |
where Sobs, Sn and Su represent the normalized values of the observed total fluorescence intensity, the intensity of the native-state and the intensity of the unfolded state, respectively; ΔGH2O represents the free energy of unfolding in the absence of denaturant; m is the dependence of the free energy of unfolding in the presence of denaturant on the concentration of guanidinium chloride; [GndHCl] is the concentration of guanidinium hydrochloride; R is the gas constant and T is absolute temperature.
For the fitting of the ΔGH2O vs pH values, we used the the following equation:
| (Eq. 4) |
where ΔGN and ΔGL are the free energy values at neutral and low pH, respectively; pKa is an apparent constant and n is a cooperativity coefficient.
FCS measurements
FCS measurements and analysis were performed as previously described (Kyrychenko et al., 2009; Posokhov et al., 2008b). The samples contained 1nM of T-domain and 1–2mM of LUV. The measurements were conducted on a MicroTime 200 confocal microscope (PicoQuant, Berlin, Germany), where the sample was excited with a pulsed picosecond diode laser, LDH-P-C-470, operated at 40 MHz. Fluorescence was detected confocally after passing through an emission bandpass filter (AHF/Chroma: HQ 520/40) to block the excitation wavelength. To suppress influences from the afterpulsing typically observed with single photon avalanche diodes (SPAD), the fluorescence light was split with a 50/50 beam splitter cube onto two SPADs (SPCM-AQR-14; Perkin-Elmer Inc.), and cross-correlation analysis was applied. The high numerical aperture apochromatic water immersion objective (60, NA 1.2; Olympus), together with the 50 µm confocal pinhole, resulted in a confocal detection volume of 1 fL. The fluorescence was detected applying time-correlated single photon counting (TCSPC) with the TimeHarp 200 board. The data were stored in the time-tagged time-resolved mode (TTTR), which allowed the recording of every detected photon with its individual timing and detection channel information.
FCS data analysis
The autocorrelation function for single diffusing species undergoing Brownian motion can be described with the following equation.
| (Eq. 5) |
where N is the average number of the fluorescent molecules in the focus volume and τD is the correlation time of the particles. The correlation time represents the diffusion time through the focus volume and equals τD = ω2/4D, where ω2 is the square of the radius of the laser focus and D is the diffusion constant. S is the ratio of the distances from the center of the laser beam focus in the radial and axial directions, respectively. T is the fraction of fluorophores in the triplet state and τTr is the triplet lifetime (∼2 µs in our case). Thermodynamic studies of membrane binding using FCS were performed as described previously (Ladokhin, 2009; Posokhov et al., 2008a; Posokhov et al., 2008b).
For the analysis of experimentally measured autocorrelation data in Fig. 5 only two diffusing species need to be considered: the fluorescently labeled protein or peptide (index P) and bilayer vesicles with bound fluorescently labeled proteins or peptides (index V):
| (Eq. 6) |
Because the quantum yield of Alexa dyes is not environment-sensitive and does not change upon peptide association with the membrane the amplitudes in Eq. 6 will now depend only on the numbers of fast and slow moving particles in the focal volume (NP and NV, respectively):
| (Eq. 7) |
Under conditions of infinite dilution regime the fraction of bound protein is equal (Clamme, Azoulay & Mely, 2003; Posokhov et al., 2008b)
| (Eq. 8) |
The resulting titration isotherm is fitted to a mole-fraction partitioning equation (Ladokhin, 2009; Ladokhin et al., 2000; White et al., 1998)
| (Eq. 9) |
| (Eq. 10) |
where, [L] is lipid concentration, [W] is water concentration (55.3 M), and Kx is mole-fraction partitioning coefficient which is used to determine the free energy of binding AG.
In vitro translation with rough microsomes
The pGEM1-Lep vectors containing the TH fragments were transcribed and translated in the TNT SP6 Quick Coupled System (Promega) using 10 µl of reticulocyte lysate, 150–200 ng DNA template, 1 µl of 35S-Met (5 µCi) and 0.5 µl column-washed dog pancreas rough microsomes (ER vesicles, CRMs). tRNA probes (Walter & Blobel, 1982) and the samples were incubated for 90 minutes at 30°C. The proteins were analyzed by SDS-PAGE and visualized in a Fuji FLA 3000 phosphorimager (Fujifilm). The MultiGauge (Fujifilm) software was used to generate a profile of each gel lane and the multi-Gaussian fit program (Qtiplot, www.qtiplot.ro) was used to calculate the peak areas of the glycosylated protein bands. The membrane integration efficiency of a given TH fragment was determined by normalizing the peak area of the doubly glycosylated band to the total area of both singly and doubly glycosylated protein bands. The glycosylation levels vary by no more than ±5% between repeated experiments.
Supplementary Material
ACKNOWLEDGMENTS
We are grateful to Dr. Chiranjib Ghatak for his helpful feedback on the design of thermodynamic schemes. This research was supported by NIH grant GM-069783 (A.S.L.). M.V.U. was partially supported by Fulbright-CONICYT, Chile.
ABBREVIATIONS
- T-domain
Diphtheria Toxin T-domain
- W-state
Membrane-incompetent state populated at neutral pH
- W+-state
Membrane-competent (protonated) state populated at acidic pH
- I-state
Interfacial state
- T-state(s)
Transmembrane state(s)
- LUV
Large unilamellar vesicles
- POPC
Palmitoyl-oleoyl-phosphatidylcholine
- POPG
Palmitoyl-oleoyl-phosphatidylglycerol
- FCS
Fluorescence Correlation Spectroscopy
- CD
Circular Dichroism
- DSC
Differential Scanning Calorimetry
- ΔH°
Enthalpy change
- ΔG
Gibbs free energy
- Tm
Melting temperature
- ΔCp
Change in calorific capacity
- Kx
Partitioning coefficient
REFERENCES
- Bennett MJ, Eisenberg D. Refined structure of monomeric diphtheria toxin at 2.3 Å resolution. Protein Sci. 1994;3:1464–1475. doi: 10.1002/pro.5560030912. [DOI] [PMC free article] [PubMed] [Google Scholar]
- Clamme JP, Azoulay J, Mely Y. Monitoring of the formation and dissociation of polyethylenimine/DNA complexes by two photon fluorescence correlation spectroscopy. Biophys J. 2003;84:1960–1968. doi: 10.1016/S0006-3495(03)75004-8. [DOI] [PMC free article] [PubMed] [Google Scholar]
- Eftink MR. The use of fluorescence methods to monitor unfolding transitions in proteins. Biophys.J. 1994;66:482–501. doi: 10.1016/s0006-3495(94)80799-4. [DOI] [PMC free article] [PubMed] [Google Scholar]
- Haugland RP. Handbook of Fluorescent Probes and Research Chemicals. Eugene, OR: Molecular Probes, Inc; 1996. [Google Scholar]
- Hayashibara M, London E. Topography of diphtheria toxin A chain inserted into lipid vesicles. Biochemistry. 2005;44:2183–2196. doi: 10.1021/bi0482093. [DOI] [PubMed] [Google Scholar]
- Hessa T, Kim H, Bihlmaler K, Lundin C, Boekel J, Andersson H, Nilsson I, White SH, von Heijne G. Recognition of transmembrane helices by the endoplasmic reticulum translocon. Nature. 2005;433:377–381. doi: 10.1038/nature03216. [DOI] [PubMed] [Google Scholar]
- Hessa T, Meindl-Beinker NM, Bernsel A, Kim H, Sato Y, Lerch-Bader M, Nilsson I, White SH, von Heijne G. Molecular code for transmembrane-helix recognition by the Sec61 translocon. Nature. 2007;450:1026–1030. doi: 10.1038/nature06387. [DOI] [PubMed] [Google Scholar]
- Hope MJ, Bally MB, Mayer LD, Janoff AS, Cullis PR. Generation of multilamellar and unilamellar phospholipid vesicles. Chem.Phys.Lipids. 1986;40:89–107. [Google Scholar]
- Kurnikov IV, Kyrychenko A, Flores-Canales JC, Rodnin MV, Simakov N, Vargas-Uribe M, Posokhov YO, Kurnikova M, Ladokhin AS. pH-Triggered Conformational Switching of the Diphtheria Toxin T-Domain: The Roles of N-Terminal Histidines. J Mol Biol. 2013;425:2752–2764. doi: 10.1016/j.jmb.2013.04.030. [DOI] [PMC free article] [PubMed] [Google Scholar]
- Kyrychenko A, Posokhov YO, Rodnin MV, Ladokhin AS. Kinetic intermediate reveals staggered pH-dependent transitions along the membrane insertion pathway of the diphtheria toxin T-domain. Biochemistry. 2009;48:7584–7594. doi: 10.1021/bi9009264. [DOI] [PMC free article] [PubMed] [Google Scholar]
- Ladokhin AS. Fluorescence spectroscopy in thermodynamic and kinetic analysis of pH-dependent membrane protein insertion. Methods Enzymol. 2009;466:19–42. doi: 10.1016/S0076-6879(09)66002-X. [DOI] [PMC free article] [PubMed] [Google Scholar]
- Ladokhin AS. pH-triggered conformational switching along the membrane insertion pathway of the diphtheria toxin T-domain. Toxins (Basel) 2013;5:1362–1380. doi: 10.3390/toxins5081362. [DOI] [PMC free article] [PubMed] [Google Scholar]
- Ladokhin AS, Jayasinghe S, White SH. How to measure and analyze tryptophan fluorescence in membranes properly, and why bother? Anal.Biochem. 2000;285:235–245. doi: 10.1006/abio.2000.4773. [DOI] [PubMed] [Google Scholar]
- Ladokhin AS, Legmann R, Collier RJ, White SH. Reversible refolding of the diphtheria toxin T-domain on lipid membranes. Biochemistry. 2004;43:7451–7458. doi: 10.1021/bi036157w. [DOI] [PubMed] [Google Scholar]
- Lopez MM, Makhatadze GI. Differential scanning calorimetry. Methods Mol Biol. 2002;173:113–119. doi: 10.1385/1-59259-184-1:113. [DOI] [PubMed] [Google Scholar]
- Lundin C, Kim H, Nilsson I, White SH, von Heijne G. Molecular code for protein insertion in the endoplasmic reticulum membrane is similar for N(in)-C(out) and N(out)-C(in) transmembrane helices. Proc Natl Acad Sci U S A. 2008;105:15702–15707. doi: 10.1073/pnas.0804842105. [DOI] [PMC free article] [PubMed] [Google Scholar]
- Makhatadze GI, Medvedkin VN, Privalov PL. Partial molar volumes of polypeptides and their constituent groups in aqueous solution over a broad temperature range. Biopolymers. 1990;30:1001–1010. doi: 10.1002/bip.360301102. [DOI] [PubMed] [Google Scholar]
- Mayer LD, Hope MJ, Cullis PR. Vesicles of variable sizes produced by a rapid extrusion procedure. Biochim.Biophys.Acta. 1986;858:161–168. doi: 10.1016/0005-2736(86)90302-0. [DOI] [PubMed] [Google Scholar]
- Murphy JR. Mechanism of diphtheria toxin catalytic domain delivery to the eukaryotic cell cytosol and the cellular factors that directly participate in the process. Toxins (Basel) 2011;3:294–308. doi: 10.3390/toxins3030294. [DOI] [PMC free article] [PubMed] [Google Scholar]
- Oh KJ, Senzel L, Collier RJ, Finkelstein A. Translocation of the catalytic domain of diphtheria toxin across planar phospholipid bilayers by its own T domain. Proc.Natl.Acad.Sci.USA. 1999;96:8467–8470. doi: 10.1073/pnas.96.15.8467. [DOI] [PMC free article] [PubMed] [Google Scholar]
- Palchevskyy SS, Posokhov YO, Olivier B, Popot JL, Pucci B, Ladokhin AS. Chaperoning of Insertion of Membrane Proteins into Lipid Bilayers by Hemifluorinated Surfactants: Application to Diphtheria Toxin. Biochemistry. 2006;45:2629–2635. doi: 10.1021/bi052257l. [DOI] [PubMed] [Google Scholar]
- Posokhov YO, Rodnin MV, Das SK, Pucci B, Ladokhin AS. FCS study of the thermodynamics of membrane protein insertion into the lipid bilayer chaperoned by fluorinated surfactants. Biophys J. 2008a;95:L54–L56. doi: 10.1529/biophysj.108.141002. [DOI] [PMC free article] [PubMed] [Google Scholar]
- Posokhov YO, Rodnin MV, Lu L, Ladokhin AS. Membrane insertion pathway of annexin B12: thermodynamic and kinetic characterization by fluorescence correlation spectroscopy and fluorescence quenching. Biochemistry. 2008b;47:5078–5087. doi: 10.1021/bi702223c. [DOI] [PubMed] [Google Scholar]
- Rodnin MV, Kyrychenko A, Kienker P, Sharma O, Posokhov YO, Collier RJ, Finkelstein A, Ladokhin AS. Conformational switching of the diphtheria toxin T domain. J Mol Biol. 2010;402:1–7. doi: 10.1016/j.jmb.2010.07.024. [DOI] [PMC free article] [PubMed] [Google Scholar]
- Rodnin MV, Kyrychenko A, Kienker P, Sharma O, Vargas-Uribe M, Collier RJ, Finkelstein A, Ladokhin AS. Replacement of C-terminal histidines uncouples membrane insertion and translocation in diphtheria toxin T-domain. Biophys J. 2011;101:L41–L43. doi: 10.1016/j.bpj.2011.10.018. [DOI] [PMC free article] [PubMed] [Google Scholar]
- Rodnin MV, Posokhov YO, Contino-Pepin C, Brettmann J, Kyrychenko A, Palchevskyy SS, Pucci B, Ladokhin AS. Interactions of fluorinated surfactants with diphtheria toxin T-domain: testing new media for studies of membrane proteins. Biophys J. 2008;94:4348–4357. doi: 10.1529/biophysj.107.126235. [DOI] [PMC free article] [PubMed] [Google Scholar]
- Rosconi MP, London E. Topography of helices 5–7 in membrane-inserted diphtheria toxin T domain: identification and insertion boundaries of two hydrophobic sequences that do not form a stable transmembrane hairpin. J Biol Chem. 2002;277:16517–16527. doi: 10.1074/jbc.M200442200. [DOI] [PubMed] [Google Scholar]
- Rosconi MP, Zhao G, London E. Analyzing topography of membrane-inserted diphtheria toxin T domain using BODIPY-streptavidin: At low pH, helices 8 and 9 form a transmembrane hairpin but helices 5–7 form stable nonclassical inserted segments on the cis side of the bilayer. Biochemistry. 2004;43:9127–9139. doi: 10.1021/bi049354j. [DOI] [PubMed] [Google Scholar]
- Senzel L, Gordon M, Blaustein RO, Oh KJ, Collier RJ, Finkelstein A. Topography of diphtheria toxin's T domain in the open channel state. J.Gen.Physiol. 2000;115:421–434. doi: 10.1085/jgp.115.4.421. [DOI] [PMC free article] [PubMed] [Google Scholar]
- Senzel L, Huynh PD, Jakes KS, Collier RJ, Finkelstein A. The diphtheria toxin channel-forming T domain translocates its own NH2-terminal region across planar bilayers. J.Gen.Physiol. 1998;112:317–324. doi: 10.1085/jgp.112.3.317. [DOI] [PMC free article] [PubMed] [Google Scholar]
- Vargas-Uribe M, Rodnin MV, Kienker P, Finkelstein A, Ladokhin AS. Crucial Role of H322 in Folding of the Diphtheria Toxin T-Domain into the Open-Channel State. Biochemistry. 2013a;52:3457–3463. doi: 10.1021/bi400249f. [DOI] [PMC free article] [PubMed] [Google Scholar]
- Vargas-Uribe M, Rodnin MV, Ladokhin AS. Comparison of membrane insertion pathways of the apoptotic regulator Bcl-xL and the diphtheria toxin translocation domain. Biochemistry. 2013b;52:7901–7909. doi: 10.1021/bi400926k. [DOI] [PMC free article] [PubMed] [Google Scholar]
- Walter P, Blobel G. Preparation of microsomal membranes for cotranslational protein translocation. Methods in enzymology. 1982;96:84–93. doi: 10.1016/s0076-6879(83)96010-x. [DOI] [PubMed] [Google Scholar]
- Walters J, Milam SL, Clark AC. Practical approaches to protein folding and assembly: spectroscopic strategies in thermodynamics and kinetics. Methods Enzymol. 2009;455:1–39. doi: 10.1016/S0076-6879(08)04201-8. [DOI] [PMC free article] [PubMed] [Google Scholar]
- Wang J, London E. The membrane topography of the diphtheria toxin T domain linked to the a chain reveals a transient transmembrane hairpin and potential translocation mechanisms. Biochemistry. 2009;48:10446–10456. doi: 10.1021/bi9014665. [DOI] [PMC free article] [PubMed] [Google Scholar]
- Wang Y, Malenbaum SE, Kachel K, Zhan HJ, Collier RJ, London E. Identification of shallow and deep membrane-penetrating forms of diphtheria toxin T domain that are regulated by protein concentration and bilayer width. J.Biol.Chem. 1997;272:25091–25098. doi: 10.1074/jbc.272.40.25091. [DOI] [PubMed] [Google Scholar]
- White SH, Wimley WC, Ladokhin AS, Hristova K. Protein folding in membranes: Determining the energetics of peptide-bilayer interactions. Methods Enzymol. 1998;295:62–87. doi: 10.1016/s0076-6879(98)95035-2. [DOI] [PubMed] [Google Scholar]
- Zhan H, Oh KJ, Shin Y-K, Hubbell WL, Collier RJ. Interaction of the isolated transmembrane domain of diphtheria toxin with membranes. Biochemistry. 1995;34:4856–4863. doi: 10.1021/bi00014a043. [DOI] [PubMed] [Google Scholar]
Associated Data
This section collects any data citations, data availability statements, or supplementary materials included in this article.


