Abstract
Haemodynamic forces appear to play an influential role in the evolution of aneurysms. This has led to numerous studies, usually based on computational fluid dynamics. Their focus is predominantly on the wall shear stress (WSS) and associated derived parameters, attempting to find correlations between particular patterns of haemodynamic indices and regions subjected to disease formation and progression. The indices are generally determined by integration of flow properties over a single cardiac cycle. In this study, we illustrate that in some cases the transitional flow in aneurysms can lead to significantly different WSS distributions in consecutive cardiac cycles. Accurate determination of time-averaged haemodynamic indices may thus require simulation of a large number of cycles, which contrasts with the common approach to determine parameters using data from a single cycle. To demonstrate the role of transitional flow, two exemplary cases are considered: flow in an abdominal aortic aneurysm and in an intracranial aneurysm. The key differences that are observed between these cases are explained in terms of the integral timescale of the transitional flows in comparison with the cardiac cycle duration: for relatively small geometries, transients will decay before the next cardiac cycle. In larger geometries, transients are still present when the systolic phase produces new instabilities. These residual fluctuations serve as random initial conditions and thus seed different flow patterns in each cycle. To judge whether statistics are converged, the derived indices from at least two successive cardiac cycles should be compared.
Keywords: haemodynamics, transitional flow, computational fluid dynamics, aneurysms
1. Introduction
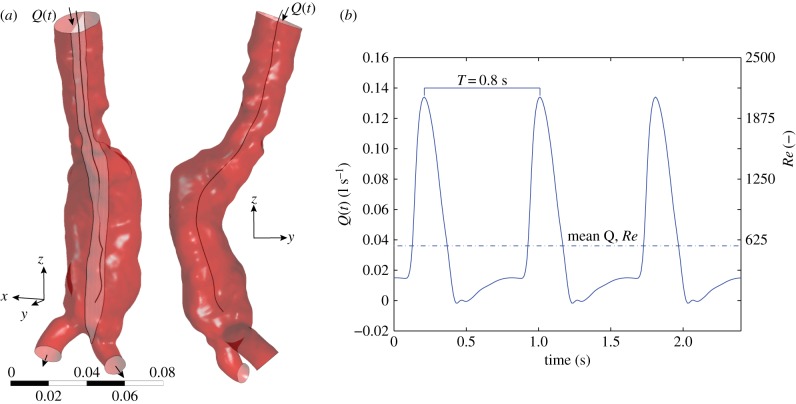
Aneurysms, i.e. pathological localized blood vessel dilatations, pose a considerable health risk. Their most common occurrence is in the cerebral arterial system (e.g. carotid artery, circle of Willis [1]) and in the aorta [2]. Examples of both types are shown in figures 1 and 2. While aneurysms can remain unsymptomatic for years, they may grow and eventually rupture, which is often lethal [1,2]. The formation and subsequent growth of an aneurysm is not only caused by systemic risk factors, but a significant role is also attributed to the local haemodynamic environment [3]. Blood flow patterns cause a non-uniform mechanical load on the vessel wall which may lead to deleterious remodelling [4–6].
Figure 1.
(a) An example of an abdominal aortic aneurysm. This geometry is used for the flow simulations, using the inlet and outlets as shown. Also indicated are the yz-midplane and the midline. (b) The boundary conditions used for the inflow. (Online version in colour.)
Figure 2.
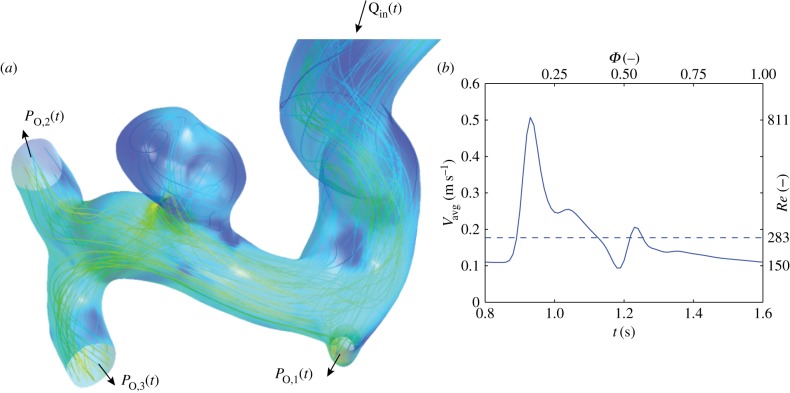
(a) Geometry of the intracranial aneurysm used for this study. Note that the feeding artery extends approximately 10 diameters proximally beyond the region shown here. (b) Inflow boundary conditions used for the simulations. (Online version in colour.)
Rather than using the entire time-dependent flow field and the associated stress tensor on the vessel wall, derived parameters are introduced to quantify a particular aspect of the effect of the haemodynamics on the vessel wall. These parameters can not only serve as input for fundamental studies that try to model the biomechanical progression of aneurysms [5,7,8], but could also lead to improved clinical decision-making tools [9] via statistically significant correlation where possible. Most of the parameters that have been introduced are based on the spatio-temporal distribution of the wall shear stress (WSS), the tangential shear force—normalized by surface area—acting on the endothelial cells that line the blood vessel walls. Examples include the oscillatory shear index (OSI) [10], the aneurysm formation index (AFI) [11] and the gradient oscillatory number [12]. These haemodynamic indices try to capture the effects of the complex flow patterns into a single metric. It is envisaged that such metrics may enable identification of regions prone to disease formation and/or progression.
Direct in vivo determination of the WSSs to obtain the haemodynamic parameters remains very challenging [13,14]. The common approach is based on patient-specific computational fluid dynamics (CFD) [15–18]. In these studies, the Navier–Stokes equations, which describe fluid motion, are solved numerically. In order to solve the equations within a reasonable time frame, a series of simplifications are usually needed, e.g. regarding the rheological properties of blood and the properties of the wall, i.e. rigid or deformable [19]. The highly pulsatile nature of the flow necessitates a transient simulation. Typically, two to five cycles are simulated, but only the final cycle is analysed to avoid the influence of initialization effects [16–18,20]. The same approach is common in more fundamental studies using simplified aneurysm geometries [21]. In contrast, it should be noted that experimental studies generally use many cycles [22,23], as this is usually required to improve the signal-to-noise ratio.
The purpose of this study is to highlight that the nature of the flow in aneurysms can lead to much more demanding simulations than the current approaches reported in the literature. In particular, the common assumption that a single cardiac cycle is sufficient to determine the aforementioned haemodynamic parameters can introduce an error in the quantification of integral metrics. We demonstrate this by simulating the flow in two exemplary aneurysm geometries: an abdominal aortic aneurysm (AAA) and an intracranial aneurysm (IA). It is shown that chaotic flow patterns can exist during parts of the cardiac cycle. Owing to the aperiodic nature of such flows, haemodynamic parameters can be significantly different from cardiac cycle to cardiac cycle.
2. Theoretical background
2.1. Pulsatile flows
From a fluid dynamics point of view, flows in aneurysms are particularly complex: they consist of a highly pulsatile, non-Newtonian fluid in a complex geometry with flexible walls. Furthermore, peak velocities can bring the flow into the transitional regime where the onset of turbulent flow can be expected. Here, we summarize the relevant terminology and parameters that describe the flow. For a more extensive discussion of flow in arteries and aneurysms, we refer to reviews elsewhere [24,25].
Steady flow in an artery is described by the Reynolds number, Remean = UDρ/η, with U and D the mean velocity and the diameter and ρ and η are the density and dynamic viscosity of blood. We follow the approach of most studies and ignore any non-Newtonian behaviour and assume a constant viscosity for blood, i.e. we ignore shear-thinning behaviour [19]. Remean describes the ratio of inertial to viscous forces; for low values, the viscous forces dominate, ensuring that the flow remains laminar. For higher values of Remean instabilities may grow, leading to turbulence.
Pulsatile flows introduce a timescale into the problem as well as a new velocity scale. The former is the cardiac cycle duration (T), whereas the latter describes the excursion of the velocity from the mean velocity; this can be characterized by the maximum or peak velocity, Upeak. This leads to two additional dimensionless groups: a second Reynolds number (Repeak = UpeakDρ/η) and the Womersley number [25]:
| 2.1 |
This dimensionless number reflects the ratio of the transient inertial and viscous forces. For low α, viscous forces dominate, and flow in a cylindrical geometry will be characterized by an oscillating parabolic profile. For α > 1, transient inertial forces lead to flattening of the profile as well as a phase lag with respect to the driving pressure force.
2.2. Transitional flow
With a typical abdominal aorta diameter of 2 cm, a Newtonian dynamic viscosity of 3.5 mPa s−1 and a mean velocity of 0.10 m s−1, a Reynolds number Remean ≈ 600 can be estimated [25]. This is well below the established empirical threshold for transition to turbulence in pipe flow (2000–2300), suggesting that the flow will be laminar. During peak systole, the velocity can rise to 0.4 m s−1, leading to Repeak ≈ 2400. This is only slightly above the aforementioned threshold, indicating that it is in the transitional regime (i.e. transition can occur if there are disturbances). Note that the pulsatile nature of the flow can have an influence on the threshold [26]. In particular, the decelerating phase of the cardiac cycle is known to be a destabilizing factor [27], so that transition can be promoted. In contrast, acceleration of a flow is a stabilizing factor, so that flows can (partially) relaminarize. Two regimes can be identified: bursts and modulated turbulence. In the former, occasional short-lived localized patches of turbulent flow appear. Their appearance and survival rate is a stochastic process, with survival rates rapidly increasing with Reynolds number [28]. In pulsatile flow, these structures are usually observed during or just after the decelerating phase of the cardiac cycle [26,27]. If the flow does not (fully) relaminarize during the cardiac cycle, a continuous modulation in the intensity of turbulent flow can be observed [26].
Apart from the natural transition of the flow to turbulence (i.e. the Reynolds number is sufficiently high), geometry can also play a critical role. For instance, the sudden significant increase in diameter in an AAA will lead to deceleration of the flow, which, in turn, leads to a rise in pressure. If this pressure increase is large compared with the driving pressure gradient (i.e. an adverse pressure gradient), flow separation is likely to occur [29]. Hydrodynamic instabilities can break down the separated shear layers, leading to stochastic behaviour. A similar process can occur in the case of a saccular aneurysm [30,31]. Note that here the flow is generally not considered to be ‘turbulent’ in the conventional sense (see also §5), but its aperiodic nature makes it distinct from the laminar regime.
The aperiodic nature of the (partially) turbulent flow is key to the issue highlighted by this study. For low Reynolds number flows, each cardiac cycle will be exactly the same, no matter how complex the flow patterns may appear. For (partially) turbulent flows, each cardiac cycle will be different: at a given point, the local blood velocity will be (slightly) different compared with the value during the previous cycle. To identify this behaviour, we make use of the triple-decomposition [26,32], an extension of the conventional Reynolds decomposition. An instantaneous velocity vector is decomposed into a steady, periodic and fluctuating component:
| 2.2 |
The first term on the right-hand side is a function of the location vector x only, as it represents the long-time mean velocity vector, i.e. averaged over many cycles. The second term, the periodic component, is a function of the time within the cycle. We here introduce the phase to describe the instance within the cycle: Φ = mod(t/T, 1), with T the total length of one cycle. The last term represents aperiodic (‘turbulent’) fluctuations in the flow. Similar definitions can be introduced for other quantities of interest, e.g. pressure, WSS or vorticity. The main advantage of introducing this decomposition is that it allows a quantification of cycle-to-cycle variations. In particular, we can define the turbulent kinetic energy, i.e. the energy per unit mass contained in the eddies that are different each cycle
 |
2.3 |
with u‘, v‘ and w‘ representing the Cartesian components of the vector u’. This TKE can be compared with the total energy or the energy contained in the steady and/or purely periodic components, which follow from a similar definition (e.g. by replacing u’ with u,  or
or  ).
).
3. Simulation details
The two representative vascular geometries that are used for the simulations were obtained using computed tomography angiography in previous studies [6,8]. The focus of the study will be on the flow in the AAA, whereas the IA serves as illustrative counterexample.
The choice of mesh parameters and solver options can have an effect on simulation results. In some instances, this effect can be relatively minor, e.g. the exact point of transition and turbulence intensity can vary somewhat. However, certain phenomena can be completely lost with inappropriate simulation details. For instance, Valen-Sendstad et al. show that high-frequency flow stabilities can occur in an IA, but that these only appear when a sufficiently small timestep is used for the simulations [33,34]. In appendix A, we show in more detail that the present simulation details are sufficient to capture the underlying physical phenomena (i.e. flow instabilities). The simulation details—such as mesh size and timestep—reflect common practice in applied haemodynamics studies.
3.1. Geometry and mesh
The infrarenal part of the abdominal aorta—containing an AAA—is cleaned up and segmented using ScanIP (Simpleware Ltd, Exeter, UK). Smaller arteries are removed, so that only the aorta, aneurysm and the iliac arteries remain (figure 1). Tests with the full geometry (i.e. including smaller branching arteries) led to slightly different quantitative results, but the qualitative outcome was the same. For the IA, a similar approach is followed, except this geometry has one inflow and three outflow vessels (figure 2).
An unstructured mesh is generated in the geometries using ICEM CFD 13.0 (ANSYS, Canonsburg, PA). For the near-wall region, three layers of hexahedral cells aligned with the wall are used, whereas the remainder of the lumen is meshed with tetrahedral elements. The total number of elements for the AAA is 5.65 million, which leads to a typical edge length of 0.65 mm for the tetrahedral elements and 0.4 mm for the hexahedral cells near the wall. A simulation with a mesh double in size (approx. 14 million elements) was performed to investigate grid independence. This simulation gave similar results: a local variation, expressed as standard deviation, in the OSI of 0.0348 (equivalent to 3.5% of the full range of the OSI; see appendix A for details). The IA mesh consists of 1.2 million elements, with a typical element edge length of 0.3 mm in the interior, decreasing to 0.05 mm near the wall. An additional simulation was also performed using a mesh with four times as many elements. This gave very similar results, indicating that this mesh was also sufficiently fine (see also appendix A).
3.2. Boundary conditions
The artery walls are assumed to be rigid and serve as no-slip boundary conditions. This assumption of rigid wall is found in the majority of published studies. While neglecting the compliance of the geometry will have an effect on the velocity and WSS fields [35], it can be expected that the essential features of the flow are similar. For the inlet and outlet, physiologically realistic boundary conditions are obtained using @neufuse (www.aneurist.org), a software toolkit based on a one-dimensional flow model of the circulation [36].
For the inlet, a time-dependent flow rate Q(t) is specified; see the right-hand sides of figures 1 and 2 for the AAA and IA, respectively. The mean and maximum Reynolds numbers at the inlet of the AAA are 560 and 2080, respectively. Instead of a parabolic velocity profile a flattened profile is used, U(t) = Umax(t)(1 − (r/R)10), to better represent the pulsatile flow in the aorta. This simple expression gives a good approximation of the theoretical Womersley profile for α ≈ 15. The short distance between inlet and AAA was sufficient to develop retrograde flow near the walls, as is observed in the theoretical Womersley profile under these conditions (figure 3).
Figure 3.
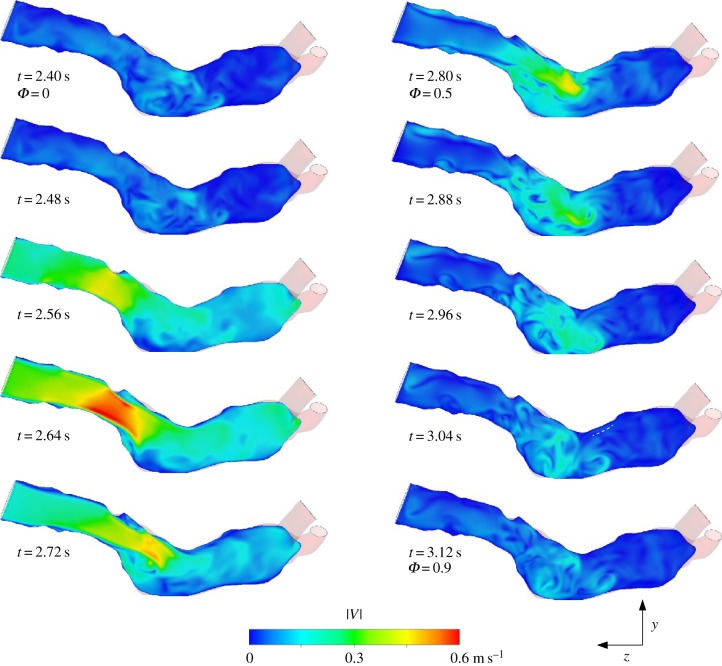
Visualization of the flow at the midplane of the AAA at selected phases. False colours represent the instantaneous velocity magnitude.
For the IA, a time-dependent parabolic velocity profile is specified, again based on realistic physiological flow measurements. Inflow velocities here ranged from 0.18 (mean) to 0.5 m s−1 (peak), corresponding to Reynolds numbers of 283 and 811. These apply to the inlet artery (i.e. proximal to the IA), with a radius of 2.8 mm. The corresponding Womersley number (α) is approximately 4, justifying a parabolic flow profile. Note that the flow can still develop from the simplified profile before it encounters the aneurysm. For all cases, a heart rate of 75 beats per minute was used, leading to a cardiac cycle duration (T) of 0.8 s.
At the outlets, transient pressures are specified with values again taken from @neufuse. As the walls are rigid, the specified outflow pressures only determine the (instantaneous) split between outflows.
3.3. Solver and post-processing
Transient flow simulations are performed using CFX 5 (R13 and R15, ANSYS, Canonsburg, PA). A fixed timestep is used to facilitate post-processing and comparison without the need for interpolation. A timestep of 5 ms is used based on earlier studies, and data are stored every eighth step (as a check, shorter runs with timesteps of 2.5 and 1 ms were performed, which gave similar results). A total simulation time of 24 s is used, corresponding to 30 heart beats.
Blood is modelled as an incompressible, Newtonian fluid with a dynamic viscosity (η) of 3.5 mPa s−1 and a density (ρ) of 1066 kg m−3. The value used for the dynamic viscosity was based on initial tests that showed that the shear rates exceeded 100 s–1 at systole (with peaks above 2000 s–1 in the boundary layers), suggesting that the low-viscosity plateau will be reached [29]. The transient solver uses a second-order backward Euler scheme and second-order central differencing scheme for the spatial derivatives. Five internal iterations are used at each timestep, with a convergence criterion for the residuals of 0.005. Tests with stricter convergence criteria, and more iterations gave similar results. The 24-second run of the AAA (30 cardiac cycles) requires approximately one week of computational time on a desktop with an Intel Xeon (3.5 GHz); parallel processing on four nodes was performed using Platform MPI.
Velocity and WSS data are exported to Matlab 7.14 (The Mathworks, Inc., Natick, MA) for further processing. The data, in the form of a series of velocity fields, are rearranged from a single time series, u(t) into a structure reflecting the cyclic nature of the data:  . Here,
  is the phase within the cycle and i represents the number of the cycle. References to a specific phase (e.g. ‘Φ = 0.1’) imply data averaged over all cycles (ignoring the first two cycles to avoid start-up effects), unless stated otherwise.
The simulations provide the spatio-temporal WSS distribution, from which a number of haemodynamic parameters can be determined. In particular, we here determine the OSI following Ku et al. [10]:
 |
3.1 |
and the AFI [11]:
| 3.2 |
Both these expressions describe the oscillatory nature of the local WSS τw at wall location x and time t. The OSI compares the mean WSS vector with the mean of the magnitude of the same vector: a value of zero indicates that the vector does not change direction during the cardiac cycle. Higher values indicate a more prominent change in direction and are linked to formation regions of the artery prone to atherosclerosis [10]. The AFI describes the difference between the local orientation of the instantaneous WSS compared with the direction of the mean WSS  , ignoring its magnitude. An AFI of 1 indicates that at that instance the WSS vector is aligned with the time-averaged wall shear vector at that location; a value of −1 indicates complete flow reversal.
Note that the value of  in equation (3.2) follows from
  , similar to the integrals in equation (3.1). In most studies, these integrals are evaluated from t = 0 to t = T, the duration of one cardiac cycle. This implicitly assumes that one cycle is sufficient for the statistical convergence of the estimation of the mean of this quantity.
4. Results
4.1. General description of the flow in the abdominal aortic aneurysm
In figure 3, 10 snapshots covering one cardiac cycle are shown of the flow in the midplane of the AAA. The false colours represent the instantaneous velocity magnitude. The location of this yz-plane, representing a sagittal cross section, is indicated in figure 1. At t = 2.64 s (phase Φ = 0.30), the flow in the AAA approaches its maximum (figure 1). At this stage, a jet-like flow structure is formed owing to flow separation at the local increase in diameter. This jet-like structure breaks down once the flow decelerates (t = 2.72 and 2.80 s), leaving behind a chaotic pattern with little mean velocity. Note that in a truly periodic flow, the last frame (bottom right) would be followed by the top left frame.
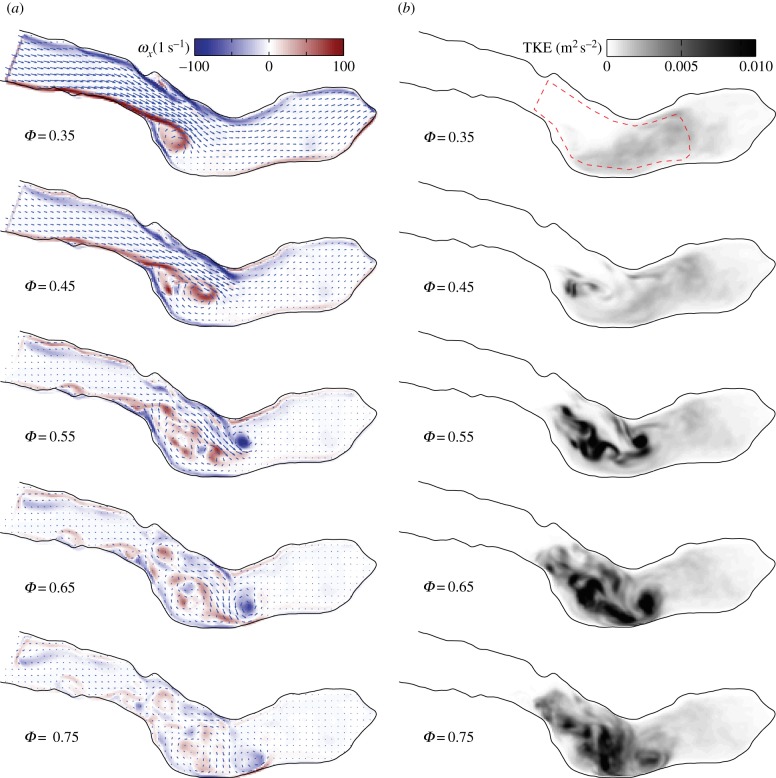
In figure 4, the periodic vorticity ( , with ω ≡ ∇ × u; see also equation (2.2)) and TKE distribution in the same midplane are shown side by side for five phases. Vorticity and TKE are shown as contour plots, whereas the mean velocity field is indicated as the vector field for reference. At Φ = 0.35, the roll-up of the separated boundary layer can clearly be seen. A cross section in the xz-plane showed a similar flow pattern, with comparable magnitudes of vorticity ωy, suggesting a more or less axisymmetric jet-like structure. The jet-like structure breaks apart during Φ = 0.45−0.75 into smaller structures, as is evident from the scattered vorticity. While we here show only ωx, the two other vorticity components are very similar. The jet breakdown is accompanied by an increase in the TKE (right-hand figure). Note how, initially, the local peaks in TKE correspond with vortex cores in the left-hand figure (e.g. at Φ = 0.55). This implies that the TKE represents local variations in vortex path and strengths in these stages: during each cycle, a similar vortex structure is formed, but it is slightly different in each cycle (recall that the periodic components are subtracted before calculating the TKE). Later on in the cycle, higher levels in TKE are also observed once the periodic vorticity has decreased significantly (Φ = 0.75). In this case, the initial vortical structure breaks down in smaller eddies that are different in each cycle—they will cancel out during averaging of the vorticity.
Figure 4.
Mean vorticity ( , a) and cycle-to-cycle variance (TKE, b) at five phases. The mean velocity field is shown as the vector field for reference in the left-hand figure (NB: only every fourth vector is shown for clarity).
The energy that is contained in the AAA can be estimated by calculating the average kinetic energy in a region of interest covering the bulk of the AAA. This region is indicated by dashed lines in figure 4 at Φ = 0.35. Note that the exact shape of this region naturally will have an influence, but for the qualitative arguments that follow this is not relevant. The evolution of the total kinetic energy (TKE), the periodic contribution and the turbulent kinetic energy in the AAA during two (identical) cardiac cycles is shown in figure 5. For clarity, the long-time mean ( ) has here been incorporated into the periodic contribution; the total kinetic energy (KE) is the sum of a periodic component (PKE) and a turbulent component (TKE). Note that the square-root values of the energies are shown. The inflow boundary condition Qin(t) is shown at the top for reference.
Figure 5.
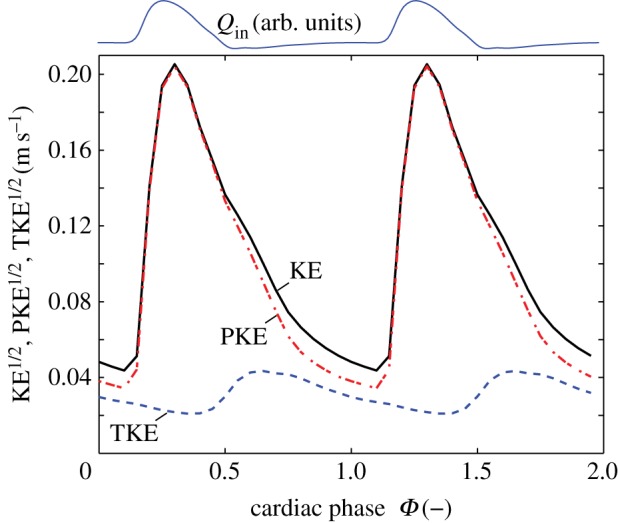
The total kinetic energy (KE), the periodic contribution to the kinetic energy (PKE) and the turbulent kinetic energy (TKE) in the AAA during the cardiac cycle. The flow rate at the inlet, Qin(t), is shown as reference at the top of the figure. (Online version in colour.)
Figure 5 confirms the earlier observation that the TKE peaks later in the cycle than the mean flow; the former peaks around Φ = 0.60–0.65, whereas the latter peaks at Φ = 0.25 (a delay of 0.28 s). The mean TKE within the AAA reaches a maximum value of 1.9 × 10⁻³ m2 s−2, which is equivalent to a typical velocity fluctuation  cm s−1. This is approximately 6% of the peak systolic velocity magnitude. Locally, the TKE can reach levels of 3.1 × 10⁻² m2 s−2, an order of magnitude higher than the mean value. The TKE does not decay to zero during the cycle: note that even at Φ = 0.35 in figure 4 the region of interest is filled with remnants of the previous cycle. A minimal value of the TKE of 0.92 × 10⁻³ m2 s−2 is observed when the mean flow approaches the diastolic phase (Φ = 0.45).
As a final description of the flow field, we evaluate the pressure along the midline of the AAA (figure 1). The instantaneous pressure—relative to the pressure at the inlet—along the midline is shown in figure 6. At Φ = 0, the flow is at rest, and the pressure is nearly constant throughout the AAA. During Φ = 0.15−0.20, the flow is accelerating, corresponding to a strong negative pressure gradient (dP/dz’ < 0, with z’ the coordinate along the centreline). For Φ = 0.30−0.35, the flow is decelerating, leading to an increase in pressure along z’. The presence of the AAA has an interesting consequence for the pressure gradient: at the start of the AAA, the local diameter increases dramatically (z’ > 0.05). This will slow down the flow, as the flow is incompressible. This deceleration leads to an increase in pressure—this can be predicted qualitatively using the Bernoulli equation at the centreline or more quantitatively using, e.g. the one-dimensional Euler equation [10]. This increase in pressure augments or counteracts the pressure gradient owing to the acceleration or deceleration of the mean flow. Depending on the magnitude of the gradient owing to the mean flow, this local increase in pressure can lead to a local adverse pressure gradient (Φ = 0.25 in figure 6 for approx. 0.05 > z’ > 0.10). This local pressure minimum corresponds to the moment and location where the flow separates (see e.g. t = 2.64 s in figure 3).
Figure 6.
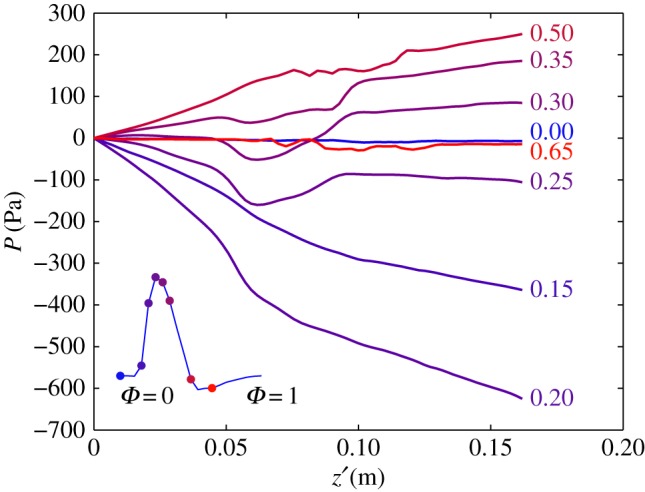
The instantaneous pressure along the centreline of the AAA. Note the transition from a favourable (e.g. at Φ = 0.20) to an adverse pressure gradient (Φ = 0.35). The pressure is expressed with respect to the inlet value. The inset shows the mean flow throughout the cardiac flow as a reference. (Online version in colour.)
4.2. Haemodynamic parameters in the abdominal aortic aneurysm
Using the velocity and WSS results from the simulation, haemodynamic parameters can be determined to characterize the flow in the AAA. In figure 7a, we show the distribution of the OSI, using the data from cardiac cycles i = 3 … 30, i.e. 28 cycles equivalent to 22.4 s of simulated flow data. Note how the top part of the AAA has a relatively low OSI, which may seem surprising at first. However, in this part of the AAA, the flow near the bottom wall is mostly retrograde owing to the separation zone (figure 4a). In the bottom part of the AAA, the flow is much more chaotic, as is evident from high values of the OSI. In the two iliac arteries, the flow recovers its unidirectional nature throughout the cycle, leading to low values of the OSI.
Figure 7.
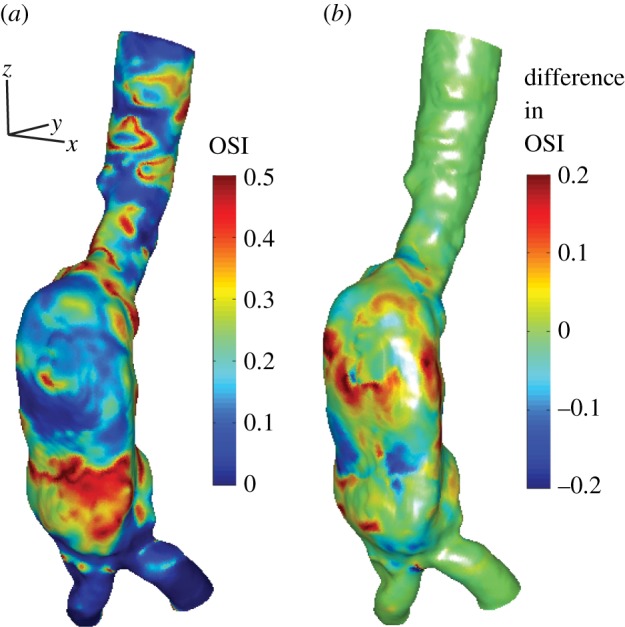
(a) The oscillatory shear index (OSI) distribution in the AAA using data from 28 cardiac cycles (i = 3 … 30). (b) The local difference in OSI using either only cardiac cycle 3 or using cycles 3–30.
A similar analysis can be performed using data from only a single cardiac cycle. In this case, we use the third cycle, to be consistent with the common practice in the literature. In figure 7b, we show the difference in OSI when either just a single or all 28 cycles are used. The colour coding in figure 7b shows the local difference, OSI(x)3−30 − OSI(x)3. As can be seen in figure 7, local differences up to 0.2 can be observed, which are of the same order of magnitude as the OSI itself.
The difference in OSI for the two cases (1 versus 28 cycles) can be quantified by calculating the standard deviation of the differences along the entire surface. When normalized with the mean OSI, this difference is approximately 22%. Locally, differences up to 0.2 (or 40% of the maximum possible OSI value) can be observed. We assume here that the results from the long simulation are more converged statistically and thus closer to the ‘true’ values, which will be discussed in more detail later on.
As a second example of a haemodynamic parameter, we calculate the AFI in the AAA. This is again done for the case using data from a single cardiac cycle and using all available cycles. The local differences along the geometry are quantified by calculating the standard deviation, i.e. at each wall location, the difference is determined between the two cases. Subsequently, the standard deviation is determined of these differences. The results are shown in figure 8 as a function of the cardiac cycle phase. As a reference, the mean flow is also shown (using arbitrary units). Again, the differences in AFI are quite significant throughout the cycle. A minimum is observed during the accelerational phase (Φ ≈ 0.20), which represents the most stable and thus reproducible flow condition. Once the flow decelerates and vortical structures are formed and subsequently break down the variation in AFI increases. During this phase, the lack in convergence becomes more and more apparent owing to the more aperiodic nature of the flow. An illustration of the cycle-to-cycle variations of the WSS is given in appendix B (figure 17).
Figure 8.
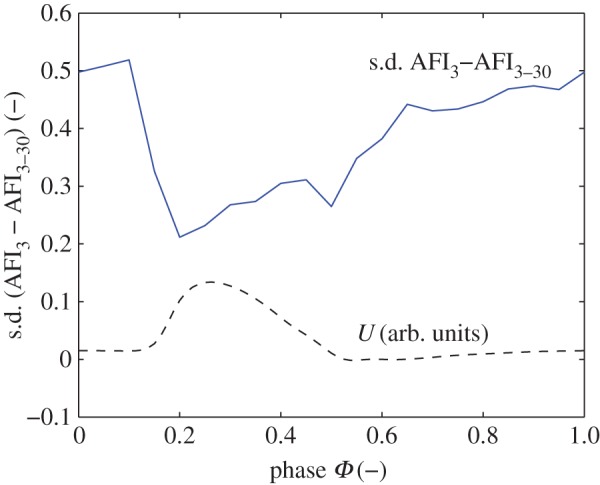
The difference in AFI in the AAA using either cycle 3 or cycles 3–30. Shown is the standard deviation of the local differences, throughout the cardiac cycle. The inflow conditions are shown as reference (dashed line) in arbitrary units. (Online version in colour.)
4.3. Flow and haemodynamic parameters in the intracranial aneurysm
As mentioned earlier, the flow simulations in the IA serve as counterexample for the main aim of this study. We therefore only briefly discuss this flow. In figure 2, the complex three-dimensional flow pattern in the IA is shown during peak systole. The flow field has been visualized here using instantaneous streamlines. Note that interpretation of streamlines in transient flows generally has to be done with care, but here the variation in direction of the velocity field during the cycle is relatively small. Flow can be seen entering the saccular aneurysm and forming a jet-like structure that impinges on the opposing wall. A series of velocity field snapshots in a cross section (aligned with the axis of the blood vessel midline) is shown in figure 9.
Figure 9.

Four snapshots of the velocity field in the midplane of the IA.
To quantify the TKE and its constituents in the IA, we plot the periodic, turbulent and TKE during the cycle in figure 10. The turbulent contribution is very small and has been multiplied by a factor of 10 for clarity. The TKE is dominated by the periodic component, and the data for KE and PKE collapse in figure 10. There is also no time lag between the maximum in TKE and the maximum of the flow in the artery (Qin, shown with arbitrary scaling and offset in figure 10).
Figure 10.
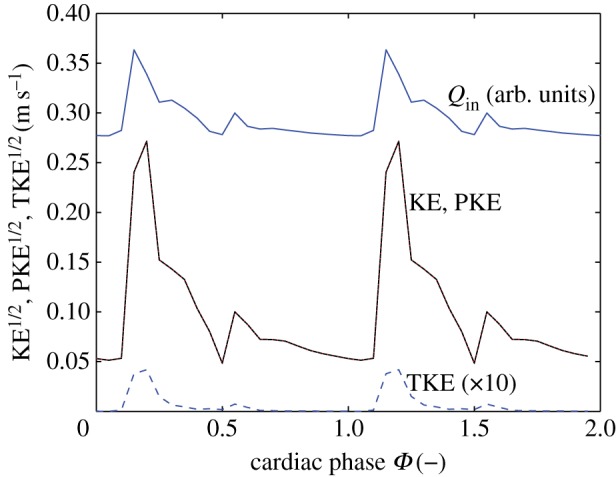
The kinetic energy in the IA. The flow rate in the main artery is shown as reference. Note that the data for the total kinetic energy (KE) and periodic kinetic energy (PKE) collapse and the values of the turbulent kinetic energy (TKE) are multiplied by a factor of 10 for clarity. (Online version in colour.)
Again, the OSI can be determined for the cases of a single or 28 cardiac cycles. The difference between these two cases is shown in figure 11; note that the geometry has been rotated by 90° with respect to figure 2. As can be seen in the graph, there is hardly any difference (the maximum of the scale is five orders of magnitudes smaller than typical OSI values) between the two cases. This indicates that each cardiac cycle is practically identical to the previous cycle. As can be expected, the AFI results are also virtually identical for both cases. When comparing the results for a single cycle and for 28 cycles, the maximum discrepancy is found at Φ = 0.25, but these differences are of the order of 1 × 10⁻⁴—a fraction of the typical values of the AFI observed throughout the cycle (0.25–1).
Figure 11.
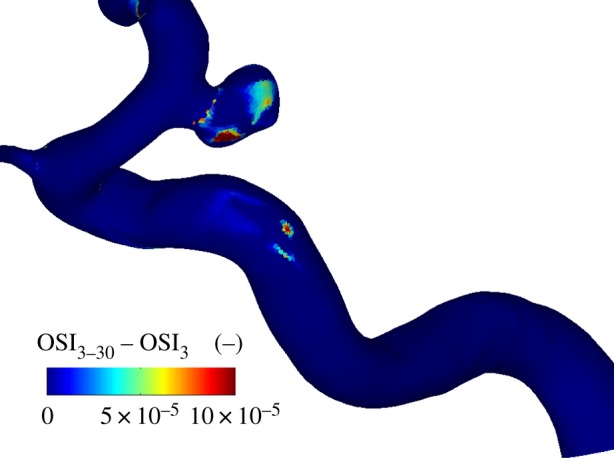
The difference in OSI in the intracranial aneurysm using either 28 cycles (cycle 3–30) or a single cardiac cycle (3). Note that the maximum scale is 10 × 10−5.
5. Discussion
As discussed in §4.1, the flow in the AAA is complex and can be considered to be weakly turbulent. Note that we use ‘turbulent’ here in its narrowest definition of chaotic vorticity; turbulence in the classical definition requires more characteristics [37]. This chaotic nature means that the flow field will be different in each cardiac cycle. The cycle-to-cycle variations of the interior flow will cause a slightly different WSS distribution in subsequent cycles. However, the flow in the IA appeared to be (nearly) completely reproducible, despite its complex structure: the OSI comparison analysis showed negligible differences. To explain the difference in behaviour, it is worthwhile to investigate the scales that are involved in the two exemplary flows.
The TKE contains contributions from the mean flow, periodic vortices and random vortices. In the AAA, once the flow has slowed down after systole, the remaining kinetic energy is only a result of periodic and random vortices (Φ = 0.35–1.1 for the AAA). We can model the dynamics of the decay of these vortical structures using a simple scaling argument. We assume that the typical decay time of the largest vortical structures scales as  (i.e. the eddy turn-over time [37]). For the length scale L, we use the local diameter of the AAA, L = 3 cm, as the flow separation creates a vortex structure that fills the entire AAA (see figure 4 at Φ = 0.35). For the typical velocity fluctuation, we use
  , see equation (2.3). At Φ = 0.35, this gives
  m s−1 and a turn-over time
  The decay of the energy contained in the vortical structures can be approximated by a power-law decay, so that
  . The time
  represents the time that has passed since the initial conditions of the TKE (at Φ = 0.35, t = 0.28). This simple model describes the observations qualitatively very well, as shown in figure 12. Note that the estimated turn-over time corresponds to the observed lag of 0.28 s between the peak in the mean flow and the peak in TKE (§4.1).
Figure 12.
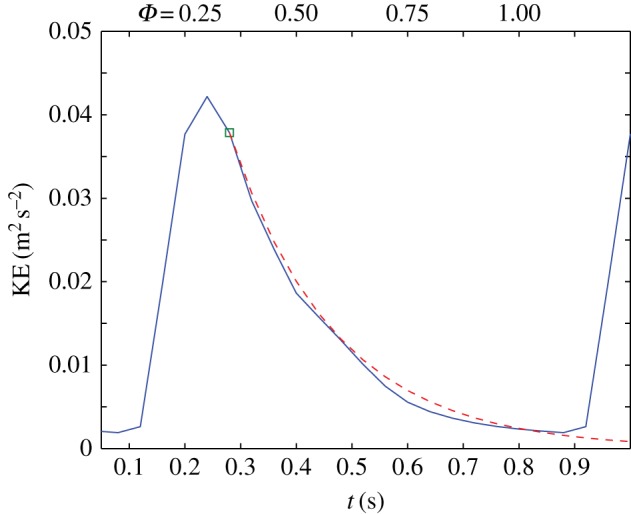
Decay of the turbulent kinetic energy in the AAA during the diastolic part of the cardiac cycle. The simplified model (dashed line) is based on exponential decay of the kinetic energy. (Online version in colour.)
The chaotic nature of the flow means that the estimation of time-averaged haemodynamic indices, e.g. the mean WSS, requires a certain number of realizations, i.e. an adequately long time history. The exact number that is required depends on the nature of the flow (the turbulence level and timescales). To illustrate this, we study the convergence of the OSI for the AAA. In figure 13, we report the convergence when an increasing number of cardiac cycles is used. It shows the difference (expressed as standard deviation of the local differences) when j cycles are used, compared with the case when (j – 1) cycles are used. The first point in the figure, for instance, represents the difference between a single cycle (i = 4) and two cycles (i = 4 and 5). Note that the standard deviation is a few per cent, but this number may not reflect larger local discrepancies. The data connected with solid lines refer to simulations using three different meshes (with approx. 1, 6 and 14 million elements). All three show the same convergence behaviour. To explore the influence of the Reynolds number, two additional simulations were performed with a Reynolds number of 0.5 and 0.8 times the original value (obtained by changing the viscosity). As can be seen in figure 13, the slopes of the convergence are similar, but the initial values are significantly lower—nearly a factor of two for the 0.5Re case. For very low Reynolds numbers (much below physiological conditions), it is to be expected that the stochastic nature disappears completely. The exact transition between the two scenarios is beyond the scope of this study and is part of ongoing research.
Figure 13.
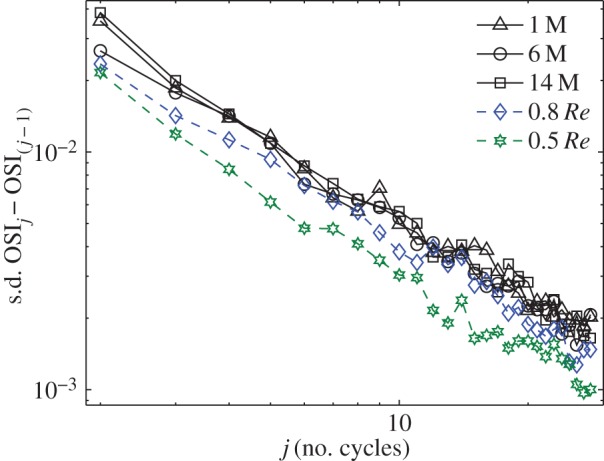
Convergence of the OSI using an increasing number of cardiac cycles. The vertical axis shows the standard deviation of the local differences of the OSI distribution using j cycles compared with the result using (j − 1) cycles. The text describes the various cases. (Online version in colour.)
As is clear from figure 13, even 28 cycles will not give completely converged results. However, one should note that the differences become smaller and smaller. Simulating the number of cycles used in this study may be impractical for most studies (as they require an order of magnitude more in computational time). However, simulation of one additional cycle requires a relatively small computational effort. Comparison of the haemodynamic parameters for the last cycle and the results for the last-but-one cycle will provide evidence if the flow is aperiodic or not. Additionally, a comparison of the decay timescales with the cardiac cycle duration can predict whether longer simulations are needed.
In the IA, there is a complex flow pattern (figure 2). However, the shape of this pattern remains more or less constant, whereas the amplitude is modulated by the magnitude of the velocity in the main artery (figure 9). As soon as the driving force for the flow in the aneurysm decreases, the vortical structure reduces in intensity; no significant (chaotic) fluctuations are observed. This reflects the reduced role of inertia in this flow, as quantified by the lower Reynolds number. The magnitude of the flow velocity in the jet-like structure in the aneurysm (figure 9, left-most figure) is approximately 1 m s−1. The aneurysm is only 4–5 mm in width and height. The decay time of a vortex generated by the jet-like structure would thus be of order τ ≈ 4–5 ms. In other words, it will be dissipated nearly instantly. The flow structure that exists at Φ = 0.55 persists for the remainder of the cycle and slowly decreases in intensity (it closely follows the driving force). This is in agreement with observation that the TKE maximum coincides with the mean flow maximum, as observed earlier (figure 10).
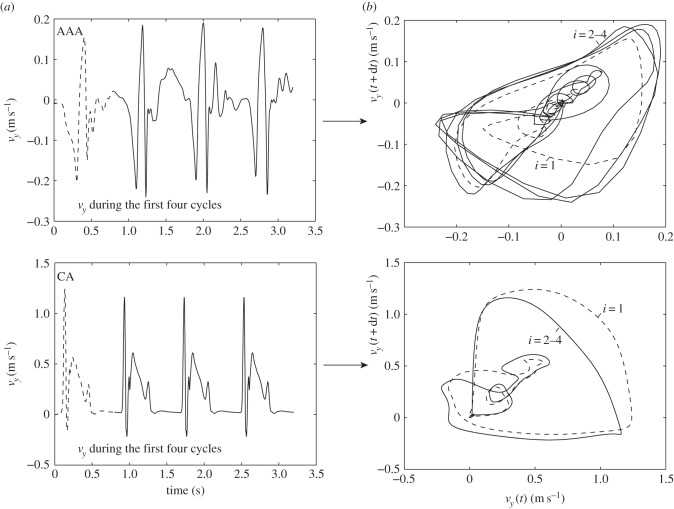
As a final demonstration of the difference between the nature of the flow in the AAA and the IA, figure 14 shows the phase portraits [38,39] of the velocity at a certain point within the aneurysms. On the left-hand side, the temporal evolution of a single velocity component (here vy) at a fixed point within the aneurysm is shown as a function of time. The first cardiac cycle is shown using dashed lines, the three subsequent cycles with a solid line. The top shows data for the AAA, whereas the bottom left figure shows data for the IA. On the right-hand side, the corresponding phase portraits are shown. These are constructed using a standard time delay technique. Here, we have used a temporal separation of dt = 20 ms and again use dashed lines for the first cardiac cycle and solid lines for the subsequent cycles. Although higher-dimensional reconstructions are possible, the simple two-dimensional phase portraits presented here fully demonstrate the relevant features. In the bottom figure, it can clearly be observed that, after initialization (dashed lines, i = 1), the IA system quickly reaches a limit cycle: each trajectory overlaps with minimal variation. In contrast, the AAA shows distinctly different behaviour. After initialization (dashed line), the system appears to follow some sort of limit cycle, but each trajectory deviates significantly. Note that these phase portraits are closely related to the triple decomposition that was used throughout this study: the mean velocity value ( ) dictates the location of the curves. The total width of the curves represents the amplitude of the purely periodic velocity component,
  . The variation between trajectories (i.e. the width of the ‘bands' is proportional to the magnitude of the fluctuating components, u’(x,t)). The phase portraits are here only used to distinguish between purely periodic and transitional/turbulent flow. However, they are a powerful tool in the study of the causes of flow transition [40,39]. This topic is beyond the scope of this study, and we refer to recent literature [41,18].
Figure 14.
Evolution of the velocity component vy at a point within the aneurysm as a function of time (a) and the phase portraits (b). The top row is based on the AAA, while the bottom row represents the data of the IA.
6. Conclusion and outlook
The nature of the pulsatile flow in aneurysms may result in flow separation. The transitional flow that arises can significantly affect the requirements for converged statistics of various haemodynamic metrics, such as the OSI and AFI. If the chaotic structures have a lifetime that is long compared with the cardiac cycle duration (as observed for the AAA), this implies the next cardiac cycle starts with different initial conditions which leads to a different flow pattern and associated derived haemodynamic indices. Hence, in this scenario, the simulation of a large number of cycles is necessary to provide reliable metrics of the flow field. However, if the decay time of any fluctuation is small relative to the length of the cardiac cycle (as observed for the IA), the flow will be periodic and hence one cycle is sufficient to provide metrics of the flow. Simulation of just one additional cycle can already reveal convergence. This verification step is recommended when deriving haemodynamic indices from pulsatile flow, in particular when attempting to identify correlations between haemodynamic patterns and regions of vascular disease formation and progression.
This study purposely shows just two exemplary cases, as it serves to illustrate that chaotic behaviour can occur and to highlight the implications. The observed behaviour can also be expected in other aneurysms of comparable size. A more fundamental study to classify and predict the behaviour is part of ongoing research.
Appendix A
A.1. Temporal resolution
As documented by Valen-Sendstad et al. simulations using an insufficient temporal resolution can miss important physical phenomena, in their case high-frequency instabilities in an IA [33,34]. To check whether our numerical approach was capable of observing such high-frequency phenomena, we performed an additional test, following Valen-Sendstad's approach: the IA was simulated with a steady inflow, equivalent to the peak systolic conditions (V = 0.5 m s−1, Re = 811). Note that the IA was chosen for this test, as the AAA already shows instabilities.
A fixed point approximately in the centre of the IA was chosen as a monitor point. Figure 15 shows the results of simulations with a timestep of 0.1, 1 and 5 ms, respectively. Note that data were not stored at each computed timestep for practical reasons. The smallest timestep is based on the outcome of Valen-Sendstad's work. The largest timestep (5 ms) is used throughout this study. It is representative of typical haemodynamics studies.
Figure 15.
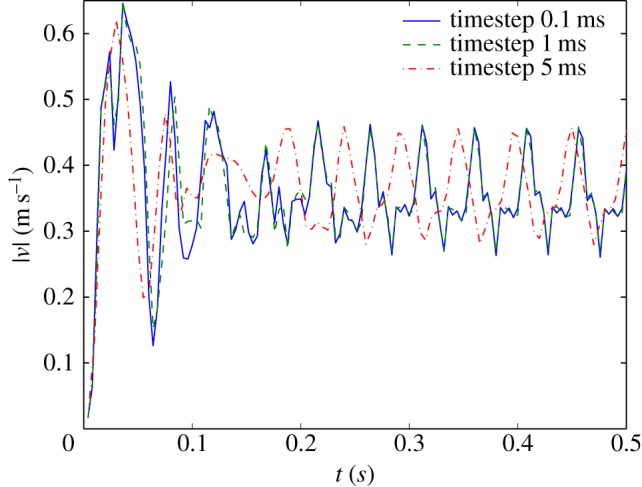
Instantaneous velocity magnitude at a point near the centre of the IA using steady inflow conditions; results for three different timesteps: 0.1, 1 and 5 ms. (Online version in colour.)
As can be seen in figure 15, after a short time (0.1–0.2 s), a periodic oscillation sets in, with a characteristic frequency of 20 Hz. Closer inspection of the velocity field showed that this is owing to a meandering of the impinging jet (figure 9, Φ = 0.15). The results for the two smallest timesteps coincide. The data obtain with a timestep of 5 ms also exhibit a periodic signal; the frequency is slightly lower, but the amplitude is comparable. The initial transient is captured, but the periodic flow pattern starts at a different phase in the cycle. Small differences in the complex transient flow field will be the most likely cause of this difference in phase. Nevertheless, it can be concluded that a timestep of 5 ms is capable of picking up relatively high-frequency instabilities.
Note that the simulations shown in figure 15 are using a steady inflow. It takes some time for the periodic velocity patterns to develop. In the transient simulations that form the core of the main study, the peak systolic velocity (V = 0.5 m s−1) is only reached for a fraction of the cardiac cycle (figure 2b). Likely, the instabilities seen in figure 15 and found by Valen-Sendstad et al. will not have time to develop.
A.2. Mesh independence
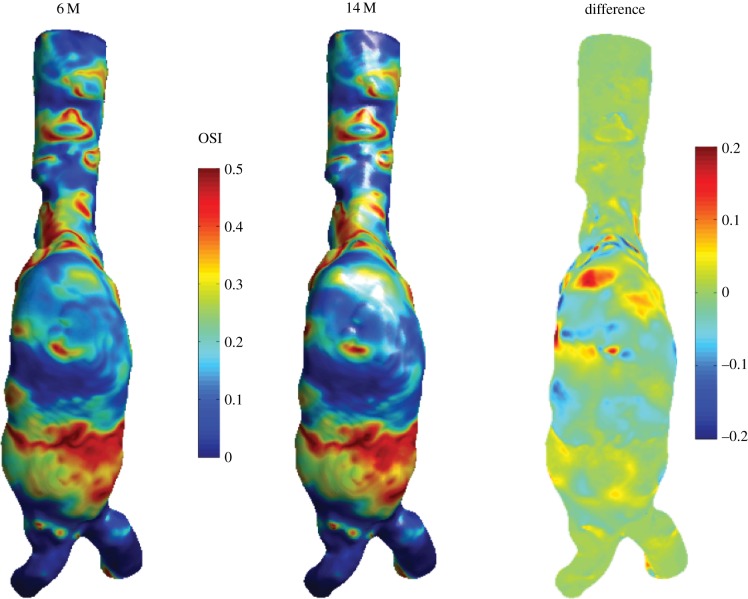
To check whether the mesh that was used for the AAA simulations was sufficiently fine, an additional simulation was performed to investigate mesh independence. A refined mesh was created with approximately 14 million nodes. Owing to the stochastic nature of the flow, it is not possible to compare instantaneous velocity or WSS fields, as even the smallest difference between the two meshes can lead to different realizations. Therefore, the only option is to compare the averaged statistics, such as e.g. the OSI; this necessitates a simulation that is even more demanding than the one that forms the core of this study. The results of the OSI for the two meshes are shown in figure 16. Figure 16 shows the OSI of the AAA, seen from the negative y-direction. The data of the 14 million simulation are interpolated onto the standard resolution case, and the local difference is shown on the right-hand side.
Figure 16.
Comparison between the OSI using the mesh with 6 million nodes and the refined mesh with 14 million nodes. The right-hand side shows the local difference.
As can be seen in figure 16, the qualitative agreement between the OSI results is very good. There are some small local differences, but the average agreement is acceptable: the standard deviation of the local difference between the two cases is 0.0348, equivalent to 7% of the maximum value of OSI and thus 3.5% of the full range (−0.5 to 0.5). It should be noted that both simulations are not completely converged, even after 30 cycles (figure 13). A part of the discrepancy seen in figure 16 can thus be attributed to lack of convergence. Nevertheless, both simulations show the same behaviour with respect to cycle-to-cycle variations.
The simulation of the IA case was also repeated with a refined mesh, in this case with 7.8 million elements (instead of the original 1.2). Owing to the absence of stochastic variation in the IA case, it is here possible to directly compare instantaneous values, e.g. the WSS. The instantaneous WSS had an average local difference (expressed as standard deviation) of 0.13 Pa, equivalent to 5.9% of the mean WSS and 0.65% of the maximum instantaneous WSS at a particular representative instance. The derived quantities (e.g. AFI and OSI) will therefore be very similar. The original mesh size was thus found to be sufficiently fine. This is to be expected, as the Reynolds number is lower than the AAA case, in combination with a mesh that was slightly finer.
Appendix B
B.1. Cycle-to-cycle variation of wall shear stress
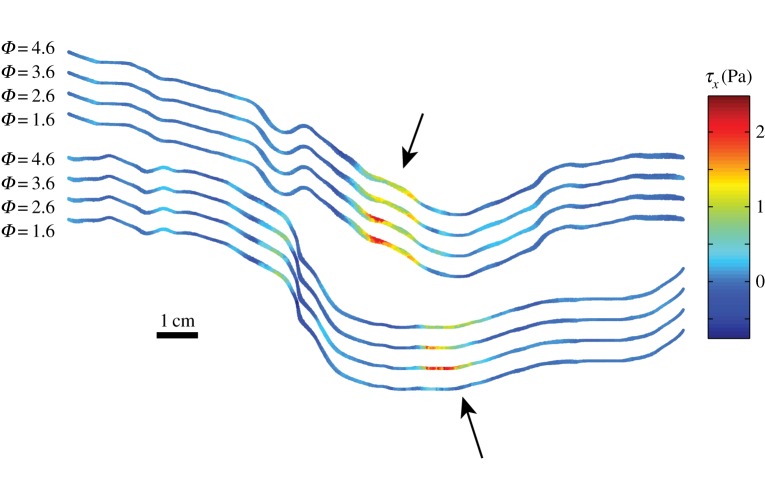
As an illustration of the underlying cause of the differences between the OSI and AFI using a single or many cardiac cycles, figure 17 shows instantaneous snapshots of the WSS (here the x component, τx) at four ‘identical’ phases in the midplane of the AAA. The top and bottom wall of the AAA are shown (same orientation as e.g. figures 3 and 4), with a vertical offset for clarity. As can be seen in this figure, the overall pattern of the WSS is similar, but there are variations of up to 1–2 Pa locally (see the regions indicated by the arrows) as a result of the chaotic nature of the flow. These variations, integrated in the OSI and AFI definitions (equations (3.1) and (3.2)), will lead to different values if either a single or many cardiac cycles are used.
Figure 17.
Four snapshots of τx at the midplane of the AAA at identical cardiac phases: Φ = 1.6, 2.6, 3.6 and 4.6. The top and bottom wall are shown for all four instances, with an offset for clarity. (Online version in colour.)
References
- 1.Wiebers DO. 2003. Unruptured intracranial aneurysms: natural history, clinical outcome, and risks of surgical and endovascular treatment. Lancet 362, 103–110. ( 10.1016/S0140-6736(03)13860-3) [DOI] [PubMed] [Google Scholar]
- 2.Sakalihasan N, Limet R, Defawe OD. 2005. Abdominal aortic aneurysm. Lancet 365, 1577–1589. ( 10.1016/S0140-6736(05)66459-8) [DOI] [PubMed] [Google Scholar]
- 3.Cebral JR, Raschi M. 2013. Suggested connections between risk factors of intracranial aneurysms: a review. Ann. Biomed. Eng. 41, 1366–1383. ( 10.1007/s10439-012-0723-0) [DOI] [PMC free article] [PubMed] [Google Scholar]
- 4.Vorp DA. 2007. Biomechanics of abdominal aortic aneurysm. J. Biomech. 40, 1887–1902. ( 10.1016/j.jbiomech.2006.09.003) [DOI] [PMC free article] [PubMed] [Google Scholar]
- 5.Humphrey JD, Taylor CA. 2008. Intracranial and abdominal aortic aneurysms: similarities, differences, and need for a new class of computational models. Annu. Rev. Biomed. Eng. 10, 221–226. ( 10.1146/annurev.bioeng.10.061807.160439) [DOI] [PMC free article] [PubMed] [Google Scholar]
- 6.Chen H, Selimovic A, Thompson H, Chiarini A, Penrose J, Ventikos Y, Watton PN. 2013. Investigating the influence of haemodynamic stimuli on intracranial aneurysm inception. Ann. Biomed. Eng. 41, 1492–1504. ( 10.1007/s10439-013-0794-6) [DOI] [PubMed] [Google Scholar]
- 7.Watton PN, Raberger NB, Holzapfel GA, Ventikos Y. 2009. Coupling the hemodynamic environment to the evolution of cerebral aneurysms: computational framework and numerical examples. J. Biomech. Eng. 131, 101003 ( 10.1115/1.3192141) [DOI] [PubMed] [Google Scholar]
- 8.Aparício P, Mandaltsi A, Boamah J, Chen H, Selimovic A, Bratby M, Uberoi R, Ventikos Y, Watton PN. 2014. Modelling the influence of endothelial heterogeneity on the progression of arterial disease: application to abdominal aortic aneurysm evolution. Int. J. Numer. Methods Biomed. Eng. 30, 563–586. ( 10.1002/cnm.2620) [DOI] [PubMed] [Google Scholar]
- 9.Siebes M, Ventikos Y. 2010. The role of biofluid mechanics in the assessment of clinical and pathological observations. Ann. Biomed. Eng. 38, 1216–1224. ( 10.1007/s10439-010-9903-y) [DOI] [PMC free article] [PubMed] [Google Scholar]
- 10.Ku DN, Giddens DP, Zarins CK, Glagov S. 1985. Pulsatile flow and atherosclerosis in the human carotid bifurcation. Positive correlation between plaque location and low oscillating shear stress. Arterioscler. Thromb. Vasc. Biol. 5, 293–302. ( 10.1161/01.ATV.5.3.293) [DOI] [PubMed] [Google Scholar]
- 11.Mantha A, Karmonik C, Benndorf G, Strother C, Metcalfe R. 2006. Hemodynamics in a cerebral artery before and after the formation of an aneurysm. Am. J. Neuroradiol. 27, 1113–1118. [PMC free article] [PubMed] [Google Scholar]
- 12.Shimogonya Y, Ishikawa T, Imai Y, Matsuki N, Yamaguchi T. 2009. Can temporal fluctuation in spatial wall shear stress gradient initiate a cerebral aneurysm? A proposed novel hemodynamic index, the gradient oscillatory number (GON). J. Biomech. 42, 550–554. ( 10.1016/j.jbiomech.2008.10.006) [DOI] [PubMed] [Google Scholar]
- 13.Poelma C, van der Mijle RME, Mari JM, Tang M-X, Weinberg PD, Westerweel J. 2012. Ultrasound imaging velocimetry: toward reliable wall shear stress measurements. Eur. J. Mech. B/Fluids 35, 70–75. ( 10.1016/j.euromechflu.2012.03.003) [DOI] [Google Scholar]
- 14.Taylor CA, Cheng CP, Espinosa LA, Tang BT, Parker D, Herfkens RJ. 2002. In vivo quantification of blood flow and wall shear stress in the human abdominal aorta during lower limb exercise. Ann. Biomed. Eng. 30, 402–408. ( 10.1114/1.1476016) [DOI] [PubMed] [Google Scholar]
- 15.Steinman DA, Milner JS, Norley CJ, Lownie SP, Holdsworth DW. 2003. Image-based computational simulation of flow dynamics in a giant intracranial aneurysm. Am. J. Neuroradiol. 24, 559–566. [PMC free article] [PubMed] [Google Scholar]
- 16.Shojima M, Oshima M, Takagi K, Torii R, Hayakawa M, Katada K, Morita A, Kirino T. 2004. Magnitude and role of wall shear stress on cerebral aneurysm. Computational fluid dynamic study of 20 middle cerebral artery aneurysms. Stroke 35, 2500–2505. ( 10.1161/01.STR.0000144648.89172.0f) [DOI] [PubMed] [Google Scholar]
- 17.Cebral JR, Castro MA, Burgess JE, Pergolizzi RS, Sheridan MJ, Putman CM. 2005. Characterization of cerebral aneurysms for assessing risk of rupture by using patient-specific computational hemodynamics models. Am. J. Neuroradiol. 26, 2550–2559. [PMC free article] [PubMed] [Google Scholar]
- 18.Biasetti J, Hussain F, Gasser TC. 2011. Blood flow and coherent vortices in the normal and aneurysmatic aortas: a fluid dynamical approach to intra-luminal thrombus formation. J. R. Soc. Interface 8, 1449–1461. ( 10.1098/rsif.2011.0041) [DOI] [PMC free article] [PubMed] [Google Scholar]
- 19.Steinman DA. 2012. Assumptions in modelling of large artery hemodynamics. Model. Physiol. Flows 5, 1–18. ( 10.1007/978-88-470-1935-5_1) [DOI] [Google Scholar]
- 20.Bernardini A, Larrabide I, Morales HG, Pennati G, Petrini L, Cito S, Frangi AF. 2011. Influence of different computational approaches for stent deployment on cerebral aneurysm haemodynamics. Interface Focus 1, 338–348. ( 10.1098/rsfs.2011.0004) [DOI] [PMC free article] [PubMed] [Google Scholar]
- 21.Sheard GJ. 2009. Flow dynamics and wall shear-stress variation in a fusiform aneurysm. J. Eng. Math. 64, 379–390. ( 10.1007/s10665-008-9261-z) [DOI] [Google Scholar]
- 22.Salsac A-V, Sparks SR, Chomaz J-M, Lasheras JC. 2006. Evolution of the wall shear stresses during the progressive enlargement of symmetric abdominal aortic aneurysms. J. Fluid Mech. 560, 19–51. ( 10.1017/S002211200600036X) [DOI] [Google Scholar]
- 23.Ooij P, Guédon A, Poelma C, Schneiders J, Rutten MCM, Marquering HA, Majoie CB, Vanbavel E, Nederveen AJ. 2011. Complex flow patterns in a real-size intracranial aneurysm phantom: phase contrast MRI compared with particle image velocimetry and computational fluid dynamics. NMR Biomed. 25, 14–26. ( 10.1002/nbm.1706) [DOI] [PubMed] [Google Scholar]
- 24.Lasheras JC. 2007. The biomechanics of arterial aneurysms. Annu. Rev. Fluid Mech. 39, 293–319. ( 10.1146/annurev.fluid.39.050905.110128) [DOI] [Google Scholar]
- 25.Ku DN. 1997. Blood flow in arteries. Annu. Rev. Fluid Mech. 29, 399–434. ( 10.1146/annurev.fluid.29.1.399) [DOI] [Google Scholar]
- 26.Trip R, Kuik DJ, Westerweel J, Poelma C. 2012. An experimental study of transitional pulsatile pipe flow. Phys. Fluids 24, 014103 ( 10.1063/1.3673611) [DOI] [Google Scholar]
- 27.Winter DC, Nerem RM. 1984. Turbulence in pulsatile flows. Ann. Biomed. Eng. 12, 357–369. ( 10.1007/BF02407780) [DOI] [PubMed] [Google Scholar]
- 28.Kuik DJ, Poelma C, Westerweel J. 2010. Quantitative measurement of the lifetime of localized turbulence in pipe flow. J. Fluid Mech. 645, 529–539. ( 10.1017/S0022112009993065) [DOI] [Google Scholar]
- 29.Gijsen FJH, Van de Vosse FN, Janssen JD. 1999. The influence of the non-Newtonian properties of blood on the flow in large arteries: steady flow in a carotid bifurcation model. J. Biomech. 32, 601–608. ( 10.1016/S0021-9290(99)00015-9) [DOI] [PubMed] [Google Scholar]
- 30.Yagi T, Sato A, Shinke M, Takahashi S, Tobe Y, Takao H, Murayama Y, Umezu M. 2013. Experimental insights into flow impingement in cerebral aneurysm by stereoscopic particle image velocimetry: transition from a laminar regime. J. R. Soc. Interface 10, 20121031 ( 10.1098/rsif.2012.1031) [DOI] [PMC free article] [PubMed] [Google Scholar]
- 31.Ford MD, Piomelli U. 2012. Exploring high frequency temporal fluctuations in the terminal aneurysm of the basilar bifurcation. J. Biomech. Eng. 134, 091003 ( 10.1115/1.4007279) [DOI] [PubMed] [Google Scholar]
- 32.Reynolds WC, Hussain AKMF. 1972. The mechanics of an organized wave in turbulent shear flow. part 3. Theoretical models and comparisons with experiments. J. Fluid Mech. 54, 263–288. ( 10.1017/S0022112072000679) [DOI] [Google Scholar]
- 33.Valen-Sendstad K, Kent-André M, Steinman DA. 2013. High-resolution CFD detects high-frequency velocity fluctuations in bifurcation, but not sidewall, aneurysms. J. Biomech. 46, 402–407. ( 10.1016/j.jbiomech.2012.10.042) [DOI] [PubMed] [Google Scholar]
- 34.Valen-Sendstad K, Steinman DA. 2014. Mind the gap: impact of computational fluid dynamics solution strategy on prediction of intracranial aneurysm hemodynamics and rupture status indicators. Am. J. Neuroradiol. 35, 536–543. ( 10.3174/ajnr.A3793) [DOI] [PMC free article] [PubMed] [Google Scholar]
- 35.Bazilevs Y, Hsu M-C, Zhang Y, Wang W, Liang X, Kvamsdal T, Brekken R, Isaksen JG. 2010. A fully-coupled fluid–structure interaction simulation of cerebral aneurysms. Comput. Mech. 46, 3–16. ( 10.1007/s00466-009-0421-4) [DOI] [Google Scholar]
- 36.Villa-Uriol MC, et al. 2011. @neurIST complex information processing toolchain for the integrated management of cerebral aneurysms. Interface Focus 1, 308–319. ( 10.1098/rsfs.2010.0033) [DOI] [PMC free article] [PubMed] [Google Scholar]
- 37.Pope SB. 2000. Turbulent flows. Cambridge, UK: Cambridge University Press. [Google Scholar]
- 38.Eckmann J-P. 1981. Roads to turbulence in dissipative dynamical systems. Rev. Mod. Phys. 53, 643–654. ( 10.1103/RevModPhys.53.643) [DOI] [Google Scholar]
- 39.Hoarau Y, Braza M, Ventikos Y, Faghani D, Tzabiras G. 2003. Organized modes and the three-dimensional transition to turbulence in the incompressible flow around a NACA0012 wing. J. Fluid Mech. 496, 63–72. ( 10.1017/S0022112003006530) [DOI] [Google Scholar]
- 40.Byrne G, Cebral J. 2013. Vortex dynamics in cerebral aneurysms. (http://arxiv.org/abs/1309.7875)
- 41.Baek H, Jayaraman MV, Richardson PD, Karniadakis GE. 2010. Flow instability and wall shear stress variation in intracranial aneurysms. J. R. Soc. Interface 7, 967–988. ( 10.1098/rsif.2009.0476) [DOI] [PMC free article] [PubMed] [Google Scholar]


