

Abstract
Neutron reflection (NR) from planar interfaces is an emerging technology that provides unique and otherwise inaccessible structural information on disordered molecular systems such as membrane proteins associated with fluid bilayers, thus addressing one of the remaining challenges of structural biology. Although intrinsically a low-resolution technique, using structural information from crystallography or NMR allows the construction of NR models that describe the architecture of protein-membrane complexes at high resolution. In addition, a combination of these methods with molecular dynamics (MD) simulations has the potential to reveal the dynamics of protein interactions with the bilayer in atomistic detail. We review recent advances in this area by discussing the application of these techniques to the complex formed by the PTEN phosphatase with the plasma membrane. These studies provide insights in the cellular regulation of PTEN, its interaction with PI(4,5)P2 in the inner plasma membrane and the pathway by which its substrate, PI(3,4,5)P3, accesses the PTEN catalytic site.
Keywords: PTEN, protein-membrane complex, phosphatidylinositolphosphate, phosphatidylserine, neutron reflection, tethered bilayer lipid membranes, molecular dynamics simulations
1. Introduction
High-resolution structural studies of membrane-associated proteins that reside in or peripherally interact with disordered phospholipid bilayers are rarely performed because these systems are difficult to handle and characterize. Nevertheless, biological membranes – exquisitely complex, tightly controlled systems composed of hundreds of lipid species and an even greater number of proteins – determine selective streams of energy and information, as well as nutrients and wastes, across the physical barriers they form between the inside and outside of each cell and between organelles. Moreover, cellular membranes are also mediators of signaling within the cell, as a two-dimensional matrix at which regulatory pathways are organized to allow the multitude of essential protein-protein interactions. Thereby, they constitute high-value targets for methods development in structural biology.
Surface reflection techniques using x-rays or neutrons with fluid-immersed biomimetic samples provide structural information that is inaccessible to the workhorses of structural biology – x-ray crystallography, NMR spectroscopy and cryo-electron microscopy, albeit typically at lower than atomic-scale resolution. However, this lack of detail can be offset by employing MD simulations which offer tunable resolution, depending on grain size and parameterization – all the way down to atomic resolution in all-atom simulations. However, they often lack cross-referencing to experimental results, in particular because of the lack of suitable experimental tools. Here, we describe a combination of neutron reflectometry and computational simulation that complement each other to provide a structural characterization of membrane-associated proteins embedded in fluid phospholipid bilayers. While this methodology is generic and can potentially benefit many investigations of relevant membrane proteins and protein complexes, we limit our view selectively to the membrane structure of the PTEN tumor suppressor which is as of yet the best-studied system in our lab.
In order to obtain high-resolution information by any structural technique, it is mandatory to isolate the system under study. X-ray crystallography requires the purification of a protein or protein complex in a detergent solution, lipid nanodisc or lipidic cubic phase. NMR requires highly purified protein in solution or in oriented membrane samples at extremely high concentration. Cryo-electron microscopy requires a homogenous protein or protein/membrane preparation, albeit at low concentration, that is injected into an effective cryogenic agent. Similarly, in recent years we optimized a synthetic lipid bilayer model that facilitates structural studies of membrane-associated proteins with NR. These lipid membranes are surface-stabilized, planar, and fluid. They are comprised of just one single lipid bilayer. They can be analyzed in multiple steps, such that protein reorganization following external stimuli, such as pH changes, ligand binding events, sequential protein-protein interactions, etc., can be recorded and analyzed. Protein structures can be determined with confidence from samples that contain only 1011 – 1012 individual molecules at the bilayer. As in other areas of structural biology, structural models gain significantly if one can integrate complementing information, for example, x-ray crystal or NMR structures. Without reference to an MD simulation, one can routinely locate such structures with a precision of ± 1 Å in a one-dimensional structural model, and orientations of the surface-associated proteins can be measured within a few degrees if the protein lacks radial symmetry. However, this assumes that the protein structure is conserved in the membrane-bound state, which is somewhat alleviated by the fact that NR does not have the intrinsic resolution to characterize small changes in protein organization. On the other hand, augmenting such experimentally determined structures with MD simulations overcomes this limitation and, as we discuss below for the high-resolution structure of membrane-bound PTEN, may determine subtle protein reorganizations induced interactions with the bilayer.
2. Methods [1]
2.1 The Neutron Reflection Method
NR is a scattering technique that is particularly well suited to investigate the structure of stratified interfaces (Fig. 1). In contrast to the well-established (X-ray or neutron) small-angle scattering techniques, SAXS and SANS, interaction of the probe beam with the sample occurs at a planar interface (Fig. 1A) which dictates that the scattering vector q⃗ is normal to that interface and the strongest scattering intensity is observed in the specular plane. Direct data inversion [2] or simultaneous model fitting of multiple reflectivity curves recorded with isotopically distinct bulk solvents [3] then provides an unambiguous, highly detailed structural profile normal to the interface. Distinct from solution small angle scattering, NR does not obtain information about the in-plane direction. However, three-dimensional structure reconstruction from small-angle scattering data is typically at low detail because of the isotropic averaging of the signal due to the random orientation of each scattering center.
Figure 1.
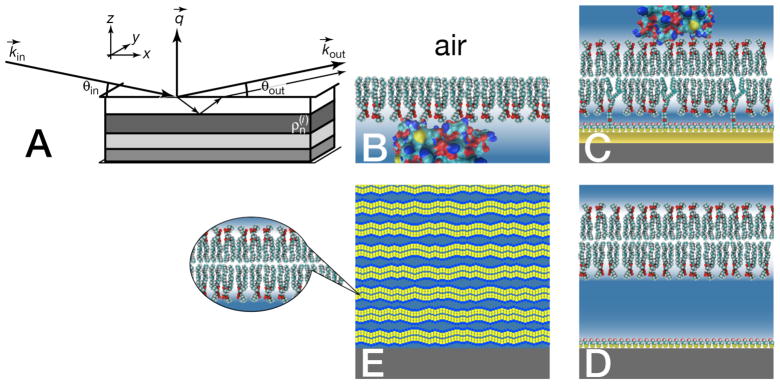
Kinematic scheme of the reflection of a collimated neutron beam from a structured interface (A), and experimental realizations for studies of protein interactions with model membranes: (B) Langmuir phospholipid monolayer on an open buffer surface (C) Single lipid bilayer tethered to a solid substrate (D) Floating lipid bilayer on solid substrate (E) Substrate-supported multibilayer stack
Practical considerations for obtaining high-resolution models of such interfaces require that the supporting substrate is planar and smooth on the atomic length scale. This is easiest to achieve by reflecting from a fluid surface, however, solid surface, such as Si wafers, can also be routinely prepared to meet these requirements. To obtain information on protein interaction with lipid membranes, two sample formats have been established: Floating lipid monolayers on aqueous sub-phases (Fig. 1B), considered a model of “half a bilayer”, and full bilayers attached to solid surfaces (Fig. 1C) in a way that leaves the membrane intact and conformal with a near-perfect substrate.
Using neutron reflectometry, structural information along the bilayer normal, z, is obtained by analyzing the specular reflection, in which the incident angle of the neutron beam equals the exit angle, θin = θout ≡ θ (Fig. 1A). A reflectivity curve is obtained by recording the reflectivity, R, which is the ratio of the reflected intensity over the incident intensity of the neutron beam, as a function of the momentum transfer, qz, of the neutron. The momentum transfer is strictly along z and has the magnitude
| (1) |
where λ is the neutron wavelength. Eq. (1) shows that q can be scanned by either varying λ at constant θ or by varying θ at constant λ. The first scheme is typically used at neutron spallation sources which create a bright polychromatic neutron beam pulse while the second scheme is typically applied at reactor-based neutron sources which provide a continuous beam of neutrons.
The scattering length density (SLD) of a material is a measure of the coherent scattering cross section, i.e., a quantity describing the likelihood that a neutron is scattered by any of the atoms in the material. The measured reflectivity, R = R(qz), of a structured interface is related to the SLD profile across the interface, ρ = ρ(z), through a Fourier transform and can be approximated‡ by Eq. (2) [4]:
| (2) |
RF – the Fresnel reflectivity – is the reflectivity originating from a single interface between the two semi-infinite media, for example, a silicon wafer and the adjacent aqueous bulk phase, and Δρ is their difference in SLD. Equation (2) shows that large gradients in ρ(z), brought about by molecular structures assembled at the interface, contribute greatly to deviations from the Fresnel reflectivity, giving rise to characteristic oscillations in the reflectivity curves. A connection between the chemical composition of the molecular species assembled at the interface and the SLD profile is provided by their chemical content and the molecular volumes associated with it:
| (3) |
where n is a number density and b is the scattering length of a molecular segment, such as a lipid head-group or a particular amino acid (AA) sidechain, and the index i enumerates all species of these functional segments in a microscopic volume V.
Equation (2) also shows that R(qz) cannot be directly inverted into an SLD profile, ρ(z), because it depends on the square of the Fourier integral – an exemplification of the phase problem in scattering. The typical solution in neutron reflectometry is to define an appropriate structural model and refine its parameters until the reflectivity computed from the model matches the data within experimental errors. Making use of prior information greatly reduces the number of appropriate models and the parameter space that has to be searched for a solution to the scattering problem [5].
Neutron scattering has the distinct advantage over x-ray scattering that two structurally and chemically identical samples that differ only in their isotopic composition, e.g., after exchanging 1H by 2H, give rise to substantially different scattering. Therefore for example, if one succeeds in preparing samples in which all H2O is exchanged for D2O, without changing the interfacial structure, one can determine a specific molecular configuration with much higher precision from the combined data set than from a single isotopic configuration. Taking advantage of this possibility can also to some extent alleviate the phase problem.
Multiple isomorphic isotopic contrasts give rise to as many SLD profiles [6] that are based upon one unique molecular configuration which can be presented as a component volume occupancy (CVO) distribution (see Fig. 2 and 3, below). CVO models provide an intuitive description of how the individual molecular components fill space. They also make efficient use of prior information about the molecular architecture, such as known molecular volumes, geometric constraints, molecular scattering lengths and chemical connectivity. For example, with currently available data quality, CVO models reliably extract protein volume distributions on membranes, i.e., their structural envelopes, if the protein fills 10% of the cross-section within a membrane or 5% of the cross-section adjacent to it. To prevent over-parameterization and under-parameterization, an accurate methodology is needed to establish confidence intervals for the resulting CVO profiles. We routinely use either a method based on Monte Carlo simulation [7] or Monte Carlo Markov Chains [8] to determine confidence intervals on all model parameters.
Figure 2.

Neutron reflectometry results and data modeling of wt PTEN on a DOPC stBLM with 30 mol% DOPS and 3 mol% cholesterol. (A): Neutron reflectivity data with experimental errors and best model fits of the as-prepared bilayer (red) and the bilayer after incubation with 20 μmol/L PTEN (black) in different isotopic bulk solvents. ‘CM4’ indicates a mixture of D2O:H2O ≈ 2 that results in an SLD of ≈ 4×10⁻⁶ Å−2. The gold film in this sample was bonded to the Si wafer by a Cr layer. Error-normalized residuals of the data with and without protein quantify changes due to protein association, showing statistically significant variations (5σ and more for qz < 0.1 Å−1). (B) Best-fit SLD profiles of the interfacial architecture. (C) Real-space CVO profiles from which (B) and the fits in (A) were calculated. Shown are only the gold film, the bilayer and its coupling chemistry and the membrane-associated PTEN. The PTEN envelope (median with 1σ confidence intervals) was modeled as a free-form Hermite spline. Confidence intervals for other parameter distributions (omitted for clarity) are significantly narrower than those for the protein CVO.
Figure 3.

Neutron reflectometry results and data modeling of wt PTEN on a DOPC stBLM with 29 mol% DOPS, 3.5% PI(4,5)P2 and 3 mol% cholesterol. Other details as in Fig. 2. The gold film in this sample was bonded to the Si wafer by a permalloy layer.
The implementation of polarization-encoded NR in which the beam is reflected from membrane-bearing surfaces on buried magnetic reference layers [9] increases the information content in the measurements, and thereby the effective resolution [10] of the experiment further. However, this technique requires longer measurement time because the unpolarized neutron beam is split into its polarization components, and the intensities of the reflected polarized beams are separately determined.
2.2 The Neutron Reflection Experiment
The requirement for interface planarity in neutron reflectometry presents challenges for sample preparation. In particular from a biophysics perspective, it is more difficult to prepare sample formats that mimic free bilayers, the paradigmatic model of a cellular membrane. The closest approach to this paradigm in neutron reflectometry was achieved with floating bilayers [11, 12], Fig. 1D, but their practical use is limited because such bilayers can only be stabilized at the interface in a narrow window of experimental conditions. Stacked multi-bilayer samples [13], shown in Fig. 1E, can be formed with high reproducibility under a wide range of experimental conditions. They consist of several thousand bilayers with an inter-bilayer spacing of 10 – 20 Å, depending on osmotic pressure, temperature and level of hydration [14–18], and have been extensively studied with diffraction techniques. Such multibilayers can also prepared in the presence of (small) peptides and utilized in studies of peptide organization in membranes [19, 20]. A flexible tool to investigate peptide and protein interactions with a membrane surfaces is the floating Langmuir monolayer (Fig. 1B). Lipid monolayers have been extensively investigated for their lipid phase structures [21, 22] and have served as a matrix for protein crystallization [23] and as a simple model system to develop parametrization schemes for lipid structure in membranes [24, 25]. Their lateral lipid density can be varied over a large range to determine the dependence of protein adsorption on lipid status [26]. On the other hand, since Langmuir monolayers lack the twin monolayer sheet, there is a residual pressure that is not compensated. The question which monolayer pressure is equivalent to the state of lipid leaflets within a bilayer membrane [27] may therefore be ill-posed.
The system that is most flexible, and has been most extensively studied, in the context of biological relevance are single bilayer membranes adsorbed to a solid substrate [28, 29]. Such systems in which the lipid membrane is separated from its solid support by an ultrathin ‘cushion’ layer have been proposed as general vehicles to mimic biophysical processes relevant to membrane biology [30], and many types of this general scheme have been implemented [31–47]. A large number of adsorbed, chemisorbed and tethered membrane architectures were thoroughly investigated with reflection techniques [37, 48–50]. We developed a membrane architecture in which a short poly(ethylene oxide) chain tethers a dual-chain lipid to a gold surface via thiol chemistry [51], and similar systems have been explored by others [44, 45, 47, 52]. β-Mercaptoethanol (βME) serves as a ‘back-filler’ molecule to laterally space the membrane tether that anchors a single phospholipid bilayer to the atomically flat, 100 – 1,000 Å thick gold-film on a glass or Si surface [7, 53, 54]. The membrane is either precipitated from solvent [43] or formed by vesicle fusion [55] to complete the membrane structure, which thus forms a sparsely-tethered bilayer lipid membrane (stBLM) [53]. Such stBLMs are in-plane fluid with diffusional mobilities of the lipids that are close to that in free bilayers [56]. Therefore, they are exquisitely suited to mimic the lipid component of biological membranes which has been exploited in numerous studies [51, 57–60]. Importantly, stBLMs prepared by rapid solvent exchange [43] show extremely low defect densities [53] that can be exploited for studies of bilayer conductivity with high sensitivity [57, 58] and precise measurements of protein association with the membrane by surface plasmon resonance (SPR) [61] without the need of defect blocking. In the context of NR, these systems are particularly attractive because of their long-term stability [62] which permits measurements of the membrane in different states of completion [53], prior to or after protein adsorption or incorporation [58] and under distinct buffer contrast [51]. As shown for a wide range of protein systems [51, 57, 58, 60, 61, 63, 64], this can be advantageously exploited to characterize the structure of membrane-associated proteins at high out-of-plane and orientational resolution.
The quality of the CVO profile is limited by the maximum momentum transfer for which neutron reflectometry data can be collected at an acceptable signal-to-noise ratio [65]. While the statistical quality of the data is improved by increasing the neutron flux, this does not improve the signal-to-noise ratio, which is, however, the critical quantity, in particular at high q where background scattering from the sample dominates. Therefore, improvements of data quality are achieved through the reduction of the background by eliminating dispensable sources of scattering. In addition, the signal amplitude can be increased by minimizing the interfacial roughness of the supporting substrate, and consequentially, of the interfacial molecular architecture [66]. At the NIST Center for Neutron Research (NCNR), a background-optimized sample flow cell [67] that exposes a 100 μm thin aqueous reservoir to the neutron beam is used to minimize background. This aqueous reservoir is sandwiched between two Si wafers. The surface of the sample wafer is polished to Å-scale residual roughness and terminated with an optimized metal film (functionalized gold layer) that keeps the membrane-bearing surface at a RMS roughness < 7 Å.
The NCNR liquid flow cell is equipped with fluid inlets that allow for in situ sample preparation, and manipulation. During a typical experiment, the as-prepared bilayer is characterized at least in two different isotopic bulk solvent contrasts. Thereafter, protein is added and measured using again in multiple contrasts. The membrane-bound protein may then be manipulated in situ and the structural consequence of this manipulation determined in further measurements. The properties of the protein, in particular its membrane-binding kinetics and aggregation behavior, determine whether a measurement is better carried out while the protein remains in solution or following incubation and rinsing. Data collection typically takes a few hours for a reflectivity curve at a single contrast [68]. Complementary techniques, such as surface plasmon resonance (SPR) are therefore indispensable to characterize the protein-membrane system before a neutron experiment is attempted. The entire set of neutron reflectometry data is analyzed in a simultaneous fit that shares model parameters between the individual reflectivity curves, for example those describing the invariant substrate.
2.3 Molecular Dynamics Simulations of Membrane Proteins
Integrative methods that invoke MD are gaining more and more traction in structural biology [69, 70]. While the simultaneous fitting of complementary NR data sets and the incorporation of complementing information, such as volumetric data or chemical connectivity, boosts the resolution afforded by molecular models appreciably – as shown above – connecting these models with MD simulations has the potential to reveal atomistic details. Given the low intrinsic resolution of scattering experiments and the dependence of MD results on the precision of the underlying parameterization, one might argue that in such a procedure the blindman assists the lame. Nevertheless, substantial progress has been made in both directions: High-quality data on the experimentally determined structure of substrate-supported bilayers [71] were used to improve the quality of lipid parameter sets in MD [72], and MD simulations that were entirely independent from experiment reproduced with confidence the structural properties of the PTEN-membrane complex determined with NR [61]. In that sense, scattering data and MD results have been successfully combined to cross-validate each other [64]. In this spirit, combining MD with scattering approaches has the potential to provide atomically resolved structures of otherwise inaccessible systems that are our best guess, given all information at hand.
In solution and in association with fluid lipid membranes, proteins are structurally dynamic molecules whose conformational states are inherently tied to their biological function. In addition, many proteins incorporate intrinsically disordered regions. Rather than adopting a single rigid structure, proteins thereby form ensembles of varied conformational states that are governed by complex potential energy surfaces. NR determines the average density distribution of these ensembles of conformational states projected on the membrane normal. MD simulations provide a method to interpret these results and assess the dynamic interconversion between conformational states that underlies these ensemble averages. However, the capability to represent the potential energy landscapes and sample thermally accessible conformational states depends on the accuracy of the empirically derived force fields. Recent refinements of all-atom force fields have increased the accuracy of secondary structure prediction and stability in protein folding simulations [73, 74]. Updated lipid parameters have also improved the predictive power for structural properties of membrane simulations [72], including lipid groups containing poly-unsaturated tails and unconventional headgroups such as those of PIPs [75]. With computational resources growing ever more powerful [76], comparisons between experimental results and molecular simulations of complex protein-lipid systems have greatly gained traction and are becoming routine [63, 77].
3. The PTEN-Membrane Complex – A Paradigm for Peripheral Protein Association with the Lipid Bilayer
Lipid-mediated signaling utilizes the chemical diversity of phosphatidylinositolphosphates (PIPs) to control vital cell functions by spatially and temporally organizing chemical patterns on cellular membrane interfaces. Interconversion by kinases and phosphatases of lipidic PIPs in which the 3, 4 and 5 positions on the inositol ring show distinct phosphorylation patterns form the chemical “hardware” for various signaling pathways [78], such as the PI3K/Akt pathway [79, 80], which regulates a wide spectrum of processes, including cell survival, proliferation, cell architecture and metabolism and presents an exquisite example for lipid-mediated signaling with molecular selectivity and spatiotemporal control. Within the pathway, the PTEN phosphatase acts as a PI3K antagonist that controls PI(3,4,5)P3 levels in the inner leaflet of the plasma membrane (PM), which, if unchecked, leads to unconditional cell growth and survival. This critical function makes PTEN one of the most frequently mutated genes in human cancer [81]. While the PTEN phosphatase also fulfills critical roles in chromosome maintenance in the nucleus [82] and was recently also reported to associate with intracellular membranes [83], its role in PI(3,4,5)P3 dephosphorylation and cellular control of PM association is the aspect of PTEN function that is best characterized. Here we review how surface-sensitive characterization techniques, most notably NR, sheds light on PTEN membrane association and the structure of the PTEN-membrane complex.
3.1 Why Study Membrane Proteins in Artificial Settings?
Neutron reflection studies as those described above are largely limited to artificial systems because interpretation of SLD profiles in terms of molecular compositions, and thus CVO profiles, is only achieved in well-defined molecular settings. While the PM of whole cells can be characterized with surface-sensitive scattering techniques at engineered surfaces [84], information on membrane composition and membrane constitution is limited in such experiments because the SLD distribution is hard to decompose into individual molecular contributions. Moreover, cell membranes are inevitably heterogeneous in-plane, which further complicates a molecular interpretation of scattering experiments.
While investigations in well-defined synthetic sample formats, on the other hand, are limited in their biological relevance, such experiments provide important ancillary information. The PTEN phosphatase is known to undergo substantial post-translational modification, most prominently, phosphorylation of its C-terminal tail [85, 86]. In addition, PTEN engages in a large set of protein-protein interactions, and covalent protein modifiers were recently proposed as obligate cofactors for PTEN membrane association and PIP dephosphorylation [87, 88]. Our recent studies of bacterially expressed PTEN on stBLMs show clearly that PTEN does not require post-translational modifications or cellular cofactors to associate with the lipid bilayer surface with or without PIP lipids. Moreover, SPR investigations showed clearly the roles of various lipid components in the bilayer in recruiting the phosphatase to the membrane [61]: The phosphatidylserine (PS) component of the inner PM provides an electrostatic background that drives PTEN adsorption to the membrane surface (equilibrium dissociation constant, Kd ≈ 10 μmol/L). However, the affinity to PI(4,5)P2-containing membranes devoid of PS is considerably higher (Kd ≈ 0.4 μmol/L). It increases by yet another order of magnitude if both PS and PI(4,5)P2 are present in the membrane (Kd ≈ 40 nmol/L). This example shows clearly how synergetic contributions of membrane components to protein binding can be disentangled in in vitro settings.
3.2 NR Investigations of the PTEN-Membrane Complex
The interaction of wild-type (wt) PTEN with stBLMs prepared from lipid mixtures of (A) DOPC containing 30% DOPS and 3% cholesterol, and (B) DOPC containing 29% DOPS, 3.5% PI(4,5)P2 and 3% cholesterol was structurally characterized using NR [61]. Following an initial characterization of the neat lipid bilayer using three isotopic solvent contrasts, protein was added at a concentration of 20 μM in both cases. After incubation for 6 h, the protein was rinsed off and reflectivity curves were collected using two isotopic contrasts for each sample (Fig. 2A: DOPC:DOPS:chol, Fig. 3A: DOPC: DOPS:PI(4,5)P2:chol). Both data sets show large differences between the reflectivity curves collected before and after protein addition, exceeding five standard deviations at qz < 0.1 Å−1. For very small proteins or proteins at a low surface coverage, the differences are often smaller, and in some cases do not exceed two standard deviations. Nevertheless, protein envelopes can still be reliably determined in those cases. Figures 2B and 3B show the best-fit nSLD profiles that constitute a stage of data evaluation intermediate between the fitting of the reflectivity curve and the real-space modeling of the interfacial structure using CVOs.
The final CVO profiles are shown in Figs. 2C and 3C, respectively. The stBLM was parameterized using an established model [5] and the associated protein was described as a free-form Hermite spline [89]. Model parameter uncertainties were determined in a Monte Carlo Markov Chain procedure [8]. For both samples, the protein envelope extends ≈ 50 Å from the membrane surface and is anchored in the substrate-distal lipid headgroups without penetrating the hydrocarbon chains. The shape of the envelopes is asymmetric, showing a peak density ≈ 20 Å away from the membrane and a trailing shoulder. The protein forms a dense layer with a peak volume occupancy of ≈ 40% in both samples. The dimensions of the protein in solution support the interpretation that the interfacial layer of PTEN at the membrane is a monomolecular layer. Plugging independent structural information such as the (partial) x-ray crystal structure [90] (or an NMR structure) into the model can reveal critical information on the protein orientation at the membrane and the conformation of disordered protein segments not included in the crystal structure [61]. However, this and more detailed structural information on the protein-membrane complex can be more precisely derived from MD simulations, as shown below.
Table 1 shows biologically relevant parameters of the structural models of the two samples. Both stBLMs are essentially covering the interface completely, i.e., they are low in defect density. The latter shows a thickness of the outer lipid leaflet that is slightly lower than expected, which is often observed for membranes that are less than 100% complete. Protein incubation does not affect membrane completion or lipid leaflet thickness despite the high surface volume density of associated PTEN. Protein penetration into the bilayer is low: The PTEN phosphatase dips into the bilayer surface merely to the headgroup/hydrocarbon interface of the substrate-distal leaflet.
Table 1.
A selection of biological relevant parameters from the component volume occupancy modeling. Reported are median values and 68% confidence limits determined using a Monte Carlo Markov Chain.
| wt PTEN on PC:PS:chol stBLM | wt PTEN on PC:PS:chol:PI(4,5)P2 stBLM | |
|---|---|---|
|
| ||
| lipid hydrocarbon thickness | ||
| inner lipid leaflet | 16.3 ± 1.0 Å | 19.1 ± 1.1 Å |
| outer lipid leaflet | 12.8 ± 1.1 Å | 10.5 ± 0.8 Å |
| change upon protein incubation | + 0.1± 0.5 Å | + 0.9 ± 0.25 Å |
|
| ||
| membrane area per lipid | ||
| as prepared | 75 ± 6 Å3 | 91 ± 7 Å3 |
| after protein incubation | 74 ± 6 Å3 | 82 ± 7 Å3 |
|
| ||
| completeness of lipid bilayer | ||
| as prepared | 99 ± 2 % | 96 ± 3 % |
| after protein incubation | 98 ± 2 % | 97 ± 3 % |
|
| ||
| amount of surface-associated protein (volume surface density) | 8.3 ± 1.4 Å3/Å2 | 7.4 ± 0.7 Å3/Å2 |
|
| ||
| PTEN penetration into bilayer | 10.1 ± 2.3 Å | 9.7 ± 2.3 Å |
3.3 Refinement of PTEN Models by MD Simulations Validated Through NR Results
MD simulations of a protein-membrane complex entail generating equilibrated structures of the two components and combining them into a single, fully solvated system. For peripheral membrane proteins such as PTEN, the protein is initially placed distant from the membrane surface and allowed to dock with the bilayer over time. The simulations described below were set up using NAMD 2.9 [91] with the CHARMM22 CMAP correction [92] and CHARMM36 [72, 93] force field parameters to describe protein and lipids, respectively. To generate the membrane composition of interest, pre-equilibrated DOPC patches were stitched together to form a bilayer that consisted of 720 lipids (360 lipids per leaflet). DOPC molecules were randomly mutated to DOPS or PIPs to generate the desired compositions. Stearoylarachidinoylphosphatidylinositol was substituted with phosphates on the inositol ring to generate the PI(4,5)P2 and PI(3,4,5)P3. At neutral pH, the phosphate groups are 50–60% protonated [94]; however, protons do do not exchange between the phosphate groups in MD simulations. Therefore, the 5′ phosphate was chosen as the protonated group on PI(4,5)P2 while both the 3′ and 5′ phosphates were protonated on PI(3,4,5)P3 [95]. NaCl was added to neutralize the system and establish a concentration of 100 mM. The new bilayer systems were equilibrated for approximately 30 ns before PTEN was introduced.
The truncated PTEN crystal structure (PDB ID: 1D5R) [90] was supplemented with AAs 1–13, 282–312 and 352–411 for the simulation. Using SASSIE [96], extended conformations of the unstructured protein stretches were generated as starting configurations for the all-atom MD runs. Simulated annealing under elevated temperatures [64] was used to relax backbone torsion and steric clashes. After further 9 ns simulation at room temperature, the equilibrated full-length PTEN structure was combined with the equilibrated DOPC/DOPS or DOPC/DOPS/PIP membrane. The protein was centered with respect to the bilayer and placed away from its surface to form a ≈ 10 Å water layer between the protein and the lipid headgroups. An extra 40 Å depth of water was added along the bilayer normal to provide sufficient space for PTENs flexible tail. The simulation box then contained ≈ 104,000 water molecules. The final equilibration of the system was achieved by holding the entire protein structure fixed for 5 ns, followed by 5 ns under a 3 kcal/mol harmonic force constraint and another 5 ns under a 1 kcal/mol constraint. Finally, all constraints on the protein were released and the production run initiated. PTEN docked to the membrane surface after 60 – 100 ns of simulation time [64]. All subsequent analysis of the PTEN-membrane complex was performed after the docking event occurred.
Comparisons of PTEN-membrane complex structures from MD and NR were made in terms of their CVO profiles. Figure 4A shows full-length PTEN on a DOPC:DOPS = 7:3 membrane [64]. The CVO profile of PTEN, shown in blue in Fig. 4A, is an average over ~ 300 ns of the simulation trajectory and fits well within the 68% confidence bands of the experimental profile (red band). Both the phosphatase domain (PD) and C2 domain associate closely with the membrane surface and give rise to the peak density observed in the NR CVO attributed to the protein. This region was also well approximated by the crystal structure that contains the two core domains [61]. Some excess protein CVO density distal to the membrane is not well accounted for by the X-ray structure. It was therefore postulated that this region contains contributions from the tail [61], which represents the major portion of the protein clipped for crystallization. The overall envelope profile determined from MD was dissected into individual distributions of different molecular regions, as shown in Fig 4A. During the simulation, the initially extended, highly acidic tail (excess charge: −10e) collapsed quickly into a dynamic coil structure and remained at a distance from the acidic membrane surface during the entire simulation, apparently due to electrostatic repulsion. The resulting organization of the tail in connection with the clipped loop in the C2 domain (AAs 286–309) indeed accounts well for the observed excess density that is not accounted for by placing the crystal structure into the experimental CVO profile.
Figure 4.
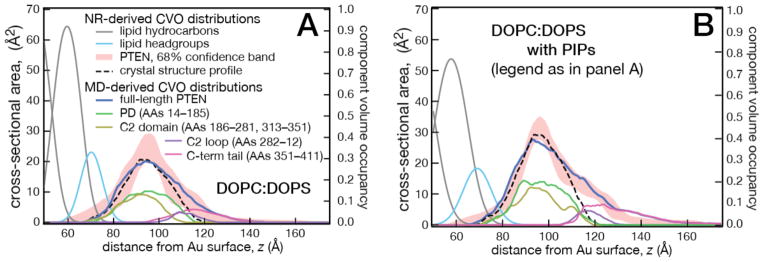
Comparison of COV profiles from NR and MD simulations. (A) Full-length wt PTEN on a DOPC:DOPS (7:3) bilayer. (B) PTEN on a PI(4,5)P2-containing bilayer. The membrane composition was DOPC:DOPS:PI(4,5)P2 = 67.5:29:3.5 in NR experiments and 70:26:4 in MD simulations. The experimental PTEN CVO profile is shown as a 68% confidence band. CVO contributions of different protein regions determined from MD are also shown. Profiles from MD are averaged over 300 ns.
In a recent set of simulations, we examined the interaction of PTEN with PIPs. PI(4,5)P2, a key component for high affinity membrane binding and plasma membrane specificity, and PI(3,4,5)P3, the catalytic target of PTEN, were studied in DOPC/DOPS membranes. A long simulation was conducted of a DOPC membrane containing 29 mol% DOPS and 3.5 mol% PI(4,5)P2 to mimic experimental NR measurements. CVO profiles derived from MD simulations and NR experiments are compared in Fig. 4B. Without knowledge of the MD-derived structure, the PTEN crystal structure can be placed to describe the peak protein density near the membrane surface satisfactorily, as for the DOPC/DOPS membrane, and again this protein fragment alone misses the CVO distribution distal to the bilayer. On the other hand, the MD-derived CVO profile, which accounts for the entire protein, matches the experimental confidence bands and places the tail and the C2 loop distant from the membrane surface.
While so far only protein segment organization at the membrane surface was discussed, MD simulations provide significantly more detail, and the excellent low-resolution agreement with the NR results provides confidence that these more detailed MD results are adequate descriptions of the structure of the PTEN/membrane complex. For example, it should be expected that PI(4,5)P2, in low abundance in the inner PM, may cluster in the vicinity of adsorbed PTEN due to electrostatic attraction. To investigate lipid redistribution, a thorough sampling of lipid dynamics and organization required longer simulation times. Sampling was extended an order of magnitude longer than in our previous work [64], to 4 μs, using the Anton supercomputer [76]. Because we were primarily interested in the membrane binding interface, the tail was truncated in the longer simulation to reduce system size. In addition, one of the PI(4,5)P2 molecules in the simulation was modified to a PI(3,4,5)P3 to further investigate interactions of the enzymatic target with PTENs PD domain.
The AA residues that comprise the membrane binding interface were determined by the measuring orientation and penetration depth of PTEN on the membrane. The orientation was defined in terms of the inclination a principal axes against the membrane normal (‘tilt’) and the rotation of the longest principal axis about the tilt axis. Figure 5 shows the dynamic fluctuations in PTEN orientation (panel A) and its averaged distribution (B). PTEN inclination is fairly stable, rocking only about 10° from its average position, while the rotation is more dynamic. However, because the tilt is generally < 30°, PTEN rotation about its tilt axis does not alter the membrane binding interface significantly over time.
Figure 5.
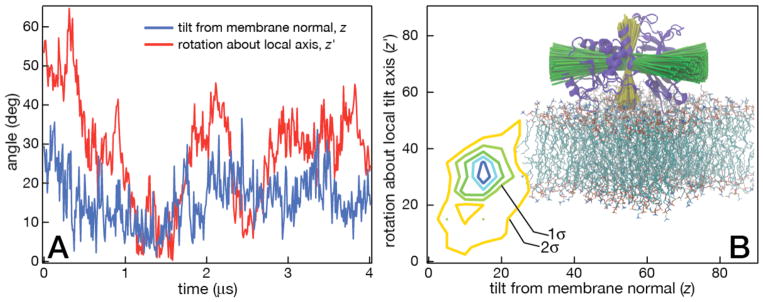
Dynamics and average orientation of PTEN bound to a DOPC:DOPS:PIP2 membrane. The reference frame for protein orientation uses the principal axes of the crystallized protein core (PD and C2) [90], with the longest principal axis aligned with x and the second longest principal axis aligned with z (the membrane normal). (A) Fluctuations of PTEN orientation are small (± 15°) over the entire 4 μs trajectory. At this small inclination of the axis against the membrane normal PTEN rotates about the z′ axis (the local tilt axis) with only small variation in its membrane binding interface. (B) Left: Contour plot of the averaged tilt and rotation showing the well-defined protein orientation on the membrane surface. Right: Superpositions of PTEN principal axes of PTEN from several simulation snapshots visualize the degree of rocking and spinning of the protein.
There is controversy in the literature as to which PTEN residues are critical for membrane binding. For example, it was reported that SUMOylation of K254 or K266, in the CBR3 membrane-binding motif of the C2 domain, is required for efficient PTEN membrane binding [87]. This is at odds with the experimental finding that recombinant PTEN binds membranes in vitro [61, 90] and in vivo [97], as evidenced by enzymatic activity. To identify AAs important for membrane anchoring, lipid residence times in contact with individual PTEN AA residues were calculated. In Fig. 6A, we compare the results for PS in the PIP-free membrane with those for PS and PIP in the PIP-containing membrane. Clusters of contacts are revealed on both C2 and PD for both lipid types. Contacts with PIPs are much longer than those with PS, reflecting a stronger electrostatic interaction with these highly charged lipid head-groups. A mapping of these residues onto PTENs crystal structure is shown in Figure 6B. The CBR3 loop (PTEN260–269) with its basic AAs (K260, K263, K266, K267 and K269) binds strongly to PS and PIPs, and its hydrophobic L265 sidechain snorkels into the hydrophobic membrane core [64]. In PIP-containing membranes, K221 and K223 and surrounding residues that line the cleft between the PD and C2 domain also coordinate PIP. In the PD, a group of AAs around K128 forms prolonged contacts with PI(3,4,5)P3. In fact, once PI(3,4,5)P3 binds to this ligation site on the surface of the PD domain, it is held there for the remaining duration of the simulation. The coordination of PI(3,4,5)P3 to K128 is reinforced by K163, R161, R47 and the N-terminal Met (see Fig. 7), which is also close to K128. The PD also intermittently captures a PI(4,5)P2 at R41 and nearby residues, including R47, with a loop, located between pβ2 and pα1, that dips into the bilayer surface.
Figure 6.
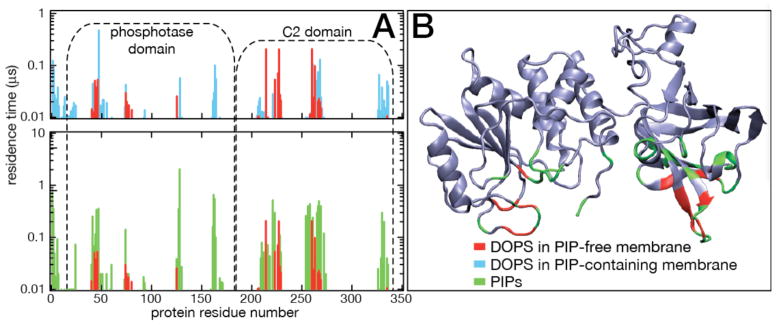
Dynamics of lipid binding to PTEN residues that form the membrane binding interface. (A) Residence times of lipids at specific AAs extracted from the DOPC:DOPS and the DOPC:DOPS:PIP2:PIP3 simulations. Residence times < 5 ns are omitted. Top: A comparison of DOPS residence times shows how PIP association with AAs on PTENs membrane binding interface suppresses PS protein associations that take place in the absence of PIPs. Bottom: A comparison of PIP association with that of DOPS in the absence of PIPs illustrations how much stronger the inositolphosphates bind to the protein than PS. The emergence of lipid contacts near residue nos. 163 and 330, only observed in the PIP-containing membrane, indicates that the phosphatase is slightly deeper immersed into the bilayer surface when bound to PIPs than in the PIP-free membrane. (B) Map of lipid contacts on the PTEN crystal structure. The color code for lipids associated with PTEN AA residues is the same in both panels.
Figure 7.
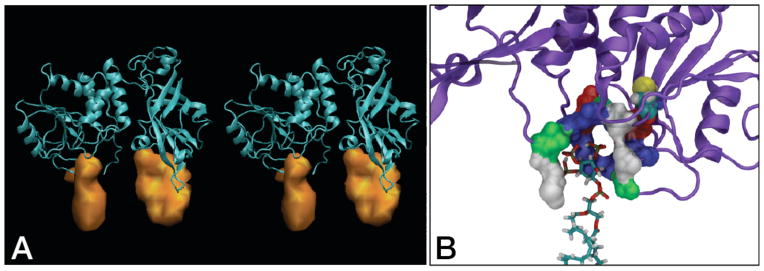
Time-averaged density distributions of PI(4,5)P2 and PI(3,4,5)P3 ligated by PTEN in the DOPC:DOPS:PIP2:PIP3 simulation. (A) Stereogram of PTEN with the distribution of associated PIPs. The PTEN protein is shown with the PD on the left and the C2 domain on the right. The PIP distribution depicted under the PD is that of PI(3,4,5)P3 bound to its ligation site below the catalytic pocket. Several PI(4,5)P2 molecules that interchange at a slow rate form the density shown below C2. (B) Magnified view of the PI(3,4,5)P3 coordination on the PD, rotated from the view in panel (A) by ≈ 180° about the membrane normal. Residues that make up the PI(3,4,5)P3 ligation site are shown in space filling and color-coded according to residue type (blue – basic, red – acidic, green – polar, white – hydrophobic). C124 in the catalytic site, also shown in space filling, is located above and to the right of the bound PI(3,4,5)P3. R47, K128 and K163 bind electrostatically to PI(3,4,5)P3 and form the blue contours surrounding the lipid headgroup. The N-terminal Met shown as a white contour on the left. M1 snorkels its hydrophobic sidechain towards the lipid chains and points its charged amine group towards the inositolphosphates, thus forming both hydrophobic and electrostatic interactions with PI(3,4,5)P3.
The time-averaged PIP organization within the protein footprint on the membrane is visualized in Fig. 7A, and overlaid with a snapshot of lipid configurations. An accumulation of PI(4,5)P2 is observed at the C2 domain which populates the CBR3 loop and the cleft between the C2 and PD. This region accommodates two to three PI(4,5)P2 that exchange dynamically between each other and free membrane PIPs on a time scale of hundreds of ns. The PD has two distinct PIP binding sites: a cluster of basic residues between pβ2 and pα1, and the PIP3 binding pocket. Figure 7B shows the residue surfaces, encoded by residue type, that form the PI(3,4,5)P3 ligation site and their sidechain arrangements around the lipid headgroup. The site is formed by four basic residues that provide charge complementarity to the anionic lipid and the positively charged N-terminus of M1. In addition, the hydrophobic M1 side-chain snorkels into the membrane and interacts with the PI(3,4,5)P3 hydrocarbon chain. The enzymatic site centered at C124 is located only a few Ångstrom above the PIP3 ligation site. While direct interaction of PIP3 with C124 was not observed during the simulation run, a translation of the lipid by ≈ 5 Å would deliver the substrate into the catalytic site. Thus the ligation of PI(3,4,5)P3 on the PD just outside of the catalytic pocket observed in this simulation is conceivably an intermediate step in the PIP3 hydrolysis pathway.
4 Discussion and Outlook
Neutron reflection measurements in conjunction with molecular dynamics simulations provide a new and unique window into the structural biology of protein-membrane complexes. Reviewing recent investigations of the membrane association of the PTEN phosphatase, we demonstrate here the level of detail that can be deduced from such combined studies. With the knowledge of the partial crystal structure, NR was used to characterize the overall structure of the PTEN-membrane complex [61]. In this work, the precise determination of the protein orientation on the membrane in combination with the penetration depth into the bilayer defined the membrane binding interface of the phosphatase. In addition, NR showed that the disordered tail is repelled form the bilayer upon membrane binding. The biological function of PTEN as a phosphatase at the plasma membrane depends strongly on its interactions with PI(4,5)P2. Binding measurements on stBLMs showed that a physiologically small concentration of PI(4,5)P2 in the membrane increases membrane affinity significantly and, in conjunction with PS, leads to a strong association of PTEN with the target membrane. To understand how PIP-specificity is achieved in the binding event, the AA residues that comprise the PTENs membrane binding interface were identified by combining NR with MD simulations.
As shown above, NR provides structural information of membrane proteins associated with fluid lipid bilayers in their physiologically relevant aqueous environment. Utilizing the exquisite sensitivity of NR for low-atomic number materials (i.e., protein, lipid and solvent), we developed models of the biomimetic interface in the form of CVO profiles of the membrane components. As shown in Figs. 2 and 3, we observed that PTEN is peripherally bound to the bilayer where it only inserts into the lipid headgroup region. The width of the peak protein density near the membrane surface (≈ 35 Å) suggested that PTEN binds the membrane with both the C2 domain and PD collectively forming the membrane binding interface. A superposition of the truncated crystal structure onto the CVO profile of the protein supported this interpretation (Figs. 3A and B). However, excess protein contributions to the scattering were not accounted for by the x-ray structure end were tentatively attributed to PTENs unstructured regions, i.e., the tail and the C2 loop. MD simulations of the full-length protein, set up to mimic the experimental conditions of the NR measurements, reproduced the CVO profiles well. This agreement between the two independent methods validated the simulation results and verified the tentative localization of the proteins unstructured regions.
A more detailed analysis of the MD results provided a detailed account of the molecular interactions of PTEN with the membrane lipids. Comparing the PIP-free and the PIP-containing membrane simulations we observed very similar binding orientations of the protein. Many of the residues that formed strong interactions with DOPS in the PIP-free bilayers also formed prolonged contacts with PIPs. However, one also observes three AA clusters that are recruited into lipid associations by the PIPs (Fig. 6A), i.e., they only form lipid associations on the PIP-containing bilayer. These clusters are located at the N-terminal tail, around R161/K163/K164 and at the cα2 motif around N329/K330. The appearance of these new lipid contact suggests that the penetration of the protein into the bilayer is slightly increased by its enhanced interaction with the PIP-containing membrane. This incrementally deeper penetration of the bilayer is not resolved by NR (Table 1), as such level of detail is clearly beyond the capabilities of scattering experiments.
Average lipid residence times, and reciprocally koff rates, of PIPs were an order of magnitude longer than those of PS. This can account for the smaller Kd values observed in SPR binding studies of PTEN to PIP-containing membranes. In the simulations, PIPs interact primarily with protein regions rich in Lys and Arg residues. Other AA residues reinforce this association by forming hydrogen bonds with inositol hydroxyl and phosphate groups, and in some cases hydrophobic sidechains snorkel into the membrane core. The CBR3 loop on C2 as well as the cleft between the C2 and PD form basic patches that cluster 2–3 PIPs which exchange dynamically on the of timescale of hundreds of ns. A ligation site close to the catalytic pocket of the PD captures a PI(3,4,5)P3 and holds the molecule for several μs. This unusually long dwell time and, hence, strong association may contribute to the observed orientational stability of PTEN on the membrane and could be functionally relevant for the delivery of the substrate to the catalytic site.
As a model for membrane-associated proteins with intrinsically disordered regions, PTEN violates the paradigm of a simple structure-function relationship and poses a challenge to structural characterization. For example, PTENs tail has been reported to regulate membrane binding [98–100]. In combination, the localization of the tail by NR distal from the membrane surface and the more detailed assessment of its organization by MD show that the tail, while undergoing constant conformational rearrangement, is strongly repelled by the acidic membrane surface. On the other hand, sampling tail configurations in solution showed that the it can wrap around PTENs core domain, and thus block the membrane accessibility of the CBR3 loop [64]. More extensive, μs-long MD simulations confirm these results (not shown). Its intrinsic flexibility enables the tail to sample blocking and non-blocking conformations subject to a delicate energetic balance. Modifications, such as the phosphorylation of tail residues, may disturb this balance and favor one conformation over the other. Indeed, it is well established that the phosphorylation of a cluster of residues (S380, T382, T383 and S385) downregulates membrane binding and thus, PTEN activity [99].
Combining NR characterization with MD simulations has been highly informative for several systems of membrane-associated proteins, including HIV-1 Gag and Nef [59, 63, 77], as well as the PTEN protein discussed here. Sampling of protein conformations in simulations enables comparisons with the experimental results that can validate the MD methodology and, if successful at low resolution, provides novel and otherwise inaccessible structural detail. For membrane simulations that accommodate the size of PTEN (105 atoms), MD simulations on the μs timescale are required to equilibrate the system and sufficiently sample the equilibrated state. In simulations of Nef, we used steered MD simulations [101] to apply forces that pulled the protein into an open configuration suggested by NR experiments and then sampled the open state free of biasing potentials. Thereby, the protein reaches more relevant areas of conformation space and requires significantly less equilibration time. However, this whole field still needs further methodological development, for example, of rigorous procedures based upon the CVO profiles derived from NR. An experimentally validated biasing potential could thus be used not only to rapidly equilibrate a protein-membrane system but also to determine an ensemble of protein configurations that strictly match the NR data. In addition, such methodologies can be expanded to allow constraint information from multiple sources [102, 103], such as fluorescence resonance energy transfer or electron paramagnetic resonance, to be integrated in refined structural models of membrane-associated proteins. For structurally disordered systems, the combination of multiple sparse data sets promises to be a powerful method for relating conformational dynamics and flexibility to function.
Acknowledgments
We thank Dr. Alonzo Ross for critically reading the manuscript and valuable suggestions. This work was supported by the U.S. Dept. of Commerce (70NANB13H009 and 70NANB11H8139) and the NIH (1R01 GM101647), and performed in parts at the NIST Center for Neutron Research and the NIST Center for Nanoscale Science and Technology.
Footnotes
This equation – the Born approximation – is approximate because it neglects multiple scattering that occurs at small q.
References
- 1.Certain commercial materials, equipment, and instruments are identified in this manuscript in order to specify the experimental procedure as completely as possible. In no case does such identification imply a recommendation or endorsement by the National Institute of Standards and Technology, nor does it imply that the materials, equipment, or instruments identified are necessarily the best available for the purpose.
- 2.Majkrzak CF, Berk NF. Physica B. 2003;336:27–38. [Google Scholar]
- 3.Majkrzak CF, Berk NF, Kienzle P, Perez-Salas U. Langmuir. 2009;25:4154–4161. doi: 10.1021/la802838t. [DOI] [PubMed] [Google Scholar]
- 4.Als-Nielsen J, Kjaer K. In: Phase Transitions in Soft Condensed Matter. Riste T, Sherrington D, editors. Plenum Press; New York: 1989. pp. 113–138. [Google Scholar]
- 5.Shekhar P, Nanda H, Lösche M, Heinrich F. J Appl Phys. 2011;110:102216. doi: 10.1063/1.3661986. [DOI] [PMC free article] [PubMed] [Google Scholar]
- 6.Ankner J, Majkrzak CF. Proc SPIE. 1992;1738:260–269. [Google Scholar]
- 7.Heinrich F, Ng T, Vanderah DJ, Shekhar P, Mihailescu M, Nanda H, Lösche M. Langmuir. 2009;25:4219–4229. doi: 10.1021/la8033275. [DOI] [PubMed] [Google Scholar]
- 8.Kirby BJ, Kienzle PA, Maranville BB, Berk NF, Krycka J, Heinrich F, Majkrzak CF. Curr Opin Colloid Interf Sci. 2012;17:44–53. [Google Scholar]
- 9.Holt SA, Le Brun AP, Majkrzak CF, McGillivray DJ, Heinrich F, Lösche M, Lakey JH. Soft Matter. 2009;5:2576–2586. doi: 10.1039/B822411K. [DOI] [PMC free article] [PubMed] [Google Scholar]
- 10.Wiener MC, White SH. Biophys J. 1991;59:162–173. doi: 10.1016/S0006-3495(91)82208-1. [DOI] [PMC free article] [PubMed] [Google Scholar]
- 11.Fragneto G, Charitat T, Graner F, Mecke K, Perino-Galice L, Bellet-Amalric E. Europhys Letters. 2001;53:100–106. [Google Scholar]
- 12.Charitat T, Lecuyer S, Fragneto G. Biointerphases. 2008;3:FB3–FB15. doi: 10.1116/1.2936938. [DOI] [PubMed] [Google Scholar]
- 13.Worcester DL, Franks NP. J Mol Biol. 1976;100:359–378. doi: 10.1016/s0022-2836(76)80068-x. [DOI] [PubMed] [Google Scholar]
- 14.Tristram-Nagle S, Nagle JF. Chem Phys Lipids. 2004;127:3–14. doi: 10.1016/j.chemphyslip.2003.09.002. [DOI] [PMC free article] [PubMed] [Google Scholar]
- 15.Wiener MC, King GI, White SH. Biophys J. 1991;60:568–576. doi: 10.1016/S0006-3495(91)82086-0. [DOI] [PMC free article] [PubMed] [Google Scholar]
- 16.Wiener MC, White SH. Biophys J. 1992;61:428–433. doi: 10.1016/S0006-3495(92)81848-9. [DOI] [PMC free article] [PubMed] [Google Scholar]
- 17.Wiener MC, White SH. Biophys J. 1992;61:434–447. doi: 10.1016/S0006-3495(92)81849-0. [DOI] [PMC free article] [PubMed] [Google Scholar]
- 18.Nagle JF, Tristram-Nagle S. Biochim Biophys Acta. 2000;1469:159–195. doi: 10.1016/s0304-4157(00)00016-2. [DOI] [PMC free article] [PubMed] [Google Scholar]
- 19.Hristova K, Dempsey CE, White SH. Biophys J. 2001;80:801–811. doi: 10.1016/S0006-3495(01)76059-6. [DOI] [PMC free article] [PubMed] [Google Scholar]
- 20.Tristram-Nagle S, Chan R, Kooijman E, Uppamoochikkal P, Qiang W, Weliky DP, Nagle JF. J Mol Biol. 2010;402:139–153. doi: 10.1016/j.jmb.2010.07.026. [DOI] [PMC free article] [PubMed] [Google Scholar]
- 21.Kaganer VM, Brezesinski G, Möhwald H, Howes PB, Kjaer K. Phys Rev E. 1999;59:2141–2152. [Google Scholar]
- 22.Kaganer VM, Möhwald H, Dutta P. Rev Mod Phys. 1999;71:779–819. [Google Scholar]
- 23.Weygand M, Schalke M, Howes PB, Kjaer K, Friedmann J, Wetzer B, Pum D, Sleytr UB, Lösche M. J Mater Chem. 2000;10:141–148. [Google Scholar]
- 24.Schalke M, Lösche M. Adv Colloid Interf Sci. 2000;88:243–274. doi: 10.1016/s0001-8686(00)00047-6. [DOI] [PubMed] [Google Scholar]
- 25.Schalke M, Krüger P, Weygand M, Lösche M. Biochim Biophys Acta. 2000;1464:113–126. doi: 10.1016/s0005-2736(99)00249-7. [DOI] [PubMed] [Google Scholar]
- 26.Calvez P, Bussieres S, Demers E, Salesse C. Biochimie. 2009;91:718–733. doi: 10.1016/j.biochi.2009.03.018. [DOI] [PubMed] [Google Scholar]
- 27.Blume A. Biochim Biophys Acta. 1979;557:32–44. doi: 10.1016/0005-2736(79)90087-7. [DOI] [PubMed] [Google Scholar]
- 28.Brian AA, McConnell HM. Proc Natl Acad Sci USA. 1984;81:6159–6163. doi: 10.1073/pnas.81.19.6159. [DOI] [PMC free article] [PubMed] [Google Scholar]
- 29.Tamm LK, McConnell HM. Biophys J. 1985;47:105–113. doi: 10.1016/S0006-3495(85)83882-0. [DOI] [PMC free article] [PubMed] [Google Scholar]
- 30.Tanaka M, Sackmann E. Nature. 2005;437:656–663. doi: 10.1038/nature04164. [DOI] [PubMed] [Google Scholar]
- 31.Kühner M, Tampé R, Sackmann E. Biophys J. 1994;67:217–226. doi: 10.1016/S0006-3495(94)80472-2. [DOI] [PMC free article] [PubMed] [Google Scholar]
- 32.Naumann R, Jonczyk A, Kopp R, Vanesch J, Ringsdorf H, Knoll W, Gräber P. Angew Chem Int Ed Engl. 1995;34:2056–2058. [Google Scholar]
- 33.Lu X, Leimannova-Ottova A, Ti Tien H. Bioelectrochem Bioenerg. 1996;39:285–289. [Google Scholar]
- 34.Steinem C, Janshoff A, Ulrich WP, Sieber M, Galla HJ. Biochim Biophys Acta. 1996;1279:169–180. doi: 10.1016/0005-2736(95)00274-x. [DOI] [PubMed] [Google Scholar]
- 35.Wetzer B, Pum D, Sleytr UB. J Struct Biol. 1997;119:123–128. doi: 10.1006/jsbi.1997.3867. [DOI] [PubMed] [Google Scholar]
- 36.Groves JT, Boxer SG, McConnell HM. Proc Natl Acad Sci USA. 1997;94:13390–13395. doi: 10.1073/pnas.94.25.13390. [DOI] [PMC free article] [PubMed] [Google Scholar]
- 37.Majewski J, Wong JY, Park CK, Seitz M, Israelachvili JN, Smith GS. Biophys J. 1998;75:2363–2367. doi: 10.1016/S0006-3495(98)77680-5. [DOI] [PMC free article] [PubMed] [Google Scholar]
- 38.Wagner ML, Tamm LK. Biophys J. 2000;79:1400–1414. doi: 10.1016/S0006-3495(00)76392-2. [DOI] [PMC free article] [PubMed] [Google Scholar]
- 39.Rädler U, Mack J, Persike N, Jung G, Tampé R. Biophys J. 2000;79:3144–3152. doi: 10.1016/S0006-3495(00)76548-9. [DOI] [PMC free article] [PubMed] [Google Scholar]
- 40.Kügler R, Knoll W. Bioelectrochemistry. 2002;56:175–178. doi: 10.1016/s1567-5394(02)00031-2. [DOI] [PubMed] [Google Scholar]
- 41.Naumann CA, Prucker O, Lehmann T, Rühe J, Knoll W, Frank CW. Biomacromolecules. 2002;3:27–35. doi: 10.1021/bm0100211. [DOI] [PubMed] [Google Scholar]
- 42.Vacklin HP, Tiberg F, Thomas RK. Biochim Biophys Acta. 2005;1668:17–24. doi: 10.1016/j.bbamem.2004.11.001. [DOI] [PubMed] [Google Scholar]
- 43.Cornell BA, Braach-Maksvytis VLB, King LB, Osman PDJ, Raguse B, Wieczorek L, Pace RJ. Nature. 1997;387:580–583. doi: 10.1038/42432. [DOI] [PubMed] [Google Scholar]
- 44.Naumann R, Schiller SM, Giess F, Grohe B, Hartman KB, Karcher I, Köper I, Lubben J, Vasilev K, Knoll W. Langmuir. 2003;19:5435–5443. [Google Scholar]
- 45.Kibrom A, Roskamp RF, Jonas U, Menges B, Knoll W, Paulsen H, Naumann RLC. Soft Matter. 2011;7:237–246. [Google Scholar]
- 46.Giess F, Friedrich MG, Heberle J, Naumann RL, Knoll W. Biophys J. 2004;87:3213–3220. doi: 10.1529/biophysj.104.046169. [DOI] [PMC free article] [PubMed] [Google Scholar]
- 47.Schiller SM, Naumann R, Lovejoy K, Kunz H, Knoll W. Angew Chem Int Ed Engl. 2003;42:208–211. doi: 10.1002/anie.200390080. [DOI] [PubMed] [Google Scholar]
- 48.Hughes AV, Roser SJ, Gerstenberg M, Goldar A, Stidder B, Feidenhans’l R, Bradshaw J. Langmuir. 2002;18:8161–8171. [Google Scholar]
- 49.Perez-Salas U, Faucher K, Majkrzak CF, Berk N, Krueger S, Chaikof E. Langmuir. 2003;19:7688–7694. [Google Scholar]
- 50.Krueger S, Meuse CW, Majkrzak CF, Dura JA, Berk NF, Tarek M, Plant AL. Langmuir. 2001;17:511–521. [Google Scholar]
- 51.Valincius G, McGillivray DJ, Febo-Ayala W, Vanderah DJ, Kasianowicz JJ, Lösche M. J Phys Chem B. 2006;110:10213–10216. doi: 10.1021/jp0616516. [DOI] [PubMed] [Google Scholar]
- 52.Atanasov V, Atanasova PP, Vockenroth IK, Knorr N, Köper I. Bioconj Chem. 2006;17:631–637. doi: 10.1021/bc050328n. [DOI] [PubMed] [Google Scholar]
- 53.McGillivray DJ, Valincius G, Vanderah DJ, Febo-Ayala W, Woodward JT, Heinrich F, Kasianowicz JJ, Lösche M. Biointerphases. 2007;2:21–33. doi: 10.1116/1.2709308. [DOI] [PubMed] [Google Scholar]
- 54.Budvytyte R, Mickevicius M, Vanderah DJ, Heinrich F, Valincius G. Langmuir. 2013;29:4320–4327. doi: 10.1021/la304613a. [DOI] [PubMed] [Google Scholar]
- 55.Baumgart T, Kreiter M, Lauer H, Naumann R, Jung G, Jonczyk A, Offenhäusser A, Knoll W. J Colloid Interf Sci. 2003;258:298–309. doi: 10.1016/s0021-9797(02)00098-x. [DOI] [PubMed] [Google Scholar]
- 56.Shenoy S, Moldovan R, Fitzpatrick J, Vanderah DJ, Deserno M, Lösche M. Soft Matter. 2010;6:1263–1274. doi: 10.1039/B919988H. [DOI] [PMC free article] [PubMed] [Google Scholar]
- 57.Valincius G, Heinrich F, Budvytyte R, Vanderah DJ, McGillivray DJ, Sokolov Y, Hall JE, Lösche M. Biophys J. 2008;95:4845–4861. doi: 10.1529/biophysj.108.130997. [DOI] [PMC free article] [PubMed] [Google Scholar]
- 58.McGillivray DJ, Valincius G, Heinrich F, Robertson JWF, Vanderah DJ, Febo-Ayala W, Ignatjev I, Lösche M, Kasianowicz JJ. Biophys J. 2009;96:1547–1553. doi: 10.1016/j.bpj.2008.11.020. [DOI] [PMC free article] [PubMed] [Google Scholar]
- 59.Nanda H, Datta SAK, Heinrich F, Lösche M, Rein A, Krueger S, Curtis JE. Biophys J. 2010;99:2516–2524. doi: 10.1016/j.bpj.2010.07.062. [DOI] [PMC free article] [PubMed] [Google Scholar]
- 60.Heinrich F, Nanda H, Goh HZ, Bachert C, Lösche M, Linstedt AD. J Biol Chem. 2014 doi: 10.1074/jbc.M113.543561. in press. [DOI] [PMC free article] [PubMed] [Google Scholar]
- 61.Shenoy S, Shekhar P, Heinrich F, Daou M-C, Gericke A, Ross AH, Lösche M. PLoS ONE. 2012;7:e32591. doi: 10.1371/journal.pone.0032591. [DOI] [PMC free article] [PubMed] [Google Scholar]
- 62.Vockenroth IK, Atanasova PP, Jenkins ATA, Köper I. Langmuir. 2008;24:496–502. doi: 10.1021/la7030279. [DOI] [PubMed] [Google Scholar]
- 63.Datta SAK, Heinrich F, Raghunandan S, Krueger S, Curtis JE, Rein A, Nanda H. J Mol Biol. 2011;406:205–214. doi: 10.1016/j.jmb.2010.11.051. [DOI] [PMC free article] [PubMed] [Google Scholar]
- 64.Shenoy S, Nanda H, Lösche M. J Struct Biol. 2012;180:394–408. doi: 10.1016/j.jsb.2012.10.003. [DOI] [PMC free article] [PubMed] [Google Scholar]
- 65.Majkrzak CM, Berk NF, Krueger S, Perez-Salas UA. In: Neutron Scattering in Biology. Fitter J, Gutberlet T, Katsaras J, editors. Springer; New York: 2006. pp. 225–264. [Google Scholar]
- 66.Majkrzak CF, Carpenter E, Heinrich F, Berk NF. J Appl Phys. 2011;110:102212. doi: 10.1063/1.3661986. [DOI] [PMC free article] [PubMed] [Google Scholar]
- 67.Majkrzak CF, Berk NF, Krueger S, Dura JA, Tarek M, Tobias D, Silin V, Meuse CW, Woodward J, Plant AL. Biophys J. 2000;79:3330–3340. doi: 10.1016/S0006-3495(00)76564-7. [DOI] [PMC free article] [PubMed] [Google Scholar]
- 68.Ankner JF, Tao X, Halbert CE, Browning JF, Kilbey SM, II, Swader OA, Dadmun MS, Kharlampieva E, Sukhishvili SA. Neutron News. 2008;19:14–16. [Google Scholar]
- 69.Alber F, Dokudovskaya S, Veenhoff LM, Zhang W, Kipper J, Devos D, Suprapto A, Karni-Schmidt O, Williams R, Chait BT, Rout MP, Sali A. Nature. 2007;450:683–694. doi: 10.1038/nature06404. [DOI] [PubMed] [Google Scholar]
- 70.Zhao G, Perilla JR, Yufenyuy EL, Meng X, Chen B, Ning J, Ahn J, Gronenborn AM, Schulten K, Aiken C, Zhang P. Nature. 2013;497:643–646. doi: 10.1038/nature12162. [DOI] [PMC free article] [PubMed] [Google Scholar]
- 71.Benz RW, Nanda H, Castro-Roman F, White SH, Tobias DJ. Biophys J. 2006;91:3617–3629. doi: 10.1529/biophysj.106.084483. [DOI] [PMC free article] [PubMed] [Google Scholar]
- 72.Klauda JB, Venable RM, Freites JA, O’Connor JW, Tobias DJ, Mondragon-Ramirez C, Vorobyov I, MacKerell AD, Pastor RW. J Phys Chem B. 2010;114:7830–7843. doi: 10.1021/jp101759q. [DOI] [PMC free article] [PubMed] [Google Scholar]
- 73.Best RB, Zhu X, Shim J, Lopes PEM, Mittal J, Feig M, MacKerell AD. J Chem Theory Comput. 2012;8:3257–3273. doi: 10.1021/ct300400x. [DOI] [PMC free article] [PubMed] [Google Scholar]
- 74.Best RB, Mittal J, Feig M, MacKerell AD. Biophys J. 2012;103:1045–1051. doi: 10.1016/j.bpj.2012.07.042. [DOI] [PMC free article] [PubMed] [Google Scholar]
- 75.Hatcher E, Guvench O, MacKerell AD. J Chem Theory Comput. 2009;5:1315–1327. doi: 10.1021/ct9000608. [DOI] [PMC free article] [PubMed] [Google Scholar]
- 76.Shaw DE, Maragakis P, Lindorff-Larsen K, Piana S, Dror RO, Eastwood MP, Bank JA, Jumper JM, Salmon JK, Shan Y, Wriggers W. Science. 2010;330:341–346. doi: 10.1126/science.1187409. [DOI] [PubMed] [Google Scholar]
- 77.Akgun B, Satija S, Nanda H, Pirrone GF, Shi X, Engen JR, Kent MS. Structure. 2013;21:1822–1833. doi: 10.1016/j.str.2013.08.008. [DOI] [PMC free article] [PubMed] [Google Scholar]
- 78.Wymann MP, Schneiter R. Nat Rev Mol Cell Bio. 2008;9:162–176. doi: 10.1038/nrm2335. [DOI] [PubMed] [Google Scholar]
- 79.Chin YR, Toker A. Cell Signal. 2009;21:470–476. doi: 10.1016/j.cellsig.2008.11.015. [DOI] [PMC free article] [PubMed] [Google Scholar]
- 80.Toker A, Cantley LC. Nature. 1997;387:673–676. doi: 10.1038/42648. [DOI] [PubMed] [Google Scholar]
- 81.Li L, Ross AH. J Cell Biochem. 2007;102:1368–1374. doi: 10.1002/jcb.21593. [DOI] [PubMed] [Google Scholar]
- 82.Bassi C, Ho J, Srikumar T, Dowling RJO, Gorrini C, Miller SJ, Mak TW, Neel BG, Raught B, Stambolic V. Science. 2013;341:395–399. doi: 10.1126/science.1236188. [DOI] [PMC free article] [PubMed] [Google Scholar]
- 83.Bononi A, Bonora M, Marchi S, Missiroli S, Poletti F, Giorgi C, Pandolfi PP, Pinton P. Cell Death Differ. 2013;20:1631–1643. doi: 10.1038/cdd.2013.77. [DOI] [PMC free article] [PubMed] [Google Scholar]
- 84.Pocivavsek L, Junghans A, Zebda N, Birukov K, Majewski J. Am J Physiol Lung Cell Mol Physiol. 2014;306:L1–9. doi: 10.1152/ajplung.00160.2013. [DOI] [PMC free article] [PubMed] [Google Scholar]
- 85.Rahdar M, Inoue T, Meyer T, Zhang J, Vazquez F, Devreotes PN. Proc Natl Acad Sci USA. 2009;106:480–485. doi: 10.1073/pnas.0811212106. [DOI] [PMC free article] [PubMed] [Google Scholar]
- 86.Vazquez F, Ramaswamy S, Nakamura N, Sellers W. Mol Cell Biol. 2000;20:5010–5018. doi: 10.1128/mcb.20.14.5010-5018.2000. [DOI] [PMC free article] [PubMed] [Google Scholar]
- 87.Huang J, Yan J, Zhang J, Zhu S, Wang Y, Shi T, Zhu C, Chen C, Liu X, Cheng J, Mustelin T, Feng G-S, Chen G, Yu J. Nat Commun. 2012;3:911–922. doi: 10.1038/ncomms1919. [DOI] [PubMed] [Google Scholar]
- 88.Zmajkovicova K, Jesenberger V, Catalanotti F, Baumgartner C, Reyes G, Baccarini M. Mol Cell. 2013;50:43–55. doi: 10.1016/j.molcel.2013.01.037. [DOI] [PMC free article] [PubMed] [Google Scholar]
- 89.Heinrich F, Lösche M. Biochim Biophys Acta. 2014;1838:2341–2349. doi: 10.1016/j.bbamem.2014.03.007. [DOI] [PMC free article] [PubMed] [Google Scholar]
- 90.Lee JO, Yang H, Georgescu MM, Di Cristofano A, Maehama T, Shi Y, Dixon JE, Pandolfi PP, Pavletich NP. Cell. 1999;99:323–334. doi: 10.1016/s0092-8674(00)81663-3. [DOI] [PubMed] [Google Scholar]
- 91.Phillips JC, Braun R, Wang W, Gumbart J, Tajkhorshid E, Villa E, Chipot C, Skeel RD, Kalé L, Schulten K. J Comput Chem. 2005;26:1781–1802. doi: 10.1002/jcc.20289. [DOI] [PMC free article] [PubMed] [Google Scholar]
- 92.MacKerell A, Bashford D, Bellott M, Dunbrack RL, Evanseck J, Field M, Fischer S, Gao J, Guo H, Ha S, Joseph-McCarthy D, Kuchnir L, Kuczera K, Lau F, Mattos C, Michnick S, Ngo T, Nguyen D, Prodhom B, Reiher W, Roux B, Schlenkrich M, Smith J, Stote R, Straub J, Watanabe M, Wiorkiewicz-Kuczera J, Yin D, Karplus M. J Phys Chem B. 1998;102:3586–3616. doi: 10.1021/jp973084f. [DOI] [PubMed] [Google Scholar]
- 93.Klauda JB, Monje V, Kim T, Im W. The journal of physical chemistry B. 2012;116:9424–9431. doi: 10.1021/jp304056p. [DOI] [PubMed] [Google Scholar]
- 94.Kooijman EE, King KE, Gangoda M, Gericke A. Biochemistry. 2009;48:9360–9371. doi: 10.1021/bi9008616. [DOI] [PubMed] [Google Scholar]
- 95.Slochower DR, Huwe PJ, Radhakrishnan R, Janmey PA. J Phys Chem B. 2013;117:8322–8329. doi: 10.1021/jp401414y. [DOI] [PMC free article] [PubMed] [Google Scholar]
- 96.Curtis JE, Raghunandran S, Nanda H, Krueger S. Comp Phys Commun. 2012;183:382–389. [Google Scholar]
- 97.Liu F, Wagner S, Campbell RB, Nickerson JA, Schiffer CA, Ross AH. J Cell Biochem. 2005;96:221–234. doi: 10.1002/jcb.20525. [DOI] [PubMed] [Google Scholar]
- 98.Vazquez F, Grossman SR, Takahashi Y, Rokas MV, Nakamura N, Sellers WR. J Biol Chem. 2001;276:48627–48630. doi: 10.1074/jbc.C100556200. [DOI] [PubMed] [Google Scholar]
- 99.Odriozola L, Singh G, Hoang T, Chan AM. J Biol Chem. 2007;282:23306–23315. doi: 10.1074/jbc.M611240200. [DOI] [PubMed] [Google Scholar]
- 100.Torres J, Pulido R. J Biol Chem. 2001;276:993–998. doi: 10.1074/jbc.M009134200. [DOI] [PubMed] [Google Scholar]
- 101.Park S, Schulten K. J Chem Phys. 2004;120:5946–5961. doi: 10.1063/1.1651473. [DOI] [PubMed] [Google Scholar]
- 102.Ward AB, Sali A, Wilson IA. Science. 2013;339:913–915. doi: 10.1126/science.1228565. [DOI] [PMC free article] [PubMed] [Google Scholar]
- 103.Karaca E, Bonvin AMJJ. Methods. 2013;59:372–381. doi: 10.1016/j.ymeth.2012.12.004. [DOI] [PubMed] [Google Scholar]