

Abstract
In biological adhesion, the biophysical mechanism of specific biomolecular interaction can be divided in slip and catch bonds, respectively. Conceptually, slip bonds exhibit a reduced bond lifetime under increased external force and catch bonds, in contrast, exhibit an increased lifetime (for a certain force interval). Since 2003, a handful of biological systems have been identified to display catch bond properties. Upon investigating the specific interaction between the unique hydrophilic domain (HD) of the human cell-surface sulfatase Sulf1 against its physiological glycosaminoglycan (GAG) target heparan sulfate (HS) by single molecule force spectroscopy (SMFS), we found clear evidence of catch bond behavior in this system. The HD, ∼320 amino acids long with dominant positive charge, and its interaction with sulfated GAG-polymers were quantitatively investigated using atomic force microscopy (AFM) based force clamp spectroscopy (FCS) and dynamic force spectroscopy (DFS). In FCS experiments, we found that the catch bond character of HD against GAGs could be attributed to the GAG 6-O-sulfation site whereas only slip bond interaction can be observed in a GAG system where this site is explicitly lacking. We interpreted the binding data within the theoretical framework of a two state two path model, where two slip bonds are coupled forming a double-well interaction potential with an energy difference of ΔE ≈ 9 kBT and a compliance length of Δx ≈ 3.2 nm. Additional DFS experiments support this assumption and allow identification of these two coupled slip-bond states that behave consistently within the Kramers-Bell-Evans model of force-mediated dissociation.
Introduction
Noncovalent biological adhesion involves a multitude of different aspects such as binding affinities, selectivities, multidomain interaction, force and/or allosteric regulation, and many different molecular materials. Biophysically, we distinguish between slip and catch bonds. Whereas slip bonds are weakened, catch bonds are strengthened by tensile mechanical forces. Slip bonds were originally introduced by Bell in 1978 and mathematically treated within the framework of chemical reaction rate theory (1). Catch bonds were conceptually introduced in 1988 by Dembo and co-workers (2). The experimental proves of both slip bonds and catch bonds are tightly connected to the biological recruitment system P-selectin (PSel) and its P-selectin glycoprotein ligand 1 (PSGL-1), where in 1995 the first slip bond-like off-rate constant as a function of force was published (3) and in 2003 the first evidence of catch bond behavior at the single molecule level could be found as well (4). In the meantime numerous examples of slip bond-like interactions (5–17) could be demonstrated and a handful of catch bond systems could be identified in cellular and molecular force assays. Namely, catch bond behavior could be found in PSel-PSGL-1 (4), FimH-mannose (18), actomyosin (19), platelet glycoprotein Ibα-von Willebrand factor (20), and integrins (21) thus verifying the general concept of this most exciting and paradox discovery in cell adhesion. Beyond its experimental findings a couple of theoretical models were formulated helping to rationalize this counterintuitive phenomenon (22–33).
In this study, we investigated the binding of the hydrophilic domain (HD) of the human cell-surface sulfatase Sulf1 to its natural GAG substrate heparan sulfate (HS) (see Fig. 1, for involved molecules). Sulfatases (17 enzymes in human) are sulfate ester cleaving enzymes, some of which play an essential role in the postsynthetic regulation of the sulfation status of GAGs, as holds true for the endosulfatases Sulf1 and Sulf2. These two enzymes catalyze consecutive 6-O-desulfatation of the highly sulfated S-regions within the HS polysaccharide chain (see Fig. 1 b, for its constituent disaccharide unit). The Sulfs are crucial in many physiological and pathological processes such as embryonic development, tissue homeostasis/repair, and tumorigenesis, as they modulate cellular signaling of numerous HS-dependent growth factors (34,35). The extracellular sulfatase Sulf1 was first discovered in 2001 by Emerson and colleagues searching for sonic hedgehog (shh) responsive genes during the development of quail embryo (36). Since then orthologs were characterized in many organisms, including mouse and human, and an isoform, called Sulf2, was detected in most animal species analyzed (37). In further studies we (38,39) and others (40) could assign the specific and tight HS binding of Sulf1/2 to their unique and genetically conserved HD domain, which comprises 300 to 320 amino acids and is highly charged under physiological pH conditions (27% basic and 13% acidic residues). Interestingly, HD itself comprises no catalytic site and therefore does not alter the HS sulfation pattern. Nevertheless HD is critical for the enzymatic activity of Sulf1 as it essentially recognizes the D-glucosamine 6-O-sulfatation sites of the di- or trisulfated disaccharide repetition unit (uronic acid-glucosamine) constituting the S-regions of HS (see Fig. 1 b). Furthermore, Sulf1 lacking HD completely loses its enzymatic capabilities (38,39). To extend our previous work on extracellular proteoglycans such as marine sponge aggregation factors (41,42) and aggrecans (12), we investigated the interaction of Sulf1 against GAGs at the single molecule level, where we functionally immobilized the HD of Sulf1 and its counter ligand GAGs on opposing surfaces (flat gold surface and AFM tip, respectively, see Fig. 2 a) and quantitatively investigated their binding properties with single molecule force spectroscopy (SMFS). A previous study from our lab, including dynamic SMFS and, in addition, also ensemble interaction and in vivo cell-surface association experiments, led to the conclusion that, interestingly, HD binding to HS involves at least two distinct binding sites that dynamically cooperate to allow for a processive and directed action of Sulf1 along the polysaccharide chain of its HS substrate (39).
Figure 1.

Schematics of the used protein construct and glycosaminoglycan structures. (a) MBP-HD fusion protein according to the linear amino acid sequence. The maltose binding protein (MBP) part is sketched in yellow, N- and C-terminal regions of HD are colored dark blue, and the less conserved inner region of HD is colored light blue. The basic cluster is stained red (see (39) for further details). The fusion protein was purified via its MBP-tag using amylose-affinity chromatography and analyzed by SDS-PAGE (see Fig. S1). (b) HS-chains consist of 50 to 150 disaccharide units. Distributed along the chain highly sulfated S-regions are established biosynthetically, which represent the high-affinity interaction sites for HD. These S-regions comprise up to eight consecutive disaccharides (60) of the shown consensus structure with the N-sulfate as a uniform and the 6-O-sulfate as a predominant glucosamine modification (red). The uronic acid mostly carries a 2-O-sulfate group (blue) and is C5-epimerized from glucuronic acid (GlcA) to iduronic acid (IdoA) (blue arrow). Along the entire HS polysaccharide chain S-regions are separated by regions of little or no sulfation. (c) Heparosan N-sulfate, also called K5 N-sulfate (K5-NS) is the N-sulfated variant of the HS precursor heparosan, i.e., a HS structure with N-sulfation only. It consists of β-D-GlcA-(1→4)-α-D-GlcNS as repeating disaccharide (30 to 40 units on average (61)). In comparison with the HS S-region disaccharide structure shown in (b) K5-NS lacks 6-O-sulfation of glucosamine as well as 2-O-sulfation and C5-epimerization of the uronic acid. To see this figure in color, go online.
Figure 2.
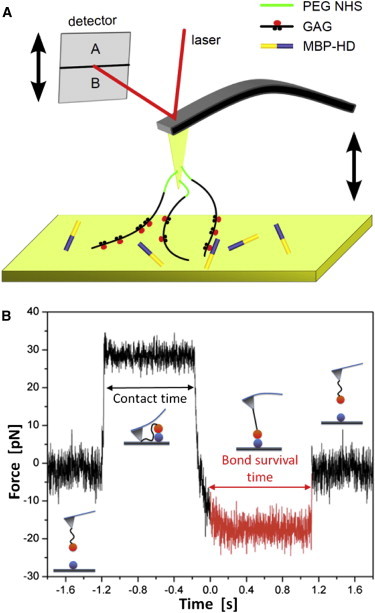
Experimental setup and performance of single molecule force spectroscopy. (a) Typical AFM experimental setup design used to probe interactions between GAG-chains and MBP-HD at the molecular level. The GAG-chains (black lines) were coupled via PEG-NHS ester disulfide linkers (green lines) to a gold-coated cantilever tip. The blue structure represents the MBP-HD fusion protein immobilized on the gold surface (for details about functionalization, see Materials and Methods). (b) Characteristic force clamp data diagram displaying the force by means of the cantilever deflection versus time for a single force clamp experiment. The graph can be divided into four constant force regimes that are illustrated by the pictograms. These represent the force-free cantilever while approaching the surface, the surface dwell time, the constantly loaded HD-GAG-complex (red) and the force-free cantilever after dissociation, respectively. The bond lifetime of an individual complex is given by the constant force regime highlighted in red. To see this figure in color, go online.
In this study we present detailed AFM-SMFS analyses of the HD/HS interaction providing clear evidence that in a force range of 10 to 18 pN catch bond type behavior can be observed. Below 10 pN and beyond 18 pN the system yields simple slip bond dissociation. In specific control experiments, where we probed the interaction of HD with the HS precursor heparosan N-sulfate (K5-NS, Fig. 1 c), which essentially lacks the 6-O-sulfation site, we could observe only slip bond type of unbinding over the full force range. Furthermore, we analyzed our catch bond lifetime data within the theoretical framework of a two state two path binding potential whose population is solely determined by equilibrium thermodynamics. With our approach we determined an energy difference between the two binding states of approximately ΔE = 9 kBT and a compliance length of Δx = 3.2 nm.
Materials and Methods
Single-molecule force spectroscopy
All single-molecule force spectroscopy (SMFS) experiments were accomplished at room temperature in phosphate buffered saline (PBS) buffer at pH 7.3. We used a commercially available AFM (MFP-3D Bio Asylum Research, Goleta, CA). The system was operated in the readily implemented constant velocity (distance ramping) or constant force (force clamping) modes, respectively. We used soft gold-coated silicon nitride force probes with nominal force constants of k = 0.03 N/m for dynamic force spectroscopy (DFS) experiments and k = 0.006 N/m for force clamp spectroscopy (FCS) experiments. Nevertheless, before each measurement the cantilevers were calibrated using the thermal fluctuation method with an absolute uncertainty of ∼10% (43). The approach velocity and the dwell time for all experiments were set to 3000 nm/s and 0.5 s, respectively. The trigger forces for constant force were set in the range from 5 to 40 pN, whereas the pulling velocities for constant velocity experiments were varied from 20 to 5000 nm/s. A sketch depicting the general setup and a typical dataset are given in Fig. 2. We used custom-made MATLAB software to validate and analyze the characteristic nonlinear single molecule force extension curves in such a way that sporadic multiple rupture events and obviously malformed force curves were excluded from the analysis. In force clamp experiments, we estimated the complex lifetime for a given load. As the unbinding of a receptor ligand complex is of stochastic nature we acquired at least 80 individual lifetimes for each clamp force to estimate the mean lifetime. The mean complex lifetime was determined either by calculating the average, the root mean square (RMS) or by approximating the slope of the logarithmic decay. As shown recently, variations among these procedures are minute (44). In constant velocity experiments, the dissociation force is estimated by the step height of the characteristic nonlinear force ramp. In this study, several hundred unbinding events are plotted in a histogram and the most probable dissociation forces Fmax were estimated by approximation of a (bimodal) Gaussian distribution.
Protein expression and purification
For expression in Escherichia coli (E. coli), a pMAL-c5X plasmid (New England Biolabs, Ipswich, MA) encoding the maltose binding protein-HD (MBP-HD) fusion protein was used. Generation of this plasmid was described recently (39). MBP-HD consists of an N-terminal (MBP) sequence followed by the sequence of the HD from human Sulf1 (K417-K735), as schematically depicted in Fig. 1 a. The MBP-HD construct was expressed in E. coli Rosetta 2 (DE3) cells (Merck, Darmstadt, Germany). Pelleted cells were lysed and cleared supernatants loaded on an amylose-affintiy column (MBPTrap HP 5 mL, GE Healthcare, Little Chalfont, United Kingdom) via the ÄKTAexplorer chromatography system (GE Healthcare). After washing with running buffer (PBS pH 7.4), bound proteins were eluted in one step to 100% elution buffer (PBS pH 7.4 with 10 mM maltose). Two milliliter fractions were collected and analyzed via Bradford assay (Coomassie Plus Protein Assay Reagent, Thermo Scientific, Waltham, MA), SDS-PAGE and Coomassie Brilliant Blue staining of SDS-gels (45). A typical chromatography run and SDS-PAGE analysis is shown in Fig. S1 in the Supporting Material.
Sample preparation
As substrates we used ultra-flat gold surfaces prepared according to the template stripped gold (TSG) procedure (46). Both, substrates and cantilevers were modified with 1 mM PEG-NHS-ester disulfide linkers (Polypure AS, Oslo, Norway) via thiol chemistry in water free DMSO. HS (from Celsus), heparin (from Sigma Aldrich, St. Louis, MO), and N-sulfated K5-polysaccharide (from Iduron, Manchester, United Kingdom) were fused to the cantilever via a readily introduced amino group in coupling buffer (0.2 M NaHCO3 pH 8.2). MBP-HD (100 μg/ml) was coupled to the immobilized PEG-NHS-esters in PBS pH 7.3 with low surface concentration to present only very few potential binding partners to the GAG-coated tip. Even though, the overall interaction rate drops well below 10%, it significantly suppresses the occurrence of multiple binding events (47). After incubation, the immobilized substrate surfaces and cantilevers were rinsed extensively with PBS.
Notably, in previous experimental series we analyzed the unspecific adhesion of heparin which bears the highest specific charge of all used GAGs to unmodified and MBP-covered gold substrates (39). We found, that the interaction rates and adhesion energies where considerably lower than those acquired for HD and heparin. Therefore, SMFS data sets of HD and GAGs can be considered as virtually free of unspecific adhesion.
Results and Discussion
Single molecule force clamp experiments—constant force experiments
Sulf1-HD was expressed as a recombinant fusion protein with (MBP-HD, Fig. 1 a) and purified via its MBP-tag using amylose affinity chromatography (Fig. S1). We performed single molecule AFM force clamp experiments with MBP-HD (Fig. 2 a) against its physiological substrate HS within a force range of 7.5 to 40 pN. To further elucidate the significance and importance of the 6-O-sulfatation sites, which are recognized by HD (39), we performed single molecule force clamp experiments with Sulf1 HD also against the HS precursor heparosan N-sulfate (K5-NS) that completely lacks 6-O-sulfatation (Fig. 1 c). For each of the systems, we investigated more than 1000 dissociation events and individually measured the lifetime of the HD/GAG complex while a constant (clamp) load was applied (Fig. 2). According to N(t) = N0 exp(−t/τ), the average lifetime τ was then estimated by logarithmically plotting the number of intact bonds N(t) versus time and approximating the (negative) linear slope to the dataset. In Fig. 3 a, we exemplarily plotted these graphs for HD/HS and HD/K5-NS for four distinct loading forces between 10 to 20 pN. As can be rationalized from these figures, for HD/HS, increasing clamping forces shifted the slopes to the “right,” whereas for HD/K5-NS slopes shifted to the “left.” Because the negative slope can be attributed to the average lifetime of the complex τ, this evidence can be converted into a lifetime-force plot as displayed in Fig. 3 b. In this figure, for HD/HS, one can immediately observe an increase of the average lifetime in a loading force interval of 10 to 18 pN. This directly refers to the observation of catch bond behavior in the given intermediate force interval. Below and above this force interval the system behaves like a “regular” system, where bond weakening with increasing force can be observed (slip bond character).
Figure 3.
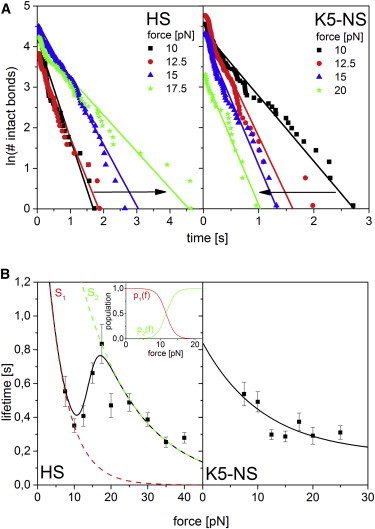
Catch bond behavior of HD interaction with its physiological substrate heparan sulfate. (a) Estimation of the complex lifetimes for HD/HS (left) and HD/K5-NS (right) complexes by means of typical data. The negative inverse slope of the natural logarithm of the number of intact bonds plotted versus time gives the complex lifetime. The evolution of bond stability in the catch regime (approximately 10 to 20 pN rising forces) exposes a flattening of the plot slopes for rising forces (arrow) in case of HD/HS catch bonds, while the plot slopes steepen for HD/K5-NS slip dissociation. (b) Measured complex lifetimes for different HD substrates (HS and K5-NS) under a constant external force in the range of 7.5 to 40 pN (scatter plots). HS, the physiological substrate of HD, shows explicit catch bond behavior in the force range of 10 to 18 pN. The dashed red and green plots represent the slip dissociation from the individual binding states S1 and S2, respectively. The force dependent population p1(f) and p2(f) of each state allows for the life time approximation over the whole force range (inset). The stability of complexes with K5-NS, lacking 6-O-sulfate, decreases exponentially and can be modeled by a one state one path approach. To see this figure in color, go online.
To test for the structural specificity of our finding, we analyzed the interaction of HD with K5-NS. As expected for the positively charged HD and K5-NS carrying evenly distributed negative charges along the entire GAG chain, we observed binding. However, no indication for a catch bond character in the force range between 7.5 and 30 pN was detectable. Instead, the average lifetime of the complex was monotonously reduced with increasing force throughout the whole force regime, hence indicating bond weakening with increasing force, i.e., slip bond behavior. To further validate the specific involvement of 6-O-sulfate groups in catch bond interaction, we also conducted force clamp experiments with HD against the 6-O-sulfated GAG heparin, which is structurally closely related to the S-regions of HS but lacks the distinct interspersed domain structure along the polysaccharide chain (see the legend to Fig. 1 b). Interestingly, also for heparin we found a very similar catch bond signature in the force regime between 12 and 16 pN as shown in Fig. S2 in the Supporting Material. These results clearly elucidate the role of GAG 6-O-sulfation for the recognition process between Sulf1 and its cognate HS substrate. To theoretically interpret our experimental observations, we first considered the one state two path model (25,30,48), which allows the most straight forward way to quantitatively describe catch bonds. In this model, an alternative dissociation pathway is introduced along which the system can dissociate against low external forces resulting in a tightened bond for larger forces. At a certain critical force the system reaches its maximum stability and switches to the slip dissociation path. Accordingly, the dependence of the dissociation rate k(f) on the applied force is given by
| (1) |
where ks and kc are the dissociation rate constants for the slip (s) and the catch (c) dissociation pathway, xs and xc are the widths of the corresponding energy barriers, and kBT is the thermal energy. Especially the catch bond characteristics of P-Selectin/PSGL-1 has been approximated reasonably well by this approach (25,30,49). Notably, this model implies brittle bonds at zero load as the complex lifetime decreases for diminishing external forces. However, HD/HS (and HD/heparin) complexes expose an increased bond life time and slip dissociation for vanishing external force. Correspondingly, a one state two path approach is not applicable to our experimental data as it diverges in the low force regime.
More elaborate approaches have been reported that take account of force-induced deformations (29), protein water interfaces (50), fluctuating energy barriers (26), or two bound states separated by an energy barrier (22,23,28,31–33,48).
In this study, we followed the latter two state two path approach by introducing a coupled, double-well energy landscape with two well confined binding states S1 and S2 separated by the energy barriers E12 and E21, respectively (Fig. 4). Both states individually obey slip bond characteristics and dissociation can occur from either of the two states depending on the external force. The total width of this barrier is given by x = x12 + x21. The system can dissociate either from the low force state S1 via x1 or from the high force state S2 via x2 by crossing the corresponding barriers E1 or E2, respectively (transition state). We can assume that both binding states can be attributed to different molecular conformations. Hence, it is reasonable to neglect higher-order dissociation (e.g., S1 via x12 and x2) or dissociation from transition states when the conformational relaxation is fast compared with a single pulling experiment. As protein folding dynamics are in the range of micro to milliseconds (51–53), the upper temporal limit for HD conformational dynamics can be estimated to be in this range or even below. For comparison, the timescale of a molecular stretching experiment is in the range of seconds to tens of milliseconds. Hence, the temporal evolution of the external force can be assumed to be orders of magnitude smaller than the conformational relaxation within the HD/GAG complex. Consequently, the population of the states S1 and S2 is in thermodynamic equilibrium at any time of the experiment and can therefore be calculated by equilibrium thermodynamics. To estimate the (force dependent) population of the two states we introduce the canonical partition function Z(f) as a function of the external force:
| (2) |
With the energy difference ΔE = E12 − E21 and the compliance length Δx = x12 − x21 of both states, we derive the population probability p1(f) and p2(f) of the states S1 and S2:
| (3) |
| (4) |
In line with the Kramers-Bell-Evans (KBE) model for slip bonds (1,54,55), we define the total dissociation rate k(f) as the probability weighted sum of the dissociation rates from S1 and S2:
| (5) |
Here, the state from which the system dissociates explicitly depends on the applied force f, the shape of the binding potential landscape, parameterized by the compliance length Δx and the energy difference ΔE between S1 and S2. Within this theoretical framework one explicitly observes three different dissociation regimes at low, medium, and high forces: at low and high forces, solely S1 or S2 is populated (Fig. 3 b, inset). Therefore, force clamp experiments within these force ranges show dissociation of slip type (Fig. 3 b, dashed plots), thus yielding the corresponding dissociation rate constants (k1, k2) and bond lengths (x1, x2), respectively. In contrast, when performing force clamp experiments at intermediate forces, the HD/HS complex can dissociate either from S1 or S2. Hence, force clamp datasets obtained within this force regime comprise individual complex life times of both states and the average life time τ is therefore a superposition of S1 and S2. Consequently, the prolonged life times of HD/HS at intermediate forces are caused by the increasing population of the tighter bound state S2. By fitting the force dependent complex life time τ (f) (the inverse of k(f)) to our HD/HS catch bond data we found a very nice agreement (Fig. 3 b, solid line plot) and could determine dissociation rate constants of k1 = 0.12 s−1 and k2 = 0.24 s−1 with reaction lengths of x1 = 1.23 nm and x2 = 0.32 nm, respectively. The energy difference between the two states was calculated to ΔE = 21.92 kJ/mol(≈ 9 kBT) with a compliance length of Δx = 3.2 nm. In contrast, the interaction of HD and K5-NS is characterized by slip bond behavior where the bond stability followed a simple exponential decay with increasing external load corresponding to the force dependent decay rate known from the KBE model:
| (6) |
By approximating the HD/K5-NS data correspondingly, we can estimate a dissociation rate constant of k = 0.61 s−1 with a reaction length of x = 0.92 nm.
Figure 4.

Two state two path model of HD/HS interaction. Flat and two-dimensional (inset) representation of the proposed energy landscape for HD/HS interaction. The occupancy of both bound states S1 and S2 is governed by equilibrium thermodynamics. In the force-free state (black plot) solely S1 is populated and dissociation can be observed from this state only. On applying a force, the binding potential is tilted (red plot). In the intermediate force (transition) regime, the system can flip between S1 and S2 by surpassing the internal energy barriers E12 and E21, respectively. Consequently, the observed unbinding events are a superposition of both states. Increasing the force further depopulates S1 successively and only dissociation from S2 can be observed. To see this figure in color, go online.
6-O-sulfate groups are evidently crucial for recognition and binding of HD to GAGs as has been described earlier by us and others (see Introduction). In this study, catch bond behavior could also be specifically allocated to the presence of 6-O-sulfate bearing GAGs (HS and heparin), which strongly suggests interpreting this finding within the framework of an allosteric model. Correspondingly, the states S1 and S2 represent different protein conformations and, apparently, the 6-O-sulfate groups of the GAG substrate serve as allosteric effectors that induce the force-mediated tightening of the HD binding domain. Recently, catch bond dissociation of adhesins, selectin, and actin could be attributed to conformational transitions (23,56,57). Even though the three-dimensional structure of HD is so far unknown and allosteric effects have not been reported to date, our findings strongly support a load-mediated conformational switchover, which raises the question of the physiological relevance. Very recently, Seffouh et al. reported on the directed and processive 6-O-desulfatation of HS by human Sulf2 (58), where the sulfatase binds to the 6-O-sulfate groups of the HS S-region such, that the catalytic center is positioned at the most upstream 6-O-sulfate moiety. After desulfation, Sulf2 proceeds to the next downstream 6-O-sulfate. This processive action requires the presence of downstream 6-O-sulfates, which are bound by HD (and thereupon presented to the catalytic center during progression). Reaching the S-region downstream end, the last 6-O-sulfate group is hardly desulfated (58). Within this elaborated molecular interplay controlling catalytic processing, i.e., S-domain recognition, positioned binding, sulfate release (without Sulf getting lost from the GAG chain), directed progression, etc., it seems that there is an essential demand for allosteric effects with multiple (at least two) contacts controlling bound states very likely. Conformational transitions and cooperative binding effects suggest a mechanism that stepwise feeds 6-O-sulfates to the catalytic site and possibly drags the enzyme along the GAG chain (Fig. S3). It appears reasonable that this process is controlled by the progressive release of 6-O-sulfates, which, vice versa might also be induced when applying an external load to the HD/HS complex. Moreover, the transition energy barrier ΔE ≈ 9 kBT is sufficiently small 1) to be in line with our assumption of fast inner relaxation, and 2) have the transformation be triggered by a comparatively small stimulus that is equivalent to the energy of a typical hydrogen bond (59). Interestingly, the transition energy barrier and compliance length of HD/heparin catch bonds differ significantly from HD/HS catch bonds (see Supporting Material). We attribute this to the lack of a discrete domain structure (S-regions) in heparin. Evidently, the allostery-driven conformational transition of HD is critical for the directed catalytic release of 6-O-sulfates. In contrast, the interaction of HD with the 6-O-sulfate lacking GAG K5-NS does not expose any catch bond characteristics. Notably, the K5-NS force life time plot (Fig. 3 b) exposes a small maximum at 18 pN that could indicate dissociation of catch type. Therefore, we applied both models to the data and rated the results with the Akaike Information Criterion (AIC) thereafter. We found a minimized AIC value for the one state one path model indicating, that the small peak at 18 pN can be attributed to stochastic scatter.
Dynamic force spectroscopy—constant velocity simulations and experiments
To verify if our assumption of a two-state binding model is correct and to investigate whether the catch bond nature from the coupled two-state system gets also apparent in AFM dynamic force experiments, we analyzed the interaction of HD against HS in a series of constant velocity SMFS experiments. Interestingly, the force versus loading-rate plots acquired in earlier experiments showed neither any discontinuity nor any evidence that could be attributed to the effects described before (39). Hence, we performed simulations on the basis of our constant force data to estimate the expectable evolution of the loading-rate dependent dissociation force. According to the KBE model, a thermal-induced decay (dissociation) can be characterized by a first-order differential equation. Correspondingly, the temporal evolution of bond survival at time t is described by
| (7) |
where p(t) is the bond survival probability at time t, and k(f(t)) is the dissociation rate. To estimate the probability density of the dissociation forces for a two state two path binding potential, we inserted Eq. 5 into Eq. 7 and numerically solved the differential equation for loading rates between 1 and 105 pN s−1 and by using the fit parameters ΔE, Δx, k1, k2, x1, and x2 for HD/HS from our force clamp experiments (for details, see Supporting Material). The result is shown in Fig. 5. In this figure, the predicted probability density −dp(f) / df for dissociation at force f is plotted versus the experimental loading rate r (on a logarithmic scale) in gray scale. What can readily be discerned are two coexisting slip bond binding states, visible as linear areas (constant slopes) at high and low loading rates in agreement with the KBE theory for slip bonds. In this graph, vertical cross-sections can be attributed to (the well-known) force histograms displaying the most probable dissociation force at a fixed loading rate. Each of the two regimes can theoretically be identified with the two anticipated binding states (S1 and S2) of the two state two path model. Interestingly, there is a certain intermediate loading rate interval (102 – 104 pNs−1), where the two states S1 and S2 should coexist and should be detectable by a bimodal force distribution in the DFS force histograms.
Figure 5.
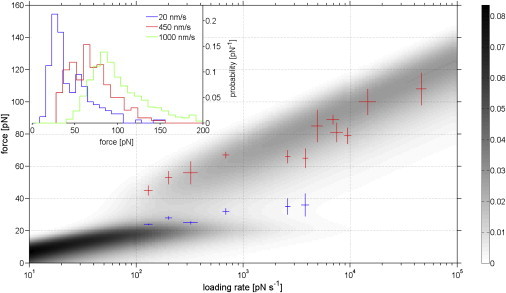
Dynamic single molecule force spectroscopy-numerical simulation and experimental results. Force versus loading rate graph for HD/HS complexes. The predicted probability density −dp(f)/df for unbinding at force f is plotted in gray scale. This data was calculated using the experimental results obtained from force clamp experiments. Typical experimental DFS dissociation force histograms (normalized) illustrate the evolution from bimodal to unimodal force distributions for increasing pulling velocities (inset). Force distribution peaks estimated from DFS experiments are superimposed on the probability density where the low and high force peaks are colored blue and red, respectively. To see this figure in color, go online.
When we first performed constant velocity experiments with typical AFM pulling velocities of ∼1 μm/s (39), typical loading rates of r = 104–105 pNs−1 were achieved (loading rate = pulling velocity × molecular elasticity). In these experiments unimodal force histograms could always be detected in agreement with the theoretical prediction. From the simulation it becomes apparent that the “high force” state S2 and its depopulation path always had been probed in DFS. To probe also the “low force” state S1, we had to reduce the experimental loading rates considerably (by several orders of magnitudes), which we implemented by reducing the experimental AFM pulling velocities down to 20 nm/s (which is really slow for AFM operation and makes a stable microscope and tedious analysis necessary). In agreement with our numerical simulation, we found bimodal dissociation force distributions for small and medium loading rates and unimodal distributions at high loading rates (Fig. 5, inset). We estimated the distribution maxima where the low and high force peaks represent predominant dissociation from S1 and S2, respectively, and matched these with the predicted probability density (Fig. 5). Beside the fact that theoretical and experimental data show significant overlap, one can observe a superposition of both states within a transition regime (r = 102 −5 × 10³ pNs−1) as the complex dissociates either from S1 or S2 each within a characteristic dissociation force range. In addition and as a further control we analyzed the experimental DFS data according to the KBE model:
| (8) |
where Fmax and r are the most probable dissociation force and the loading rate, respectively. The fit parameters xi and ki correspond, as defined before, to the widths of the energy barriers and the dissociation rate constants for escaping from the states Si (i = 1,2). We obtained dissociation rate constants of k1 = 0.05 s−1 and k2 = 0.15 s−1 and reaction lengths of x1 = 1.12 nm and x2 = 0.38 nm, respectively. These results show a good match with the data obtained from the force clamp experiments. Furthermore, the transition regime with two well-defined coexisting states supports our postulation of two coupled binding (slip) states.
Conclusions
In a series of SMFS experiments at constant forces and pulling velocities, we investigated the interaction between the HD of the human sulfatase Sulf1 and various GAGs with different sulfation patterns. Focusing on the interplay between HD and its physiological GAG substrate HS, we found explicit catch bond characteristics that can be interpreted as the successive transition between two slip bond regimes. We modeled this by introducing a double-well energy landscape with two slip dissociation pathways. The small transition forces and energy barriers are in line with our assumption that the system remains in thermal equilibrium at any time of the experiment. Therefore, the occupation probability of both bound states can be calculated according to a canonical ensemble. The catch bond characteristic arises from a successive shift of the thermodynamic population probability of both bound states. As a consequence, this model explicitly suggests an allosteric transition of the HD binding site with the 6-O-sulfate groups serving as allosteric effector. Consistent with recent findings regarding the oriented enzymatic Sulf activity, we can sketch the role of HD within the directed 6-O-deslufation of HS: the interplay between multiple cooperative binding sites and conformational transitions hint on a directed allostery-driven mechanism that successively feeds 6-O-sulfate groups to the catalytic center and simultaneously drags the sulfatase along the GAG chain. Moreover, the clustering of 6-O-sulfates to well-confined S-regions within the HS chain appears to be essential for recognition, binding, and transitional switchover. In contrast, the solely N-sulfated K5-NS polysaccharide dissociates in a slip bond manner and therefore allostery-driven conformational transitions can be excluded. Additionally, we could predict and prove the two state two path concept for HD/HS dissociation behavior in dynamic SMFS experiments true, in full consistency with our force clamp experiments.
Acknowledgments
We thank Katja Tönsing for helping us with sample preparation issues and Viola Vogel for critical discussions and important feedback to understanding the nature of catch bond interactions. This work was supported by the Deutsche Forschungsgemeinschaft (SFB 613 to D.A. and DI 575/6 to T.D.).
Supporting Material
References
- 1.Bell G.I. Models for the specific adhesion of cells to cells. Science. 1978;200:618–627. doi: 10.1126/science.347575. [DOI] [PubMed] [Google Scholar]
- 2.Dembo M., Torney D.C., Hammer D. The reaction-limited kinetics of membrane-to-surface adhesion and detachment. Proc. R. Soc. Lond. B Biol. Sci. 1988;234:55–83. doi: 10.1098/rspb.1988.0038. [DOI] [PubMed] [Google Scholar]
- 3.Fritz J., Katopodis A.G., Anselmetti D. Force-mediated kinetics of single P-selectin/ligand complexes observed by atomic force microscopy. Proc. Natl. Acad. Sci. USA. 1998;95:12283–12288. doi: 10.1073/pnas.95.21.12283. [DOI] [PMC free article] [PubMed] [Google Scholar]
- 4.Marshall B.T., Long M., Zhu C. Direct observation of catch bonds involving cell-adhesion molecules. Nature. 2003;423:190–193. doi: 10.1038/nature01605. [DOI] [PubMed] [Google Scholar]
- 5.Anselmetti D., Bartels F.W., Sewald N. Reverse engineering of an affinity-switchable molecular interaction characterized by atomic force microscopy single-molecule force spectroscopy. Langmuir. 2008;24:1365–1370. doi: 10.1021/la702373b. [DOI] [PubMed] [Google Scholar]
- 6.Bartels F.W., McIntosh M., Becker A. Effector-stimulated single molecule protein-DNA interactions of a quorum-sensing system in Sinorhizobium meliloti. Biophys. J. 2007;92:4391–4400. doi: 10.1529/biophysj.106.082016. [DOI] [PMC free article] [PubMed] [Google Scholar]
- 7.Dammer U., Hegner M., Güntherodt H.J. Specific antigen/antibody interactions measured by force microscopy. Biophys. J. 1996;70:2437–2441. doi: 10.1016/S0006-3495(96)79814-4. [DOI] [PMC free article] [PubMed] [Google Scholar]
- 8.Eckel R., Ros R., Anselmetti D. Supramolecular chemistry at the single-molecule level. Angew. Chem. Int. Ed. Engl. 2005;44:484–488. doi: 10.1002/anie.200461382. [DOI] [PubMed] [Google Scholar]
- 9.Eckel R., Wilking S.D., Anselmetti D. Single-molecule experiments in synthetic biology: an approach to the affinity ranking of DNA-binding peptides. Angew. Chem. Int. Ed. Engl. 2005;44:3921–3924. doi: 10.1002/anie.200500152. [DOI] [PubMed] [Google Scholar]
- 10.Florin E.L., Moy V.T., Gaub H.E. Adhesion forces between individual ligand-receptor pairs. Science. 1994;264:415–417. doi: 10.1126/science.8153628. [DOI] [PubMed] [Google Scholar]
- 11.Fuhrmann A., Schoening J.C., Ros R. Quantitative analysis of single-molecule RNA-protein interaction. Biophys. J. 2009;96:5030–5039. doi: 10.1016/j.bpj.2009.03.022. [DOI] [PMC free article] [PubMed] [Google Scholar]
- 12.Harder A., Walhorn V., Anselmetti D. Single-molecule force spectroscopy of cartilage aggrecan self-adhesion. Biophys. J. 2010;99:3498–3504. doi: 10.1016/j.bpj.2010.09.002. [DOI] [PMC free article] [PubMed] [Google Scholar]
- 13.Hinterdorfer P., Baumgartner W., Schindler H. Detection and localization of individual antibody-antigen recognition events by atomic force microscopy. Proc. Natl. Acad. Sci. USA. 1996;93:3477–3481. doi: 10.1073/pnas.93.8.3477. [DOI] [PMC free article] [PubMed] [Google Scholar]
- 14.Moy V.T., Florin E.L., Gaub H.E. Intermolecular forces and energies between ligands and receptors. Science. 1994;266:257–259. doi: 10.1126/science.7939660. [DOI] [PubMed] [Google Scholar]
- 15.Schröder T., Geisler T., Mattay J. Single-molecule force spectroscopy of supramolecular heterodimeric capsules. Phys. Chem. Chem. Phys. 2010;12:10981–10987. doi: 10.1039/c0cp00227e. [DOI] [PubMed] [Google Scholar]
- 16.Walhorn V., Schäfer C., Anselmetti D. Functional characterization of a supramolecular affinity switch at the single molecule level. Nanoscale. 2011;3:4859–4865. doi: 10.1039/c1nr10912j. [DOI] [PubMed] [Google Scholar]
- 17.Wollschläger K., Gaus K., Sewald N. Single-molecule experiments to elucidate the minimal requirement for DNA recognition by transcription factor epitopes. Small. 2009;5:484–495. doi: 10.1002/smll.200800945. [DOI] [PubMed] [Google Scholar]
- 18.Thomas W.E., Trintchina E., Sokurenko E.V. Bacterial adhesion to target cells enhanced by shear force. Cell. 2002;109:913–923. doi: 10.1016/s0092-8674(02)00796-1. [DOI] [PubMed] [Google Scholar]
- 19.Guo B., Guilford W.H. Mechanics of actomyosin bonds in different nucleotide states are tuned to muscle contraction. Proc. Natl. Acad. Sci. USA. 2006;103:9844–9849. doi: 10.1073/pnas.0601255103. [DOI] [PMC free article] [PubMed] [Google Scholar]
- 20.Yago T., Lou J., Zhu C. Platelet glycoprotein Ibalpha forms catch bonds with human WT vWF but not with type 2B von Willebrand disease vWF. J. Clin. Invest. 2008;118:3195–3207. doi: 10.1172/JCI35754. [DOI] [PMC free article] [PubMed] [Google Scholar]
- 21.Kong F., García A.J., Zhu C. Demonstration of catch bonds between an integrin and its ligand. J. Cell Biol. 2009;185:1275–1284. doi: 10.1083/jcb.200810002. [DOI] [PMC free article] [PubMed] [Google Scholar]
- 22.Barsegov V., Thirumalai D. Dynamics of unbinding of cell adhesion molecules: transition from catch to slip bonds. Proc. Natl. Acad. Sci. USA. 2005;102:1835–1839. doi: 10.1073/pnas.0406938102. [DOI] [PMC free article] [PubMed] [Google Scholar]
- 23.Beste M.T., Hammer D.A. Selectin catch-slip kinetics encode shear threshold adhesive behavior of rolling leukocytes. Proc. Natl. Acad. Sci. USA. 2008;105:20716–20721. doi: 10.1073/pnas.0808213105. [DOI] [PMC free article] [PubMed] [Google Scholar]
- 24.Björnham O., Axner O. Catch-bond behavior of bacteria binding by slip bonds. Biophys. J. 2010;99:1331–1341. doi: 10.1016/j.bpj.2010.06.003. [DOI] [PMC free article] [PubMed] [Google Scholar]
- 25.Evans E., Leung A., Zhu C. Mechanical switching and coupling between two dissociation pathways in a P-selectin adhesion bond. Proc. Natl. Acad. Sci. USA. 2004;101:11281–11286. doi: 10.1073/pnas.0401870101. [DOI] [PMC free article] [PubMed] [Google Scholar]
- 26.Liu F., Ou-Yang Z.C. Force modulating dynamic disorder: a physical model of catch-slip bond transitions in receptor-ligand forced dissociation experiments. Phys. Rev. E Stat. Nonlin. Soft Matter Phys. 2006;74:051904. doi: 10.1103/PhysRevE.74.051904. [DOI] [PubMed] [Google Scholar]
- 27.Lou J., Zhu C. A structure-based sliding-rebinding mechanism for catch bonds. Biophys. J. 2007;92:1471–1485. doi: 10.1529/biophysj.106.097048. [DOI] [PMC free article] [PubMed] [Google Scholar]
- 28.Pereverzev Y.V., Prezhdo E., Sokurenko E.V. The two-pathway model of the biological catch-bond as a limit of the allosteric model. Biophys. J. 2011;101:2026–2036. doi: 10.1016/j.bpj.2011.09.005. [DOI] [PMC free article] [PubMed] [Google Scholar]
- 29.Pereverzev Y.V., Prezhdo O.V. Force-induced deformations and stability of biological bonds. Phys. Rev. E Stat. Nonlin. Soft Matter Phys. 2006;73:050902. doi: 10.1103/PhysRevE.73.050902. [DOI] [PubMed] [Google Scholar]
- 30.Pereverzev Y.V., Prezhdo O.V., Thomas W.E. The two-pathway model for the catch-slip transition in biological adhesion. Biophys. J. 2005;89:1446–1454. doi: 10.1529/biophysj.105.062158. [DOI] [PMC free article] [PubMed] [Google Scholar]
- 31.Suzuki Y., Dudko O.K. Single-molecule rupture dynamics on multidimensional landscapes. Phys. Rev. Lett. 2010;104:048101. doi: 10.1103/PhysRevLett.104.048101. [DOI] [PubMed] [Google Scholar]
- 32.Thomas W., Forero M., Vogel V. Catch-bond model derived from allostery explains force-activated bacterial adhesion. Biophys. J. 2006;90:753–764. doi: 10.1529/biophysj.105.066548. [DOI] [PMC free article] [PubMed] [Google Scholar]
- 33.Barsegov V., Thirumalai D. Dynamic competition between catch and slip bonds in selectins bound to ligands. J. Phys. Chem. B. 2006;110:26403–26412. doi: 10.1021/jp0653306. [DOI] [PubMed] [Google Scholar]
- 34.Lamanna W.C., Kalus I., Dierks T. The heparanome—the enigma of encoding and decoding heparan sulfate sulfation. J. Biotechnol. 2007;129:290–307. doi: 10.1016/j.jbiotec.2007.01.022. [DOI] [PubMed] [Google Scholar]
- 35.Vivès R.R., Seffouh A., Lortat-Jacob H. Post-synthetic regulation of HS structure: the yin and yang of the sulfs in cancer. Front Oncol. 2014;3:331. doi: 10.3389/fonc.2013.00331. [DOI] [PMC free article] [PubMed] [Google Scholar]
- 36.Dhoot G.K., Gustafsson M.K., Emerson C.P., Jr. Regulation of Wnt signaling and embryo patterning by an extracellular sulfatase. Science. 2001;293:1663–1666. doi: 10.1126/science.293.5535.1663. [DOI] [PubMed] [Google Scholar]
- 37.Morimoto-Tomita M., Uchimura K., Rosen S.D. Cloning and characterization of two extracellular heparin-degrading endosulfatases in mice and humans. J. Biol. Chem. 2002;277:49175–49185. doi: 10.1074/jbc.M205131200. [DOI] [PMC free article] [PubMed] [Google Scholar]
- 38.Frese M.-A., Milz F., Dierks T. Characterization of the human sulfatase Sulf1 and its high affinity heparin/heparan sulfate interaction domain. J. Biol. Chem. 2009;284:28033–28044. doi: 10.1074/jbc.M109.035808. [DOI] [PMC free article] [PubMed] [Google Scholar]
- 39.Milz F., Harder A., Dierks T. Cooperation of binding sites at the hydrophilic domain of cell-surface sulfatase Sulf1 allows for dynamic interaction of the enzyme with its substrate heparan sulfate. Biochim. Biophys. Acta. 2013;1830:5287–5298. doi: 10.1016/j.bbagen.2013.07.014. [DOI] [PubMed] [Google Scholar]
- 40.Ai X., Do A.-T., Emerson C.P., Jr. Substrate specificity and domain functions of extracellular heparan sulfate 6-O-endosulfatases, QSulf1 and QSulf2. J. Biol. Chem. 2006;281:4969–4976. doi: 10.1074/jbc.M511902200. [DOI] [PubMed] [Google Scholar]
- 41.Garcia-Manyes S., Bucior I., Fernàndez-Busquets X. Proteoglycan mechanics studied by single-molecule force spectroscopy of allotypic cell adhesion glycans. J. Biol. Chem. 2006;281:5992–5999. doi: 10.1074/jbc.M507878200. [DOI] [PubMed] [Google Scholar]
- 42.Jarchow J., Fritz J., Fernàndez-Busquets X. Supramolecular structure of a new family of circular proteoglycans mediating cell adhesion in sponges. J. Struct. Biol. 2000;132:95–105. doi: 10.1006/jsbi.2000.4309. [DOI] [PubMed] [Google Scholar]
- 43.Hutter J.L., Bechhoefer J. Calibration of atomic-force microscope tips. Rev. Sci. Instrum. 1993;64:1868–1873. [Google Scholar]
- 44.Thomas W. Catch bonds in adhesion. Annu. Rev. Biomed. Eng. 2008;10:39–57. doi: 10.1146/annurev.bioeng.10.061807.160427. [DOI] [PubMed] [Google Scholar]
- 45.Neuhoff V., Arold N., Ehrhardt W. Improved staining of proteins in polyacrylamide gels including isoelectric focusing gels with clear background at nanogram sensitivity using Coomassie Brilliant Blue G-250 and R-250. Electrophoresis. 1988;9:255–262. doi: 10.1002/elps.1150090603. [DOI] [PubMed] [Google Scholar]
- 46.Hegner M., Wagner P., Semenza G. Ultralarge atomically flat template-stripped Au surfaces for scanning probe microscopy. Surf. Sci. 1993;291:39–46. [Google Scholar]
- 47.Sarangapani K.K., Qian J., Zhu C. Regulation of catch bonds by rate of force application. J. Biol. Chem. 2011;286:32749–32761. doi: 10.1074/jbc.M111.240044. [DOI] [PMC free article] [PubMed] [Google Scholar]
- 48.Bartolo D., Derényi I., Ajdari A. Dynamic response of adhesion complexes: beyond the single-path picture. Phys. Rev. E Stat. Nonlin. Soft Matter Phys. 2002;65:051910. doi: 10.1103/PhysRevE.65.051910. [DOI] [PubMed] [Google Scholar]
- 49.Cheung L.S.-L., Raman P.S., Konstantopoulos K. Biophysics of selectin-ligand interactions in inflammation and cancer. Phys. Biol. 2011;8:015013. doi: 10.1088/1478-3975/8/1/015013. [DOI] [PubMed] [Google Scholar]
- 50.Pereverzev Y.V., Prezhdo O.V., Sokurenko E.V. Anomalously increased lifetimes of biological complexes at zero force due to the protein-water interface. J. Phys. Chem. B. 2008;112:11440–11445. doi: 10.1021/jp803819a. [DOI] [PubMed] [Google Scholar]
- 51.Klepeis J.L., Lindorff-Larsen K., Shaw D.E. Long-timescale molecular dynamics simulations of protein structure and function. Curr. Opin. Struct. Biol. 2009;19:120–127. doi: 10.1016/j.sbi.2009.03.004. [DOI] [PubMed] [Google Scholar]
- 52.Lee T.-H., Gonzalez J.I., Dickson R.M. Strongly enhanced field-dependent single-molecule electroluminescence. Proc. Natl. Acad. Sci. USA. 2002;99:10272–10275. doi: 10.1073/pnas.162356799. [DOI] [PMC free article] [PubMed] [Google Scholar]
- 53.Yang W.Y., Gruebele M. Folding at the speed limit. Nature. 2003;423:193–197. doi: 10.1038/nature01609. [DOI] [PubMed] [Google Scholar]
- 54.Evans E., Ritchie K. Dynamic strength of molecular adhesion bonds. Biophys. J. 1997;72:1541–1555. doi: 10.1016/S0006-3495(97)78802-7. [DOI] [PMC free article] [PubMed] [Google Scholar]
- 55.Kramers H.A. Brownian motion in a field of force and the diffusion model of chemical reactions. Physica. 1940;7:284–304. [Google Scholar]
- 56.Lee C.Y., Lou J., McIntire L.V. Actin depolymerization under force is governed by lysine 113:glutamic acid 195-mediated catch-slip bonds. Proc. Natl. Acad. Sci. USA. 2013;110:5022–5027. doi: 10.1073/pnas.1218407110. [DOI] [PMC free article] [PubMed] [Google Scholar]
- 57.Rakshit S., Zhang Y., Sivasankar S. Ideal, catch, and slip bonds in cadherin adhesion. Proc. Natl. Acad. Sci. USA. 2012;109:18815–18820. doi: 10.1073/pnas.1208349109. [DOI] [PMC free article] [PubMed] [Google Scholar]
- 58.Seffouh A., Milz F., Vivès R.R. HSulf sulfatases catalyze processive and oriented 6-O-desulfation of heparan sulfate that differentially regulates fibroblast growth factor activity. FASEB J. 2013;27:2431–2439. doi: 10.1096/fj.12-226373. [DOI] [PubMed] [Google Scholar]
- 59.Bergethon P.R. Springer; New York: 2000. The Physical Basis of Biochemistry: The Foundations of Molecular Biophysics. [Google Scholar]
- 60.Gallagher J.T. Multiprotein signalling complexes: regional assembly on heparan sulphate. Biochem. Soc. Trans. 2006;34:438–441. doi: 10.1042/BST0340438. [DOI] [PubMed] [Google Scholar]
- 61.Leali D., Belleri M., Presta M. Fibroblast growth factor-2 antagonist activity and angiostatic capacity of sulfated Escherichia coli K5 polysaccharide derivatives. J. Biol. Chem. 2001;276:37900–37908. doi: 10.1074/jbc.M105163200. [DOI] [PubMed] [Google Scholar]
Associated Data
This section collects any data citations, data availability statements, or supplementary materials included in this article.