

Abstract
Background
The American Heart Association's Life's Simple 7 metric is being used to track the population's cardiovascular health (CVH) toward a 2020 goal for improvement. The metric includes body mass index (BMI), blood pressure, cholesterol, glucose, physical activity (PA), cigarette smoking, and diet. We hypothesized a lower risk of venous thromboembolism (VTE) with favorable Life's Simple 7 scores.
Methods and Results
REGARDS recruited 30 239 black and white participants ≥45 years of age across the United States in 2003–2007. A 14‐point summary score for Life's Simple 7 classified participants into inadequate (0 to 4 points), average (5 to 9 points), and optimal (10 to 14 points) categories. Hazard ratios (HRs) of incident VTE were calculated for these categories, adjusting for age, sex, race, income, education, and region of residence. For comparison, HRs of VTE were calculated using the Framingham 10‐year coronary risk score. There were 263 incident VTE cases over 5.0 years of follow‐up; incidence rates per 1000 person‐years declined from 2.9 (95% confidence interval [CI], 2.3 to 3.7) among those in the inadequate category to 1.8 (95% CI, 1.4 to 2.4) in the optimal category. Compared to the inadequate category, participants in the average category had a 38% lower VTE risk (95% CI, 11 to 57) and participants in the optimal category had a 44% lower risk (95% CI, 18 to 62). The individual score components related to lower VTE risk were ideal PA and BMI. There was no association of Framingham Score with VTE.
Conclusions
Life's Simple 7, a CVH metric, was associated with reduced VTE risk. Findings suggest that efforts to improve the population's CVH may reduce VTE incidence.
Keywords: epidemiology, risk, thrombosis
Introduction
In 2008, the Surgeon General issued a Call to Action to Prevent Deep Vein Thrombosis (DVT) and Pulmonary Embolism (PE).1 Despite this call to action, little has been done on a population level to reduce venous thromboembolism (VTE), and the obesity epidemic is likely impacting incidence unfavorably given that obesity is a major risk factor for VTE.2 In 2010, the American Heart Association (AHA) developed a metric, “Life's Simple 7” for defining and improving cardiovascular health (CVH).3 The metric is being tracked over time in order to monitor success in improving the CVH of all Americans by 20% by the year 2020, a key element of the organization's strategic goals. The Life's Simple 7 metric is comprised of 7 modifiable factors, including body mass index (BMI), blood pressure (BP), cholesterol, glucose, physical activity (PA), cigarette smoking, and diet, incorporated to promote lifestyle changes and translation into prevention programs.
Accumulating evidence suggests that risk factors for atherosclerosis and VTE are partially shared; however, associations with VTE are generally weaker than for atherosclerotic disease, and the relationship between venous and arterial thrombosis risk remains uncertain.4 Relationships of the individual Life's Simple 7 components with VTE risk have been evaluated in epidemiological studies, but findings are inconsistent.5–10 Efforts to improve CVH by the AHA could conceivably have the additional benefit of reducing VTE, but whether the Life's Simple 7 composite score is a risk factor for VTE is unknown.
To determine the possible impact of better CVH on VTE incidence, we studied the association of the AHA's Life's Simple 7 metric and its individual components with VTE risk in the REasons for Geographic And Racial Differences in Stroke (REGARDS) study, a large biracial population‐based cohort from the contiguous United States. Given that racial disparities have been demonstrated for both the Life's Simple 7 score and VTE incidence,11–13 we evaluated associations separately by race. We also compared associations of the Framingham 10‐year coronary heart disease (CHD) risk score, designed to predict CHD risk, with VTE.
Methods
Participants
REGARDS is a population‐based cohort study evaluating racial and geographic disparities in stroke and cognitive decline in the contiguous United States. After mailings to potential participants identified from a commercial list, between January 2003 and October 2007, 30 239 individuals 45 years and older were enrolled by telephone and examined by an in‐home visit. Telephone response rate was 33% and cooperation rate 49%, similar to other cohort studies.14 Black participants and residents of the stroke belt in the southeastern United States (North Carolina, South Carolina, Georgia, Alabama, Mississippi, Tennessee, Arkansas, and Louisiana) were oversampled by design. The sample included 45% men and 55% women, 58% whites and 42% blacks, 56% stroke belt residents, and 44% residents of the other 40 contiguous states.15 Individuals with active cancer or undergoing cancer treatment were excluded.
Demographic, socioeconomic factors, medical history (including self‐reported VTE), and verbal informed consent were obtained using a computer‐assisted telephone interview. At the in‐home examination, written informed consent was obtained and BP, anthropomorphic measures, blood samples, electrocardiogram, and a medication inventory were assessed using standardized protocols.15 Baseline use of hormone replacement therapy was defined as never, former, or current use. At the end of the in‐home examination, the Block 98 food frequency questionnaire (FFQ) was left with the participants for self‐administration and mailed to the study coordinating center.16 Using the FFQ, each participant recorded food intake for the previous year. Study methods were reviewed and approved by the institutional review boards at each study institution. For this analysis, 1749 participants who reported a history of VTE before the baseline examination and 1088 participants using warfarin at baseline were excluded.
Measurements and Definitions
Life's Simple 7
Each component of the Life's Simple 7 metric was classified into poor, intermediate, or ideal categories as shown in Table 1, according to the AHA definition.3,17 Each Life's Simple 7 component was given a point score of 0, 1, or 2 to represent poor, intermediate, or ideal health categories, respectively.18 An overall score ranging from 0 to 14 was then calculated as the sum of the 7 component scores. This score was categorized as inadequate (0 to 4), average (5 to 9), or optimal (10 to 14) for CVH. Diet information was missing or unusable for 6086 (27%) participants, and Life's Simple 7 summary scores were not calculated for these participants.
Table 1.
Definitions of Life's Simple 7 Poor, Intermediate, and Ideal Behaviors and Health Categories as Applied in the REGARDS Study
| Goal/Metric | Poor Health Definition | Intermediate Health Definition | Ideal Health Definition |
|---|---|---|---|
| Current smoking | Yes | Former ≤12 months | Never or quit >12 months |
| Body mass index | ≥30 kg/m2 | 25 to 29.9 kg/m2 | <25 kg/m2 |
| Physical activity | None | 1 to 3 times per week | ≥4 times per week |
| Healthy diet score | 0 to 1 components | 2 to 3 components | 4 to 5 components |
| Total cholesterol | ≥240 mg/dL | 200 to 239 mg/dL or treated to goal | <200 mg/dL (not on treatment) |
| Blood pressure | SBP: ≥140 mm Hg or DBP: ≥90 mm Hg | SBP: 120 to 139 mm Hg or DBP: 80 to 89 mm Hg or treated to goal | SBP: <120 mm Hg and DBP: <80 mm Hg (not on treatment) |
| Fasting plasma glucose | ≥126 mg/dL | 100 to 125 mg/dL or treated to goal | <100 mg/dL (not on treatment) |
DBP indicates diastolic blood pressure; REGARDS, REasons for Geographic And Racial Differences in Stroke; SBP, systolic blood pressure.
Source: American Heart Association, Inc, Lloyd‐Jones et al.3 for adults ≥20 years of age.
Income was dichotomized at $75 000 annually with a separate category for 3730 participants unwilling to disclose this information. Education was dichotomized as less than college degree versus college graduate or above.
Venous thrombosis ascertainment
VTE endpoints were adjudicated through an ancillary study to REGARDS. The outcome was first incident DVT or PE adjudicated through February 2011. Detailed methods for case ascertainment have been reported on previously.13 Briefly, participants or their proxies were contacted every 6 months to identify potential strokes and hospitalizations for other causes.19 Potential VTE cases were ascertained using 4 approaches. First, at each telephone call, participants or proxies were asked for an update on their medical status and the reasons for any hospitalizations. A research nurse reviewed the text recorded for each reported hospitalization through February 2010. Any report of a blood clot in the legs, arms, or lungs was considered a potential case. Second, between February 2010 and February 2011, participants were questioned during their follow‐up phone calls about any history of possible VTE. Third, reasons for all deaths were reviewed for any data suggesting possible VTE (National Death Index cause, exit interview with proxy or next of kin, and records from last hospital stay). Fourth, VTE events discovered from review of other events (eg, stroke and CHD) were abstracted.
For potential VTE cases identified as above, in‐ or outpatient medical records, including provider notes and imaging reports for DVT or PE, were obtained. A panel of physicians reviewed the records to confirm presence or absence of VTE. Validation of DVT required positive imaging findings, using duplex ultrasound for DVT and computed tomography or ventilation perfusion scanning for PE. Events were classified as provoked if they occurred within 90 days of major trauma, surgery, marked immobility, or were associated with active cancer or chemotherapy. All other events were considered unprovoked.
Statistical Analysis
All analyses were completed using SAS software (version 9.3; SAS Institute Inc., Cary, NC). VTE incidence rates and 95% confidence intervals (CIs) were calculated for poor, intermediate, or ideal levels of each of the individual Life's Simple 7 components, as well as for inadequate, average, or optimal category of the overall score. Cox proportional hazards models were used to calculate the hazard ratio (HR) (as an estimate of relative risk) of VTE by baseline status for the overall score categories, for a 1‐point increment in the overall score, and for each of the individual Life's Simple 7 components (in separate models with each component examined individually). Models were adjusted for age, sex, income, education, race, region of residence, and race×region interaction (owing to a known interaction of race and region on VTE incidence in the cohort).13 The proportional hazards assumption was confirmed by examining Schoenfeld residuals. Separate models were adjusted additionally for baseline aspirin or statin use. Given that Life's Simple 7 is related to kidney disease,17 and kidney disease is a VTE risk factor,20 additional adjustment for baseline estimated glomerular filtration rate (eGFR) was also undertaken.
We also calculated VTE incidence rates and HRs using the Framingham 10‐year CHD risk score, which includes 4 of the 7 Life's Simple 7 components (cholesterol, BP, diabetes, and smoking). This score calculates the predicted 10‐year risk of a CHD event and was categorized as 0% to 5% (reference), 5% to 10% (low risk), 10% to 20% (intermediate risk), and 20+% (high risk). Analyses were adjusted as described above, with added adjustment for statin use at baseline.
All analyses were performed in the overall study population and then separately by race, for provoked and unprovoked VTE, and for DVT versus PE±DVT. Interaction terms for the overall Life's Simple 7 scores, and for the individual score components, were evaluated by sex and were considered significant if the interaction P value was <0.10. Owing to the fact that racial disparities have been demonstrated for both the Life's Simple 7 score and VTE incidence,11–13 we planned a priori to present secondary analyses stratified by race.
Sensitivity analyses were performed to test whether obesity status explained the associations of the overall Life's Simple 7 scores with VTE by excluding BMI from the overall score metric (creating a score calculated as the sum of the 6 remaining components ranging from 0 to 12). Because diet information was missing or unusable for a large number of participants, analyses were performed by excluding participants with missing information for any one of the Life's Simple 7 components and calculating the VTE HRs for each of the 7 components in individual models.
Results
There were 263 incident VTEs over a median follow‐up of 5.0 years (mean, 4.7); 99 in black participants, 164 in white participants, 110 in women, and 153 in men. Of the cases, 125 were unprovoked and 138 were provoked, 135 were DVT, and 122 were PE±DVT. Table 2 shows that participants with incident VTE were more likely to be older and male, relative to those without VTE, but there were only minor differences in race, region of residence, income, and education. There was no difference in hormone replacement therapy use between cases and noncases. Figure shows the time to VTE in the 3 Life's Simple 7 categories (inadequate, average, and optimal CVH).
Table 2.
Baseline Characteristics of REGARDS Participants Who Did or Did Not Develop VTE
| Characteristic | Developed VTE (n=263) | No VTE (n=26 765) |
|---|---|---|
| Age, y (SD) | 69 (8.5) | 65 (9.4) |
| Sex (male), n (%) | 153 (58) | 11 949 (45) |
| Race (black), n (%) | 99 (38) | 11 155 (42) |
| Region (stroke belt), n (%) | 138 (52) | 14 868 (56) |
| Income >$75 000, n (%) | 37 (14) | 4401 (16) |
| College graduate, n (%) | 92 (35) | 9458 (35) |
| BMI, kg/m2 (SD) | 30.2 (5.9) | 29.3 (6.2) |
| Systolic blood pressure, mm Hg (SD) | 128 (17) | 128 (17) |
| Diastolic blood pressure, mm Hg (SD) | 76 (9) | 77 (10) |
| Cholesterol‐total, mg/dL (SD) | 188 (38) | 193 (40) |
| Glucose, mg/dL (SD) | 100 (25) | 104 (36) |
| Smoking status, n (%) | ||
| Never | 112 (43) | 12 132 (45) |
| Former | 116 (44) | 10 646 (40) |
| Current | 34 (13) | 3887 (15) |
| Physical activity, n (%) | ||
| None | 110 (42) | 8878 (34) |
| 1 to 3 times per week | 86 (33) | 9635 (36) |
| 4 or more times per week | 65 (25) | 7880 (30) |
| Healthy diet score, n (%) | ||
| Poor | 174 (83) | 15 530 (80) |
| Intermediate | 35 (17) | 3819 (19.5) |
| Ideal | 0 (0) | 8 (0.5) |
| Hormone replacement therapy, n (%) | ||
| Never | 47 (43) | 6593 (45) |
| Former | 45 (41) | 5814 (39) |
| Current | 17 (16) | 2411 (16) |
BMI indicates body mass index; REGARDS, REasons for Geographic And Racial Differences in Stroke; VTE, venous thromboembolism.
Figure 1.
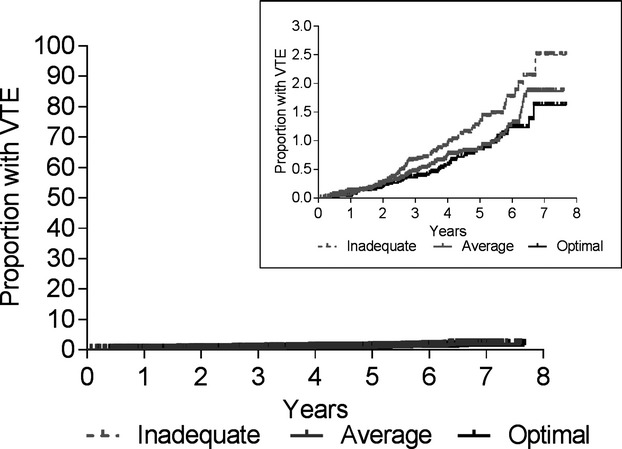
Cumulative incidence of venous thromboembolism (VTE) by Life's Simple 7 summary score categories.
Table 3 shows the incidence rates and HRs of VTE by Life's Simple 7 category. The incidence rates of VTE declined from 2.9 per 1000 person‐years to 1.8 per 1000 across improving Life's Simple 7 categories. Compared to those in the inadequate category, those in the optimal category had a 44% lower risk of VTE (95% CI, 18 to 62) and those in the average category had a 38% lower risk (95% CI, 11 to 57), adjusted for age, sex, income, education, race, region, and race×region interaction. In models with additional adjustment for baseline use of aspirin, statins, or eGFR, results were not appreciably altered (data not shown). The adjusted HR for a 1‐point improvement in the 14‐point score (ie, a shift from poor to intermediate, or intermediate to ideal for any 1 of the 7 components) was 0.88 (95% CI, 0.82 to 0.95). Associations were similar in black and white participants (P interaction=0.74; Table 4), as well as for men and women (P interaction=0.86).
Table 3.
Incidence Rates and Adjusted Hazard Ratios of VTE for Life's Simple 7 Summary Score
| Life's Simple 7 Summary Score | n VTE/N at Risk | Person‐Years | IR (95% CI) | HR* (95% CI) |
|---|---|---|---|---|
| Inadequate (0 to 4 points) | 67/5015 | 23 024 | 2.9 (2.3 to 3.7) | 1 (Ref) |
| Average (5 to 9 points) | 59/5966 | 28 515 | 2.1 (1.6 to 2.7) | 0.62 (0.43 to 0.89) |
| Optimal (10 to 14 points) | 48/5510 | 26 315 | 1.8 (1.4 to 2.4) | 0.56 (0.38 to 0.82) |
| Per 1 point better score | 174/16 491 | n/a | n/a | 0.88 (0.82 to 0.95) |
CI indicates confidence interval; HR, hazard ratio; IR, incidence rate per 1000 person‐years; n/a, not applicable; VTE, venous thromboembolism.
HR adjusted for age, sex, income, education, race, region, and race×region interaction.
Table 4.
Incidence Rates and Adjusted HRs of VTE for Life's Simple 7 Summary Score Stratified by Race
| Life's Simple 7 Summary Score | Black Participants | White Participants | ||||||
|---|---|---|---|---|---|---|---|---|
| n VTE/N at Risk | Person‐Years | IR (95% CI) | HR* (95% CI) | n VTE/N at Risk | Person‐Years | IR (95% CI) | HR* (95% CI) | |
| Inadequate (0 to 4 points) | 31/2269 | 10 170 | 3.0 (2.1 to 4.3) | 1 (Ref) | 36/2746 | 12 854 | 2.8 (2.0 to 3.9) | 1 (Ref) |
| Average (5 to 9 points) | 17/2034 | 9552 | 1.8 (1.1 to 2.9) | 0.53 (0.29 to 0.97) | 42/3932 | 18 963 | 2.2 (1.6 to 3.0) | 0.68(0.43 to 1.07) |
| Optimal (10 to 14 points) | 10/1127 | 5262 | 1.9 (1.0 to 3.5) | 0.56 (0.27 to 1.16) | 38/4383 | 21 053 | 1.8 (1.3 to 2.5) | 0.58 (0.36 to 0.92) |
| Per 1 point better score | 58/5430 | n/a | n/a | 0.86 (0.75 to 0.99) | 116/11 061 | n/a | n/a | 0.89 (0.81 to 0.98) |
CI indicates confidence interval; HR, hazard ratio; IR, incidence rate per 1000 person‐years; n/a, not applicable; VTE, venous thromboembolism.
HR adjusted for age, sex, income, education, and region.
The interpretation of the results was not altered in analyses of provoked or unprovoked VTE, or for DVT versus PE±DVT. For provoked VTE, the HR was 0.51 (95% CI, 0.31 to 0.83) for the average category and 0.51 (95% CI, 0.30 to 0.85) for the optimal category. For unprovoked VTE, the HRs were 0.77 (95% CI, 0.46 to 1.29) for average and 0.63 (95% CI, 0.35 to 1.13) for optimal categories. The HR for DVT was 0.65 (95% CI, 0.39 to 1.06) for the average category and 0.60 (95% CI, 0.36 to 1.02) for the optimal category. For PE±DVT, the HR was 0.55 (95% CI, 0.33 to 0.94) for average and 0.54 (95% CI, 0.31 to 0.96) for optimal status.
For comparison, using the Framingham 10‐year CHD risk prediction score, the incidence rates of VTE were 1.4 per 1000 person‐years for the reference category (0% to 5% 10‐year risk; n=52 VTE), 2.1 per 1000 for those with low risk (5% to 10%; n=59 VTE), 2.6 per 1000 for those with intermediate risk (10% to 20%; n=61 VTE), and 2.1 per 1000 for those with high risk (>20%; n=25 VTE). Compared to the 0% to 5% reference category, the HR was 1.10 (95% CI, 0.74 to 1.63) for low, 1.14 (95% CI, 0.74 to 1.75) for intermediate, and 0.74 (95% CI, 0.42 to 1.28) for high‐risk categories, in models adjusted for age, sex, income, education, race, region, race×region interaction, and statin use.
Table 5 shows the incidence rates and adjusted HRs of VTE for each Life's Simple 7 component, expressed as poor, intermediate, or ideal, evaluated in separate models. There was no association between baseline status of total cholesterol, BP, blood glucose, or smoking status with risk of future VTE. In contrast, the incidence rate of VTE decreased progressively across the poor, intermediate, and ideal categories for PA and BMI. Compared to those with poor status for PA, those with ideal status had a 41% lower risk of future VTE (95% CI, 19 to 57) and those with intermediate status had a 30% lower VTE risk (95% CI, 7 to 47). Similarly, those with ideal BMI had a 66% lower risk of future VTE (95% CI, 37 to 69) whereas those with intermediate BMI had a 47% lower VTE risk (95% CI, 17 to 52). In models that included BMI and PA simultaneously, results were slightly attenuated. Adjusted for BMI, those in the ideal PA category had a 35% lower VTE risk (95% CI, 11 to 53) and adjusted for PA those in the ideal BMI category had a 54% lower VTE risk (95% CI, 34 to 68).
Table 5.
Incidence Rates and Adjusted HRs of VTE for Individual Components of Life's Simple 7
| Component | Category | n VTE/N at Risk | IR (95% CI) | HR* (95% CI) |
|---|---|---|---|---|
| Total cholesterol | Poor | 21/2962 | 1.5 (1.0 to 2.3) | 1 (Ref) |
| Intermediate | 127/13 614 | 2.0 (1.7 to 2.4) | 1.12 (0.70 to 1.78) | |
| Ideal | 103/9346 | 2.3 (1.9 to 2.8) | 1.32 (0.82 to 2.12) | |
| Blood pressure | Poor | 63/6132 | 2.2 (1.7 to 2.8) | 1 (Ref) |
| Intermediate | 159/16 048 | 2.1 (1.8 to 2.5) | 1.04 (0.78 to 1.40) | |
| Ideal | 40/4782 | 1.8 (1.3 to 2.5) | 1.05 (0.70 to 1.57) | |
| Blood glucose | Poor | 18/2471 | 1.6 (1.0 to 2.5) | 1 (Ref) |
| Intermediate | 51/6196 | 1.7 (1.3 to 2.3) | 1.06 (0.62 to 1.82) | |
| Ideal | 140/13 763 | 2.2 (1.8 to 2.5) | 1.36 (0.83 to 2.23) | |
| Physical activity | Poor | 110/8988 | 2.7 (2.2 to 3.2) | 1 (Ref) |
| Intermediate | 86/9721 | 1.9 (1.5 to 2.3) | 0.70 (0.53 to 0.93) | |
| Ideal | 65/7945 | 1.7 (1.3 to 2.2) | 0.59 (0.43 to 0.81) | |
| Healthy diet score | Poor | 174/15 704 | 2.3 (2.0 to 2.7) | 1 (Ref) |
| Intermediate | 35/3854 | 1.9 (1.4 to 2.7) | 0.87 (0.60 to 1.26) | |
| Ideal | 0/8 | 0 | n/a | |
| Smoking | Poor | 34/3921 | 2.0 (1.4 to 2.7) | 1 (Ref) |
| Intermediate | 2/526 | 0.8 (0.2 to 3.3) | 0.32 (0.08 to 1.33) | |
| Ideal | 227/22 581 | 2.1 (1.9 to 2.4) | 0.87 (0.60 to 1.26) | |
| Body mass index | Poor | 119/10 188 | 2.5 (2.1 to 3.0) | 1 (Ref) |
| Intermediate | 96/9987 | 2.0 (1.6 to 2.5) | 0.63 (0.48 to 0.83) | |
| Ideal | 44/6690 | 1.4 (1.1 to 1.9) | 0.44 (0.31 to 0.63) |
CI indicates confidence interval; HR, hazard ratio; IR, incidence rate per 1000 person‐years; n/a, not applicable; VTE, venous thromboembolism.
HR adjusted for age, sex, income, education, race, region, and race×region interaction.
For the diet component, few participants were in the ideal category (8 of 19 566 participants at risk). Those with intermediate diet had a 13% lower risk of future VTE than those with poor diet, although this was not statistically significant.
Results for the individual Life's Simple 7 components were not materially different in race‐stratified analyses (all race interaction, P>0.10; Table 6), in analyses of provoked and unprovoked VTE, or analyses of DVT versus PE±DVT.
Table 6.
Incidence Rates and Adjusted HRs of VTE for Individual Components of Life's Simple 7 Stratified by Race
| Component | Category | Black Participants | White Participants | ||||
|---|---|---|---|---|---|---|---|
| n VTE/N at Risk | IR (95% CI) | HR* (95% CI) | n VTE/N at Risk | IR (95% CI) | HR* (95% CI) | ||
| Total cholesterol | Poor | 8/1283 | 1.4 (0.7 to 2.7) | 1 (Ref) | 13/1679 | 1.6 (1.0 to 2.8) | 1 (Ref) |
| Intermediate | 44/5246 | 1.8 (1.4 to 2.5) | 1.23 (0.58 to 2.63) | 83/8368 | 2.1 (1.7 to 2.6) | 1.05 (0.58 to 1.89) | |
| Ideal | 41/4122 | 2.2 (1.6 to 3.0) | 1.45 (0.68 to 3.12) | 62/5224 | 2.5 (1.9 to 3.2) | 1.23 (0.67 to 2.27) | |
| Blood pressure | Poor | 25/3263 | 1.7 (1.1 to 2.5) | 1 (Ref) | 38/2869 | 2.7 (2.0 to 3.7) | 1 (Ref) |
| Intermediate | 62/6798 | 2.0 (1.5 to 2.5) | 1.25 (0.78 to 1.98) | 97/9250 | 2.2 (1.8 to 2.7) | 0.90 (0.62 to 1.32) | |
| Ideal | 12/1160 | 2.3 (1.3 to 4.1) | 1.67 (0.84 to 3.35) | 28/3622 | 1.6 (1.1 to 2.4) | 0.83 (0.50 to 1.36) | |
| Blood glucose | Poor | 7/1380 | 1.1 (0.5 to 2.4) | 1 (Ref) | 11/1091 | 2.1 (1.2 to 3.8) | 1 (Ref) |
| Intermediate | 28/2860 | 2.1 (1.5 to 3.1) | 1.84 (0.80 to 4.21) | 23/3336 | 1.4 (1.0 to 2.2) | 0.66 (0.32 to 1.35) | |
| Ideal | 40/4742 | 1.8 (1.3 to 2.5) | 1.65 (0.74 to 3.69) | 100/9021 | 2.3 (1.9 to 2.8) | 1.11 (0.60 to 2.08) | |
| Physical activity | Poor | 51/4127 | 2.7 (2.1 to 3.6) | 1 (Ref) | 59/4861 | 2.6 (2.0 to 3.4) | 1 (Ref) |
| Intermediate | 29/4025 | 1.6 (1.1 to 2.2) | 0.55 (0.35 to 0.87) | 57/5696 | 2.1 (1.6 to 2.7) | 0.82 (0.57 to 1.19) | |
| Ideal | 19/2952 | 1.4 (0.9 to 2.2) | 0.47 (0.28 to 0.81) | 46/4993 | 1.9 (1.4 to 2.5) | 0.67 (0.45 to 0.99) | |
| Healthy diet score | Poor | 62/5501 | 2.4 (1.9 to 3.1) | 1 (Ref) | 112/10 203 | 2.3 (1.9 to 2.7) | 1 (Ref) |
| Intermediate | 8/1127 | 1.5 (0.8 to 3.0) | 0.66 (0.31 to 1.39) | 27/2727 | 2.1 (1.4 to 3.0) | 0.96 (0.63 to 1.47) | |
| Ideal | 0/1 | 0 | n/a | 0/7 | 0 | n/a | |
| Smoking | Poor | 17/1931 | 2.0 (1.2 to 3.2) | 1 (Ref) | 17/1990 | 1.9 (1.2 to 3.1) | 1 (Ref) |
| Intermediate | 1/278 | 0.8 (0.1 to 5.8) | 0.34 (0.05 to 2.59) | 1/248 | 0.8 (0.1 to 6.0) | 0.30 (0.04 to 2.29) | |
| Ideal | 81/9045 | 1.9 (1.6 to 2.4) | 0.86 (0.51 to 1.47) | 146/13 536 | 2.2 (1.9 to 2.6) | 0.88 (0.53 to 1.47) | |
| Body mass index | Poor | 51/5365 | 2.1 (1.6 to 2.8) | 1 (Ref) | 68/4823 | 3.0 (2.4 to 3.8) | 1 (Ref) |
| Intermediate | 32/3760 | 1.8 (1.3 to 2.6) | 0.74 (0.47 to 1.16) | 64/6227 | 2.1 (1.7 to 2.7) | 0.57 (0.40 to 0.80) | |
| Ideal | 14/2036 | 1.5 (0.9 to 2.6) | 0.58 (0.32 to 1.06) | 30/4654 | 1.4 (1.0 to 2.0) | 0.37 (0.24 to 0.58) | |
CI indicates confidence interval; HR, hazard ratio; IR, incidence rate per 1000 person‐years; n/a, not applicable; VTE, venous thromboembolism.
HR adjusted for age, sex, income, education, and region.
In a sensitivity analysis to evaluate whether the relationships of the overall Life's Simple 7 score with VTE were explained by BMI (the individual component most strongly related to VTE; Table 5), BMI was excluded from the score (creating a score calculated as the sum of the 6 remaining components). Without BMI included in the score, the HR for the average health category was 0.56 (95% CI, 0.39 to 0.80) and for the optimal health category was 0.64 (95% CI, 0.44 to 0.94).
In sensitivity analyses excluding participants with missing information for any one of the Life's Simple 7 components (n=11 300), relationships among each of the 7 individual score components with VTE were essentially unchanged.
Discussion
In this prospective population‐based cohort study, favorable status for Life's Simple 7, a metric of CVH, was associated with lower risk of VTE in black and white adults recruited from across the contiguous United States. Ideal PA and ideal BMI were strongly related to VTE risk, and these associations were independent of each other. These findings suggest that achieving the AHA's 2020 goals to improve the CVH of all Americans may also reduce the incidence of VTE.
Life's Simple 7 was developed by the AHA as part of its strategic impact goal to improve the CVH of all Americans by 2020.3 Increasing numbers of ideal Life's Simple 7 components were associated with lower incidence of myocardial infarction and stroke in previous studies.11,18,21 Whereas it is generally considered that the pathogenesis of atherosclerotic CVD and VTE are distinct,5 accumulating evidence suggests that atherosclerosis and VTE risk factors may be partly shared.4,22 Findings here do not strongly support this notion given that there was no association of Framingham CHD risk score with VTE risk, and because the factors driving the association of Life's Simple 7 and VTE were obesity (which is weakly or not associated with CHD risk) and PA, but not cholesterol, BP, smoking, or blood glucose.
We are not aware of other studies of Life's Simple 7 and VTE risk. We observed a strong association, with average and optimal Life's Simple 7 health categories associated with 38% and 44% lower risks of VTE, respectively. Associations were nearly identical in black and white participants, as well as by gender. In contrast, a lack of association of Framingham CHD risk scores with VTE risk highlights significant differences in the information provided by these scores and the different goals for each score. The Framingham CHD risk score was designed to predict CHD risk whereas Life's Simple 7 was designed to target lifestyle interventions to improve CVH. Our results suggest that population‐wide CVD risk reduction by Life's Simple 7 may also have the additional population health benefit of reducing VTE risk.
At present, relationships between PA and VTE risk are controversial. We demonstrated a strong inverse relationship that was independent of BMI, even using a relatively crude measure of PA. The Longitudinal Investigation of Thromboembolism Etiology study, a prospective observational study similar to REGARDS, showed divergent associations by age. In younger participants, there was no association between baseline PA level and VTE, whereas in elderly people (ages 65 and older) strenuous exercise was associated with increased VTE risk.5,7 Moderate and regular exercise were also associated with lower DVT risk in case‐control studies.23–24
Obesity is the lifestyle risk factor most consistently associated with VTE22,25; however, the mechanism is not understood.26 Ideal BMI category was associated with a 66% lower VTE risk in our study. A favorable Life's Simple 7 status, however, was still associated with lower VTE risk when BMI was excluded from the score. Given that obesity is increasing at an alarming rate worldwide, our results further underscore the importance of measures aimed at reducing obesity prevalence.
There were no associations of baseline health status of glucose status, hypertension, smoking, or dyslipidemia with VTE in our study. Reports describing the relationships of these factors with VTE were also inconsistent in other studies.5,22,27–31 Though individually these components may not be strongly related to VTE risk, they are likely interrelated with other VTE risk factors. Therefore, improvements in a single CVH component may influence improvements of other CVH components.18
The strengths of our study include the large, prospective cohort design with participants from the entire contiguous United States, as well as oversampling of black participants allowing for the evaluation of racial differences. An additional strength is the physician‐validated VTE events.
Limitations include that VTE case ascertainment relied predominately on participant report, and record retrieval was not 100% in REGARDS,13 so events were likely missed. Some variables, including medical history, income, and diet, also relied on participant report, which may have resulted in misclassification. We would expect this misclassification to bias results toward the null hypothesis. Life's Simple 7 was examined at a single time point, precluding the evaluation of changes in score with VTE risk. We also do not have information on some VTE risk factors, such as genetic thrombophilia, lung disease, frailty, heart failure, or venous insufficiency, but expect that these are not likely confounders. Importantly, this is an observational study and the Life's Simple 7 metric has not been tested experimentally, and it is not possible to establish causality.
In conclusion, favorable status of the Life's Simple 7 metric, a summary measure of CVH proposed by the AHA, was associated with lower VTE risk in a large cohort of American adults. These findings suggest that efforts to improve the population's CVH based on the AHA's Life's Simple 7 may reduce VTE incidence and could help to achieve the Surgeon General's call to action to reduce DVT and PE.
Acknowledgments
The authors thank the investigators, staff, and participants of the REGARDS study for their valuable contributions. A full list of participating REGARDS investigators and institutions can be found at http://www.regardsstudy.org. The authors are grateful for the efforts of Rebecca Marin, the REGARDS‐VTE study coordinator.
Sources of Funding
This study was supported by a cooperative agreement U01 NS041588 from the National Institute of Neurological Disorders and Stroke (NINDS) and the American Recovery and Reinvestment Act grant RC1HL099460 from the National Heart, Lung, and Blood Institute (NHLBI). Dr Olson was supported by NHLBI 5T32HL007594.
Disclosures
None.
References
- Office of the Surgeon General, National Heart, Lung, and Blood Institute. The Surgeon General's Call to Action to Prevent Deep Vein Thrombosis and Pulmonary Embolism. 2008Rockville, MD: Office of the Surgeon General (US)2008 [PubMed] [Google Scholar]
- Allman‐Farinelli MA. Obesity and venous thrombosis: a review. Semin Thromb Hemost. 2011; 37:903-907. [DOI] [PubMed] [Google Scholar]
- Lloyd‐Jones DM, Hong Y, Labarthe D, Mozaffarian D, Appel LJ, Van Horn L, Greenlund K, Daniels S, Nichol G, Tomaselli GF, Arnett DK, Fonarow GC, Ho PM, Lauer MS, Masoudi FA, Robertson RM, Roger V, Schwamm LH, Sorlie P, Yancy CW, Rosamond WDAmerican Heart Association Strategic Planning Task Force and Statistics Committee. Defining and setting national goals for cardiovascular health promotion and disease reduction: the American Heart Association's strategic Impact Goal through 2020 and beyond. Circulation. 2010; 121:586-613. [DOI] [PubMed] [Google Scholar]
- Lijfering WM, Flinterman LE, Vandenbroucke JP, Rosendaal FR, Cannegieter SC. Relationship between venous and arterial thrombosis: a review of the literature from a causal perspective. Semin Thromb Hemost. 2011; 37:885-896. [DOI] [PubMed] [Google Scholar]
- Tsai AW, Cushman M, Rosamond WD, Heckbert SR, Polak JF, Folsom AR. Cardiovascular risk factors and venous thromboembolism incidence: the longitudinal investigation of thromboembolism etiology. Arch Intern Med. 2002; 162:1182-1189. [DOI] [PubMed] [Google Scholar]
- Steffen LM, Folsom AR, Cushman M, Jacobs DR, Jr, Rosamond WD. Greater fish, fruit, and vegetable intakes are related to lower incidence of venous thromboembolism: the Longitudinal Investigation of Thromboembolism Etiology. Circulation. 2007; 115:188-195. [DOI] [PubMed] [Google Scholar]
- van Stralen KJ, Doggen CJ, Lumley T, Cushman M, Folsom AR, Psaty BM, Siscovick D, Rosendaal FR, Heckbert SR. The relationship between exercise and risk of venous thrombosis in elderly people. J Am Geriatr Soc. 2008; 56:517-522. [DOI] [PubMed] [Google Scholar]
- Abdollahi M, Cushman M, Rosendaal FR. Obesity: risk of venous thrombosis and the interaction with coagulation factor levels and oral contraceptive use. Thromb Haemost. 2003; 89:493-498. [PubMed] [Google Scholar]
- Hansson PO, Eriksson H, Welin L, Svardsudd K, Wilhelmsen L. Smoking and abdominal obesity: risk factors for venous thromboembolism among middle‐aged men: “the study of men born in 1913”. Arch Intern Med. 1999; 159:1886-1890. [DOI] [PubMed] [Google Scholar]
- van Langevelde K, Flinterman LE, van Hylckama Vlieg A, Rosendaal FR, Cannegieter SC. Broadening the factor V Leiden paradox: pulmonary embolism and deep‐vein thrombosis as 2 sides of the spectrum. Blood. 2012; 120:933-946. [DOI] [PubMed] [Google Scholar]
- Dong C, Rundek T, Wright CB, Anwar Z, Elkind MS, Sacco RL. Ideal cardiovascular health predicts lower risks of myocardial infarction, stroke, and vascular death across whites, blacks, and Hispanics: the northern Manhattan study. Circulation. 2012; 125:2975-2984. [DOI] [PMC free article] [PubMed] [Google Scholar]
- Zakai NA, McClure LA. Racial differences in venous thromboembolism. J Thromb Haemost. 2011; 9:1877-1882. [DOI] [PubMed] [Google Scholar]
- Zakai NA, McClure LA, Judd SE, Safford MM, Folsom AR, Lutsey PL, Cushman M. Racial and regional differences in venous thromboembolism in the United States in 3 cohorts. Circulation. 2014; 129:1502-1509. [DOI] [PMC free article] [PubMed] [Google Scholar]
- Morton LM, Cahill J, Hartge P. Reporting participation in epidemiologic studies: a survey of practice. Am J Epidemiol. 2006; 163:197-203. [DOI] [PubMed] [Google Scholar]
- Howard VJ, Cushman M, Pulley L, Gomez CR, Go RC, Prineas RJ, Graham A, Moy CS, Howard G. The reasons for geographic and racial differences in stroke study: objectives and design. Neuroepidemiology. 2005; 25:135-143. [DOI] [PubMed] [Google Scholar]
- Block G, Wakimoto P, Block T. A revision of the Block Dietary Questionnaire and database, based on NHANES III data Available at: http://nutritionquest.com/products/B98_DEV.pdf.
- Muntner P, Judd SE, Gao L, Gutierrez OM, Rizk DV, McClellan W, Cushman M, Warnock DG. Cardiovascular risk factors in CKD associate with both ESRD and mortality. J Am Soc Nephrol. 2013; 24:1159-1165. [DOI] [PMC free article] [PubMed] [Google Scholar]
- Kulshreshtha A, Vaccarino V, Judd SE, Howard VJ, McClellan WM, Muntner P, Hong Y, Safford MM, Goyal A, Cushman M. Life's Simple 7 and risk of incident stroke: the reasons for geographic and racial differences in stroke study. Stroke. 2013; 44:1909-1914. [DOI] [PMC free article] [PubMed] [Google Scholar]
- Howard VJ, Kleindorfer DO, Judd SE, McClure LA, Safford MM, Rhodes JD, Cushman M, Moy CS, Soliman EZ, Kissela BM, Howard G. Disparities in stroke incidence contributing to disparities in stroke mortality. Ann Neurol. 2011; 69:619-627. [DOI] [PMC free article] [PubMed] [Google Scholar]
- Mahmoodi BK, Gansevoort RT, Naess IA, Lutsey PL, Braekkan SK, Veeger NJ, Brodin EE, Meijer K, Sang Y, Matsushita K, Hallan SI, Hammerstrom J, Cannegieter SC, Astor BC, Coresh J, Folsom AR, Hansen JB, Cushman M. Association of mild to moderate chronic kidney disease with venous thromboembolism: pooled analysis of five prospective general population cohorts. Circulation. 2012; 126:1964-1971. [DOI] [PMC free article] [PubMed] [Google Scholar]
- Folsom AR, Yatsuya H, Nettleton JA, Lutsey PL, Cushman M, Rosamond WD. Community prevalence of ideal cardiovascular health, by the American Heart Association definition, and relationship with cardiovascular disease incidence. J Am Coll Cardiol. 2011; 57:1690-1696. [DOI] [PMC free article] [PubMed] [Google Scholar]
- Ageno W, Becattini C, Brighton T, Selby R, Kamphuisen PW. Cardiovascular risk factors and venous thromboembolism: a meta‐analysis. Circulation. 2008; 117:93-102. [DOI] [PubMed] [Google Scholar]
- van Stralen KJ, Blom JW, Doggen CJ, Rosendaal FR. Strenuous sport activities involving the upper extremities increase the risk of venous thrombosis of the arm. J Thromb Haemost. 2005; 3:2110-2111. [DOI] [PubMed] [Google Scholar]
- van Stralen KJ, Le Cessie S, Rosendaal FR, Doggen CJ. Regular sports activities decrease the risk of venous thrombosis. J Thromb Haemost. 2007; 5:2186-2192. [DOI] [PubMed] [Google Scholar]
- Cushman M. Epidemiology and risk factors for venous thrombosis. Semin Hematol. 2007; 44:62-69. [DOI] [PMC free article] [PubMed] [Google Scholar]
- Braekkan SK, Siegerink B, Lijfering WM, Hansen JB, Cannegieter SC, Rosendaal FR. Role of obesity in the etiology of deep vein thrombosis and pulmonary embolism: current epidemiological insights. Semin Thromb Hemost. 2013; 39:533-540. [DOI] [PubMed] [Google Scholar]
- Petrauskiene V, Falk M, Waernbaum I, Norberg M, Eriksson JW. The risk of venous thromboembolism is markedly elevated in patients with diabetes. Diabetologia. 2005; 48:1017-1021. [DOI] [PubMed] [Google Scholar]
- Goldhaber SZ, Grodstein F, Stampfer MJ, Manson JE, Colditz GA, Speizer FE, Willett WC, Hennekens CH. A prospective study of risk factors for pulmonary embolism in women. JAMA. 1997; 277:642-645. [PubMed] [Google Scholar]
- Wattanakit K, Lutsey PL, Bell EJ, Gornik H, Cushman M, Heckbert SR, Rosamond WD, Folsom AR. Association between cardiovascular disease risk factors and occurrence of venous thromboembolism: a time‐dependent analysis. Thromb Haemost. 2012; 108:508-515. [DOI] [PMC free article] [PubMed] [Google Scholar]
- Doggen CJ, Smith NL, Lemaitre RN, Heckbert SR, Rosendaal FR, Psaty BM. Serum lipid levels and the risk of venous thrombosis. Arterioscler Thromb Vasc Biol. 2004; 24:1970-1975. [DOI] [PubMed] [Google Scholar]
- Deguchi H, Pecheniuk NM, Elias DJ, Averell PM, Griffin JH. High‐density lipoprotein deficiency and dyslipoproteinemia associated with venous thrombosis in men. Circulation. 2005; 112:893-899. [DOI] [PubMed] [Google Scholar]