

Abstract
Background
Data on the influence of obesity on atherosclerosis in Hispanics are inconsistent, possibly related to varying cardiometabolic risk among obese individuals. We aimed to determine the association of obesity and cardiometabolic risk with subclinical atherosclerosis in Mexican‐Americans.
Methods and Results
Participants (n=503) were drawn from the Cameron County Hispanic Cohort. Metabolic health was defined as <2 of the following: blood pressure ≥130/85; triglyceride ≥150 mg/dL; high‐density lipoprotein cholesterol <40 mg/dL (men) or <50 mg/dL (women); fasting glucose ≥100 mg/dL; homeostasis model assessment of insulin resistance value >5.13; or high‐sensitivity C‐reactive protein >3 mg/L. Carotid intima media thickness (cIMT) was measured. A high proportion of participants (77.8%) were metabolically unhealthy; they were more likely to be male, older, with fewer years of education, and less likely to meet daily recommendations regarding fruit and vegetable servings. One‐third (31.8%) had abnormal carotid ultrasound findings. After adjusting for covariates, mean cIMT varied across the obesity phenotypes (P=0.0001); there was no difference among the metabolically unhealthy regardless of whether they were obese or not. In multivariable analysis, after adjusting for covariates, cardiometabolic risk (P=0.0159), but not obesity (P=0.1446), was significantly associated with subclinical atherosclerosis.
Conclusions
In Mexican‐Americans, cardiometabolic risk has a greater effect on early atherosclerosis development than body mass index. Non‐obese but metabolically unhealthy participants had similar development of subclinical atherosclerosis as their obese counterparts. Interventions to maintain metabolic health among obese and non‐obese patients may be a more important goal than weight loss alone.
Keywords: atherosclerosis, carotid intima‐media thickness, obesity, population, risk factors
Introduction
Obesity has been increasing in epidemic proportions over the past decades particularly in ethnic minority groups.1–2 Recently, there have been reports that this obesity trend may be levelling off in the United States,3 but that there is a disturbing ethnic disparity with a slower decline in non‐Hispanic blacks and an increase in Mexican‐Americans compared with non‐Hispanic whites.4 Obesity has an adverse impact on most of the cardiovascular (CV) risk factors5 with a shift in the incidence of these risk factors to a younger age.6 Obesity is thought to affect CV events through adverse remodeling of the large arteries, and a higher prevalence of subclinical vascular disease has been shown among those who are obese compared with those who are not.7–8 However, the influence of obesity on CV mortality is not as clear, and substantial data have been published over recent years demonstrating better prognosis in some obese patients compared with their leaner counterparts with the same CV disease (CVD).9–10 This discrepancy may be related to varying cardiometabolic profiles among obese individuals, which may have a more important effect on cardiovascular risk than obesity. Indeed the concept of “metabolically healthy” obesity has been studied and several investigators have recently shown that coronary heart disease may not be increased in this obesity phenotype.11–12
Mexican‐Americans have very high prevalence of obesity compared with non‐Hispanic whites. Data on CVD in Mexican‐Americans are likewise conflicting and despite the very high obesity prevalence, reported CV death rates are no higher than in whites.13 With the changing landscape of ethnic diversity in the United States, it is important to understand CV risk in distinct racial cohorts. We hypothesize that cardiometabolic risk has a greater effect on early atherosclerosis development than obesity in Mexican‐Americans and that the influence of cardiometabolic risk is more important than body mass index (BMI) alone. This study aimed to determine the association of subclinical atherosclerosis to obesity and abnormal cardiometabolic profile in asymptomatic, community‐dwelling, Mexican‐Americans.
Methods
Study Population
This study was approved by the Institutional Review Board of the University of Texas Health Science Center‐Houston and all participants gave written informed consent. Study participants were a subset of the Cameron County Hispanic Cohort (CCHC) (n=503), recruited from randomly selected blocks according to the 2000 Census as described previously.14 The CCHC is a homogenous community‐dwelling Mexican‐American cohort living in Brownsville (Cameron County), Texas, a city on the lower Rio Grande River at the United States‐Mexico border.
Extensive family, socioeconomic, educational, and personal medical histories, as well as physical activity and dietary histories, were obtained using a directed questionnaire. Surveys and data collection were conducted in the participants’ language of preference (Spanish or English) by bilingual research nurses and field workers. Physical activity was assessed using the International Physical Activity Questionnaire short‐form (IPAQ);15 reported minutes of physical activity per week were weighted by a metabolic equivalent (MET; multiples of resting energy expenditure) resulting in a physical activity estimate expressed as MET‐minutes per week.15 Participants were asked to fast for at least 10 hours overnight before a visit to the Clinical Research Unit. Anthropometric measurements obtained included height, weight, and waist circumference. Waist circumference (visceral adiposity) was measured at the level of the umbilicus to the nearest 0.2 cm, with the subject in a standing position and breathing normally. Height was measured to the nearest 0.2 cm using a stadiometer. BMI was calculated as weight in kilograms divided by height squared in meters (kg/m2). The average of 3 blood pressure (BP) and HR readings taken 5 minutes apart were used. Laboratory studies performed included fasting lipid panel, hemoglobin (Hb) A1c, fasting plasma glucose, and fasting serum insulin. Homeostasis model assessment insulin resistance index (HOMA‐IR) was calculated as fasting glucose (mg/dL)/18× fasting insulin (mU/L)/22.5.16 High‐sensitivity C‐reactive protein (hsCRP) levels were measured using a high‐sensitivity immunoassay (Dimension Vista 1500; Siemens Corporation, Washington, DC). High‐sensitivity CRP levels >10 mg/L were excluded from analysis as such high levels likely represent acute illness.17
The presence of hypertension was both self‐reported and measured as described below. The subject was deemed to be hypertensive if the mean systolic blood pressure (SBP) was ≥140 mm Hg or the mean diastolic blood pressure (DBP) was ≥90 mm Hg.18 Classification of diabetes was also both self reported and based on measurement of HbA1c (HbA1c>6.5%) as per the latest guidelines from the American Diabetes Association.19 Smoking status was defined as an affirmative answer to the question “Do you currently smoke cigarettes?” BMI was categorized according to the National Heart Lung and Blood Institute (NHLBI) with overweight defined as a BMI ≥25.0 kg/m2 and obesity defined as a BMI≥30.0 kg/m2. Morbid obesity was defined as a BMI ≥40.0 kg/m2.20
Obesity Phenotypes
Participants were categorized as obese or non‐obese using a BMI cutoff of ≥30.0 kg/m2 and then were further categorized as metabolically healthy or unhealthy. Metabolic health was defined as having <2 of the following cardiometabolic abnormalities: SBP ≥130 mm Hg and/or DBP ≥85 mm Hg or on antihypertensive medication; triglyceride ≥150 mg/dL; high‐density lipoprotein cholesterol <40 mg/dL in men or <50 mg/dL in women; fasting glucose ≥100 mg/dL or on hypoglycemic medication; HOMA‐IR value >5.13; or hsCRP >3 mg/L.21–22 Waist circumference was not included due to its high correlation with BMI.23 To better assess the inflammatory component of cardiometabolic risk, hsCRP was added to our criteria of metabolic health, as has been suggested by other investigators.21–22,24
Carotid Ultrasound Evaluation of Subclinical Atherosclerosis
Carotid ultrasound studies to evaluate subclinical atherosclerosis were performed using the Siemens Acuson X300 ultrasound system (Malvern, PA) using a VF 13‐5 linear array transducer. The protocol was designed following guidelines from the American Society of Echocardiography consensus statement on subclinical vascular disease.25 Both common carotids were imaged from 3 different angles for a total of 6 images. Carotid plaque presence was determined by examining the carotid bulb, its bifurcation and the carotid branch arteries in addition to the common carotid artery. Carotid IMT was measured using the Carotid Analyzer software (Medical Imaging Applications, Coralville, IA), a semi‐automated border detection program. Measurements were made at the R‐wave of the electrocardiogram on a minimum of 2 clips from each side and the results were averaged. Mean cIMT was categorized as being either <or ≥75th percentile for age and gender.25 Carotid plaque was defined as an area of wall thickening that was >50% of the thickness of the surrounding wall. Abnormal carotid ultrasound was then defined as a cIMT ≥75% for age and gender and/or presence of atherosclerotic plaque. All measurements were performed by a single blinded expert reader. Replicate readings were performed on 5% of the cohort and the intraclass correlation coefficient for our laboratory was 0.96.
Statistical Analysis
All analyses reported in this paper are adjusted for age and gender using the sampling weights. In addition, the analyses have taken into consideration clustering effects of multiple participants from the same household as well as census block.14 Data are summarized as weighted mean and standard error for continuous variables and weighted frequency and percentages for categorical variables. Participant demographics were stratified by gender and evaluated using univariable analysis. Cohort demographics and metabolic characteristics were compared by obesity phenotype groups and evaluated using univariable and multivariable analyses. Specifically, for comparing continuous variables, we applied survey‐weighted linear regression models from which Tukey‐Kramer‐adjusted P values were calculated and used for multiple pairwise mean comparisons. For comparing categorical variables, we applied survey‐weighted logistic regression to obtain the Rao‐Scott F‐adjusted chi‐square P values. Contingency coefficient was used to measure the degree of relationship between abnormal carotid ultrasound and obesity phenotypes. Multivariable survey‐weighted logistic regression analysis was performed to obtain the weighted odds ratios (OR) and 95% confidence intervals (CI) for abnormal carotid ultrasound by the obesity phenotype groups. Initially, a multivariable survey‐weighted linear regression model was created to identify factors associated with mean cIMT, among variables including the obesity phenotypes, age, gender, SBP, diabetes status, lipids, CRP, reported minutes of physical activity per week, servings of fruits and vegetables per day, and smoking status. Further analysis using a multivariable weighted linear regression model was then performed to assess the effects of cardiometabolic risk and obesity on mean cIMT, after adjusting for significant confounders. Variables that were not significant and were not confounders were excluded from the final model. Two‐way additive scale interaction effects between each pair of independent variables were tested. All statistical tests were two sided and conducted at 5% level of significance, and all analyses were performed using SAS 9.2 (SAS Institute Inc., Cary, NC).
Results
Demographics and metabolic characteristics are listed in Table 1. This is a relatively young cohort with a mean age of 50.4±0.95 years (range 18 to 85 years); 41% (n=159) were male. There was a high prevalence of CV risk factors in this cohort; 39% were hypertensive, 20.1% had diabetes, and 56.5% had dyslipidemia, with no gender differences in prevalence. However, men were more likely to be smokers than women (18.1% versus 6.7%, P<0.001). More than half of the cohort participants were obese (52.5%) and there were also no significant gender differences for the prevalence of obesity in the cohort. The mean CRP was 3.5±0.2 mg/L, which is considered to be in the high‐risk category for cardiovascular events,17 and there was no difference in CRP levels between men and women. Only 32.2% of the cohort met the minimum recommendations of ≥600 MET‐minutes of physical activity per week,26–27 and even less (12.5%) met the American Heart Association (AHA) recommendations for servings of fruit and vegetables per day,28 with no gender differences for both variables. The mean duration of education was 10.2±4.1 years. The median annual income was $20 000. Only 43.4% of women were employed versus 73.7% of the men (P<0.0001). Among those women who were employed, median annual income was significantly lower in women compared with men (P=0.0008).
Table 1.
Cohort Demographics and Metabolic Characteristics
| Total | Metabolically Healthy | Metabolically Unhealthy | P Value | |||
|---|---|---|---|---|---|---|
| Healthy Non‐Obese | Healthy Obese | Unhealthy Non‐Obese | Unhealthy Obese | |||
| n=503 | n=79 (17.8%) | n=25 (4.4%) | n=149 (29.7%) | n=250 (48.1%) | ||
| Categorical variables, n (%) | ||||||
| Men | 159 (41.0) | 24 (29.1) | 6 (29.7) | 59 (48.8) | 70 (41.7) | 0.1063 |
| Employed | 261 (55.8) | 52 (63.8) | 19 (74.5) | 72 (50.3) | 118 (54.6) | 0.2147 |
| Met minimum recommendations for physical activity of ≥600 MET‐minutes/week | 123 (32.2) | 29 (44.7) | 8 (35.4) | 41 (37.2) | 45 (23.9) | 0.0625 |
| Met recommendations of ≥5 servings of fruit and vegetables per day | 45 (12.5) | 11 (21.5) | 6 (37.4) | 10 (6.8) | 18 (9.6) | 0.0071 |
| Current smokers | 41 (11.3) | 8 (10.3) | 1 (2.5) | 11 (11.7) | 21 (12.2) | 0.4845 |
| Diabetes (ADA2010_DM variable) | 108 (20.1) | 0 (0) | 0 (0) | 32 (20.1) | 76 (29.2) | 0.1188 |
| CRP≥3 mg/L | 335 (71.3) | 28 (50.4) | 10 (52.4) | 93 (64.5) | 204 (85.1) | <0.0001 |
| Continuous variables, mean±SE | ||||||
| Age, y | 50.3±0.9 | 46.7±2.7 | 44.8±3.4 | 53.2±1.4 | 50.3±1.2 | 0.0421 |
| Annual household income (US dollars) | 35425±3664.2 | 43556±12153.0 | 31921±5571.5 | 29905±4978.3 | 35451±4270.5 | 0.6791 |
| Years of education | 10.7±0.3 | 12.2±0.6 | 11.9±0.9 | 10.0±0.4 | 10.6±0.4 | 0.0134 |
| Total minutes of moderate and vigorous activity | 901.2±179.6 | 1212.7±295.4 | 4148.0±3481.4 | 806.3±148.0 | 519.3±114.8 | 0.075 |
| Total cholesterol, mg/dL | 182.7±2.3 | 184.0±6.5 | 187.6±8.1 | 181.3±4.0 | 182.6±3.1 | 0.8471 |
| Triglycerides, mg/dL | 153.4±5.6 | 86.1±5.6 | 89.7±6.9 | 172.0±11.0 | 172.7±7.4 | <0.0001 |
| HDL‐cholesterol, mg/dL | 44.8±0.9 | 55.3±1.5 | 54.0±2.9 | 42.9±2.3 | 41.2±0.9 | <0.0001 |
| LDL‐cholesterol, mg/dL | 107.9±1.9 | 112.1±5 | 114.8±5.8 | 105.0±3.4 | 107.6±2.8 | 0.4184 |
| BMI, kg/m2 | 31.3±0.4 | 25.9±0.3 | 33.2±0.6 | 26.8±0.2 | 35.8±0.6 | <0.0001 |
| Waist circumference, cm | 104.0±1.0 | 91.1±1.0 | 104.9±1.8 | 96.5±0.8 | 113.3±1.4 | <0.0001 |
| Systolic blood pressure, mm Hg | 118.1±0.9 | 109.9±1.5 | 108.8±2.4 | 119.9±1.7 | 120.9±1.4 | <0.0001 |
| Diastolic blood pressure, mm Hg | 72.3±0.6 | 67.0±1.4 | 69.0±1.6 | 72.4±0.9 | 74.5±0.9 | 0.0007 |
| CRP, mg/L* | 3.5±0.2 | 2.4±0.4 | 3.5±0.3 | 2.1±0.4 | 4.3±0.3 | <0.0001 |
| Insulin, mg/dL | 15.3±1.1 | 8.3±0.6 | 11.5±0.9 | 14.2±2.0 | 19.2±1.8 | <0.0001 |
| Fasting blood glucose, mg/dL | 107.2±1.9 | 91.3±0.9 | 95.6±1.9 | 108.5±3.8 | 113.3±2.7 | <0.0001 |
| HOMA IR | 4.0±0.3 | 1.8±0.1 | 2.7±0.2 | 3.6±0.4 | 5.3±0.5 | <0.0001 |
| Hba1c, % | 5.6±0.1 | 5.1±0.1 | 5.2±0.2 | 5.6±0.1 | 5.9±0.1 | <0.0001 |
Data are adjusted for the probability of sampling using weights taking into consideration clustering effects arising from the same census block and household. BMI indicates body mass index; CRP, C‐reactive protein; HDL, high‐density lipoprotein; HOMA‐IR, homeostasis model assessment insulin resistance index; LDL, low‐density lipoprotein; MAT, metabolic equivalent.
CRP>10 mg/L excluded, n=283.
There was a high proportion (77.8%) of participants who were classified as metabolically unhealthy (n=149 [29.7%] for non‐obese participants and n=250 [48.1%] for obese participants; Table 1). Compared with those who were metabolically healthy, those classified as metabolically unhealthy were more likely to be male (44.4% versus 29.2%, P=0.029), were older (51.4±0.9 years versus 46.3±2.3 years, P=0.0325), had larger waist circumference (106.9±1.14 cm versus 93.8±1.1 cm, P<0.0001), and had fewer years of education (10.3±0.3 years versus 12.1±0.5 years, P=0.0017). They were also less likely to meet the recommended guidelines for eating 5 or more servings of fruits and vegetables per day (8.6% versus 24.4%, P<0.0046) compared with those who were metabolically healthy.
Nearly one‐third of the cohort (29.7%) was classified as metabolically unhealthy non‐obese. Among the non‐obese participants, those who were classified as metabolically unhealthy were also more likely to be male (48.8% versus 29.1%, P=0.026), were older (53.2±1.4 years versus 46.7±2.7 years, P=0.028), had larger waist circumference (96.5±0.8 cm versus 91.1±1.0 cm, P<0.0001), and had fewer years of education (10.0±0.4 years versus 12.2±0.6 years, P=0.003) compared with the metabolically healthy. They were also less likely to meet the recommended servings of fruits and vegetables per day (6.8% for unhealthy non‐obese versus 21.5% for healthy non‐obese, P=0.019). In this cohort, among the obese participants, only 4.4% (n=25) were classified as metabolically healthy. In contrast to the non‐obese participants, age and gender were not different among the metabolically healthy or unhealthy obese. Obese metabolically unhealthy participants had similarly larger waist circumference (113.3±1.4 cm versus 105.0±1.8 cm, P=0.0002) and were less likely to meet the recommended servings of fruits and vegetables per day (9.6% for unhealthy obese versus 37.4% for healthy obese, P=0.0065). In contrast to the non‐obese participants however, hsCRP levels were different between the metabolically healthy and unhealthy obese participants with the metabolically unhealthy obese more likely to have elevated hsCRP levels (≥3 mg/L) than their metabolically healthy counterparts (85.1% versus 52.4%, P=0.0009).
The mean cIMT for the cohort was 0.67±0.01 mm, with men having thicker mean cIMT than women (0.69±0.02 mm in men versus 0.65±0.01 mm in women; P=0.0228; Table 2). Age was highly correlated with cIMT (r=0.59, P<0.0001). One‐third of the cohort (31.8%) had abnormal carotid ultrasound findings defined as a cIMT ≥75% for age and gender and/or presence of atherosclerotic plaque. Mean cIMT varied across the 4 obesity phenotypes (P=0.0001). There was no difference in mean cIMT between the obese and non‐obese metabolically healthy phenotypes (P=0.986). Similarly, there was no difference in mean cIMT among those who were classified as metabolically unhealthy regardless of whether they were obese or not (P=1.00). In contrast, there was a significant difference in mean cIMT between the obese metabolically healthy and unhealthy phenotypes (P=0.038) and the non‐obese metabolically healthy and unhealthy phenotypes (P=0.0024, Figure). The weighted odds ratio for having an abnormal carotid ultrasound study was significantly greater than one only for the metabolically unhealthy phenotypes regardless of whether they were obese or non‐obese [OR=2.8 (95% CI 1.10, 6.93), P=0.0302 for the non‐obese participants; OR=3.26 (95% CI 1.30, 8.03), P=0.0114 for the obese participants, but was not significantly greater than one for the metabolically healthy obese phenotype (OR=1.6 [95% CI 0.42, 5.97], P=0.4907, Table 3).
Table 2.
Carotid Ultrasound Findings
| Total | Metabolically Healthy | Metabolically Unhealthy | P Value | |||
|---|---|---|---|---|---|---|
| Healthy Non‐Obese | Healthy Obese | Unhealthy Non‐Obese | Unhealthy Obese | |||
| n=503 | n=79 | n=25 | n=149 | n=250 | ||
| Categorical variables, n (%) | ||||||
| Mean cIMT ≥75% | 85 (17.5) | 2 (1.47) | 3 (8.77) | 29 (21.6) | 51 (21.71) | 0.0005 |
| Presence of plaque | 115 (24.2) | 10 (15.27) | 4 (16.69) | 36 (24.34) | 65 (28.11) | 0.2502 |
| Abnormal carotid study | 156 (31.8) | 11 (15.59) | 6 (22.72) | 50 (33.79) | 89 (37.4) | 0.0241 |
| Continuous variables, mean±SE | ||||||
| Mean cIMT, mm | 0.67±0.01 | 0.60±0.02 | 0.61±0.02 | 0.68±0.02 | 0.68±0.02 | 0.0001 |
cIMT indicates carotid intima media thickness.
Figure 1.
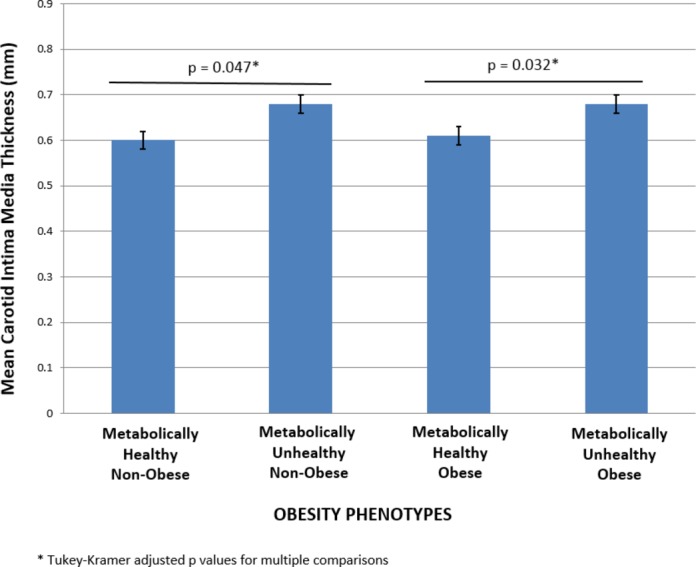
Obesity phenotypes and mean carotid intima media thickness.
Table 3.
Abnormal Carotid Ultrasound Study and Obesity Phenotype
| Metabolically Healthy | Metabolically Unhealthy | P Value | |||
|---|---|---|---|---|---|
| Healthy Non‐Obese | Healthy Obese | Unhealthy Non‐Obese | Unhealthy Obese | ||
| n=79 | n=25 | n=149 | n=250 | ||
| Abnormal carotid ultrasound | n (%)* | n (%)* | n (%)* | n (%)* | F approximation of Rao–Scott design‐adjusted chi‐square test P‐value |
| Yes | 11 (15.6) | 6 (22.7) | 50 (33.8) | 89 (37.4) | 0.0241 |
| No | 68 (84.4) | 19 (77.3) | 99 (66.2) | 161 (62.6) | |
| Weighted OR for abnormal carotid ultrasound (95% CI) | Reference | 1.6 (0.42, 5.97) | 2.8 (1.10, 6.93) | 3.26 (1.30, 8.03) | |
| Wald chi‐square test for parameter estimates P‐values | Reference | 0.4907 | 0.0302 | 0.0114 | Overall: 0.0549 |
Unweighted frequencies and weighted percentages.
Among the criteria used to describe metabolic health, systolic and diastolic BP, mean fasting glucose, and HOMA‐IR remained significantly correlated with obesity phenotype and mean cIMT after adjusting for age and gender. Our findings from a multivariable survey weighted linear regression model (which included the obesity phenotypes, age, gender, SBP, diabetes status, lipids, CRP, servings of fruit and vegetables per day, physical activity, and smoking status), revealed that age (P<0.0001), gender (P=0.0039), obesity phenotypes (P=0.0275), SBP (P=0.0179), and diabetes (P=0.0381) remained significantly associated with mean cIMT. In further analysis, using a multivariable analysis model, when we included obesity and cardiometabolic risk (which takes into account SBP and diabetes) as separate variables, we found that cardiometabolic risk (P=0.0159), but not obesity (P=0.1446), was significantly associated with subclinical atherosclerosis even after adjusting for age and gender (Table 4). Metabolically healthy participants had lower mean cIMT (0.64±0.01 versus 0.68±0.01 for metabolically unhealthy, P=0.0159, Table 4) regardless of whether they were obese or not. We did not find any significant interaction effects among the covariates.
Table 4.
Final Multivariable Linear Regression Model With BMI and Cardiometabolic Risk as 2 Level Categorical Variables with other Covariates
| Variable | Parameter Estimate | Standard Error | t Value | P>[t] |
|---|---|---|---|---|
| Estimated regression coefficients | ||||
| Intercept | 0.260 | 0.029 | 9.1 | <0.0001 |
| Obese (BMI≥30 kg/m2) | 0.023 | 0.016 | 1.46 | 0.1446 |
| Metabolically unhealthy (>2 cardiometabolic risk factors) | 0.033 | 0.014 | 2.42 | 0.0156 |
| Age | 0.007 | 0.001 | 11.38 | <0.0001 |
| Gender | 0.047 | 0.015 | 3.05 | 0.0025 |
| Adjusted Means | Standard Error | t Value | P>[t] | |
|---|---|---|---|---|
| Adjusted means and standard error based on multivariable regression model | ||||
| Obese (BMI≥30 kg/m2) | ||||
| Obese | 0.67 | 0.01 | 1.46 | 0.1446 |
| Not obese | 0.65 | 0.01 | ||
| Metabolically unhealthy (>2 cardiometabolic risk factors) | ||||
| Metabolically unhealthy | 0.68 | 0.01 | 2.42 | 0.0156 |
| Metabolically healthy | 0.64 | 0.01 | ||
| Gender | ||||
| Male | 0.68 | 0.01 | 3.05 | 0.0025 |
| Female | 0.64 | 0.01 | ||
BMI indicates body mass index.
Discussion
In Mexican‐Americans, cardiometabolic risk has a greater effect on early atherosclerosis development than BMI alone, and non‐obese but metabolically unhealthy participants had similar development of subclinical atherosclerosis as their obese counterparts. This study highlights the importance of assessing cardiometabolic risk in Mexican‐Americans regardless of BMI. Carotid IMT has been found to predict future risk of myocardial infarction and stroke, and a change in cIMT has been validated as a vascular marker for the progression of atherosclerosis.29–31 Subclinical atherosclerosis is prevalent in this asymptomatic community‐recruited cohort and is paralleled by the high prevalence of participants classified as metabolically unhealthy.
Our study is consistent with a large health‐screening cohort study among Asians that demonstrated that metabolically unhealthy obese participants had similar coronary artery calcium scores as metabolically unhealthy non‐obese participants,24 and the authors also suggested that metabolic health was more important in the development of overt atherosclerosis than obesity. In a white and black female cohort, Khan et al similarly demonstrated increased prevalence of subclinical atherosclerosis in metabolically abnormal overweight/obese women compared with their metabolically benign counterparts.22 In a Hispanic cohort, data from the San Antonio Heart Study showed that the risk of incident CVD (median follow‐up of 7.4 years) was increased in metabolically unhealthy normal weight participants but that there was no gradation of this risk by BMI.32 In other words, CVD risk did not depend on BMI among these participants and was related more to their baseline cardiometabolic risk. On the other hand, incident CVD had a gradation in risk by BMI among those who were metabolically healthy but obese, and those participants who were at the higher end of the obesity spectrum (ie, morbidly obese) were more likely to develop incident CVD. The authors suggested that these participants may have transitioned into a metabolically unhealthy phenotype. Indeed Appleton et al reported that metabolically healthy obese individuals are at increased risk of incident diabetes mellitus only if they progress to an unhealthy phenotype.33 Hence stability of metabolic health in the metabolically healthy obese phenotype appears to be crucial for the prevention of CV events.
Only 10% of obese individuals in our cohort were classified as metabolically healthy compared with the 31.7% prevalence for the entire US population based on the National Health and Nutrition Examination Survey (NHANES) data.21 The prevalence of the metabolically unhealthy obese phenotype in our cohort on the other hand, is more than twice that of the prevalence reported for the NHANES data (48.1% for the CCHC versus 20.9% for the NHANES data).21 Also worrisome is that only 17.8% of our cohort was classified as metabolically healthy non‐obese compared with the much higher prevalence estimate of 44.3% for the US population.21 These findings emphasize not only the obesity disparity among Mexican‐Americans compared with the US population as a whole but brings to light the finding that among non‐obese Mexican‐Americans, there is already a high prevalence of clustering of cardiometabolic risk factors. Our finding that the metabolically unhealthy phenotype was associated with age, male gender, and lower education levels is consistent with that from other large multi‐ethnic studies such as The Atherosclerosis Risk in Communities Study (ARIC) and NHANES data,21,34 but in addition we demonstrated that abdominal adiposity and less intake of fruits and vegetables are also associated with being metabolically unhealthy.
The World Health Organization (WHO) defines obesity as “abnormal or excessive fat accumulation in adipose tissue, to the extent that health is impaired.”35 Visceral adipose tissue is a metabolically active organ secreting hormones, cytokines, and growth factors (collectively called adipocytokines or adipokines),36–37 and is known to be associated with insulin resistance and its related metabolic abnormalities.38 However, in the clinical setting, accurate measurement of adipose tissue is relatively difficult and surrogate measures of adiposity are used routinely instead. BMI, one such surrogate measure of adiposity has proven to be relatively reliable,39 and in 2000, the WHO released an updated definition of overweight and obesity based on BMI criteria.40 BMI, however, cannot distinguish between fat tissue and lean tissue, is somewhat arbitrary, and has limitations in predicting risk in certain ethnic groups.41 BMI generally overestimates adiposity in persons with more lean body mass, such as athletes, and underestimates excess adiposity in persons with less lean body mass. Furthermore, the reference tables used regarding desirable weight‐for‐height values were based on the mortality experience of life insurance policies in the United States and Canada, a mostly white cohort.42–43 Our finding that cardiometabolic risk is significantly associated with subclinical atherosclerosis regardless of BMI, highlights the limitation of using BMI alone in Mexican‐Americans. We did quantify waist circumference as a measure of central adiposity and showed that this was different among the metabolically healthy or unhealthy phenotypes regardless of whether they were obese or not, but this was not significantly associated with subclinical atherosclerosis after adjusting for the other covariates. For future studies, we will look at dual X‐ray absorptiometry (DXA) scans in order to more accurately quantitate visceral adiposity.
In this study we chose to use the criterion for metabolic health as defined for the US population from the NHANES database.21 To date, there is no standardized definition of obesity phenotypes and metabolic health and there are over 30 different definitions of metabolic health in the literature.44 However in one study, 3 definitions of metabolic health were compared and no significant differences in the relationship of obesity phenotypes to all‐cause mortality were seen regardless of the definition used.44 We believe that variation across findings among different studies is not unexpected, but the main tenet that abnormal metabolic health impacts prevalence of CVD to a greater extent than BMI alone appears to be consistent. Consensus is needed if we are to move this concept to health policy and clinical care.
It has been suggested that obesity phenotypes represent heritable traits,45 but the genetic factors modulated by environmental factors mediating metabolic health among obese persons are not yet defined. On the other hand, one environmental factor that has been studied in these patients is level of physical activity. Indeed, it has been suggested that although body fatness and fitness are strong predictors of CVD, level of fitness largely negates the adverse effects of body fatness on CV morbidity and mortality.46–48 In our study, we did not find physical activity to be significantly associated with metabolic health regardless of BMI, and this covariate was not independently associated with subclinical atherosclerosis in a regression analysis after adjusting for other covariates. This finding is relevant and will need to be validated in a larger cohort study, but does suggest that improving fitness may not be a first approach to reducing risk in Mexican‐Americans. On the other hand, meeting recommendations regarding daily intake of fruits and vegetables was significantly different among those who were metabolically healthy or not in our cohort, and this finding can be applied when designing public health initiatives to reduce CVD risk in Mexican‐Americans.
There are some factors that may affect our results. This is a cross‐sectional study and cIMT was only evaluated once without long‐term follow‐up. However, this is a unique population‐based sample of randomly selected, apparently healthy, Mexican‐Americans, thus avoiding bias inherent in studies drawing from clinic populations with mixed ethnicity and established disease. Although the majority of covariates evaluated in this study were objectively measured, the use of questionnaires to assess physical activity and intake of fruits and vegetables has known disadvantages, particularly recall bias and measurement error. Nevertheless, the physical activity and food frequency questionnaires we used in this study have been validated for this ethnic group.15 Prospective studies are needed to determine whether targeted modification of cardiometabolic risk rather than focusing solely on weight loss actually translates to reduced cardiac events. Longitudinal data currently being collected should eventually provide this answer. In addition, a larger sample size is needed to confirm our findings as some obesity phenotype categories (particularly the metabolically healthy obese group) had smaller numbers of observations. On the other hand, the current study has a number of strengths, one of which is the very homogeneity of the cohort studied. To fully understand prevalent risk among Hispanics, the Hispanic population needs to be disaggregated into subgroups according to national origins and other characteristics49 as the paradoxical and conflicting findings related to CV health among Hispanics may reflect aggregation error of outcomes data across widely varied subgroups.50
In summary, a substantial gap still remains, particularly among ethnic groups, in the detection of asymptomatic individuals who ultimately develop CVD. In the United States, the Hispanic population has almost doubled between 1990 and 2007 (9% to 15%),51 and is projected to reach 30% by the year 2050. Of the Hispanics residing in the United States, Mexican‐Americans represent the largest and ethnically distinct subgroup. Hence, understanding and describing prevalent disease as well as defining and reducing risk burden in this minority population are important as the racial/ethnic landscape of the United States continues to change. More research is needed to identify factors that can prevent or potentially reverse the clustering of metabolic abnormalities in all categories of BMI. In our cohort, low cardiometabolic risk was uncommon, so maintenance of metabolic health in the Mexican‐Americans remains a major challenge. The findings in this study are particularly relevant to future public health planning as interventions to maintain metabolic health may be more important goal than focusing on weight loss alone.
Acknowledgments
We thank our cohort team, particularly Julie Ramirez, Jody Rodriguez, and Rocio Uribe who not only recruited and documented the participants, but also performed the ultrasound studies under expert supervision. We also thank Pablo Sanchez and Israel Hernandez for data management, Marcela Montemayor and other laboratory staff for their contributions, and Christina Villarreal for administrative support. We thank the Valley Baptist Medical Center in Brownsville for housing our Clinical Research Unit.
Sources of Funding
This work was supported by the Center for Clinical and Translational Sciences, which is funded by National Institutes of Health Clinical and Translational Award UL1 TR000371 from the National Center for Advancing Translational Sciences. The content is solely the responsibility of the authors and does not necessarily represent the official views of the National Center for Advancing Translational Sciences or the National Institutes of Health.
Disclosures
None.
References
- Ng M, Fleming T, Robinson M, Thomson B, Graetz N, Margono C, Mullany EC, Abbafati C, Abera SF, Abraham JP, Abu‐Rmeileh NME, Achoki T, AlBuhairan FS, Alemu ZA, Alfonso R, Ali MK, Ali R, Guzman NA, Ammar W, Anwari P, Banerjee A, Barquera S, Basu S, Bennett DA, Bhutta Z, Blore J, Cabral N, Nonato IC, Chang JC, Chowdhury R, Courville KJ, Criqui MH, Cundiff DK, Dabhadkar KC, Dandona L, Davis A, Dayama A, Dharmaratne SD, Ding EL, Durrani AM, Esteghamati A, Farzadfar F, Fay DFJ, Feigin VL, Flaxman A, Forouzanfar MH, Goto A, Green MA, Gupta R, Hafezi‐Nejad N, Hankey GJ, Harewood HC, Havmoeller R, Hay S, Hernandez L, Husseini A, Idrisov BT, Ikeda N, Islami F, Jahangir E, Jassal SK, Jee SH, Jeffreys M, Jonas JB, Kabagambe EK, Khalifa SEAH, Kengne AP, Khader YS, Khang YH, Kim D, Kimokoti RW, Kingge JM, Kokubo Y, Kosen S, Kwan G, Lai T, Leinsalu M, Li Y, Liang X, Liu S, Logroscino G, Lotufo PA, Lu Y, Ma J, Mainoo NK, Mensah GA, Merriman TR, Mokdad AH, Moschandreas J, Naghavi M, Naheed A, Nand D, Narayan KMV, Nelson EL, Neuhouser ML, Nisar MI, Ohkubo T, Oti SO, Pedroza A, Prabhakaran D, Roy N, Sampson U, Seo H, Sepanlou SG, Shibuya K, Shiri R, Shiue I, Singh GM, Singh JA, Skirbekk V, Stapelberg NJC, Sturua L, Sykes BL, Tobias M, Tran BX, Trasande L, Toyoshima H, van de Vijver S, Vasankari TJ, Veerman JL, Velasquez‐Melendez G, Vlassov VV, Vollset SE, Vos T, Wang C, Wang XR, Weiderpass E, Werdecker A, Wright JL, Yang YC, Yatsuya H, Yoon J, Yoon SJ, Zhao Y, Zhou M, Zhu S, Lopez AD, Murray CJL, Gakidou E, Gakidou E. Global, regional, and national prevalence of overweight and obesity in children and adults during 1980‐2013: a systematic analysis for the Global Burden of Disease Study 2013. Lancet. 2014; 384:766-781. [DOI] [PMC free article] [PubMed] [Google Scholar]
- James PT. Obesity: the worldwide epidemic. Clin Dermatol. 2004; 22:276-280. [DOI] [PubMed] [Google Scholar]
- Flegal KM, Carroll MD, Kit BK, Ogden CL. Prevalence of obesity and trends in the distribution of body mass index among US adults, 1999‐2010. JAMA. 2012; 307:491-497. [DOI] [PubMed] [Google Scholar]
- Fallah‐Fini S, Rahmandad H, Huang TTK, Bured RM, Glass TA. Modeling US adult obesity trends: A system dynamics model for estimating energy imbalance gap. Am J Public Health. 2014; 104:1230-1239. [DOI] [PMC free article] [PubMed] [Google Scholar]
- Rao SV, Donahue M, Pi‐Sunyer FX, Fuster V. Results of expert meetings: obesity and cardiovascular disease. Obesity as a risk factor in coronary artery disease. Am Heart J. 2001; 142:1102-1107. [DOI] [PubMed] [Google Scholar]
- Sinha R, Fisch G, Teague B, Tamborlane WV, Banyas B, Allen K, Savoye M, Rieger V, Taksali S, Barbetta G, Sherwin RS, Caprio S. Prevalence of impaired glucose tolerance among children and adolescents with marked obesity. N Engl J Med. 2002; 346:802-810. [DOI] [PubMed] [Google Scholar]
- Burke GL, Bertoni AG, Shea S, Tracy R, Watson KE, Blumenthal RS, Chung H, Carnethon MR. The impact of obesity on cardiovascular disease risk factors and subclinical vascular disease. Arch Intern Med. 2008; 168:928-935. [DOI] [PMC free article] [PubMed] [Google Scholar]
- Blaha MJ, Rivera JJ, Budoff MJ, Blankstein R, Agatston A, O'Leary DH, Cushman M, Lakoski S, Criqui MH, Szklo M, Blumentahl RS, Nasir K. Association between obesity, hsCRP ≥2 mg/L, and subclinical atherosclerosis: implications of JUPITER from the Multi‐Ethnic Study of Atherosclerosis (MESA). Arterioscler Thromb Vasc Biol. 2011; 31:1430-1438. [DOI] [PMC free article] [PubMed] [Google Scholar]
- Lavie CJ, Milani RV, Ventura HO. Obesity and cardiovascular disease: risk factors, paradox, and impact of weight loss. J Am Coll Cardiol. 2009; 53:1925-1932. [DOI] [PubMed] [Google Scholar]
- Masters RK, Reither EN, Powers DA, Yang YC, Burger AE, Link BG. The impact of obesity on US mortality levels: the importance of age and cohort factors in population estimates. Am J Public Health. 2013; 103:1895-1901. [DOI] [PMC free article] [PubMed] [Google Scholar]
- Ortega FB, Lee DC, Katzmarzyk PT, Ruiz JR, Sui X, Church TS, Blair SN. The intriguing metabolically healthy but obese phenotype: cardiovascular prognosis and role of fitness. Eur Heart J. 2013; 34:389-397. [DOI] [PMC free article] [PubMed] [Google Scholar]
- Hamer M, Stamatakis E. Metabolically healthy obesity and risk of all‐cause and cardiovascular disease mortality. J Clin Endocrinol Metab. 2012; 97:2482-2488. [DOI] [PMC free article] [PubMed] [Google Scholar]
- Go AS, Mozaffarian D, Roger VL, Benjamin EJ, Berry JD, Borden WB, Bravata DM, Dai S, Ford ES, Fox CS, Franco S, Fullerton HJ, Gillespie C, Hailpern SM, Heit JA, Howard VJ, Huffman MD, Kissela BM, Kittner SJ, Lackland DT, Lichtman JH, Lisabeth LD, Magid D, Marcus GM, Marelli A, Matchar DB, McGuire DK, Mohler ER, Moy CS, Mussolino ME, Nichol G, Paynter NP, Schreiner PJ, Sorlie PD, Stein J, Turan TN, Virani SS, Wong ND, Woo D, Turner MBon behalf of the American Heart Association Statistics Committee and Stoke Statistics Subcommittee. Heart disease and stroke statistics–2013 update: a report from the American Heart Association. Circulation. 2013; 127:e6-e245. [DOI] [PMC free article] [PubMed] [Google Scholar]
- Fisher‐Hoch SP, Rentfro AR, Salinas JJ, Perez A, Brown HS, Reininger BM, Restrepo BI, Wilson JG, Hossain MM, Rahbar MH, Hanis CM, McCormick JB. Socioeconomic status and prevalence of obesity and diabetes in a Mexican American community, Cameron County, Texas, 2004–2007. Prev Chronic Dis. 2010; 7:A53. [PMC free article] [PubMed] [Google Scholar]
- Craig CL, Marshall AL, Sjostrom M, Bauman AE, Booth ML, Ainsworth BE, Pratt M, Ekelund U, Yngve A, Sallis JF, Oja P. International physical activity questionnaire: 12‐country reliability and validity. Med Sci Sports Exerc. 2003; 35:1381-1395. [DOI] [PubMed] [Google Scholar]
- Matthews DR, Hosker JP, Rudenski AS, Naylor BA, Treacher DF, Turner RC. Homeostasis model assessment: insulin resistance and beta‐cell function from fasting plasma glucose and insulin concentrations in man. Diabetologia. 1985; 28:412-419. [DOI] [PubMed] [Google Scholar]
- Pearson TA, Mensah GA, Alexander W, Anderson JL, Cannon RO, Criqui M, Fadl YY, Fortmann SP, Hong Y, Myers GL, Rifai N, Smith SC, Jr, Taubert K, Tracy RP, Vinicor F. Markers of inflammation and cardiovascular disease: application to clinical and public health practice: a statement for healthcare professionals from the Centers for Disease Control and Prevention and the American Heart Association. Circulation. 2003; 107:499-511. [DOI] [PubMed] [Google Scholar]
- Chobanian AV, Bakris GL, Black HR, Cushman WC, Green LA, Izzo JL, Jones DW, Materson BJ, Oparil S, Wright JT, Roccella EJNational High Blood Pressure Education Program Coordinating Committee. Seventh report of the Joint National Committee on Prevention, Detection, Evaluation, and Treatment of High Blood Pressure. Hypertension. 2003; 42:1206-1252. [DOI] [PubMed] [Google Scholar]
- Executive summary: standards of medical care in diabetes—2010. Diabetes Care. 2010; 33Suppl 1:S4-S10. [DOI] [PMC free article] [PubMed] [Google Scholar]
- Executive Summary. Clinical guidelines on the identification, evaluation, and treatment of overweight and obesity in adults: The evidence report. NHLBI Obesity Education Initiative Expert Panel on the Identification, Evaluation, and Treatment of Obesity in Adults (US). Bethesda, MD: National Heart, Lung, and Blood Institute; September 1998. [Google Scholar]
- Wildman RP, Mutner P, Reynolds K, McGinn AP, Rajpathak S, Wylie‐Rosett JW, Sowers MR. The obese without cardiometabolic risk factor clustering and the normal weight with cardiometabolic risk factor clustering. Arch Intern Med. 2008; 168:1617-1624. [DOI] [PubMed] [Google Scholar]
- Khan UI, Wang D, Thurston RC, Sowers M, Sutton‐Tyrrell K, Matthews KA, Barinas‐Mitchell E, Wildman RP. Burden of subclinical cardiovascular disease in “metabolically benign” and “at risk” overweight and obese women: the Study of Women's Health Across the Nation (SWAN). Atherosclerosis. 2011; 217:179-186. [DOI] [PMC free article] [PubMed] [Google Scholar]
- Grundy SM, Cleeman JI, Daniels SR, Donato KA, Eckel RH, Franklin BA, Gordon DJ, Krauss RM, Savage PJ, Smith SC, Spertus JA, Costa F. Diagnosis and management of the metabolic syndrome: an American Heart Association/National Heart, Lung, and Blood Institute Scientific Statement. Circulation. 2005; 112:2735-2752. [DOI] [PubMed] [Google Scholar]
- Rhee EJ, Seo MH, Kim JD, Jeon WS, Park SE, Park CY, Oh KW, Park SW, Lee WY. Metabolic health is more closely associated with coronary artery calcification than obesity. PLoS One. 2013; 8:e74564. [DOI] [PMC free article] [PubMed] [Google Scholar]
- D'Agostino RB, Vasan RS, Pencina MJ, Wolf PA, Cobain M, Massaro JM, Kannel WB. General cardiovascular risk profile for use in primary care: the Framingham Heart Study. Circulation. 2008; 117:743-753. [DOI] [PubMed] [Google Scholar]
- Bauman A, Bull F, Chey T, Craig CL, Ainsworth BE, Sallis JF, Bowles HR, Hagstromer M, Sjostrom M, Prattt Mthe IPS Group. The international prevalence study on physical activity: results from 20 countries. Int J Behav Nutr Phys Act. 2009; 6:21. [DOI] [PMC free article] [PubMed] [Google Scholar]
- U.S. Department of Health and Human Services. 2008 Physical Activity Guidelines for Americans; 2008. Report No.: ODPHP Publication No. U0036.
- Krause RM, Eckel RH, Howard B, Appel LJ, Daniels SR, Deckelbaum RJ, Erdman JW, Kris‐Etherton P, Goldberg IJ, Kotchen TA, Lichtenstein AH, Mitch WE, Mullis R, Robinson K, Wylie‐Rosett J, St Jeor S, Suttie J, Tribble DL, Bazzarre TL. AHA dietary guidelines: revision 2000: a statement for healthcare professionals from the Nutrition Committee of the American Heart Association. Circulation. 2000; 102:2284-2299. [DOI] [PubMed] [Google Scholar]
- Bots ML, Grobbee DR. Intima media thickness as a surrogate marker for generalized atherosclerosis. Cardiovasc Drug Ther. 2002; 16:341-351. [DOI] [PubMed] [Google Scholar]
- Bots ML, Hoes AW, Koudstaal PJ, Hofman A, Grobbee DE. Common carotid intima‐media thickness and risk of stroke and myocardial infarction: the Rotterdam study. Circulation. 1997; 96:1432-1437. [DOI] [PubMed] [Google Scholar]
- Lorenz MW, Markus HS, Bots ML, Rosvall M, Sitzer M. Prediction of clinical cardiovascular events with carotid intima‐media thickness: a systematic review and meta‐analysis. Circulation. 2007; 115:459-467. [DOI] [PubMed] [Google Scholar]
- Aung K, Lorenzo C, Hinojosa MA, Haffner SM. Risk of developing diabetes and cardiovascular disease in metabolically unhealthy normal‐weight and metabolically healthy obese individuals. J Clin Endocrinol Metab. 2014; 99:462-468. [DOI] [PMC free article] [PubMed] [Google Scholar]
- Appleton SI, Seaborn CJ, Visvanathan R, Hill CL, Gill TK, Taylor AW, Adams RJon behalf of the North West Adelaide Health Study Team. Diabetes and cardiovascular disease outcomes in the metabolically healthy obese phenotype: a cohort study. Diabetes Care. 2013; 36:2388-2394. [DOI] [PMC free article] [PubMed] [Google Scholar]
- Bradshaw PT, Monda KL, Stevens J. Metabolic syndrome in healthy obese, overweight, and normal weight individuals: the Atherosclerosis Risk in Communities Study. Obesity. 2013; 21:203-209. [DOI] [PMC free article] [PubMed] [Google Scholar]
- Flegal KM, Carroll MD, Kucsmarski RJ, Johnson CL. Overweight and obesity in the United States: prevalence and trends, 1960–1994. Int J Obes Relat Metab Disord. 1998; 22:39-47. [DOI] [PubMed] [Google Scholar]
- Shimabukuro M. Cardiac adiposity and global cardiometabolic risk: new concept and clinical implication. Circ J. 2009; 73:27-34. [DOI] [PubMed] [Google Scholar]
- Kadowaki T, Yamauchi T, Kubota N, Hara K, Ueki K, Tobe K. Adiponectin and adiponectin receptors in insulin resistance, diabetes, and the metabolic syndrome. J Clin Invest. 2006; 116:1784-1792. [DOI] [PMC free article] [PubMed] [Google Scholar]
- Fox CS, Massaro JM, Hoffmann U, Pou KM, Maurovich‐Horvat P, Liu CY, Vasan RS, Murabito JM, Meigs JB, Cupples LA, D'Agostino RB, O'Donnell CJ. Abdominal visceral and subcutaneous adipose tissue compartments: association with metabolic risk factors in the Framingham Heart Study. Circulation. 2007; 116:39-48. [DOI] [PubMed] [Google Scholar]
- Keys A, Fidanza F, Karvonen MJ, Kimura N, Taylor HL. Indices of relative weight and obesity. J Chronic Dis. 1972; 25:329-343. [DOI] [PubMed] [Google Scholar]
- World Health Organization. Obesity: preventing and managing the global epidemic. 2000Geneva: WHO; 2000. 256. [PubMed] [Google Scholar]
- Deurenberg P. Universal cut‐off points for obesity are not appropriate. Br J Nutr. 2001; 85:135-136. [DOI] [PubMed] [Google Scholar]
- Kuczmarski RJ, Flegal KM. Criteria for definition of overweight in transition: background and recommendations for the United States. Am J Clin Nutr. 2000; 72:1074-1081. [DOI] [PubMed] [Google Scholar]
- Company MLI. New weight standards for men and women. Stat Bull Metropol Life Insur Co. 1959; 40:1-4. [Google Scholar]
- Durward CM, Hartman TJ, Nichols‐Richardson SM. All‐cause mortality risk of metabolically healthy obese individuals in NHANES III. J Obesity. 2012; 2012:460321. [DOI] [PMC free article] [PubMed] [Google Scholar]
- Shi J, Hong J, Qi L, Cui B, Gu W, Zhang Y, Li L, Miao L, Wang R, Wang W, Ning G. Genetic predisposition to obesity and risk of subclinical atherosclerosis. Gene. 2014; 549:223-227. [DOI] [PubMed] [Google Scholar]
- Lavie C, McAuley PA, Church TS, Milani RV, Blair SN. Obesity and cardiovascular diseases: implications regarding fitness, fatness, and severity in the obesity paradox. J Am Coll Cardiol. 2014; 63:1345-1354. [DOI] [PubMed] [Google Scholar]
- Barry VW, Baruth M, Beets MW, Durstine JL, Liu J, Blair SN. Fitness vs. fatness on all‐cause mortality: a meta‐analysis. Prog Cardiovasc Dis. 2014; 56:382-390. [DOI] [PubMed] [Google Scholar]
- Church TS, LaMonte MJ, Barlow CE, Blair SN. Cardiorespiratory fitness and body mass index as predictors of cardiovascular disease mortality among men with diabetes. Arch Intern Med. 2005; 165:2114-2220. [DOI] [PubMed] [Google Scholar]
- Zsembik BA, Fennell D. Ethnic variation in health and the determinants of health among Latinos. Soc Sci Med. 2005; 61:53-63. [DOI] [PubMed] [Google Scholar]
- Hummer RA, Rogers RG, Amir SH, Forbes D, Frisbie WP. Adult Mortality Differentials among Hispanic Subgroups and Non‐Hispanic Whites. Soc Sci Q. 2000; 81:459-476. [PubMed] [Google Scholar]
- Bernstein R. US Hispanic population surpassed 45 million: now 15 percent of total US. Census Bureau News 2008. http://www.census.gov/newsroom/releases/archives/population/cb08-67.html. Accessed March 2, 2011.