Abstract
A receptor assembly composed of iron(II) triflate and pyridine-2,6-dicarbaldehyde is used to determine the enantiomeric excess of alpha-chiral primary amines using circular dichroism spectroscopy. The alpha chiral amines condense with the dialdehyde to form a diimine, which forms a 2:1 octahedral complex with iron(II). The enantiomeric excess values of unknown concentrations of alpha-chiral amines were determined by constructing calibration curves for each amine and then measuring the ellipticity at 600nm. This improves our previously reported assay for enantiomeric excess determination of chiral primary amines by further increasing the wavelength at which CD is measured and reducing the absolute error of the assay.
Keywords: enantiomeric excess determination, circular dichroism spectroscopy, schiff base, chemosensor, UV-vis spectroscopy, iron coordination compounds
Introduction
Due to the limitations in the speed of traditional chiral chromatographic methods, the rapid determination of enantiomeric excess (ee) continues to be an important area of research.1-4 Traditional chromatography is well suited to serial research methodology where a chiral catalyst is designed, tested, and then retested until a desired enantioselectivity is reached. However, the throughput of traditional chromatography is not readily amenable to that required for parallel asymmetric synthesis where hundreds to thousands of asymmetric reactions are tested simultaneously.1 Although recent advances in chiral chromatography - such as multiplexing2 and supercritical fluid chromatography3 - have increased throughput as compared to traditional techniques, the high instrumentation costs have prevented the widespread adoption of these methods by the research community. As such, a variety of rapid techniques for ee analysis are under development, such as enzyme based methods,4 IR thermography,5 chiral capillary electrophoresis,4,6 and optical techniques.3, 7
Our group,8,9 as well as others,3,10-12 have combined self-assembling receptors with optical techniques for the rapid screening of ee. Optical instrumentation is an attractive method for ee determination because the analysis is typically fast, inexpensive, and familiar to most organic chemists – all of which lower the barrier to its widespread adoption. By coupling a reversible binding event with a change in a receptor’s optical properties using coordination chemistry, an optical signal for a chiral analyte can be created or changed, allowing for the detection of chirality in a wide range of analytes regardless of their inherent optical properties.
Circular dichroism (CD) spectroscopy is particularly attractive for ee determination because it is capable of discriminating between enantiomers without the use of expensive chiral reagents.13 CD spectroscopy with can be used in the analysis of a wide variety of chiral analytes such as carboxylic acids,12,14 aldehydes,15 ketones,16 alcohols,17 aminoalcohols,3 and amines,18- 22 through assembly of optically responsive receptors.
We recently demonstrated that an Fe(II)-based assembly could be used in combination with CD spectroscopy to determine the ee of primary alpha-chiral amines (Figure 1).20 The amine analyte is first converted to bidentate imine 2, using 3-hydroxypicolinaldehyde (7). The resulting imine is then added to a solution of Fe(II) in order to form complex 3, which gives rise to a first Cotton effect at ~575 nm and a second Cotton effect at ~520 nm, the signs of which depend on the chirality of the amine. Complex 3 exists as a mixture of helical diastereomers, and the ratio of diastereomers varies with ee, giving a unique CD spectrum for each ee value. Calibration curves can be developed by plotting the CD signals from the second Cotton effect as a function of ee and, in our hands, could be used to determine the ee of unknown samples with an absolute error of 5%.
FIGURE 1.
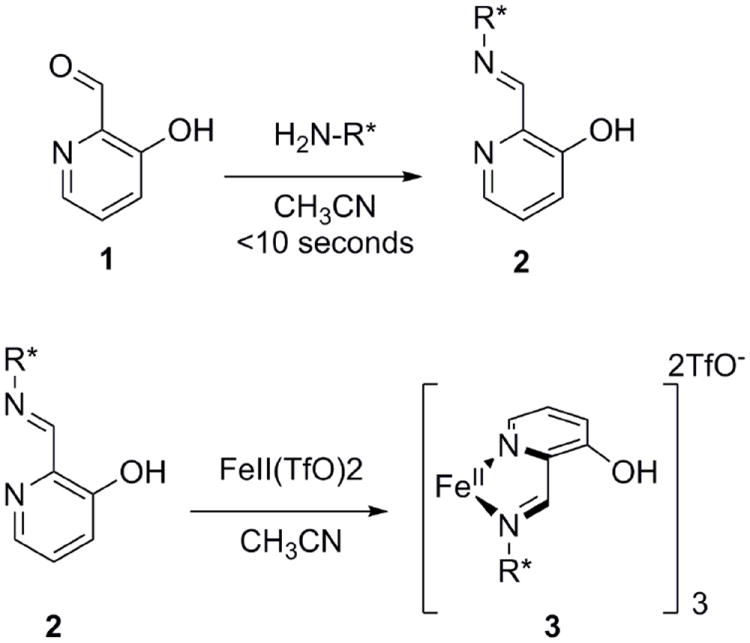
Previously reported octahedral iron(II) chemosensor for primary α-chiral amines.
Materials and Methods
All chemicals were purchased from Sigma-Aldrich. Enantiomers of the chiral amines were purchased with ≥98% purity.
Complexes of Fe(OTf)2, pyridine-2,6-dicarbaldehyde (4), and chiral amines were prepared in acetonitrile at a variety of concentrations, using 1:2 Fe(OTf)2:4 and at least two equivalents of chiral amine to aldehyde 4. Solutions were stirred for 2 hours and then diluted to a final concentration of 2 mM Fe(OTf)2. Separate solutions were prepared at varying enantiomeric excess values and then circular dichroism and absorbance values were measured from 800 nm to 200 nm in a 1 mm quartz cuvette on a JASCO CD spectrophotometer to generate calibration curves. Calibration curves for each amine were generated at least twice and averaged. The CD values at the first Cotton effect, either 625 nm or 635 nm depending on the amine tested, were normalized to zero millidegrees for the racemic mixtures of amines. Enantiomeric excess (ee) values used to generate each calibration curve were calculated using the following formula:
The measured CD signal in millidegrees was plotted against the calculated enantiomeric excess values. The data were fit to a linear equation with the y-intercept set to zero. This equation was used to determine unknown ee values based off of the CD signals of the tested amines.
Unknown samples for each of the varying amines were prepared at the same total amine concentration but with variable ee values. The concentrations used were such that at least two equivalents of chiral amine to aldehyde 4 were present. The measured CD values were entered into the equation determined from the calibration curve for each amine in order to determine the ee value of the unknown. Absolute errors were determined by taking the absolute value of the difference between actual and experimental ee’s. The average error was calculated for each amine by averaging the absolute errors for each unknown.
For analysis of PEA, stock solutions of iron-imine complexes (5) were created by mixing 50 mM Fe(OTf)2, 100 mM (4), and 200 mM total PEA in acetonitrile at 0, 20, 40, 60, 80, and 100 percent (R)-PEA. The mixtures assembled over a period of two hours and were then diluted to a final concentration of 2 mM Fe(II) and 8 mM total amine to generate a calibration curve. Six complexes of 5 with (R)- or (S)-PEA at 8 mM total amine concentration were prepared using stocks of 600 mM (R)- or (S)-PEA in acetonitrile. The solutions were made to the same total volume, and the volume of stock (R)- or (S)-PEA added varied. The unknowns were as follows: 0.96 mM (R), 7.04 mM (S); 2.64 mM (R), 5.36 mM (S); 4.08 mM (R), 3.92 mM (S); 5.60 mM (R), 2.40 mM S; 7.20 mM (R), 0.08 mM (S); 2.00 mM (R), 6.00 mM (S).
Results and Discussion
Design Criteria
Based on the success of our previous assembly, we began exploring the use of a dialdehyde, pyridine-2,6-carboxaldehyde (4), with Fe(II) for the detection of chirality of primary amines via assembly 5 (Figure 2). One goal was to increase the λmax of the CD response in order to make the analysis less susceptible to interference from CD signals arising from chiral catalysts or side products. Lehn et al.23 showed that the use of the more reactive dialdehyde, pyridine-2,6-dicarboxyaldehyde, compared to the monoaldehyde, pyridine-2-carboxaldehyde, with Fe(II) allowed for increased nucleophilic addition to the carbonyl group by alcohols to form the corresponding hemiacetals. Fe(II) promoted hemiacetal formation and stabilization via metal-ion coordination resulted in equilibria being established within a few minutes.
FIGURE 2.
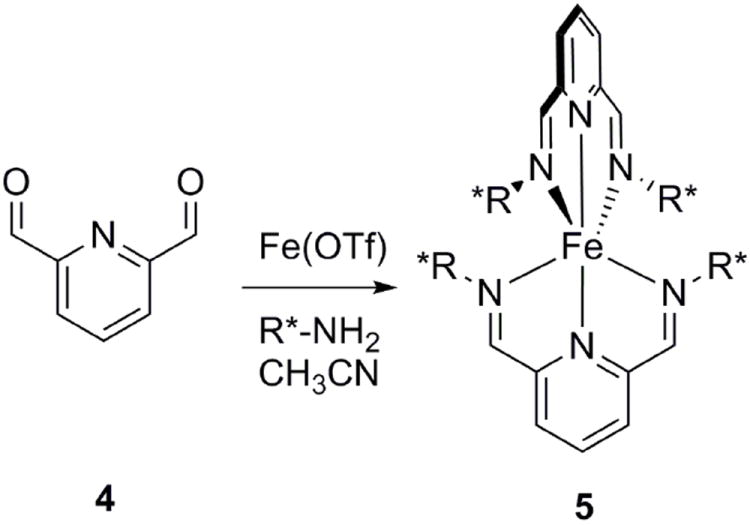
Assembly of the chemosensor 5 using dialdehyde 4, iron(II) triflate, and a chiral amine.
Nitschke et al.24,25 have prepared dynamic, self-assembling imine structures using Fe(II) templated condensation of pyridine-2-carboxaldehyde and varying amines. We hypothesized that the dialdehyde would also be reactive to diimine formation in the presence of Fe(II) and would create an optical signal at longer λmax due to increased conjugation compared to 1. While a dialdehyde receptor has been previously used for the determination of chirality in primary amines and diamines,26 isolation of the receptor requires four synthetic steps. A major goal of our group is to create receptors from commercially available materials. In the presence of a chiral amine, the reagents self-assemble into a colored complex, which avoids synthetic efforts. Complex 5 exhibits a first Cotton effect at ~625 nm, a second Cotton effect at ~550 nm, and a third Cotton effect at ~475 nm.
The amines 2-aminoheptane (AH), 1-phenylethylamine (PEA), sec-butylamine (sBA), 1-(4-methylphenyl)ethylamine (MPEA) and 2-amino-3-methylbutane (AMB) were chosen for study because they span the aliphatic, branched aliphatic, and aromatic region of chemical space, which gives insight into the analyte scope of the system, and because they are commercially available in high purity (Figure 3).
FIGURE 3.
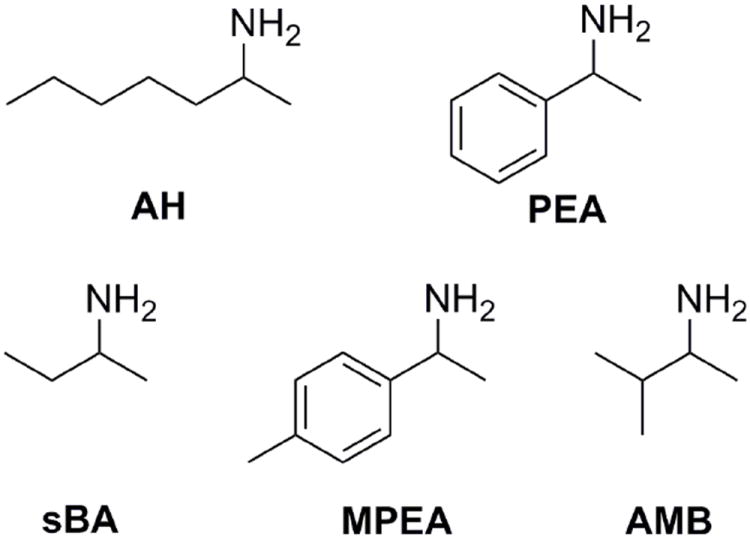
The seven chiral amines chosen for enantiomeric excess analysis.
Receptor Assembly
UV-Vis Studies
The concentration dependence of the reaction was studied using UV-vis (Figure 4). A 2:1 ratio of dialdehyde 4 to amine was increased in concentration while Fe(II) was held constant at 2 mM. Measurements were taken at 600 nm, where only diimine complex 5 absorbs and not the other components of the reaction mixture. The reactions were allowed to run overnight, and UV-vis measurements showed that after 2 hours the various absorption signals remained stable, suggesting that the reaction mixtures had reached equilibrium. The maximum absorbance signal occurs between 2 and 3 equivalents of dialdehyde 4 to Fe(II) for all of the amines studied. Before 2-3 equivalents of 4, there is free Fe(II) in solution, and more of complex 5 forms as the aldehyde and amine concentrations increase; thus, the signal continues to increase. After 2-3 equivalents the signal decreases, which must be the result of the formation of a new complex, potentially a 3:1 complex of diimine to Fe(II). Further studies were not done to confirm the reason for the signal decrease because it did not affect the utility of the assay for determining ee – the primary goal of this project.
FIGURE 4.
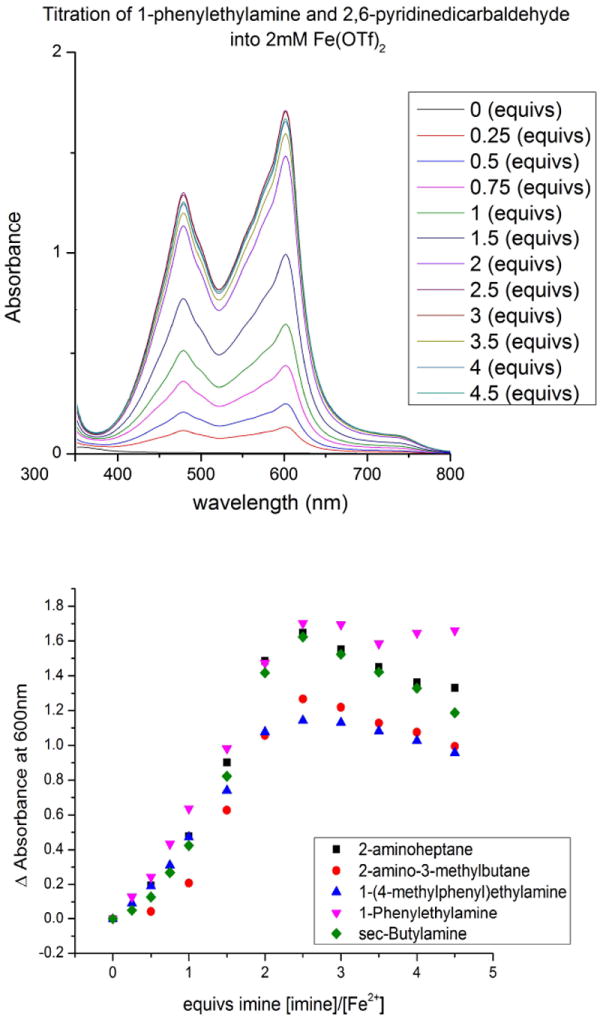
Top: UV-vis titration of the imine formed from 2 equivs. of PEA and dialdehyde 4 into 2 mM Fe(OTf)2. Bottom: UV-vis titration of the imines, formed from 2 equivs of each chiral amine to 4, into 2 mM Fe(OTf)2.
Crystal Structure
A crystal structure of the assembly formed from PEA was obtained by vapor diffusion of diethyl ether into acetonitrile (Figure 5). The complex is an octahedral, 2:1 complex of diimine to Fe(II), which supports the UV-vis data.
FIGURE 5.
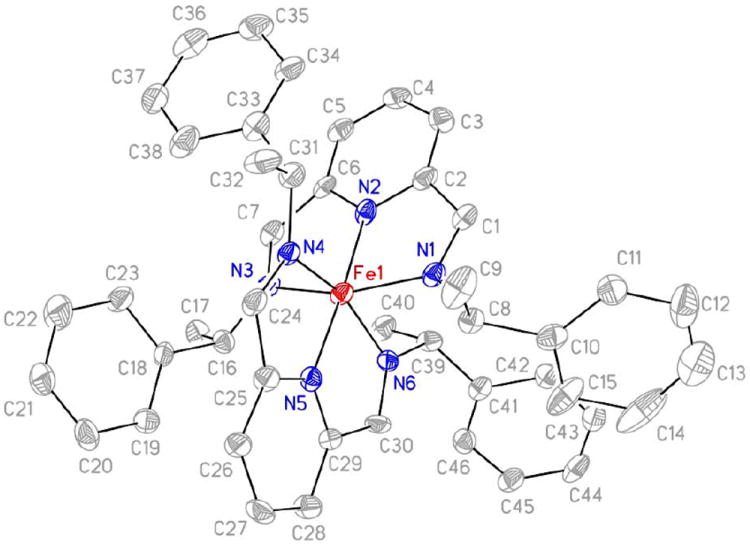
A crystal structure of the (R)-PEA derivative of complex 5 showing the atom-labeling scheme. Displacement ellipsoids are scaled to the 30% probability level. Most hydrogen atoms were removed for clarity.
Stereoisomers
Based on the UV-vis and crystal structure data, the assembly primarily exists as a 2:1 complex; thus, only the 2:1 complex is considered in the following analysis. Assemblies formed from enantiomerically pure amines can only exist as a single stereoisomer (R,R,R,R) or (S,S,S,S). Assemblies formed from enantiomerically impure amines can form seven stereoisomers – three sets of enantiomers and one meso compound that exhibits S4 symmetry (Figure 6). While the complex mixture of stereoisomers might complicate the use of the assay in the determination of ee, as long as the complexes can be formed reproducibly, it is possible to develop calibration curves and determine ee.
FIGURE 6.
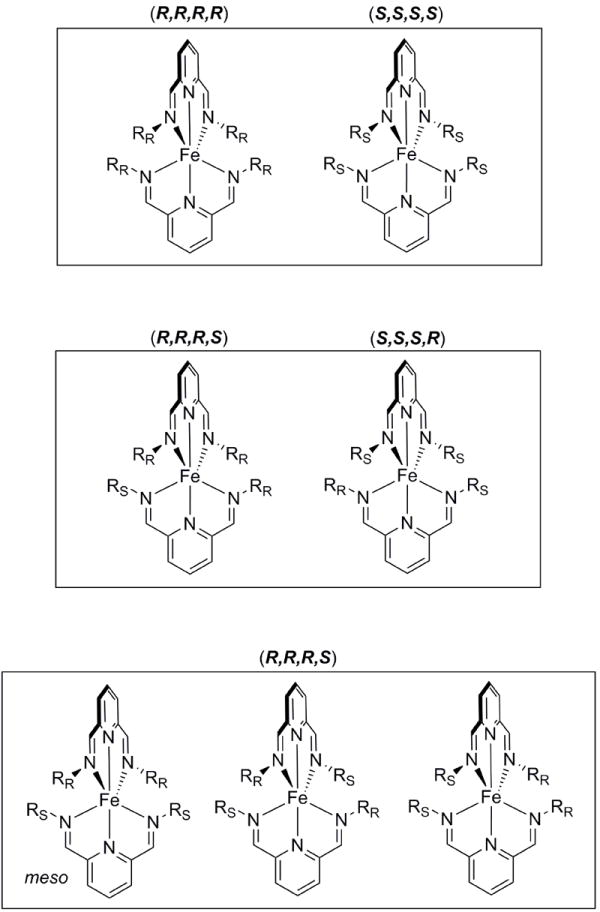
The possible stereoisomers that can exist for enantiomerically impure solutions of Fe(II) complex 5.
Calibration Curves and Unknown Determination
Calibration curves were made for each analyte by plotting the ee as a function of the ellipticity at the λmax of the first Cotton effect for each complex, either 625 nm or 635 nm, which is bathochromically shifted ~100 nm from our previously reported system (Figure 7). A linear model was used to fit the data in Origin®. The ee of solutions of variable R- and S- composition for each amine was determined by taking CD spectra and solving the appropriate linear equation. Absolute errors were determined by taking the experimentally determined value for ee, subtracting the actual value of the sample, and taking its absolute value (Table I).
FIGURE 7.
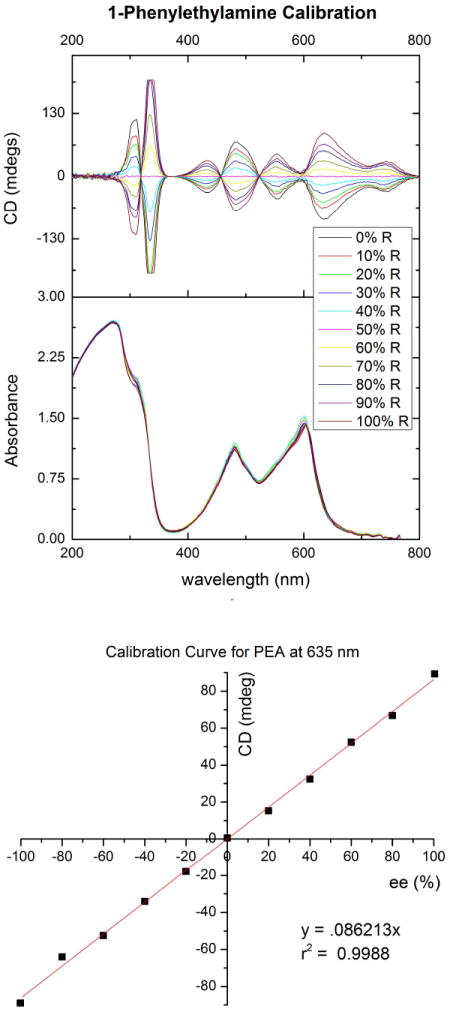
Top: CD and absorbance spectra and Bottom: calibration curve generated for complex 5 derived from 50 mM total PEA and 25 mM imine.
TABLE I.
Enantiomeric excess values calculated from CD signals at 635 nm for PEA.
| CD (mdeg) | experimental ee | actual ee | absolute error (%) |
|---|---|---|---|
| -61.7469 | -72 | -76 | 4 |
| -28.901 | -34 | -34 | 0 |
| 13.9575 | 16 | 18 | 2 |
| 32.4065 | 38 | 40 | 2 |
| 68.4553 | 80 | 80 | 0 |
Unknowns for all six amines at a variety of ee values were prepared and the CD spectra were collected. The results are summarized in Table II. On average, the assay could be used to determine ee with an absolute error of 4.1%. However, for some analytes, such as AMB, the absolute error was as high as 8.0%, while for others such as PEA the absolute error was 1.3%. Thus, while the average absolute error is 4.1%, it can be higher or lower depending on the analyte.
TABLE II.
The average errors for all samples of each of the tested chiral amines
| chiral amine | average error (%) |
|---|---|
| AH | 2.5 |
| PEA | 1.3 |
| sBA | 3.6 |
| MPEA | 5.2 |
| AMB | 8.0 |
Conclusion
An Fe(II) assembly can be used with CD spectroscopy for the determination of ee of alpha-chiral primary amines. Dialdehyde 4, in the presence of 0.5 equivalents of Fe(II) and a chiral amine, self-assembles into complex 5. The complex is 2:1 diimine to Fe(II) as determined by UV-vis and x-ray crystallography. This system uses a longer wavelength for ee determination than our previously reported system, and improves upon the absolute error by 1%.
Supplementary Material
Acknowledgments
This research was made possible by support from the National Institutes of Health (R01 GM077437) and the Welch Foundation (F-1151).
Footnotes
Supporting information
Additional supporting information may be found in the online version of this article at the publisher’s website.
REFERENCES AND NOTES
- 1.Traverse JF, Snapper ML. Drug Discovery Today. 2002;7:1002–1012. doi: 10.1016/s1359-6446(02)02436-4. [DOI] [PubMed] [Google Scholar]
- 2.de Biasi V, Haskins N, Organ A, Bateman R, Giles K, Jarvis S. Rapid Comm Mass Spectrom. 1999;13:1165–1168. doi: 10.1002/(SICI)1097-0231(19990630)13:12<1165::AID-RCM638>3.0.CO;2-4. [DOI] [PubMed] [Google Scholar]
- 3.Maftouh M, Granier-Loyaux C, Chavana E, Marini J, Pradines A, Heyden YV, Picard C. J Chromatogr A. 2005;1088:67–81. doi: 10.1016/j.chroma.2004.12.038. [DOI] [PubMed] [Google Scholar]
- 4.Hamberg A, Lundgren S, Penhoat M, Moberg C, Hult K. J Am Chem Soc. 2006;128:2234–2235. doi: 10.1021/ja058474r. [DOI] [PubMed] [Google Scholar]
- 5.Millot N, Borman P, Anson MS, Campbell IB, Macdonald SJF, Mahmoudian M. Org Process Res Dev. 2002;6:463–470. [Google Scholar]
- 6.Fanali S. J Chromatogr A. 2000;875:89–122. doi: 10.1016/s0021-9673(99)01309-6. [DOI] [PubMed] [Google Scholar]
- 7.Leung D, Kang SO, Anslyn EV. Chem Soc Rev. 2012;41:448–479. doi: 10.1039/c1cs15135e. [DOI] [PubMed] [Google Scholar]
- 8.Leung D, Anslyn EV. J Am Chem Soc. 2008;130:12328–12333. doi: 10.1021/ja8038079. [DOI] [PMC free article] [PubMed] [Google Scholar]
- 9.Shabbir SH, Regan CJ, Anslyn EV. Proc Natl Acad Sci. 2009;106:10487. doi: 10.1073/pnas.0809530106. [DOI] [PMC free article] [PubMed] [Google Scholar]
- 10.Wolf C, Bentley KW. Chem Soc Rev. 2013;42:5408–5424. doi: 10.1039/c3cs35498a. [DOI] [PubMed] [Google Scholar]
- 11.Corradini R, Paganuzzi C, Marchelli R, Pagliari S, Sforza S, Dossena A, Galavernaa G, Duchateaub A. J Mater Chem. 2005;15:2741–2746. doi: 10.1002/chir.10272. [DOI] [PubMed] [Google Scholar]
- 12.Di Bari L, Mannucci S, Pescitelli G, Salvadori P. Chirality. 2002;14:611–617. doi: 10.1002/chir.10086. [DOI] [PubMed] [Google Scholar]
- 13.Berova N, Di Bari L, Pescitelli G. Chem Soc Rev. 2007;36:914–931. doi: 10.1039/b515476f. [DOI] [PubMed] [Google Scholar]
- 14.Joyce LA, Maynor MS, Dragna JM, da Cruz GM, Lynch VM, Canary JW, Anslyn EV. J Am Chem Soc. 2011;133:13746–13752. doi: 10.1021/ja205775g. [DOI] [PMC free article] [PubMed] [Google Scholar]
- 15.Barman S, Anslyn EV. Tetrahedron. 2014;70:1357–1362. [Google Scholar]
- 16.Leung D, Anslyn EV. Org Lett. 2011;13:2298–2301. doi: 10.1021/ol2004885. [DOI] [PMC free article] [PubMed] [Google Scholar]
- 17.You L, Pescitelli G, Anslyn EV, Di Bari L. J Am Chem Soc. 2012;134:7117–7125. doi: 10.1021/ja301252h. [DOI] [PubMed] [Google Scholar]
- 18.Bentley KW, Nam YG, Murphy JM, Wolf C. J Am Chem Soc. 2013;135:18052–18055. doi: 10.1021/ja410428b. [DOI] [PubMed] [Google Scholar]
- 19.Metola P, Anslyn EV, James TD, Bull SD. Chem Sci. 2012;3:156–161. [Google Scholar]
- 20.Dragna JM, Pescitelli G, Tran L, Lynch VM, Anslyn EV, Di Bari L. J Am Chem Soc. 2012;134:4398–4407. doi: 10.1021/ja211768v. [DOI] [PMC free article] [PubMed] [Google Scholar]
- 21.Ghosn MW, Wolf C. Tetrahedron. 2011;67:6799–6803. [Google Scholar]
- 22.Nieto S, Dragna JM, Anslyn EV. Chem Eur J. 2010;16:227–232. doi: 10.1002/chem.200902650. [DOI] [PMC free article] [PubMed] [Google Scholar]
- 23.Drahoňovský D, Lehn JM. J Org Chem. 2009;74:8428–8432. doi: 10.1021/jo9009886. [DOI] [PubMed] [Google Scholar]
- 24.Schultz D, Nitschke JR. Chem Eur J. 2007;13:3660–3665. doi: 10.1002/chem.200601693. [DOI] [PubMed] [Google Scholar]
- 25.Mal P, Nitschke JR. Chem Commun. 2010;46:2417–2419. doi: 10.1039/b920745g. [DOI] [PubMed] [Google Scholar]
- 26.Iwaniuk DP, Wolf C. J Am Chem Soc. 2011;133:2414–2417. doi: 10.1021/ja111583e. [DOI] [PubMed] [Google Scholar]
Associated Data
This section collects any data citations, data availability statements, or supplementary materials included in this article.


