

Abstract
Conventional empirical methods for the quantification of the helical content of proteins in solution using circular dichroism (CD) primarily rely on spectral data acquired between wavelengths of 190 to 230 nm. The presence of chemical species in a protein solution with strong absorbance within this range can interfere with the ability to use these methods for the determination of the protein’s helical structure. The objective of this research was to overcome this problem by developing a method for CD spectral analysis that relies on spectral features above this wavelength range. In this study, we determined that the slopes of CD spectra acquired over the 230 to 240 nm region strongly correlate with the helix contents including α-helix and 310-helix of protein as determined using conventional CD algorithms that rely on wavelengths between 190-230 nm. This approach (i.e., the 230-240 nm slope method) is proposed as an effective method to determine the helix content within proteins in the presence of additives such as detergents or denaturants with high absorbance of wavelengths up to 230 nm.
Keywords: Circular Dichroism Spectroscopy, Empirical Algorithm, Protein Helical Structure, Denaturant
1. INTRODUCTION
Circular dichroism (CD) has been extensively used to spectroscopically study the structure of biomolecules in solution and when absorbed to surfaces due to its characteristics of being non-destructive, relatively easy to perform, requiring small sample volume, and providing fast, reliable data analyses.[1, 2] In particular, CD provides a very convenient experimental method for the determination of the secondary structure and environmentally induced structural changes in proteins since the different forms of the primary secondary structural elements found in proteins (e.g., α-helix, β-sheet, and random loop) exhibit distinctly different CD spectrum.[3]
Most algorithms that have been developed for secondary structure determination of proteins by CD depend on the analysis of spectral features in the far UV range, primarily from 190 to 230 nm. Over this spectral range, the amides within the secondary structural components constituting a protein strongly absorb circularly polarized light and undergo varying extents of n→π* and π→π* transitions for a given wavelength.[4] The CD spectrum (Figure 1) for a pure α-helical structure acquired between 190 to 250 nm exhibits a characteristic double minimum at 208 nm (π →π*) and 222 nm (n→π*), and a stronger maximum at 191-193 nm (π→π*).[4] Similarly, β-sheet structure exhibits a characteristic minimum at 215 nm (n→π*) and a maximum at 198 nm (π→π*).[4] In contrast to these spectral features, random coil segments of protein tend to exhibit a maximum and a minimum that is essentially opposite from the minimum and maximum of the α-helical and β-sheet structures.[5]
Figure 1.
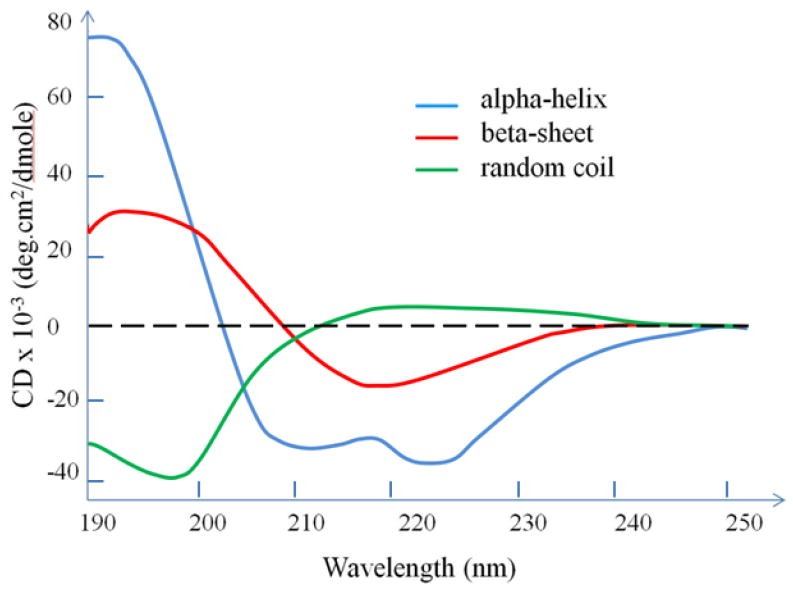
Standard CD spectra redrawn from Corrêa et al.[5] Each of the three basic secondary structures of a polypeptide chain (α-helix, β-sheet and random coil) show a distinctly different characteristic CD spectrum.[5]
To quantify the relative proportion of each associated secondary structure contained in a protein sample, the resulting CD spectrum acquired between wavelengths of 190 to 240 nm is typically empirically interpreted as a sum of fractional multiples of reference spectra for each type of secondary structure.[3] This process is conducted using a variety of mathematical tools[6] along with reference datasets of highly resolved protein structures (i.e., protein structures from X-ray crystallography and NMR spectroscopy).[7] As a result, these conventional algorithms cannot be used if the protein solution to be analyzed contains chemical species that strongly absorb at wavelengths below 230 nm, as commonly seen with various detergents and denaturants.[8-11] For example, Figure 2 presents plots of the background absorbance for solutions containing various chemical additives using a 0.1 cm cuvette, which show saturating levels of absorbance (see for wavelengths below 225 nm. When this situation occurs, other methods are required for protein structural analysis.[1, 10, 12] This type of absorbance problem becomes increasingly problematic as the pathlength of the cuvette is increased, with pathlengths up to 1.0 cm being commonly used for temperature and titration experiments [13-23] and for the analysis of adsorbed proteins on nano-particles or flat material surfaces in order to provide sufficient signal strength for analysis. [24-32]
Figure 2.
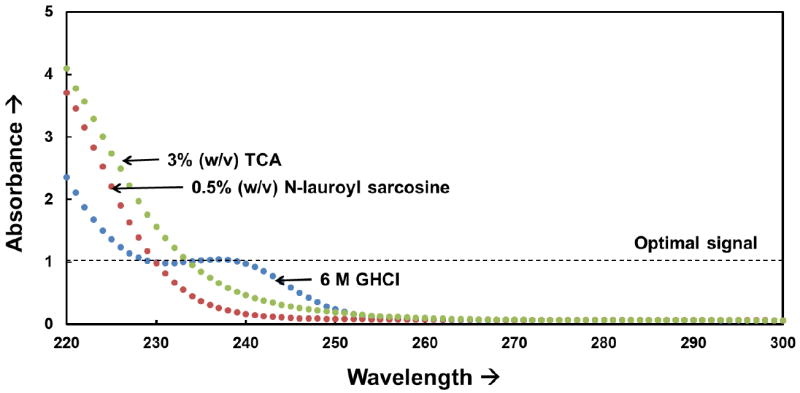
Effective absorbance spectra for different chemical additives (3% (w/v) trichloroacetic acid (TCA, Sigma: T6399), 0.5% (w/v) N-lauroyl sarcosine solutions (Sigma: T7414), and 6 M Guanidium hydrochloride (GHCl, Sigma: G3272)) in deionized water in a 0.1 cm pathlength cuvette. Strong absorbance (> 1) results in signal saturation at high wavelengths, which can prohibit the use of conventional structural analysis algorithms that require CD signal sensitivity over the range of 190 to 230 nm.[1, 12, 33]
Subsequently, conventional algorithms that rely on CD spectra over the range of 190-230 nm can only be used when the additives are present under extremely dilute conditions, thus greatly limiting the ability to investigate the influence of such additives on a protein’s secondary structure.
To overcome this problem, a CD cell with shorter path-length is commonly used to minimize the background absorbance (See S.1. in the supporting information).[34] Alternatively, if CD data from wavelengths above 220 nm are available, the helical content of protein can at least still be estimated by choosing a single wavelength above 220 nm where the difference in signal between a folded and unfolded protein is large (unfortunately there are no analogous methods for estimating β-sheet or random coil structure).[35] For example, CD molar ellipticity data at 222 nm are commonly used for quantifying the helical content of protein (i.e., 222 nm method), where helical structure exhibits a characteristic minimum in ellipticity (see Figure 1).[5] Even higher wavelengths than 222 nm, such as 225 nm[10] or 228 nm,[35] have also been used for estimating helical content when the background absorbance has influenced the CD response at 222 nm. The situation, however, becomes particularly problematic when samples exhibit strong background absorbance all of the way up to 230 nm even when using CD cells of short path length (See S.1. in the supporting information). In this case, there are presently no existing methods that can be used for the quantitative analysis of even the helical structure of a protein when in solution.
While seeking for alternative methods for the analysis of CD spectra for the determination of protein helical structure in the presence of strongly absorbing additives,[24, 36] we observed that a linear region of varying slope typically occurs in CD spectrum between 230 nm to 240 nm. Based on this observation, we hypothesized that if the relative change in the molar ellipticity values between 230 nm to 240 nm were primarily caused by the helical structure of the protein, then the relative change in the slope, which can be simply derived from multiple CD points over this wavelengths range, may provide a sensitive method of estimating the helical content of protein in solution when the background absorbance occurs for wavelengths all of the way up to 230 nm.
The purpose of current study was therefore to investigate if a linear correlation exists between the slope of CD spectra over the range of 230-240 nm and protein fractional helicity determined by existing methods for a range of proteins and their conformational states in aqueous solution. The specific objective of this research was then to use this correlation (if found) to provide a method (i.e., the 230-240 nm slope method) that could be used to reliably quantify the helical content in proteins in solution with backgrounds exhibiting strong absorbance up to 230 nm.
2. ANALYTICAL MODEL
The 222 nm wavelength method for CD analysis of the helicity of protein structure uses the molar ellipticity CD data at 222 nm,[7] which is the wavelength corresponding to the characteristic minimum of the CD spectrum of the helical structure of protein (see Figure 1). Accordingly, the fractional helicity (FH) of a protein in solution can be estimated from the CD response at 222 nm, and similarly at other nearby wavelengths such as 225 and 228 nm,[10, 35] by equation (1): [5, 37]
| (1) |
where θλexp is the experimentally observed mean residue ellipticity (usually given in deg.cm2.dmol-1) for a given wavelength (λ), and θλu and θλh correspond to the ellipticity for a protein with 0% and 100% helical content at wavelength λ, which are typically experimentally or theoretically estimated to be −3,000 and −39,500 deg.cm2.dmole-1, respectively, for a λ of 222 nm.[5, 38, 39]
Equation (1) can be rearranged to generally express θλexp as a function of FH as designated by equation (2):
| (2) |
Accordingly, by extending this relationship over a linear region of a CD spectrum in the region of 230-240 nm,[24, 36] equation (2) can be expressed in terms of the change in ellipticity between two selected wavelengths, λ1 and λ2, as indicated by equation (3):
| (3) |
where ‘A’ represents the slope of the CD spectrum within this region of wavelengths and Δθh and Δθu represent the difference in molar ellipticity for 100% and 0% helical structure, respectively, at the two designated bracketing wavelengths, λ1 and λ2. Equation (3) can subsequently be rearranged to express FH as a linear function of the slope, A, as presented in equation (4):
| (4) |
where and should be constant for a designated pair of wavelengths in the linear portion of the CD spectrum, with ‘m’ and ‘b’ thus representing the slope and y-axis intercept for the linear relationship between FH and A.
In this study, we investigate the correlation between values of FH provided by equation (4) and the values of FH obtained using both a conventional algorithm method and the 222 nm method, as provided by equation (1), for the estimation of the helicity of proteins in solution. If a strong correlation is shown, equation (4) then provides a method that should be useful for the estimation of the helical structure of proteins in solution with strong background of wavelengths up to 230 nm, which represents a condition that presently prohibits the use of conventional methods for the determination of the helicity of proteins either in solution or when adsorbed to a surface.
3. MATERIAL & METHODS
3.1. Protein Solutions
The proteins used in the study were ribonuclease-A from bovine pancreas (RNase A, 13.7 kDa, 124 residues, Sigma, R5503), hen egg-white lysozyme (HEWL, 14 kDa, 129 residues, Sigma, L6876), human serum albumin (Albumin, 66 kDa, 585 residues, Sigma, A3782), and human serum fibrinogen (Fibrinogen, 340 kDa, 269 residues, Sigma, F3879). Stock solutions (1.00 mg/ml) of each protein were first prepared in deionized water (D.I. water, 18.2 MΩ-cm, EMD Millipore, Milli Q Direct) and filtered to remove impurities. The final concentrations of protein in D.I. water or solutions with urea (Fisher Scientific, U15500) at different concentrations were verified via absorbance of protein solutions at 280 nm (A280).[5, 10]
3.2. Acquisition of Spectrum Using CD Spectroscopy
The structure of each protein in solution (0.01 mg/ml) was determined in a quartz cuvette (Starna Cells) of 1.0 cm path length using a standardized methodology for CD spectropolarimeter (Jasco J-810) over a range of temperatures to induce various degrees of protein unfolding.[25] Briefly, each CD spectrum, consisting of the ellipticity and absorbance values, was obtained over a wavelength range from 190 to 300 nm, at a scan rate of 50 nm/min and a response time of 0.25 sec. Each spectrum represented an accumulation of 6 scans. Temperature control within the CD instrument was done using the Peltier temperature control device that is integrated within our instrument. Thermal-induced denaturation of the proteins was done using an external water bath (Neslab, RTE-111) over a temperature range from 5 to 85 °C. In addition to the plain protein solutions, solutions of proteins with urea at different concentrations in a quartz cuvette (Starna Cells) of 0.01 cm path length were analyzed to provide samples exhibiting strong background absorbance over the range of 190-220 nm that could not be analyzed by conventional full-spectrum-based methods.
3.3. Algorithms to Quantify Protein Secondary Structure in Solution
The helical content of proteins in solution (including contributions from α-, 3(10)-, and π-helicies) was determined using three different algorithms—the CONTIN program method,[2] the 222 nm method, and the proposed 230-240 nm slope method. Irrespective of the algorithm, the background-corrected CD signals were converted to molar ellipticity, θλexp, given in deg.cm2/(dmol)), using equation (5):
| (5) |
where θλraw is the background corrected raw CD signal (degrees), L is the path length of the cuvette (mm), Csoln is the solution concentration of the protein (mg/mL), M is the mean residue molecular weight of 115 g/mol.
3.3.a. 222 nm Method
The FH values of the proteins in solution were estimated from the mean residue ellipticity values at 222 nm according to equation (1).
3.3.b CONTIN Program Method
The CONTIN program method, introduced by Provencher and Glöckner, determines the FH of a sample from the direct analysis of a CD spectrum over the full far-UV range from 190 to 240 nm as a linear combination of the CD spectrum from a library of 16 proteins whose structures have been determined to high resolution by X-ray crystallography.[2] In this method, the contribution of each reference spectrum is kept small unless it contributes to good agreement between the theoretical best-fit curve and the raw spectrum.[7]
3.3.c. 230-240 nm Slope Method
The slope (‘A’) over the wavelength range of 230 to 240 nm was first measured directly from the CD spectrum. As further addressed below, the slope (‘m’) and y-intercept (‘b’) characterizing the linear relationship between ‘A’ and FH (see equation (4) above) were then determined from a plot of ‘A’ vs. the FH values provided by the CONTIN program method. This linear relationship was then subsequently applied for the determination of the FH for solutions exhibiting high background absorbance up to 220 nm such that the CONTIN program method could not be used. A detailed protocol on FH determination using this method is provided in section S.1 of the supplementary material.
3.4. Correlations Between Methods for Determination of Helical Structure of Protein in Solution
The helical structure of each protein under each solution condition was first determined using both the CONTIN and 222 nm methods, and the slope ‘A’ was calculated for each CD spectrum over the wavelength range from 230-240 nm. The slope ‘A’ from each CD spectrum was then plotted against the FH values estimated by the CONTIN program to assess the level of correlation between these two parameters, with values of ‘m’ and ‘b’ from equation (4) determined from the resulting linear relationship. Similarly, FH values obtained from the CONTIN program and 222 nm methods were then compared in order to confirm the correlation between these two conventional methods for our set of protein solutions.
The FH values obtained from the 230-240 nm slope method were then plotted against FH values estimated by the 222 nm method for proteins in solution containing 4 M and 8 M urea, which prohibited the direct use of the CONTIN method due to the strong background absorbance caused by these additives over the wavelength range of 190-220 nm. These comparisons were then used to assess the validity of using the proposed new 230-240 nm slope method for the estimation of the percentage of helical secondary structure of proteins including α-helix and 310-helix in solution in the presence of additives exhibiting strong background absorbance for wavelengths below 230 nm.
3.4. Statistical Analysis
The results from this study are presented as mean values ± 95% confidence intervals (C.I.) for each data point presented. The statistical significance of differences between calculated parameters was evaluated using Student’s t test, with values of p < 0.05 being considered as statistically significant.
4. RESULTS and DISCUSSION
4.1. Determination of the Designated Values of ‘m’ and ‘b’ in Equation (4)
As shown in Figure 3 for a set of four very structurally different proteins, a linear relationship is found between molar ellipticity and wavelength over the wavelength region from 230 to 240 nm. Furthermore, as indicated by equation (4), the slope of this linear portion of CD spectrum should be linearly related to the FH if the molar ellipticity responses over this range are primarily determined by the helical content of the protein (i.e., FH = mA + b).
Figure 3.
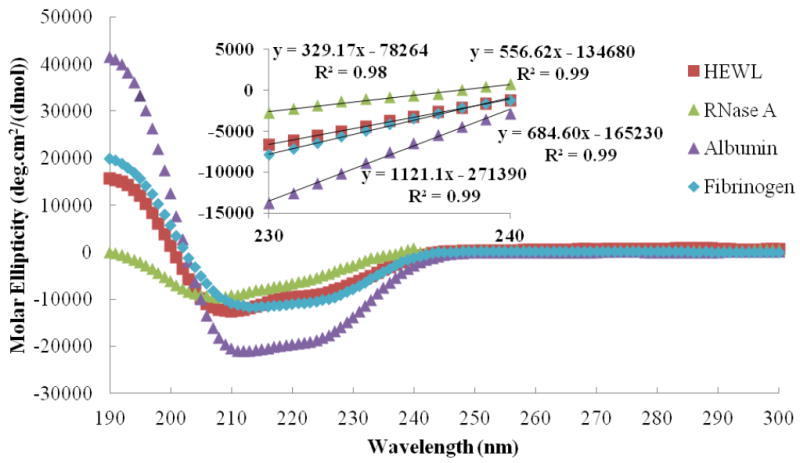
CD spectra showing a linear relationship over the wavelength range from 230 to 240 nm for four different types of protein. Inset: Enlargement of the molar ellipticities over the wavelength range of 230-240 nm from each overall CD spectrum with the linear regression equation provided for each plot. The slope of linear region between 230-240 nm is empirically determined to represent the parameter ‘A’ according to equation (3). For example ‘A’ = 329.17 (molar ellipticity/nm) for RNase A.
Since the CONTIN program is considered to be one of the ‘gold standards’ for protein structural determination by CD, if a linear relationship can be shown between ‘A’ and FH determined from the CONTIN program, then values of ‘m’ and ‘b’ can be determined from that plot to provide the ability to predict FH directly from ‘A’ for a given CD spectrum of protein in solution.
Figure 4 presents the solution structure data for FH values ranging from 0.03 to 0.58 estimated from the CONTIN program method vs. the empirical parameter ‘A’ for four different protein solutions. The wide range of helical content was achieved for these proteins by thermal denaturation in solution for temperatures ranging from 5°C to 85°C.[40] As shown, a strong linear correlation with R2 = 0.96 is obtained between these two parameters (i.e., FH and ‘A’), with the y-intercept (i.e., ‘b’) of the linear correlation line not being significantly different from zero (p = 0.65). The strong linear relationship between FH and ‘A’ supports our hypothesis that the 230-240 nm slope method can be used to provide a reliable approach for the determination of FH. Based on the linear relationship shown in Figure 4, the designated values of ‘m’ and ‘b’ representing the slope and y-axis intercept for the linear relationship between FH and A are 5.14×10⁻³ FH/(molar ellipticity/nm) and 2.97×10⁻³ FH, respectively.
Figure 4.
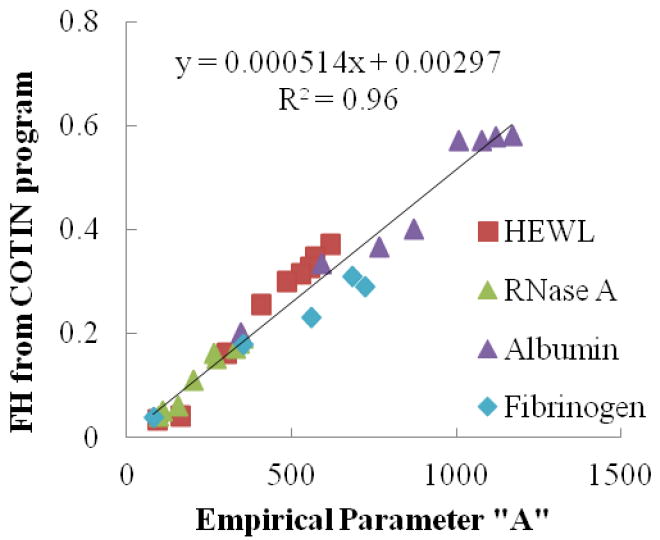
Correlation between the FH calculated by the CONTIN program method and the empirical parameter ‘A’ (i.e., the slope indicated in Eqn. (3) for each CD spectrum over the wavelength range from 230-240 nm; see Fig. 3). As indicated, the slope (‘m’) and y-intercept (‘b’) of the linear correlation line are equal to 0.000514 FH/(molar ellipticity/nm) and 0.00297 molar ellipticity, respectively, according to Eqn. (4). The value of ‘b’ is not significantly different from zero.
4.2. Reliability of the Helical Analysis Using CD Response at 222 nm
In this section, the FH estimated by equation (1) using CD at 222 nm (i.e., 222 nm method) is compared with FH estimated from the CONTIN program method in order to validate the use of the 222 nm method for the estimation of protein helical structure for our set of protein solutions. Once validated, the 222 nm method can then be used as a basis to evaluate the reliability of the 230-240 nm slope method for FH determination for samples with high background absorbance over wavelengths below 220 nm, for which the CONTIN method cannot be applied.
As shown in Figure 5, a strong linear correlation with R2 = 0.96 is found between the FH values from both algorithms for the same protein reference set. However, the 222 nm and CONTIN methods are not in perfect agreement, which would be indicated if the linear regression of the data plot shown in Figure 5 had a slope = 1 and a y-axis intercept = 0. Statistical analyses of the data presented in Figure 5 indicate that the slope of the linear regression line is significantly different from one (p < 0.0001) and we can directly conclude that these two lines (i.e., y = 0.815x + 0.0875 and y = x) are significantly different without comparing the intercepts. Compared to the CONTIN program method, the 222 nm method is thus shown to slightly overestimate helix content when FH < 0.47 and slightly underestimate helicity when FH > 0.47 for this set of samples. Additionally, as noted in the preceding section, statistical analysis of the y-axis intercept of the linear correlation line in Figure 4 shows that it is not significantly different from zero while having an equivalent R2 value as the correlation line in Figure 5. These results suggest that 230-240 nm slope method actually has the potential to provide closer agreement with the CONTIN program method over a wider range of FH than the 222 nm method.
Figure 5.
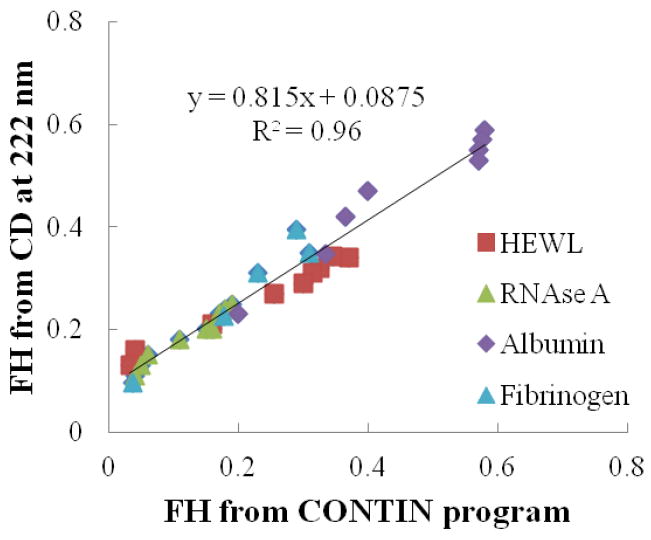
The correlation for calculated FH values between two popular CD algorithms: the 222 nm method and the CONTIN program method. The slope of the linear correlation line is significantly different from one and the y-intercept is significantly different from zero, thus showing some deviation between the CONTIN program and the 222 nm methods for the calculation of FH.
4.3. Comparison Between FH Values Calculated by the 222 nm and 230-240 nm Slope Methods for Protein Solutions with Strong Background Absorbance from 190-220 nm
Figure 6 presents solution structure data for FH values ranging from 0.03 to 0.58 calculated from equation (1) using the 222 nm method versus FH values calculated from equation (4) using the 230-240 nm slope method with ‘m’ and ‘b’ values determined in Section 4.1 (m = 5.14×10⁻³ FH/(molar ellipticity/nm) and b = 2.97×10⁻³ FH). In addition to the FH values from the set of proteins in D.I. water shown in Figure 5, data points are added in Figure 6 for protein in solution with 4 M and 8 M urea, which caused strong background absorbance over the range of 190-220 nm, thus prohibiting application of the CONTIN program method to determine FH. As shown in Figure 6, a strong linear correlation with R2 = 0.98 is obtained between the 222 nm and 230-240 nm slope methods. This result is expected given that the ‘m’ and ‘b’ parameters of the slope method were calculated to fit the FH values determined by the CONTIN program method, which is shown to correlate well with the 222 nm method in Figure 5. More importantly, however, the 230-240 nm slope method is shown in Figure 6 to provide FH values in close agreement with values calculated using the 222 nm method even for protein solutions with a high concentration of urea over the full range of FH.
Figure 6.
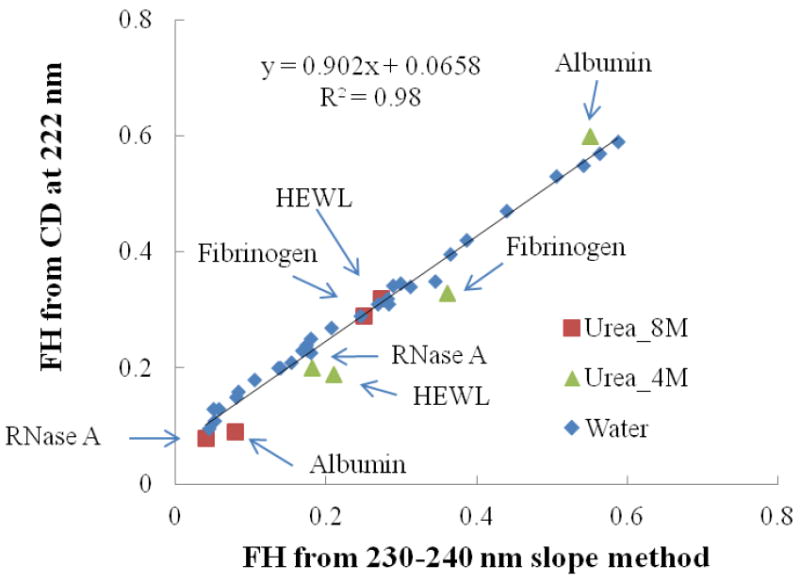
FH calculated from 222 nm method versus the 230-240 nm slope method for four different proteins in D.I. water and in the presence of 4 M and 8 M urea. The trend line is created considering all of the data points.
These results thus support the ability to use the 230-240 nm slope method for the estimation of the percentage of helical secondary structure of proteins in solution, with specific application for samples exhibiting strong background absorbance over wavelengths up to 230 nm, thus preventing the application of either the 222 nm or the CONTIN program method for FH determination.
4.4. Limitation of the 230-240 nm slope method in estimating the helical content of protein
Much like the 222 nm method, the helix content obtained using the 230-240 nm slope method should be used with caution and only when more robust methods cannot be applied due to high background absorbance. Secondary structural assignments within a CD spectrum and their quantification are dependent on both the algorithm used and the dataset available to fit the spectral features.[13, 41] In this present study, the fitting parameters for determining the FH of the proteins using the 230-240 nm slope method were obtained using the CONTIN algorithm that is provided with the CDPro package using protein spectra obtained between 190-240 nm as the reference dataset. Of course, different algorithms and reference datasets may provide different estimates of helical content, resulting in a different set of fitting parameters than those presented in this work for application of the proposed 230-240 nm slope method. [41-44]
To investigate the broader applicability of the presented 230-240 nm slope method beyond our limited dataset, we applied the method to analyze the large CD reference set of proteins with known 3D structures contained in the Protein Circular Dichroism Data Bank (PCDDB), [45] which is an excellent resource for structural biology. Figure 7 presents the plot of 230-240 nm slopes measured from the CD spectra of 71 soluble proteins and 30 membrane proteins, which comprise the SP175 [46] and MP180 [43] datasets within the PCDDB, vs. the fractional helicity for each of these proteins. [47] The fractional helicity for each of these proteins included the contribution from α-, 3(10), and π-helicies as estimated using the DSSP algorithm.[47]
Figure 7.
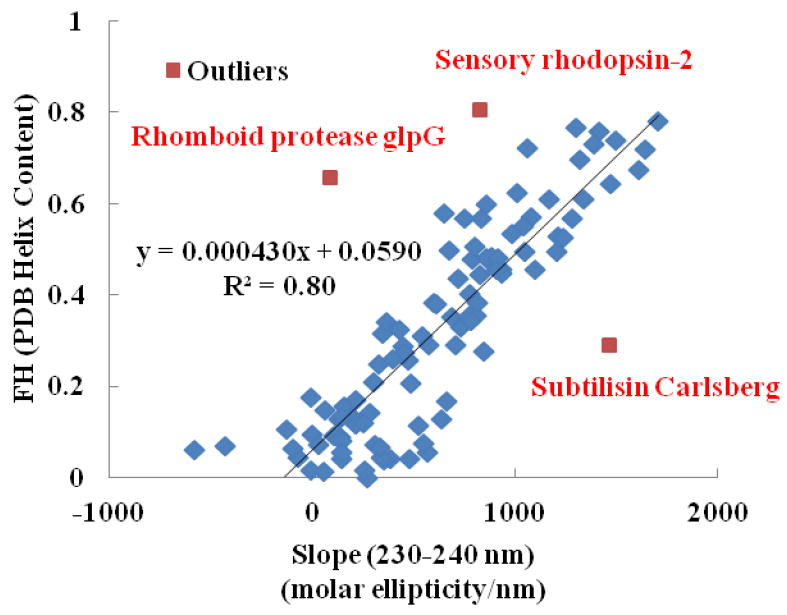
Correlation between the empirical parameter ‘A’ (i.e., the slope of the CD spectrum over the wavelength range from 230-240 nm) and the fractional helicity (FH) estimated using the DSSP [47] for the proteins within the SP175 and MP 180 CD reference sets from the Protein CD Data Bank (PCDDB). [6, 41, 43-45] Outlier data points (indicated in red along with the name of the protein), which were identified using the Studentized–Residual method, [48] have been excluded from the dataset for the calculation of the linear regression line.
As shown in Figure 7, the majority of the data points indicate very good correlation between the 230-240 nm slope and FH. However, there are a few obvious exceptions in the dataset indicative of proteins that do not follow this correlation. These data points, which were identified as outliers of the overall dataset using the Studentized–Residual method, [48] are labeled in red in Figure 7 along with the name of the associated protein. When these outliers are removed from the dataset, the resulting correlation line is not significantly different (p > 0.05) from the correlation line obtained for our experimental dataset that is shown in Figure 4 (slope comparison: p = 0.14; intercept comparison: p = 0.49). Thus, the 230-240 nm methods is shown to be generally reliable for the estimation of the helical content of proteins even for this much larger reference set of proteins aside from a few clear exceptions.
Because Figure 7 presents clear examples where the 230-240 nm slope method does not closely predict the helical content of the protein (e.g., the outliers), before this method is applied to analyze the structure of a given protein for a case where chemical agents are present that cause high background absorbance, its applicability for the protein should first be confirmed. This can be easily accomplished by obtaining the CD spectrum of the protein in a solution with low background absorbance such that the FH value predicted using the 230-240 nm slope method can be compared with a conventional full-spectrum algorithm, such as CONTIN, or with the FH obtained from the Protein Data Bank. [49] If reasonable agreement is found, then the 230-240 nm slope method should be able to be confidently used to predict the FH of the protein under conditions that prevent the use of a conventional full-spectrum method.
It should also be recognized that the contribution by β-sheets to spectral features over the range of 230-240 nm can vary for different proteins and their folded states, and its impact on the spectral features at these wavelengths is still not well-understood.[13, 41]
5. Conclusions
In this study we present a new method to analyze CD spectra that provide the capability of determining the helical structure of protein in solution in the presence of chemical additives that strongly adsorb in the 190 to 230 nm range, which otherwise interfere with the ability to determine protein structure using conventional CD analysis algorithms.
We proposed that the slope (‘A’) of CD a spectrum over the 230 to 240 nm region should be linearly related to the helix content of the protein in solution. The slope (‘m’) and y-intercept (‘b’) for this relationship were calculated by plotting ‘A’ vs. the FH values determined by the CONTIN program method for CD data obtained for four different proteins in solution with helical content ranging from 0.03 to 0.58. The 230-240 nm slope method was then shown to accurately predict FH values for protein solutions with high background absorbance, which prevented the use of the CONTIN algorithm for FH determination.
Application of the 230-240 nm slope method to predict FH of proteins for the much larger datasets provided in the Protein CD Data Bank showed that the resulting correlation line was not significantly different from the correlation line derived from our much smaller dataset, with the exception of a few outlier examples where the protein’s helicity was clearly not well predicted by this method. Given this realization, before using this method to analyze the helicity of a protein in a solution with high background absorbance, it is important to first establish the validity of the method for the designated protein under low-background conditions where it can be shown to provide close agreement with the helicity predicted by a suitable full-spectrum method or helicity obtained directly from the Protein Data Bank.
Based on these results, we conclude that this new 230-240 nm slope method can be used for the determination of the helical content for proteins in solution when the solution exhibits strong absorbance of wavelengths up to 230 nm, thus prohibiting the use of conventional methods for the determination of protein secondary structure in aqueous solution.
Supplementary Material
HIGHLIGHTS.
New CD method for protein helical structure in solutions with strong background absorbance.
New CD algorithm that rely on wavelengths between 230 to 240 nm.
Changes in protein solution structure in the presence of denaturants.
Acknowledgments
This project received support from the Defense Threat Reduction Agency-Joint Science and Technology Office for Chemical and Biological Defense (Grant no. HDTRA1-10-1-0028).
Footnotes
Supplementary Material
The supporting information contains the (1) Protocol for determining the fractional helical (FH) content using the 230-240 nm slope method, and (2) raw data for Figures 3 to 6 in main article.
Publisher's Disclaimer: This is a PDF file of an unedited manuscript that has been accepted for publication. As a service to our customers we are providing this early version of the manuscript. The manuscript will undergo copyediting, typesetting, and review of the resulting proof before it is published in its final citable form. Please note that during the production process errors may be discovered which could affect the content, and all legal disclaimers that apply to the journal pertain.
References
- 1.Li CH, Nguyen X, Narhi L, Chemmalil L, Towers E, Muzammil S, Gabrielson J, Jiang Y. Applications of circular dichroism (CD) for structural analysis of proteins: qualification of near- and far-UV CD for protein higher order structural analysis. Journal of Pharmaceutical Sciences. 2011;100:4642–4654. doi: 10.1002/jps.22695. [DOI] [PubMed] [Google Scholar]
- 2.Sreerama N, Woody RW. Estimation of protein secondary structure from circular dichroism spectra: comparison of CONTIN, SELCON, and CDSSTR methods with an expanded reference set. Anal Biochem. 2000;287:252–260. doi: 10.1006/abio.2000.4880. [DOI] [PubMed] [Google Scholar]
- 3.Greenfield NJ. Using circular dichroism spectra to estimate protein secondary structure. Nat Protoc. 2006;1:2876–2890. doi: 10.1038/nprot.2006.202. [DOI] [PMC free article] [PubMed] [Google Scholar]
- 4.Sreerama N, Woody RW. Computation and analysis of protein circular dichroism spectra. Methods Enzymol. 2004;383:318–351. doi: 10.1016/S0076-6879(04)83013-1. [DOI] [PubMed] [Google Scholar]
- 5.Corrêa DHA, Ramos CHI. The use of circular dichroism spectroscopy to study protein folding, form and function. Afr J Biochem Res. 2009;3:164–173. [Google Scholar]
- 6.Wallace BA, Lees JG, Orry AJW, Lobley A, Janes RW. Analyses of circular dichroism spectra of membrane proteins. Protein Science. 2003;12:875–884. doi: 10.1110/ps.0229603. [DOI] [PMC free article] [PubMed] [Google Scholar]
- 7.Kelly SM, Price NC. The use of circular dichroism in the investigation of protein structure and function. Curr Protein Pept Sci. 2000;1:349–384. doi: 10.2174/1389203003381315. [DOI] [PubMed] [Google Scholar]
- 8.Bohnert JL, Horbett TA. Changes in adsorbed fibrinogen and albumin interactions with polymers indicated by decreases in detergent elutability. Journal of Colloid and Interface Science. 1986;111:363–377. [Google Scholar]
- 9.Griko Y, Sreerama N, Osumi-Davis P, Woody RW, Woody AYM. Thermal and urea-induced unfolding in T7 RNA polymerase: Calorimetry, circular dichroism and fluorescence study. Protein Science. 2001;10:845–853. doi: 10.1110/ps.39701. [DOI] [PMC free article] [PubMed] [Google Scholar]
- 10.Kelly SM, Jess TJ, Price NC. How to study proteins by circular dichroism. Biochim Biophys Acta. 2005;10:119–139. doi: 10.1016/j.bbapap.2005.06.005. [DOI] [PubMed] [Google Scholar]
- 11.Xia Z, Das P, Shakhnovich EI, Zhou R. Collapse of unfolded proteins in a mixture of denaturants. J Am Chem Soc. 2012;134:18266–18274. doi: 10.1021/ja3031505. [DOI] [PubMed] [Google Scholar]
- 12.DiNitto JM, Kenney JM. Noise characterization in circular dichroism spectroscopy. Appl Spectrosc. 2012;66:180–187. doi: 10.1366/11-06417. [DOI] [PubMed] [Google Scholar]
- 13.Greenfield NJ. Using circular dichroism spectra to estimate protein secondary structure. Nature Protocols. 2006;1:2876–2890. doi: 10.1038/nprot.2006.202. [DOI] [PMC free article] [PubMed] [Google Scholar]
- 14.Greenfield NJ. Using circular dichroism collected as a function of temperature to determine the thermodynamics of protein unfolding and binding interactions. Nat Protocols. 2007;1:2527–2535. doi: 10.1038/nprot.2006.204. [DOI] [PMC free article] [PubMed] [Google Scholar]
- 15.Greenfield NJ. Determination of the folding of proteins as a function of denaturants, osmolytes or ligands using circular dichroism. Nat Protocols. 2007;1:2733–2741. doi: 10.1038/nprot.2006.229. [DOI] [PMC free article] [PubMed] [Google Scholar]
- 16.Greenfield NJ. Analysis of the kinetics of folding of proteins and peptides using circular dichroism. Nat Protocols. 2007;1:2891–2899. doi: 10.1038/nprot.2006.244. [DOI] [PMC free article] [PubMed] [Google Scholar]
- 17.Yamamoto T, Fukui N, Hori A, Matsui Y. Circular dichroism and fluorescence spectroscopy studies of the effect of cyclodextrins on the thermal stability of chicken egg white lysozyme in aqueous solution. Journal of Molecular Structure. 2006;782:60–66. [Google Scholar]
- 18.Hawe A, Kasper JC, Friess W, Jiskoot W. Structural properties of monoclonal antibody aggregates induced by freeze thawing and thermal stress. European Journal of Pharmaceutical Sciences. 2009;38:79–87. doi: 10.1016/j.ejps.2009.06.001. [DOI] [PubMed] [Google Scholar]
- 19.Olzmann JA, Brown K, Wilkinson KD, Rees HD, Huai Q, Ke H, Levey AI, Li L, Chin L-S. Familial Parkinson’s disease-associated L166P mutation disrupts DJ-1 protein folding and function. Journal of Biological Chemistry. 2004;279:8506–8515. doi: 10.1074/jbc.M311017200. [DOI] [PubMed] [Google Scholar]
- 20.Fan H, Vitharana SN, Chen T, O’Keefe D, Middaugh CR. Effects of pH and polyanions on the thermal stability of fibroblast growth factor 20. Molecular pharmaceutics. 2007;4:232–240. doi: 10.1021/mp060097h. [DOI] [PubMed] [Google Scholar]
- 21.Garzón MT, Lidón-Moya MC, Barrera FN, Prieto A, Gómez J, Mateu MG, Neira JL. The dimerization domain of the HIV-1 capsid protein binds a capsid protein-derived peptide: A biophysical characterization. Protein Science. 2004;13:1512–1523. doi: 10.1110/ps.03555304. [DOI] [PMC free article] [PubMed] [Google Scholar]
- 22.Robic S, Guzman-Casado M, Sanchez-Ruiz JM, Marqusee S. Role of residual structure in the unfolded state of a thermophilic protein. Proceedings of the National Academy of Sciences. 2003;100:11345–11349. doi: 10.1073/pnas.1635051100. [DOI] [PMC free article] [PubMed] [Google Scholar]
- 23.Reed CJ, Bushnell S, Evilia C. Circular Dichroism and Fluorescence Spectroscopy of Cysteinyl-tRNA Synthetase from Halobacterium salinarum ssp. NRC-1 Demonstrates that Group I Cations Are Particularly Effective in Providing Structure and Stability to This Halophilic Protein. PloS one. 2014;9:e89452. doi: 10.1371/journal.pone.0089452. [DOI] [PMC free article] [PubMed] [Google Scholar]
- 24.Wei Y, Thyparambil AA, Latour RA. Quantification of the influence of protein-protein interactions on adsorbed protein structure and bioactivity. Colloids and Surfaces B: Biointerfaces. 2013;110:363–371. doi: 10.1016/j.colsurfb.2013.04.018. [DOI] [PMC free article] [PubMed] [Google Scholar]
- 25.Sivaraman B, Fears KP, Latour RA. Investigation of the Effects of Surface Chemistry and Solution Concentration on the Conformation of Adsorbed Proteins Using an Improved Circular Dichroism Method. Langmuir. 2009;25:3050–3056. doi: 10.1021/la8036814. [DOI] [PMC free article] [PubMed] [Google Scholar]
- 26.Bhogale A, Patel N, Sarpotdar P, Mariam J, Dongre PM, Miotello A, Kothari DC. Systematic investigation on the interaction of bovine serum albumin with ZnO nanoparticles using fluorescence spectroscopy. Colloids and Surfaces B: Biointerfaces. 2013;102:257–264. doi: 10.1016/j.colsurfb.2012.08.023. [DOI] [PubMed] [Google Scholar]
- 27.Koutsopoulos S, Patzsch K, Bosker WTE, Norde W. Adsorption of Trypsin on Hydrophilic and Hydrophobic Surfaces. Langmuir. 2007;23:2000–2006. doi: 10.1021/la062238s. [DOI] [PubMed] [Google Scholar]
- 28.Sabatino P, Casella L, Granata A, Iafisco M, Lesci IG, Monzani E, Roveri N. Synthetic chrysotile nanocrystals as a reference standard to investigate surface-induced serum albumin structural modifications. Journal of Colloid and Interface Science. 2007;314:389–397. doi: 10.1016/j.jcis.2007.05.081. [DOI] [PubMed] [Google Scholar]
- 29.Trofimova D, de Jongh HHJ. Modification of β-Lactoglobulin by Oligofructose: Impact on Protein Adsorption at the Airb–Water Interface. Langmuir. 2004;20:5544–5552. doi: 10.1021/la049390j. [DOI] [PubMed] [Google Scholar]
- 30.Hu Y-J, Ou-Yang Y, Dai C-M, Liu Y, Xiao X-H. Site-selective binding of human serum albumin by palmatine: spectroscopic approach. Biomacromolecules. 2009;11:106–112. doi: 10.1021/bm900961e. [DOI] [PubMed] [Google Scholar]
- 31.Vertegel AA, Siegel RW, Dordick JS. Silica nanoparticle size influences the structure and enzymatic activity of adsorbed lysozyme. Langmuir. 2004;20:6800–6807. doi: 10.1021/la0497200. [DOI] [PubMed] [Google Scholar]
- 32.Verma A, Simard JM, Rotello VM. Effect of Ionic Strength on the Binding of α-Chymotrypsin to Nanoparticle Receptors. Langmuir. 2004;20:4178–4181. doi: 10.1021/la036183v. [DOI] [PubMed] [Google Scholar]
- 33.Kelly SM, Jess TJ, Price NC. How to study proteins by circular dichroism. Biochimica et Biophysica Acta (BBA) - Proteins and Proteomics. 2005;1751:119–139. doi: 10.1016/j.bbapap.2005.06.005. [DOI] [PubMed] [Google Scholar]
- 34.Clarke DT. Current Protocols in Protein Science. John Wiley & Sons, Inc; 2001. [Google Scholar]
- 35.Walters J, Milam SL, Clark AC. In: Methods in Enzymology. Michael L, Johnson JMH, Gary KA, editors. Academic Press; 2009. pp. 1–39. [DOI] [PMC free article] [PubMed] [Google Scholar]
- 36.Sivaraman B, Fears KP, Latour RA. Investigation of the effects of surface chemistry and solution concentration on the conformation of adsorbed proteins using an improved circular dichroism method. Langmuir. 2009;25:3050–3056. doi: 10.1021/la8036814. [DOI] [PMC free article] [PubMed] [Google Scholar]
- 37.Morrisett JD, David JSK, Pownall HJ, Gotto AM. Interaction of an apolipoprotein (apoLP-alanine) with phosphatidylcholine. Biochemistry. 1973;12:1290–1299. doi: 10.1021/bi00731a008. [DOI] [PubMed] [Google Scholar]
- 38.Duarte AMS, Wolfs CJAM, van Nuland NAJ, Harrison MA, Findlay JBC, van Mierlo CPM, Hemminga MA. Structure and localization of an essential transmembrane segment of the proton translocation channel of yeast H+-V-ATPase. Biochimica et Biophysica Acta (BBA) - Biomembranes. 2007;1768:218–227. doi: 10.1016/j.bbamem.2006.07.014. [DOI] [PubMed] [Google Scholar]
- 39.Fujiwara Y, Kurokawa T, Takeshita K, Kobayashi M, Okochi Y, Nakagawa A, Okamura Y. The cytoplasmic coiled-coil mediates cooperative gating temperature sensitivity in the voltage-gated H+ channel Hv1. Nat Commun. 2012;3:816. doi: 10.1038/ncomms1823. [DOI] [PubMed] [Google Scholar]
- 40.Paci E, Karplus M. Unfolding proteins by external forces and temperature: The importance of topology and energetics. Proceedings of the National Academy of Sciences. 2000;97:6521–6526. doi: 10.1073/pnas.100124597. [DOI] [PMC free article] [PubMed] [Google Scholar]
- 41.Whitmore L, Wallace BA. Protein secondary structure analyses from circular dichroism spectroscopy: methods and reference databases. Biopolymers. 2008;89:392–400. doi: 10.1002/bip.20853. [DOI] [PubMed] [Google Scholar]
- 42.Whitmore L, Wallace B. DICHROWEB, an online server for protein secondary structure analyses from circular dichroism spectroscopic data. Nucleic acids research. 2004;32:W668–W673. doi: 10.1093/nar/gkh371. [DOI] [PMC free article] [PubMed] [Google Scholar]
- 43.Abdul-Gader A, Miles AJ, Wallace BA. A reference dataset for the analyses of membrane protein secondary structures and transmembrane residues using circular dichroism spectroscopy. Bioinformatics. 2011;27:1630–1636. doi: 10.1093/bioinformatics/btr234. [DOI] [PubMed] [Google Scholar]
- 44.Lees JG, Miles AJ, Wien F, Wallace B. A reference database for circular dichroism spectroscopy covering fold and secondary structure space. Bioinformatics. 2006;22:1955–1962. doi: 10.1093/bioinformatics/btl327. [DOI] [PubMed] [Google Scholar]
- 45.Whitmore L, Woollett B, Miles AJ, Klose DP, Janes RW, Wallace BA. PCDDB: the protein circular dichroism data bank, a repository for circular dichroism spectral and metadata. Nucleic acids research. 2011;39:D480–D486. doi: 10.1093/nar/gkq1026. [DOI] [PMC free article] [PubMed] [Google Scholar]
- 46.Lees JG, Miles AJ, Wien F, Wallace BA. A reference database for circular dichroism spectroscopy covering fold and secondary structure space. Bioinformatics. 2006;22:1955–1962. doi: 10.1093/bioinformatics/btl327. [DOI] [PubMed] [Google Scholar]
- 47.Kabsch W, Sander C. Dictionary of protein secondary structure: Pattern recognition of hydrogen-bonded and geometrical features. Biopolymers. 1983;22:2577–2637. doi: 10.1002/bip.360221211. [DOI] [PubMed] [Google Scholar]
- 48.Hadi AS, Simonoff JS. Procedures for the Identification of Multiple Outliers in Linear Models. Journal of the American Statistical Association. 1993;88:1264–1272. [Google Scholar]
- 49.Berman HM, Westbrook J, Feng Z, Gilliland G, Bhat TN, Weissig H, Shindyalov IN, Bourne PE. The Protein Data Bank. Nucleic Acids Res. 2000;28:235–242. doi: 10.1093/nar/28.1.235. [DOI] [PMC free article] [PubMed] [Google Scholar]
Associated Data
This section collects any data citations, data availability statements, or supplementary materials included in this article.