

Abstract
Emerging and re-emerging infectious diseases of zoonotic origin like highly pathogenic avian influenza pose a significant threat to human and animal health due to their elevated transmissibility. Identifying the drivers of such viruses is challenging and complicates the estimation of spatial diffusion because the variability of viral spread from locations could be caused by a complex array of unknown factors. Several techniques exist to help identify these drivers including bioinformatics, phylogeography, and spatial epidemiology but these methods are generally evaluated separately and do not consider the complementary nature of each other. Here we studied an approach that integrates these techniques and identifies the most important drivers of viral spread by focusing on H5N1 in Egypt because of its recent emergence as an epicenter for the disease. We used a Bayesian phylogeographic generalized linear model (GLM) to reconstruct spatiotemporal patterns of viral diffusion while simultaneously assessing the impact of factors contributing to transmission. We also calculated the cross-species transmission rates among hosts in order to identify the species driving transmission. Density of both human and avian species were supported contributors along with latitude, longitude, elevation, and several meteorological variables. Also supported was the presence of a genetic motif found near the hemagglutinin cleavage site. Various genetic, geographic, demographic, and environmental predictors each play a role in H1N1 diffusion. Further development and expansion of phylogeographic GLMs such as this will enable health agencies to identify variables that can curb virus diffusion and reduce morbidity and mortality.
Introduction
Currently emerging and re-emerging infectious diseases of zoonotic origin such as highly pathogenic avian influenza A pose a significant threat to human and animal health due to their elevated transmissibility [1,2]. Predicting the spread of these viruses is challenging because many of the drivers of disease are not easily identifiable. These drivers can be of an environmental, geographic, demographic, genetic, or other nature. For example, diffusion could be caused by climate, human and avian population density, and other key demographic profiles [3]. Several techniques exist to help identify these drivers including bioinformatics, phylogeography, and spatial epidemiology but these methods are generally evaluated separately and do not consider the natural complementary principles of each other. Successful analysis of spatial epidemiological factors have identified air travel and global mobility as key drivers of influenza [4] but do not consider the key elements of molecular sequence analysis such as gene flow, cross-species transmission (CST), and viral mutations to support and complement their work. Similarly, bioinformatics and phylogeographic techniques which thoroughly analyze sequence data often ignore climate and demographic factors. Here we will adopt an approach which integrates these separate techniques and helps identify the most important drivers of disease spread. A more comprehensive model of viral diffusion will be useful for public health and other agencies to develop strategies for curbing spread of these devastating diseases. Knowing the factors that are most relevant in predicting the diffusion will allow for an accurate and continuous threat assessment and prevention.
Two previous studies on various influenza subtypes have identified several potential environmental and demographic drivers of viral diffusion including precipitation, humidity, and temperature [5], human, duck, and chicken density [6] but fail to account for genetic variables. Conversely a study by Lam et al. [7] showed that H5N1 in Indonesia began by an introduction of the virus in East Java in 2002 and was followed by east and westward migration to cover the entire country. This work highlights that phylogeographic and bioinformatics techniques can pinpoint locations and demonstrate migratory patterns of viral diffusion. Unfortunately this study lacks demographic and epidemiological factors which also could have contributed to the diffusion, demonstrating a lack of coordination between the methodologies.
Ypma et al. [8] presented an integration of these techniques by estimating the migratory patterns of influenza A H7N7 transmission between farms in the Netherlands using genetic data as well as spatiotemporal elements. The authors were able to demonstrate that geography alone is not a reliable indicator of transmission routes but that it does improve the accuracy of the routes when combined with both genetic and temporal data. A different study by Ypma et al. [9] then utilized within-host dynamics and genetic data to create phylogenetic trees to estimate transmission routes and connect estimating variables. Their separate evaluation of space-time and genetic contributors was a unique innovation to the performance evaluation of transmission trees. Studies like these have shown how phylogeography, bioinformatics, and epidemiology approaches can be integrated to provide more accurate modeling of disease outbreaks.
The diffusion of H5N1 in Egypt is an excellent candidate for testing such an approach. Egypt has emerged as an epicenter for H5N1 with 173 confirmed human cases as of January 2014, the most of any country aside from Southeast Asia [10]. The cultural preference of Egyptian citizens is to utilize live bird markets to obtain their poultry which results in 70% of all poultry trade occurring in this manner [11]. The environment of these markets yields a high possibility of infection and spread of H5N1, and in 2009 Abdelwhab et al. [12] determined that over 12.4% of tested markets contained infected avian species. These markets thus become a major source of avian-to-human transmission [11]. While this can help explain the primary route by which humans are infected by avian species, there is uncertainty as to their connection to human and animal infection across the entire Egyptian landscape.
In this paper we evaluate H5N1 spread in Egypt by reconstructing its phylogenetic history while simultaneously determining the impact of the certain environmental, geographic, demographic, and genetic drivers. This model will help pinpoint the variables most responsible for the diffusion as well as eliminate unsupported characteristics from model consideration. We focus on a variant H5N1 subclade 2.2.1.1., which is one of 10 currently defined subclades within Egypt [13]. This particular clade is appropriate because it is found almost exclusively within Egypt and therefore all features of the landscape, culture, and climate are potentially directly relevant for its diffusion dynamics. We expand on preliminary work by Beard et al. [14] by including additional predictors of diffusion as well as new techniques for analysis of viral sequences.
Methods
Sequence Data
We utilized the dataset by Scotch et al. [15] which contains 226 sequences of the hemagglutinin gene of H5N1 influenza variant subclade 2.2.1.1. The dataset includes sequences from 20 of the 27 governorates (Figure 1) that were isolated from 2007–2012 from both human and avian hosts. The host species and number of sequences is as follows: chicken (156), duck (43), human (14), goose (6), turkey (4), environment (2), and quail (1). We refer the read to Scotch et al. [15] for details on classification of the sequences into subclade 2.2.1.1. and analysis of phylogeographic trees.
Fig. 1.

Visual map of Egypt highlighting the governorates from which human or avian H5N1 sequences included in this study originated. 226 sequences were used in this study spanning 20 of the 27 Egyptian governorates.
Generalized Linear Model
We adopted a Bayesian phylogeographic generalized linear model (GLM) approach by Lemey et al. [16] to reconstruct spatiotemporal patterns of viral spread while simultaneously assessing the impact of our predictors. In this approach, we discretize geographic locations and model diffusion between locations through a continuous-time Markov chain (CTMC) processes in which we parameterize the instantaneous rates via a GLM. Specifically, we used a non-reversible CTMC process expressed as a K x K infinitesimal rate matrix of location change (Λ) among K discrete locations [17]. We parameterize instantaneous rate Λij by utilizing a linearized log function to incorporate all potential pairwise predictors p1, …, pn and evaluated them on a log-scale.
| [17] – p.7 |
Here, βi indicates the relative contribution of predictor pi to the whole GLM and δ is a binary indicator which determines whether an individual predictor is included in the model for evaluation [18]. The indicator enables a Bayesian stochastic search variable selection [18,19] such that all posterior probabilities of each possible model, including or excluding every predictor, are estimated. We used a Bernoulli prior probability distribution in order to place an equal probability for inclusion or exclusion of each predictor [17], and set the prior success probability of the Bernoulli distribution such that there was a 50% prior probability that the model does not contain any predictor. We log-transformed all predictor values and implemented the GLM within Bayesian Evolutionary Analysis by Sampling Trees [20] (BEAST) v1.8.0 with the Broad-platform Evolutionary Analysis General Likelihood Evaluator [21] (BEAGLE) 2.1 library implementation. The nature of the log-linear function requires each value to be positive so any data points that were missing or zero were handled to avoid this error. Specific instances are detailed below.
Environmental, Geographic, Demographic, and Genetic Predictors
We selected the following potential predictors with the aid of experts studying H5N1 in Egypt. For our nonreversible diffusion process A→B, we evaluated each predictor from the governorate of origin as well as the governorate of destination. In Table 1, we provide descriptive statistics for the predictors.
Table 1.
Descriptive statistics of each predictor run through the GLM on a per-governorate scale.
| Predictor | Units | Mean | Median | Standard Deviation | IQR |
|---|---|---|---|---|---|
| Distance | Kilometers | 265 | 184 | 206 | 296 |
| Latitude | Degrees | 29.66 | 30.39 | 1.94 | 1.42 |
| Longitude | Degrees | 31.31 | 31.25 | 0.98 | 1.03 |
| Avian Counts | Cases/year | 17.6 | 12.9 | 15.9 | 25.8 |
| Human Counts | Cases/year | 1.1 | 1.1 | 0.8 | 1.3 |
| Human Density | Heads/km2 | 1056 | 536 | 1094 | 1197 |
| Avian Density | Heads/km2 | 1290 | 459 | 1465 | 1992 |
| Chicken Density | Heads/km2 | 998 | 379 | 1065 | 1698 |
| Turkey Density | Heads/km2 | 14 | 3 | 24 | 20 |
| Duck Density | Heads/km2 | 120 | 23 | 304 | 35 |
| Goose Density | Heads/km2 | 55 | 20 | 63 | 84 |
| Pigeon Density | Heads/km2 | 103 | 37 | 118 | 159 |
| No-Motif Density | Heads/km2 | 1090 | 428 | 1153 | 1911 |
| Elevation | Meters | 88.6 | 59.0 | 72.7 | 60.7 |
| Precipitation | Millimeters/year | 41.9 | 30.0 | 45.5 | 53.0 |
| Temperature | Celsius | 21.6 | 21.3 | 1.4 | 1.4 |
| Relative Humidity | Percent | 56.1 | 54.5 | 10.4 | 15.5 |
Latitude, Longitude, and Elevation
We obtained geographic coordinates for the centroid of each governorate using geonames.org. While these coordinates likely do not reflect the exact location of the host, we chose the centroid in order to create uniformity in the model. We used Google Earth to obtain the elevation of each centroid.
Distance
We used Google Maps to calculate the raw linear distance between the centroid of each governorate. Although road or travel distances would likely be more accurate in terms of true transmission paths, the isolated location of some of the centroid locations made this impossible to calculate.
Human and Avian Population Density
Currently, the most recent data for human populations per governorate is a 2012 estimate by the Egyptian Central Agency for Public Mobilization and Statistics [22]. We used two databases provided by the Food and Agricultural Organization of the United Nations (FAO) to obtain the avian populations: FAOSTAT [23] and the Global Livestock Production and Health Atlas (GLiPHA) [24]. The specific categories of avian populations provided by these resources are chickens, turkeys, ducks, geese/guinea fowl, and pigeons/other birds. We were unable to use 2012 data for the avian populations because there is no breakdown of populations per species for each governorate available for that year. The number of ducks and turkeys were available for each governorate for 2011 and were available for chickens for 2005 via GLiPHA. We estimated the chicken populations for 2011 by prorating the 2005 value per governorate to the total FAOSTAT value for 2011. There was no data available per governorate for geese/guinea fowl or pigeons/other birds for any year so we estimated these values to be the percentage of total geese/guinea fowl or pigeons/other birds from FAOSTAT equal to the percentage of chickens, ducks, and turkeys relative to the total amount in Egypt for 2011 per governorate. In order to meet the requirements for the log-linear model, any missing value was imputed via mean imputation. Total avian populations reflect the sum of the five avian categories previously described. For avian and human density, we divided total population by the land area of each governorate to obtain a density of heads per km2.
Avian Population Lacking a Genetic Motif
According to Yoon et al. [25] the pathogenicity of H5N1 depends on the number of basic amino acids at the HA cleavage site. This includes a mutation PQGERRRK/RKR*GLF to PQGEGRRK/RKR*GLF. The presence of this motif results in a reduced pathogenicity of the virus and we used Geneious Pro 5.0.3 (Biomatters Ltd., Auckland, New Zealand) to locate the presence of this mutation in our HA sequences. We calculated the expected number of total avians per governorate which lack the motif by the following equation:
In this equation Nj is the expected number of avians to lack the genetic mutation, Tj is the total avian population for 2011, Aj is the number of avian sequences obtained from the governorate, and Mj is the number of sequences which contain the motif. The resulting value was divided by the land area in order to obtain a density in heads per km2.
Precipitation, Temperature, and Relative Humidity
We obtained the data for average annual rainfall, temperature, and relative humidity from the National Climatic Data Center as part of the National Oceanic and Atmospheric Administration [26]. We obtained data for each governorate from the climate station nearest to the centroid. The values represent 30-year averages for the window of January 1, 1961 through December 31, 1990. Although this range does not cover the time period from which our sequences were obtained, the World Meteorological Organization has defined this period as the current climate normal [27] and likely represents an accurate depiction of typical weather over the timespan of our study.
Case Counts
We obtained the number of confirmed human and estimated avian cases from the Dr. Abdelsatar Arafa at the FAO spanning the years 2007–2013. In total, 2,460 avian cases and 158 human cases covered the 20 governorates in the study and data imputed in the GLM reflects the average number of cases per year for each governorate. Two governorates, New Valley and Port Said, did not have any recorded human cases over the time period so each was fixed with one case to avoid an undefined value for log-transformation. These imputations should not create a sampling bias due to their minimal increase in the sample size.
Cross Species Transmission
We used the program Migrate-n [28] in order to analyze the relationship between sequences obtained from different species. In order to maximize the amount of sequences that could be analyzed, we fitted sequences of a unique length with up to 3 “wild-card” nucleotides at the c-terminus to be added in with the nearest population of sequences. We ran the program with all sequences fitting these criteria including chicken, duck, turkey, goose, and human hosts. This accounted for 219 of the 226 original sequences in our dataset and resulted in the loss of our only quail sequence. The calculation and description of CST values were described by Streicker et al. [29] and we used the following equation to incorporate the Migrate-n output:
| [30] – p.2 |
Here, Rij represents the per capita CST from species i to species j, βij represents the unidirectional migration rate obtained by Migrate-n from species i to species j, θj represents the estimate of genetic diversity for species j obtained from Migrate-n, and τ represents the generation time of H5N1. τ is defined as the sum of the incubation and infectious periods for H5N1 which is approximately 2.48 days [31]. The CST can be interpreted as the expected number of infections in species i resulting from just one infected individual of species j.
Evaluation of Predictor Inclusion
We obtained posterior inclusion probabilities for each individual predictor via BEAST and used Bayes factors (BFs) to determine support of each predictor within the model [32]. The inclusion probability is the indicator expectation, E(δ), which is defined as the frequency that the individual predictor is included in the model and is a raw support statistic [17]. The greater the inclusion probability the more likely it is that the predictor is contributing to the diffusion process. To compare these probabilities with a baseline, we calculated BFs via posterior odds of predictor inclusion divided by prior odds as demonstrated by the following equation:
| [17] |
Here pi is the posterior probability of predictor inclusion, or δ=1, while qi is the prior probability that δ=1. In this scenario, BFs equate to the amount that the observed data from our GLM (pi) have changed from the original opinion (qi) of the predictors. In this model qi is the binomial prior on the total number of successes (δ=1) that prefers a 50% likelihood of no predictor being included in the model and is calculated using the binomial distribution probability mass function. The BF quantifies the relative support of two competing hypotheses, pi and qi, given the observed data [32] and shows which of the two probabilities is more likely. The cutoff BF for support within the model was set at 3.0 as is consistent with previous work [33], for establishing a threshold for positive evidence against the null hypothesis, qi [34]. This allowed us to account for the possibility of high correlation between predictors. For example, a BF score of 3.0 indicates that pi is 3-fold more likely than qi, where no predictor is included 50% of the time. The GLM also produces a β-coefficient for each predictor which is the contribution of the predictor to the model when it is included (β|δ=1)) as seen in the equation for the log-linear GLM. We used a bit flip operator to evaluate δ similar to Drummond et al. [35] in order to complete the calculations.
Results
In Tables 2 and 3, we provide the, posterior inclusion probabilities and BFs for each predictor, stratified by governorate of origin and destination. The two most supported predictors are avian counts from governorate of destination (BF>20,000) followed by avian counts from governorate of origin (BF=80.28). Although these BFs are in the “very strong” and “strong” categories of Kass and Raftery [34], respectively, these likely arise from sampling differentiation between locations and should be excluded from consideration. While these predictors are not of direct scientific interest, their inclusion does enable the GLM to help control for differential sampling bias in estimates for the remaining predictors. The following predictors, in order, constitute the remaining factors which reached the BF threshold of 3.0, all coming from the governorate of origin: avian density, pigeon density, longitude, goose density, proportion of avians without the genetic motif, chicken density, human density, elevation, precipitation, duck density, human counts, latitude, humidity, temperature, and duck density. There were no supported predictors from the governorate of destination with the exception of the aforementioned avian counts.
Table 2.
Inclusion support statistics for governorate of origin.
| Predictor | Posterior Inclusion Probability | Bayes Factor |
|---|---|---|
| Avian Counts | 0.63 | 80.28 |
| Avian Density | 0.32 | 22.87 |
| Pigeon Density | 0.31 | 21.45 |
| Longitude | 0.30 | 20.35 |
| Goose Density | 0.30 | 20.24 |
| No Motif Density | 0.26 | 16.78 |
| Chicken Density | 0.25 | 15.63 |
| Human Density | 0.24 | 15.08 |
| Elevation | 0.24 | 14.99 |
| Precipitation | 0.22 | 13.64 |
| Duck Density | 0.22 | 13.20 |
| Human Counts | 0.21 | 12.69 |
| Latitude | 0.17 | 9.51 |
| Humidity | 0.16 | 9.21 |
| Temperature | 0.13 | 7.13 |
| Turkey Density | 0.10 | 5.50 |
| Distance | 0.01 | 0.46 |
Table 3.
Inclusion support statistics for governorate of destination.
| Predictor | Posterior Inclusion Probability | Bayes Factor |
|---|---|---|
| Avian Counts | 1.00 | 28058.39 |
| Goose Density | 0.01 | 0.73 |
| No Motif Density | 0.01 | 0.67 |
| Avian Density | 0.01 | 0.62 |
| Pigeon Density | 0.01 | 0.59 |
| Chicken Density | 0.01 | 0.51 |
| Distance | 0.01 | 0.46 |
| Duck Density | 0.01 | 0.46 |
| Human Density | 0.01 | 0.37 |
| Elevation | 0.01 | 0.29 |
| Human Counts | 0.00 | 0.16 |
| Latitude | 0.00 | 0.13 |
| Temperature | 0.00 | 0.13 |
| Humidity | 0.00 | 0.13 |
| Turkey Density | 0.00 | 0.11 |
| Longitude | 0.00 | 0.08 |
| Precipitation | 0.00 | 0.08 |
Of the predictors which reached the BF threshold of 3.0, avian density, pigeon density, longitude, and goose density each had a BF in excess of 20.0, which is the threshold marker of a “strong” predictor [34] (p.777). In Figure 2, we show the posterior inclusions probability of the 15 supported predictors, BF markers, and the β-coefficient complete with the 95% Bayesian credible interval to visualize uncertainty. The wide range of the 95% credible intervals for each β-coefficient make interpretation of their relative contribution difficult; however the size of the BF metric for each predictor provides confidence that these variables are in fact playing a role in the spread of H5N1.
Fig. 2.
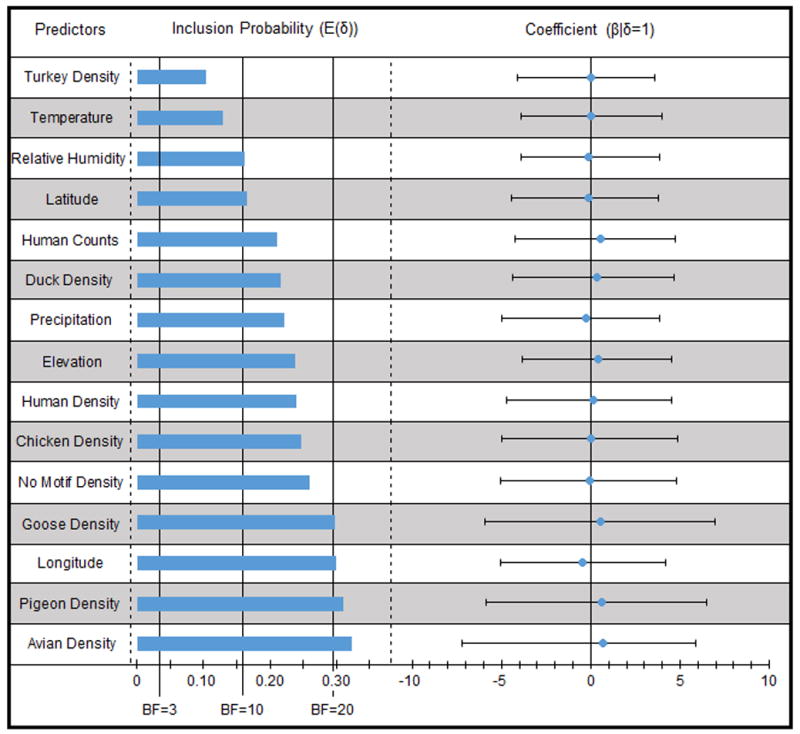
The 15 relevant and supported predictors are shown with inclusion probability, indicated by the blue bar, and supplemented by several BF values, indicated by vertical black lines. Also included is the posterior mean, represented by the blue dot, and 95% confidence interval of the GLM test coefficient.
Since the GLM shows a lack of support for any predictor dependent upon governorate of destination it can be concluded that origin-based predictors are primarily responsible for viral spread. Fixed variables such as latitude, longitude, and elevation had similar support scores as naturally occurring factors like precipitation, relative humidity, and temperature as well as variable agricultural quantities like the densities of specific avian birds and humans. The support of the density of avian birds without the motif indicates that the mutation identified by Yoon et al. [25] indeed plays a role in the diffusion process and confirms the role of at least one demographic, geographic, environmental, and genetic features for the complex spatiotemporal spread of H5N1 influenza in Egypt.
In Table 4, we provide the CST results, which indicate that transmission to humans is generally caused by ducks, turkeys, and geese. This is surprising given that the overall population density of chickens in Egypt is far larger than any of the other avian species analyzed. Humans were also calculated to have a high transmissibility to turkeys, geese, and ducks but not toward chickens and had the highest mean of per-capita transmission to all species. By these same calculations, turkeys were second most transmissible, followed closely by ducks and geese while chickens were least-transmissible among species measured. The mean per capita CST values from largest to smallest is: human, turkey, duck, geese, and chicken. Mean duck and geese CST values are very similar as well at 2.37 and 2.31, respectively.
Table 4.
Calculated cross-species transmission values from Migrate-n.
| Transmitted To
|
|||||||
|---|---|---|---|---|---|---|---|
| Human | Chicken | Duck | Goose | Turkey | Mean | ||
|
|
|||||||
| Transmitted From | Human | 1.02 | 3.42 | 4.61 | 5.23 | 3.57 | |
| Chicken | 1.40 | 0.85 | 2.23 | 2.10 | 1.65 | ||
| Duck | 3.58 | 0.70 | 3.01 | 2.18 | 2.37 | ||
| Goose | 3.08 | 0.70 | 2.97 | 2.49 | 2.31 | ||
| Turkey | 3.34 | 0.99 | 2.53 | 3.30 | 2.54 | ||
| Mean | 2.85 | 0.85 | 2.44 | 3.29 | 3.00 | ||
Discussion
In this work, we modeled H5N1 viral spread in Egypt while simultaneously testing the hypothesis of various environmental, geographic, demographic, and genetic predictors. The posterior inclusion probabilities generated and calculated BF values show support for 15 variables of direct scientific interest. While these 15 variables have relatively low probabilities (E(δ) < 0.35) this should not be taken to mean that the variables are not relevant to the diffusion process. If we have E(δ)=0.30 for a given predictor, this means that 30% of all possible linear models, including or excluding that and all other predictors, support its inclusion with a high probability. Furthermore, the BF values indicate how much more likely it is that the predictor should be included than the defined posterior probability that there was a 50% chance of no predictor being included. This conservative prior probability allows us to state the strength of each predictor with a high confidence, even if the posterior inclusion probability remains low.
Among avian species we found that densities of ducks, geese/guinea fowl, turkey, pigeons/other birds and chickens are all supported for inclusion within the phylogeographic GLM, all with similar BFs while human density has an inclusion probability ranking in between that of the various avian species. This emphasizes the need for health agencies to consider human and animal census data when determining infectious disease risk while focusing on known viral carriers and reservoir species. This also supports the notion that live bird markets are involved with transmission due to high density and close contact with humans. Real-time monitoring of live bird market inventory would provide public health agencies with very accurate numbers of poultry and enable them to have detailed information in specific locations. This could be done simply by requiring all market vendors to report their stocks each day and the market as a whole could submit a compiled dataset on a weekly basis. Active data collection such as this would be effective in determining whether specific species are directly linked with trends in the diffusion of various viruses including H5N1.
Our findings that environmental factors are predictors of influenza diffusion are consistent with work by He et al. [36] who analyzed virus spread in Canada. Specifically, the authors identified longitude, temperature, and humidity as strong predictors, all of which are supported in our GLM by the BF metric. This reiterates the previous findings that geographic and climate factors impact the diffusion of influenza. In contrast, their model did not identify human population as a significant predictor [36]. We used population density rather than raw population and our result positively indicates human density should be included within the model (BF = 15.08) from the governorate of origin. This discrepancy could be explained by the fact that Egypt’s population density is approximately 24-fold that of Canada’s [37,38] so human-to-human transmission is far more likely. Poultry density and household density were also found to be among ecological determinants of H5N1 spread in Bangladesh [39]. Since our model analyzed the same virus in a country where live bird markets are also prevalent [40] these conclusions strongly suggest that both avian and human population sizes are reliable indicators of H5N1 diffusion.
Several of the predictors supported in our model have also been linked to H5N1 risk in various other studies. For example, elevation had previously been identified as a risk factor of other HPAIs including H5N1 in Indonesia [41], and Vietnam [42] so this predictor should undoubtedly be included in most models and is strongly included in ours. Chicken density has been identified as a risk factor in Vietnam [42] and additionally confirmed in Cambodia, Laos, and Thailand [43]. Furthermore, Gilbert et al. [43] concluded that duck, geese, and human population were correlated as risk factors in southeast Asia, all of which are supported in our model. Precipitation has been shown to be an indicator of outbreak risk of H5N1 in Europe [44] and given the relative ease of tracking and reporting such a value via active World Meteorological Organization stations it should be included in future models. The consistent identification of these variables in Egypt as well as various different regions indicates that these should be carefully monitored by health agencies during surveillance efforts regarding avian influenza.
Lemey et al. [16] previously demonstrated the capabilities of a phylogeographic GLM for determining spread of H3N2 using a similar set of predictors. While that study provided a global look, our work focused on one region in order to identify diffusion drivers specific to Egypt. Our approach has allowed us to identify key variables which contribute to the H5N1 diffusion and provides a rough model that can be tested in other countries and with other viruses. The ability to determine consistent variables relating to viral diffusion would undoubtedly be a huge breakthrough to understanding spatial spread.
This study has several limitations including the inability to include CST values directly within the GLM. Specifications of Migrate-n rendered us unable to perform a governorate-to-governorate analysis which we utilized for each of the other predictors. To accommodate the CST process we instead analyzed the transmissibility between species and used it as complementary data to support our GLM. We were unable to use transmission path distance between the locations because road access was not available to the centroid location for each governorate. Trends in variable predictors could prove to match up with spikes in reported cases that will further supplement their inclusion within our GLM. In addition, we were also unable to obtain the exact location from which the sequences were collected and could therefore only utilize the centroid coordinates for each location. These discrepancies in distance and true location could certainly impact the inclusion of the latitude, longitude, and geographical distance predictors within the GLM. At the time of this writing the most recent World Health Organization update on human case counts within Egypt was January 2014 [10] which provides us with potentially outdated data for this predictor. Additionally, the number of avian birds by species needed to be estimated for chickens, geese/guinea fowl, and pigeon/other birds because these data were not available per governorate for 2011. Although these were approximations, the BF support values make a compelling case that the estimations were accurate and are consistent with previous findings. Our estimations and data included within the GLM are under the assumption that there has not been a large overhaul of agricultural land within each governorate since the most recent publication of these population values.
Although this work focused solely on influenza H5N1 in Egypt, this approach remains generalizable to additional locations and viruses and demonstrates the usefulness of combining phylogeographic, bioinformatics, and epidemiological approaches to simultaneously to evaluate the viral spread. These methods can be combined with an established framework of evolutionary and ecological dynamics in order to explain spatial diffusion [45]. Our future work will include other clades of H5N1, an expansion of environmental predictors, and more genes of interest such as neuraminidase in order to develop a more comprehensive model. We will also expand our geographic focus to determine if our significant predictors are constant across other countries such as China or Indonesia where H5N1 is persisting. GLMs such as this will undoubtedly aid public health agencies in their ability to predict and prevent outbreaks as well as explore improvements in preventative tactics. Our identification of drivers will be useful for public health agencies to monitor pandemic risk levels, plan protocols for reducing threats, and devise strategies best suited to protect citizens from the consequences of outbreaks.
Acknowledgments
Funding
This research was supported in part by National Institutes of Health grants R00LM009825 (to MS), R01HG006139 (to MAS), and R01AI107034 (to MAS). This research was also supported in part by National Science Foundation grants DMS126153 and IIS1251151 (to MAS). In addition, this research was supported in part by the European Research Council under the European Community’s Seventh Framework Programme (FP7/2007–2013) under Grant Agreement no. 278433-PREDEMICS (to PL) and ERC Grant agreement no. 260864 (to PL).
We would like to thank Dr. Peter Beerli for assistance with the Migrate-n program. We would also like to thank Sahithya Dhamodharan for her aid in gathering reference information. Thank you to Dr. Abdelsatar Arafa at the FAO for his assistance in the identification of local predictors in Egypt and for providing recent data regarding poultry production for the country.
Footnotes
The content is solely the responsibility of the authors and does not necessarily represent the official views of the National Institutes of Health, the National Science Foundation, or the European Research Council.
Conflict of Interest
The authors declare that they have no conflict of interest.
References
- 1.Krauss H. Zoonoses: Infectious Diseases Transmissible from Animals to Humans. ASM Press; 2003. [Google Scholar]
- 2.Chen Y, Liu T, Cai L, Du H, Li M. A One-Step RT-PCR Array for Detection and Differentiation of Zoonotic Influenza Viruses H5N1, H9N2, and H1N1. Journal of Clinical Laboratory Analysis. 2013;27 (6):450–460. doi: 10.1002/jcla.21627. [DOI] [PMC free article] [PubMed] [Google Scholar]
- 3.Herrick K, Huettmann F, Lindgren M. A global model of avian influenza prediction in wild birds: the importance of northern regions. Veterinary Research. 2013;44 (1):42. doi: 10.1186/1297-9716-44-42. [DOI] [PMC free article] [PubMed] [Google Scholar]
- 4.Viboud C, Bjørnstad ON, Smith DL, Simonsen L, Miller MA, Grenfell BT. Synchrony, Waves, and Spatial Hierarchies in the Spread of Influenza. Science. 2006;312 (5772):447–451. doi: 10.1126/science.1125237. [DOI] [PubMed] [Google Scholar]
- 5.Tamerius JD, Shaman J, Alonso WJ, Bloom-Feshbach K, Uejio CK, Comrie A, Viboud C. Environmental Predictors of Seasonal Influenza Epidemics across Temperate and Tropical Climates. PLoS Pathog. 2013;9 (3):e1003194. doi: 10.1371/journal.ppat.1003194. [DOI] [PMC free article] [PubMed] [Google Scholar]
- 6.Van Boeckel TP, Thanapongtharm W, Robinson T, Biradar CM, Xiao X, Gilbert M. Improving Risk Models for Avian Influenza: The Role of Intensive Poultry Farming and Flooded Land during the 2004 Thailand Epidemic. PLOS ONE. 2012;7 (11):e49528. doi: 10.1371/journal.pone.0049528. [DOI] [PMC free article] [PubMed] [Google Scholar]
- 7.Lam TT-Y, Hon C-C, Lemey P, Pybus OG, Shi M, Tun HM, Li JUN, Jiang J, Holmes EC, Leung FC-C. Phylodynamics of H5N1 avian influenza virus in Indonesia. Molecular Ecology. 2012;21 (12):3062–3077. doi: 10.1111/j.1365-294X.2012.05577.x. [DOI] [PubMed] [Google Scholar]
- 8.Ypma RJF, Bataille AMA, Stegeman A, Koch G, Wallinga J, van Ballegooijen WM. Unravelling transmission trees of infectious diseases by combining genetic and epidemiological data. Proceedings of the Royal Society B: Biological Sciences. 2012;279 (1728):444–450. doi: 10.1098/rspb.2011.0913. [DOI] [PMC free article] [PubMed] [Google Scholar]
- 9.Ypma RJF, van Ballegooijen WM, Wallinga J. Relating Phylogenetic Trees to Transmission Trees of Infectious Disease Outbreaks. Genetics. 2013 doi: 10.1534/genetics.113.154856. [DOI] [PMC free article] [PubMed] [Google Scholar]
- 10.WHO. Cumulative number of confirmed human cases for avian influenza A (H5N1) reported to WHO, 2003–2013 2013 [Google Scholar]
- 11.Abdelwhab E, Hafez H. An overview of the epidemic of highly pathogenic H5N1 avian influenza virus in Egypt: epidemiology and control challenges. Epidemiology & Infection. 2011;139 (05):647–657. doi: 10.1017/S0950268810003122. [DOI] [PubMed] [Google Scholar]
- 12.Abdelwhab EM, Selim AA, Arafa A, Galal S, Kilany WH, Hassan MK, Aly MM, Hafez MH. Circulation of Avian Influenza H5N1 in Live Bird Markets in Egypt. Avian Diseases. 2010;54 (2):911–914. doi: 10.1637/9099-100809-RESNOTE.1. [DOI] [PubMed] [Google Scholar]
- 13.WHO. Continued evolution of highly pathogenic avian influenza A (H5N1): updated nomenclature. Influenza and Other Respiratory Viruses. 2012;6 (1):1–5. doi: 10.1111/j.1750-2659.2011.00298.x. [DOI] [PMC free article] [PubMed] [Google Scholar]
- 14.Beard R, Magee D, Suchard MA, Lemey P, Scotch M. Generalized Linear Models for Identifying Predictors of the Evolutionary Diffusion of Viruses. Paper presented at the 2014 Joint Summits on Translational Science; San Francisco, CA. 2013. [PMC free article] [PubMed] [Google Scholar]
- 15.Scotch M, Mei C, Makonnen Y, Pinto J, Ali A, Vegso S, Kane M, Sarkar I, Rabinowitz P. Phylogeography of influenza a H5N1 clade 2.2.1.1 in Egypt. BMC Genomics. 2013;14 (1):871. doi: 10.1186/1471-2164-14-871. [DOI] [PMC free article] [PubMed] [Google Scholar]
- 16.Lemey P, Rambaut A, Bedford T, Faria N, Bielejec F, Baele G, Russell CA, Smith DJ, Pybus OG, Brockmann D, Suchard MA. Unifying Viral Genetics and Human Transportation Data to Predict the Global Transmission Dynamics of Human Influenza H3N2. PLoS Pathog. 2014;10 (2):e1003932. doi: 10.1371/journal.ppat.1003932. [DOI] [PMC free article] [PubMed] [Google Scholar]
- 17.Lemey P, Rambaut A, Bedford T, Faria NR, Bielejec F, Baele G, Russell C, Smith D, Pybus O, Brockmann D, Suchard MA. The seasonal flight of influenza: a unified framework for spatiotemporal hypothesis testing. 2012 arXiv:12105877v1. doi:10.1371/
- 18.Kuo L, Mallick B. Variable Selection for Regression Models. Sankhya. 1998;60 (1):65–81. [Google Scholar]
- 19.Chipman H, George E, McCulloch R. BART: Bayesian Additive Regression Trees. The Annals of Applied Statistics. 2010;4 (1):266–298. [Google Scholar]
- 20.Drummond AJ, Suchard MA, Xie D, Rambaut A. Bayesian Phylogenetics with BEAUti and the BEAST 1.7. Molecular Biology and Evolution. 2012;29 (8):1969–1973. doi: 10.1093/molbev/mss075. [DOI] [PMC free article] [PubMed] [Google Scholar]
- 21.Ayres DL, Darling A, Zwickl DJ, Beerli P, Holder MT, Lewis PO, Huelsenbeck JP, Ronquist F, Swofford DL, Cummings MP, Rambaut A, Suchard MA. BEAGLE: An Application Programming Interface and High-Performance Computing Library for Statistical Phylogenetics. Systematic Biology. 2012;61 (1):170–173. doi: 10.1093/sysbio/syr100. [DOI] [PMC free article] [PubMed] [Google Scholar]
- 22.CAPMAS (2012 est) Statistical Tables for Population at Governorate Level.
- 23.FAOSTAT. [Accessed 2014 21 July];2014 http://faostat3.fao.org/faostat-gateway/go/to/home/E.
- 24.Global Livestock Production and Health Atlas. [Accessed 2014 Jul 21];2014 http://kids.fao.org/glipha/index.html.
- 25.Yoon S-W, Kayali G, Ali MA, Webster RG, Webby RJ, Ducatez MF. A Single Amino Acid at the Hemagglutinin Cleavage Site Contributes to the Pathogenicity but Not the Transmission of Egyptian Highly Pathogenic H5N1 Influenza Virus in Chickens. Journal of Virology. 2013;87 (8):4786–4788. doi: 10.1128/jvi.03551-12. [DOI] [PMC free article] [PubMed] [Google Scholar]
- 26.NOAA. [Accessed 21 July 2014];National Climatic Data Center. 2014 http://www.ncdc.noaa.gov/
- 27.WMO. [Accessed 21 July 2014];Climate Data and Data Related Products. 2013 http://www.wmo.int/pages/themes/climate/climate_data_and_products.php.
- 28.Beerli P, Felsenstein J. Maximum likelihood estimation of a migration matrix and effective population sizes in n subpopulations by using a coalescent approach. Proc Natl Acad Sci U S A. 2001;98 (8):4563–4568. doi: 10.1073/pnas.081068098. [DOI] [PMC free article] [PubMed] [Google Scholar]
- 29.Streicker DG, Turmelle AS, Vonhof MJ, Kuzmin IV, McCracken GF, Rupprecht CE. Host phylogeny constrains cross-species emergence and establishment of rabies virus in bats. Science. 2010;329 (5992):676–679. doi: 10.1126/science.1188836. [DOI] [PubMed] [Google Scholar]
- 30.Faria NR, Suchard MA, Rambaut A, Streicker DG, Lemey P. Simultaneously reconstructing viral cross-species transmission history and identifying the underlying constraints. Philos Trans R Soc Lond B Biol Sci. 2013;368 (1614):20120196. doi: 10.1098/rstb.2012.0196. [DOI] [PMC free article] [PubMed] [Google Scholar]
- 31.Bouma A, Claassen I, Natih K, Klinkenberg D, Donnelly CA, Koch G, van Boven M. Estimation of Transmission Parameters of H5N1 Avian Influenza Virus in Chickens. PLoS Pathog. 2009;5 (1):e1000281. doi: 10.1371/journal.ppat.1000281. [DOI] [PMC free article] [PubMed] [Google Scholar]
- 32.Suchard MA, Weiss RE, Sinsheimer JS. Models for Estimating Bayes Factors with Applications to Phylogeny and Tests of Monophyly. Biometrics. 2005;61 (3):665–673. doi: 10.1111/j.1541-0420.2005.00352.x. [DOI] [PubMed] [Google Scholar]
- 33.Lemey P, Rambaut A, Drummond AJ, Suchard MA. Bayesian Phylogeography Finds Its Roots. PLoS Comput Biol. 2009;5 (9):e1000520. doi: 10.1371/journal.pcbi.1000520. [DOI] [PMC free article] [PubMed] [Google Scholar]
- 34.Kass RE, Raftery AE. Bayes factors. Journal of the american statistical association. 1995;90 (430):773–795. [Google Scholar]
- 35.Drummond A, Suchard M. Bayesian random local clocks, or one rate to rule them all. BMC Biology. 2010;8 (1):114. doi: 10.1186/1741-7007-8-114. [DOI] [PMC free article] [PubMed] [Google Scholar]
- 36.He D, Dushoff J, Eftimie R, Earn DJD. Patterns of spread of influenza A in Canada. Proceedings of the Royal Society B: Biological Sciences. 2013;280(1770) doi: 10.1098/rspb.2013.1174. [DOI] [PMC free article] [PubMed] [Google Scholar]
- 37.Canada S. [Accessed December 18 2013];Population Estimate. 2013 http://www.statcan.gc.ca/start-debut-eng.html.
- 38.Egypt CAfPMaS. [Accessed Sep 26 2013];Arab Republic of Egypt. 2012 http://www.citypopulation.de/Egypt.html.
- 39.Ahmed SSU, Ersbøll AK, Biswas PK, Christensen JP, Hannan ASMA, Toft N. Ecological Determinants of Highly Pathogenic Avian Influenza (H5N1) Outbreaks in Bangladesh. PLoS ONE. 2012;7 (3):e33938. doi: 10.1371/journal.pone.0033938. [DOI] [PMC free article] [PubMed] [Google Scholar]
- 40.Dolberg F. Poultry sector country review. Bangladesh: Food and Agricultural Organization of the United Nations; 2009. [Google Scholar]
- 41.Loth L, Gilbert M, Wu J, Czarnecki C, Hidayat M, Xiao X. Identifying risk factors of highly pathogenic avian influenza (H5N1 subtype) in Indonesia. Preventive Veterinary Medicine. 2011;102 (1):50–58. doi: 10.1016/j.prevetmed.2011.06.006. http://dx.doi.org/10.1016/j.prevetmed.2011.06.006. [DOI] [PMC free article] [PubMed] [Google Scholar]
- 42.Pfeiffer DU, Minh PQ, Martin V, Epprecht M, Otte MJ. An analysis of the spatial and temporal patterns of highly pathogenic avian influenza occurrence in Vietnam using national surveillance data. The Veterinary Journal. 2007;174 (2):302–309. doi: 10.1016/j.tvjl.2007.05.010. http://dx.doi.org/10.1016/j.tvjl.2007.05.010. [DOI] [PubMed] [Google Scholar]
- 43.Gilbert M, Xiao X, Pfeiffer DU, Epprecht M, Boles S, Czarnecki C, Chaitaweesub P, Kalpravidh W, Minh PQ, Otte MJ, Martin V, Slingenbergh J. Mapping H5N1 highly pathogenic avian influenza risk in Southeast Asia. Proceedings of the National Academy of Sciences. 2008;105 (12):4769–4774. doi: 10.1073/pnas.0710581105. [DOI] [PMC free article] [PubMed] [Google Scholar]
- 44.Si Y, de Boer WF, Gong P. Different Environmental Drivers of Highly Pathogenic Avian Influenza H5N1 Outbreaks in Poultry and Wild Birds. PLoS ONE. 2013;8 (1):e53362. doi: 10.1371/journal.pone.0053362. [DOI] [PMC free article] [PubMed] [Google Scholar]
- 45.Grenfell BT, Pybus OG, Gog JR, Wood JLN, Daly JM, Mumford JA, Holmes EC. Unifying the Epidemiological and Evolutionary Dynamics of Pathogens. Science. 2004;303 (5656):327–332. doi: 10.1126/science.1090727. [DOI] [PubMed] [Google Scholar]