

Abstract
Human islet β-cells exploit an autocrine dopamine (DA)-mediated inhibitory circuit to regulate insulin secretion. β-Cells also express the DA active transporter and the large neutral amino acid transporter heterodimer enabling them to import circulating DA or its biosynthetic precursor, L-3,4-dihydroxyphenylalanine (L-DOPA). The capacity to import DA or L-DOPA from the extracellular space possibly indicates that DA may be an endocrine signal as well. In humans, a mixed meal stimulus is accompanied by contemporary serum excursions of incretins, DA and L-DOPA, suggesting that DA may act as an anti-incretin as postulated by the foregut hypothesis proposed to explain the early effects of bariatric surgery on type 2 diabetes. In this report, we take a translational step backwards and characterize the kinetics of plasma DA and incretin production after a mixed meal challenge in a rat model and study the integration of incretin and DA signaling at the biochemical level in a rodent β-cell line and islets. We found that there are similar excursions of incretins and DA in rats, as those reported in humans, after a mixed meal challenge and that DA counters incretin enhanced glucose-stimulated insulin secretion and intracellular signaling at multiple points from dampening calcium fluxes to inhibiting proliferation as well as apoptosis. Our data suggest that DA is an important regulator of insulin secretion and may represent 1 axis of a gut level circuit of glucose and β-cell mass homeostasis.
Bariatric, or metabolic surgery appears to be an effective treatment for obesity (1) and its related comorbidity, type 2 diabetes (T2D) (reviewed in Ref. 2). Over a decade ago, Pories et al (3) published the results of a 10-year follow-up on the effects of bariatric surgery in T2D showing reversal of hyperglycemia in 83% of patients. Although improved insulin sensitivity, due to weight loss and decrease in fat mass, is now known to be significant contributors to the reversal of diabetes, these factors alone do not fully account for the efficacy of specific types of metabolic surgery. Improved β-cell function (4), as well as rapid reversal of hyperglycemia, in the absence of significant weight loss, has been observed (5–7), suggesting that weight loss-independent mechanisms are at work. To account for these clinical observations, several hypotheses have been advanced, including the foregut and hindgut hypotheses (reviewed by Rubino et al [8]), to explain the effects of bariatric surgery on T2D. Briefly, the hindgut hypothesis, posits that nutrient delivery to the distal intestine results in the secretion of “incretins,” which enhances insulin release and/or action. Although not mutually exclusive, the foregut hypothesis, proposes that gastrointestinal bypass reduces the secretion of upper gastrointestinal factors that normally defend against hypoglycemia (1) and antagonizes the effects of incretins by decreasing insulin secretion and/or promote insulin resistance.
Recently, we provided evidence that dopamine (DA) mediates a glucose-stimulated insulin secretion (GSIS) inhibitory circuit in human β-cells (9). The principle findings of these studies were 1) within the human pancreas, DA D2-like receptors (D2Rs) are expressed almost exclusively by β-cells and D2R colocalizes with insulin within vesicles; 2) inhibition of the vesicular monoamine transporter type 2 (VMAT2) by tetrabenazine (TBZ), antagonism of D2R, or inhibition of DA active transporter (DAT), all enhance human islet GSIS in vitro; 3) both TBZ and DAT inhibitors depleted islet tissue of their DA content; 4) human islets secreted DA in a glucose concentration-dependent manner and DA release was coincident with insulin release; 5) β-cells, via DAT, transported radiolabeled DA intracellularly; and 6) pancreatic islets selectively express the large neutral amino acid transporter heterodimer (LAT1/MDU1) system responsible for transport of L-3,4-dihydroxyphenylalanine (L-DOPA). A similar report using a rodent model has been published by Ustione and Piston (10).
Based on this data and previous studies (11), we hypothesized (12) the existence of a second layer of glucose homeostasis, with endocrine signaling originating in the gut where upon mixed meal stimulation; 1) DA and L-DOPA produced in the gut travel via the circulation to the β-cells; 2) L-DOPA, imported via the LAT1/MDU1 amino acid carrier, is transformed to DA (by DOPA decarboxylase) in the β-cells (13); 3) DA is taken up by DAT in the β-cells (9); 4) DA at the concentrations found in peripheral circulation does not inhibit secretion (9); until 5) L-DOPA is transformed into DA or extracellular DA is transported by DAT and concentrated by the actions of VMAT2 for vesicular storage and release in high concentration near D2R similar to that reported for the synapse. The local concentration of DA at the synapse has been estimated to be about 100μM–0.5μM within a 5-μm radius from the release site (14). The insulin granules also contain D2R (13). During GSIS, DA and insulin are released and D2R is delivered to the cell surface, where it binds DA. DA signaling through D2R is a powerful inhibitor of glucose-dependent insulin secretion (9, 10, 13, 15, 16).
The concept that DA might represent an anti-incretin seems plausible given that the foregut (including the stomach) is the major source of circulating DA (17, 18). Tyrosine hydroxylase, the rate-limiting DA biosynthetic enzyme (19), is expressed in parietal cells, Lieberkühn crypts, ileal epithelial cells, and throughout the lamina propria of the small intestines and VMAT1, responsible for transport of serotonin (5-HT) or DA into storage vesicles, is expressed by enterochromaffin cells and the parietal cells of the oxyntic stomach (17, 20, 21). After ingestion of a standard mixed meal (ie, mixed meal tolerance testing [MMTT]), healthy human volunteers show significantly increased plasma levels of L-DOPA and DA (22, 23). The kinetics of DA production or release coincides with the postprandial rise and fall of immunoreactive GLP-1 plasma levels also observed after a mixed meal challenge in man (24). These postprandial arterial DA and L-DOPA excursions (up to 15 nmol/L) could represent a source of “anti-incretin” for the regulation of β-cell insulin secretion, given the ability of β-cells to take-up DA (and L-DOPA) and concentrate DA for vesicular release. The coincidence of the kinetics of release of GLP-1 and DA suggests the existence of a second (gut-based) layer of regulation of glucose homeostasis. In this report we revisit the kinetics of DA and incretin levels after a mixed meal challenge in a rat model and characterize the opposing actions of DA and the incretins, GLP-1 and gastric inhibitory polypeptide, or glucose-dependent insulinotropic polypeptide (GIP), at the biochemical level in a rat β-cell line. These studies represent intermediate steps in testing the hypothesis of the existence of a gut level incretin-anti-incretin glucose homeostatic circuit.
Materials and Methods
Drugs, peptides, and chemicals
DA hydrochloride, L-DOPA, Ropinirole hydrochloride, tolbutamide, forskolin, 3-isobutyl-1-methylxanthine (IBMX), thapsigarin, and D-glucose were obtained from Sigma-Aldrich Corp. TBZ was obtained from the National Institute of Mental Health's Chemical Synthesis and Drug Supply Program. Somatostatin (SST-14), GLP-1 (7–37), and GIP (rat) were obtained from Anaspec. All other chemicals were of the highest commercial quality available.
Human islet culture
Human islets isolated from cadaveric nondiabetic donors were obtained from the Integrated Islet Distribution Program (City of Hope National Medical Center). The average purity of islets was 88 ± 10% (SEM), the average age of the donors (n = 6) was 36 ± 10 years (SEM). The isolated human islets were normally cultured in supplemented CMRL-1066 media for no longer than 2 days before being shipped. Islets used in these analyses were cultured for at least 24 hours, but for no longer than 5 days. On arrival, islets were placed in CMRL-1066 medium containing 5.5mM glucose, 10% fetal bovine serum (FBS), 100-U/mL penicillin, and 100-μg/mL streptomycin and incubated at 37°C with 5% CO2. All cell culture media and supplements were obtained from Life Technologies. Tissue culture plates were obtained from Falconware (Becton-Dickinson, Inc) or Corning. All experiments with human islets were approved as exempted human research by our Institutional Review Board.
INS-1E cultures
The clonal β-cell line INS-1E, a kind gift of Dr Maechler, has been fully described (25) and was cultured in RPMI 1640 supplemented with 7.5% heat inactivated FBS, 1mM sodium pyruvate, 50μM 2-mercaptoethanol, 2mM glutamine, 10mM HEPES, 100-U/mL penicillin, and 100-μg/mL streptomycin. Maintenance cultures were passaged once a week by trypsinization, followed by seeding cells at a density of 4 × 10⁴ cells/cm2, in 100-cm2 Corning low profile flasks (Corning) with 25-mL complete medium. For most experiments, INS-1E were seeded at 0.5–1.0 × 10⁵ cells/mL in flasks incubated at 37°C in a humid 5% CO2 atmosphere and the medium changed every 3 days until the population reached 80% confluence. Cells were used within the 68th to 90th passage.
Insulin secretion assay from human islet tissue and rodent β-cell line INS-1E
For static incubation experiments, pools of human islets (eg, islets from 3 donors admixed 1:1:1) were washed once in a HEPES-buffered salt solution (HBSS) (114mM NaCl, 4.7mM KCl, 1.2mM KH2PO4, 2.5mM CaCl2, 1.2mM MgSO4, 26mM NaHCO3, and 20mM HEPES; final pH 7.4) supplemented with 0.01% (wt/vol) serum albumin, preheated to 37°C, and then preincubated for 1 hour in HBSS with 3.0mM glucose (basal conditions). Islets were washed again in HBSS and seeded into transwell inserts (polyester membrane, 6.5 mm in diameter, 3.0-μm pore size; Costar) placed in 24-well tissue culture plates at 200–1000 islets/mL × 0.3 mL/well in HBSS. The wells of the plate were prefilled with an equal volume of HBSS. Solutions containing the indicated drug and/or glucose were prepared at twice the indicated concentration in HBSS and added into the insert and the outer well to achieve a 1× concentration. Islets were incubated for 1 hour at 37°C, at which time the outer well was sampled for measurements of insulin concentration. The contents of the inserts were harvested, lysed in SDS and diluted in Tris-EDTA buffer for measurements of DNA concentration by the Quantifluor dsDNA system (Promega). Measurements of the fluorescent product were made using a Biotek Synergy 2 multiplate reader.
For experiments with INS-1E cells (grown in 100-cm2 low profile flasks or 6-well trays), approximately 12 hours before initiation, cultures received fresh serum-starved medium (heat inactivated FBS replaced with 0.1% bovine serum albumin) that contained 3mM glucose. Next, the serum-starved medium was replaced with HBSS with no glucose and 0.01% BSA and incubated for 45 minutes. In experiments with L-DOPA and TBZ, the serum-starved medium was replaced with HBSS with no glucose and 0.01% BSA, L-DOPA, and/or TBZ and incubated for 90 minutes. At the beginning of the experiment, the no glucose HBSS was replaced with 25 mL of HBSS supplemented with varying concentrations of glucose (2.5mM–18mM), GLP-1 (0nM–20nM), or GIP (0nM–20nM), SST-14 (1μM), forskolin (10μM), IBMX (10μM), and/or DA (0μM–100μM), or Ropinarole (100μM–200μM). Cells were then incubated for indicated amount of time after which, the culture media (HBSS) was harvested, spun at 3000g at 4°C for 10 minutes and stored at −80°C until analyzed for insulin concentration. The cell monolayers were lysed and then processed for protein concentration measurements, DNA content as described above for islets, Western blotting, and/or antiphosphoprotein antibody arrays.
Measurement of calcium signals with fluorescent dyes and cAMP
INS-1E cells were grown as described (25) in 48-well trays. When cells reached approximately 80% confluence, the medium was removed and washed in HBSS. For intracellular calcium ([Ca2+]i) measurements, cells were then incubated in HBSS without glucose containing 0.01% BSA, 1mM probenecid, and 5μM fluorescent dye fluo-4 AM (Molecular Probes, Invitrogen) with Plurionic Acid for 60 minutes as per the manufactures recommendations. The cells were washed with warm Ringers buffer without glucose and containing 0.5% BSA and 1mM probenecid. Replicate wells (n = 6) were then quickly brought to 60mM KCL or the indicated concentrations of glucose, GLP-1, and/or DA by the addition of concentrated stock solutions. The [Ca2+]i release was monitored at 37°C by serially measuring cytoplasmic Fluo-4 emissions at 520 ± 05 nm (excited at 488 nm) within the well using a Biotek Synergy 2 multiplate reader (26). Free cytoplasmic Ca2+ evoked by each treatment is shown as fluorescence values at each time point (every 3 s, 0.7 s scan/well) where F520 nm = (Ft − Fo)/(Fmax − Fmin). Fmax was obtained from the highest fluorescent value returned when cells were incubated in 60mM KCL. Background fluorescence (Fmin) was obtained at the end of the experiment when wells were treated with Triton X-100 (5%) and MnCl2.
For measurements of intracellular cAMP, cells grown in the 48-well trays were incubated at 37°C for 60 minutes in HBSS without glucose and 0.01% BSA. After which, the medium was replaced with HBSS with 10μM IBMX and the indicated concentrations of glucose, GLP-1, GIP, forskolin (10μM), and/or DA for 30 minutes. After the stimulation period the INS-1E monolayers were analyzed for intracellular cAMP concentrations using the Cyclic AMP XP Chemiluminescent Assay kit (Cell Signaling Technology) according to the manufacturer's instructions. Luminescence measurements were made in Biotek Synergy 2 microplate reader.
AKT signaling antibody array
The PathScan AKT Signaling Antibody Array kit (Chemiluminescent Readout; Cell Signaling Technologies) uses a sandwich immunoassay principle where target-specific capture antibodies have been spotted in duplicate onto nitrocellulose-coated glass slides. The array allows for the simultaneous detection of 16 phosphorylated proteins predominantly belonging to the AKT signaling network. Cell lysates were prepared from INS-1E cells as described above using the kit reagents and incubated (1-μg/well total protein) on the slide followed by a biotinylated detection antibody cocktail. The bound antibodies were then detected and quantified with streptavidin-conjugated HRP and electrochemiluminescence according to the manufactures' instructions. The slides were then imaged with a Fluorchem M instrument and the intensity of the spots determined using Alphaview software (all from Proteinsimple).
Western blot analysis
INS-1E monolayers (∼100 cm2) were lysed in approximated 1-mL cold M-PER lysis buffer containing Halt protease and phosphatase cocktail (all from Pierce-Thermo Scientific). Flasks were incubated for 15 minutes with rocking at 4°C and the lysates harvested and cleared by centrifugation at 14 000g for 15 minutes at 4° C. The protein concentration in the lysates was determined by the Pierce BCA kit and the lysates stored at −80°C until use. Lysates were cleared for use after confirmation of the expected pattern of insulin secretion in the monolayer supernatants. Lysates were adjusted to equal concentrations of protein (usually between 0.5 and 1.5 μg/μL) with lysis buffer. Samples were separated on SDS-PAGE Bis-Tris gels (4%–12%) (Life Technologies) and electroblotted onto nitrocellulose membranes. Membranes were block and probed using phosphoprotein-specific antibodies (Supplemental Table 1) and the protocol recommendations from Cell Signaling Technology. Immunoreactive bands were visualized by enhanced chemiluminescence using horseradish peroxidase-conjugated IgG secondary antibodies and substrate from Pierce (SuperSignal Western Blotting kits; Thermo Scientific). For quantification of band density, blots were imaged on the Fluorchem M instrument and the digitized blots were quantitatively analyzed with Alphaview software. All intensity measurements remained within the dynamic range of the instrument.
Proliferation assays
INS-1E cells were plated at a starting density of 1 × 10⁴ cells/well in a 48-well tray in complete media as described above. After 24 hours, the media were exchanged for complete RPMI 1640 media (5% FBS) without phenol Red supplemented with GLP-1 (7–36) (0nM–40nM), GIP (0nM–40nM), and/or DA (0μM–100μM) as indicated. Trays were incubated at 37°C, and media were replaced every 3 days until day 9, when the cell content of each well as estimated by a 3-(4,5-dimethylthiazol-2-yl)-2,5-diphenyltetrazolium bromide (MTT) assay using the protocol and reagents provided by Life Technologies (Vybrant MTT Cell Proliferation Assay kit). Absorbance measurements (570 nm) of the formazan product were made in Biotek Synergy 2 microplate reader. For the tritiated thymidine incorporation assay, cells were plated 5 × 10³ cells/well in 96-well plates. After 24 hours, the media were exchanged for complete RPMI 1640 media supplemented with GLP-1 (7–36) (0nM–40nM), GIP (0nM–40nM), and/or DA (0μM–100μM) as indicated. Media were replaced every 2 days until day 6. During the last 18 hours of culture, 1.0 μCi/well of 3H-thymidine was added to the cultures (thymidine, [methyl-3H]-, specific activity: 740GBq/mmol, >97%; PerkinElmer). Cell contents were harvested onto glass fiber filter paper, washed, and counted in a dedicated scintillation counter.
To determine the effects of DA on normal β-cell proliferation, islets from C57Bl/6J (Charles River) mice were isolated, dispersed, and plated as previously described (27). The next day, the islet culture media were replaced with medium containing 3mM or 15mM glucose and the indicated concentrations of GLP-1, DA or vehicle. Twenty-four hours later, islet cells were fixed and stained for insulin and Ki67 as previously described (27). An average of 2300 β-cells were counted per experimental condition.
Animals
Male Sprague Dawley rats weighing 200–250 g were purchased from Harlan Industries and housed in pairs in cages at a constant temperature of 21°C–23°C with a 12-hour light, 12-hour dark cycle (lights on 7 am, off at 7 pm). Rats were acclimatized for at least 1 week after receipt from the vendor, during this period and throughout the experimental period; animals were handled approximately 1 hour per day. Rats were given ad libitum access to water and normal laboratory chow (kilocalorie percent: 58% carbohydrate, 13.5% fat, and 28.5% protein, no. 5001; Purina LabDiet). For the MMTT, liquid Ensure (kilocalorie percent: 64% carbohydrate, 21.6% fat, 14.4% protein; Abbott Laboratories) was used. During acclimatization some rats were trained to take Ensure from a plastic syringe tip. All protocols in this study were approved by the Institutional Animal Care and Use Committee at Columbia University Medical Center or the Icahn School of Medicine at Mount Sinai in accordance with guidelines established by the National Institutes of Health.
Mixed meal tolerance testing
Overnight fasted rats were anesthetized (5%–1.5% isoflurane in O2 at 1.0–0.8 L/min), ocular ointment applied, given 1.0-mL warmed sterile normal saline (SQ), maintained supine and warm on a 35°C surface throughout the procedure. To initiate the MMTT, rats were gavaged with 2-mL Ensure or normal saline. In some experiments, unanaesthetized fasting rats were offered 2 mL of Ensure in a plastic syringe. Rats would not consume normal saline ad libitum. Once these rats had consumed the Ensure (1.5–2 mL in 5 min), the rats were anesthetized and blood sampling initiated. In some experiments, rats received an ip glucose challenge as previously described (11). Venous blood was sampled (∼300 μL) from the tail at the indicated times (15- to 20-min intervals) beginning before or directly (as indicated) after the application of the mixed meal and extending to 120 minutes after the mixed meal. Whole blood was transferred into microcentrifuge tubes containing a protease inhibitor cocktail and dipeptidyl-peptidase-IV inhibitor (Sigma), to prevent degradation of peptide hormones. Tubes were spun at 2000 rpm for 10 minutes, and plasma was collected and stored at −80°C until analysis.
Glucose measurements and peptide hormone, catecholamine, and cAMP immunoassays
Glucose concentrations were measured in whole blood using the AlphaTrak system (Abbott Laboratories). Plasma insulin, GIP, GLP-1, DA, and epinephrine were measured in duplicate samples using enzyme immunoassays for rat insulin (ALPCO), GIP, GLP-1 (7–36) (both from Millipore), or enzyme immunoassays for DA or epinephrine (Rocky Mountain Diagnostics) according to the manufactures instructions. For the in vitro assay of insulin in INS-1E and human islets supernatants, we used the AlphaLisa (PerkinElmer) homogenous immunoassay technique. The absorbance measurements for the ELISA assays or the time-resolved fluorescence measurements of insulin reporter complex in the AlphaLisa assay were made in Biotek Synergy 2 microplate reader. The sensitivity for each analyte as indicated by the manufacturer were as follows: 20-pg/mL epinephrine, 25-pg/mL DA, 0.2-ng/mL insulin (ELISA), 26-pg/mL insulin (AlphaLisa), 8.2-pg/mL rat GIP, and 2pM GLP-1 (7–36). The intraassay coefficients of variation were: 5.4% rat insulin (ELISA), 2.9% rat insulin (AlphaLisa), 5.6% rat GIP, 6% GLP-1, 9.5% DA, and 11% epinephrine.
In vitro caspase 3/7 activity assay
Briefly, INS-1E cells established in culture were incubated for 24 hours in RPMI 1640 incubation medium with 0.5% FBS and 0.5% BSA at 5mM glucose with or without the indicated concentrations of thapsigarin, GLP-1 (7–36), and DA (28). At the end of the incubation period, both adherent and unattached cells were then harvested and combined. After sedimentation at 500g for 10 minutes, the cells were washed twice with ice-cold PBS, lysed in 25mM HEPES (pH 7.4), 5mM MgCl2, 1mM EGTA, 1mM PMSF, 10-μg/mL pepstatin, and 10-μg/mL leupeptin. Suspensions were briefly sonicated and centrifuged (15 min, 14 800g, 4° C) to remove debris. The protein concentration in the lysate was determined by the BCA protein quantification kit (Pierce) and then adjusted to 1 μg/μL. The samples were brought to 1mM DTT and then frozen at −70°C until use (29). Twenty-five micrograms of protein were then assayed with the Apo-ONE homogeneous Caspase-3/7 kit (Promega). The Apo-ONE Homogeneous Caspase-3/7 Assay provides a profluorescent substrate with an optimized buffer for Caspase-3/7 (DEVDase) activity. Fluorescence was analyzed using a the Biotek Synergy 2 multiplate reader in a kinetic fluorescence mode using an excitation filter of 460 nm (40-nm bandpass) and an emission filter of 520 nm (10-nm bandpass). The reaction was allowed to proceed for 45 minutes at 37°C with fluorescence measurements taken every 2 minutes. Caspase-3/7 activities were obtained by calculating the maximum slope of the reaction over a 45-minute reading period and reporting the slope for each condition (30).
Statistical analyses
Data are presented as the mean ± 1 SEM. The significance of comparisons (P values) of statistical means were calculated using the 2-tailed Student's t test. P < .05 were considered statistically significant. For the analysis of the phosphoprotein arrays, the average intensity measurements for each spot on the arrays were exported to Excel and the data analyzed by BRB-array tools software suite developed by Dr Richard Simon and BRB-ArrayTools Development Team. The maximum intensity within the linear range of the Fluorchem M instrument is less than 60 000 relative luminescence units, the dataset was first filtered to eliminate all luminescence values laying outside the range of 50–50 000 relative luminescence units and the replicate data points were averaged. Next, the dataset was normalized to the median array, a dataset calculated by the software suite, and filtered to remove all phosphoproteins luminescence values where less than 5% of the intensity values had less than 1.2-fold change in either direction from the phosphoproteins median intensity. The log-transformed dataset of phosphoprotein intensities and experimental conditions was then analyzed by hierarchical complete linkage clustering using median centering and correlation as the similarity metric.
Results and Discussion
Contemporary DA and incretin plasma excursions follow a mixed meal challenge in a rat model
Separate reports in man demonstrated coincident or nearly so serum excursions of DA (peak 0.3nM), L-DOPA (peak 12nM), GLP-1, and GIP incretins after a mixed meal challenge. We took a translational backward step and examined the time vs concentration profile of plasma DA together with those of GLP-1 and GIP after a mixed meal stimulus in a Sprague-Dawley rat model (6–8 wk old) (Figure 1, A–F). Rats were gavaged with (or trained to consume P.O.) a mixed meal (Ensure) or normal saline, followed by serial venous blood sampling. Similar to man, after a mixed meal challenge, there were overlapping increases in both plasma DA and GIP (Figure 1, A and B or D and E). Similarly, as expected, we observed increases in plasma glucose and insulin coincident (Figure 1, C and F), or nearly so, with the DA and GIP excursions. The measured peak DA concentrations after the mixed meal averaged about 950 ± 80pM (mean ± SEM at 30 min) (Figure 1A) in gavaged rats and 1750 ± 220pM (at 60 min) (Figure 1D) in rats given the mixed meal ad libitum P.O. The plasma DA concentrations in rats gavaged with normal saline remained under 250 ± 45pM throughout the sampling period. The peak GIP concentrations averaged 275 ± 50 pg/mL (at 15–45 min) in gavaged rats and 80 ± 25 pg/mL (at 75 min) in rats given the mixed meal ad libitum. Similar to sham operated rodents in Roux-en-Y-gastric bypass (RYGB) experiments (31), in our normal rodents, there was only a moderate increase in GLP-1 concentrations during the mixed meal test. Significant GLP-1 excursions however, have been reported to occur in rats after RYGB (31). Rats gavaged with normal saline maintained a plasma GIP level below 30 ± 25 pg/mL throughout the sampling period. Because epinephrine also regulates β-cell insulin secretion (32) and is released by stressed rodents (33), we measured plasma epinephrine concentrations in serial plasma samples obtained from rats fed the mixed meal ad libitum. Plasma epinephrine concentrations remained constant below 160 ± 43 pg/mL throughout the sampling period after the mixed meal or normal saline gavage (data not shown). During I.P. glucose tolerance testing, we did not observe a reproducible change in plasma DA levels above the basal levels measured after a saline gavage (data not shown). These data demonstrate that there are similar DA and incretin excursions in rats as those reported for humans after a mixed meal challenge.
Figure 1.

Mixed meal challenge evokes concurrent excursion of plasma DA and incretin. A, Anesthetized Sprague Dawley rats were gavaged with Ensure mixed meal (filled symbols) or saline (open symbols), and serial samples of blood were drawn for measurements of DA (circles), glucose (squares), (B) measurements of GIP (diamonds) in serial samples, or (C) measurements of insulin (circles) or glucose (triangles). Measurements in A and D were performed in different experiments than those shown in B and C or E and F (performed in the same sample set), because DA measurements required a large sample volume. D, The mixed meal was offered to rodents P.O. Once the meal was consumed, the rodents were anesthetized, and serial measurements of DA (filled circles) or glucose (filled squares) were made in the collected plasma. E and F, The mixed meal was offered to rodents P.O. Once the meal was consumed, the rodents were anesthetized, and serial measurements of GLP-1 (filled squares), GIP (filled diamonds), glucose (filled circles), or insulin (filled triangles) were made in the collected plasma. Error bars represent SEM from measurements made in 4 or more rats. Mean peak excursion values for the mixed meal challenges were significantly different (P < .05) from their corresponding time values for the saline challenge by Student's t testing.
Opposing actions of incretins and DA regulate in vitro insulin secretion
The in vitro inhibitory action of DA on GSIS on both human and rodent islets, rodent β-cell lines is well documented, as is the parallel action of epinephrine (32). Because there are coincident excursions of incretins and DA in vivo follow a mixed meal and this inhibitory action may be involved in the changes in glucose homeostasis after RYGB, we examined the in vitro activity DA on GLP-1 and GIP enhanced GSIS in human islets and the INS-1E rat β-cell line. As expected, DA at a range of concentrations (10−4M to 10−8M) opposed incretin enhanced GSIS by human islets and INS-1E cells (Figures 2 and 3). Because there are also excursions of L-DOPA in humans after a mixed meal, we tested in vitro the effects of exogenous L-DOPA on GSIS in INS-1E cells. We found that L-DOPA (50μM) significantly inhibited GSIS and GLP-1 enhanced GSIS. Furthermore, the inhibition of GSIS by L-DOPA was dependent on the action of the VMAT2 as demonstrated by the reversal of DA inhibition of GSIS by TBZ, a VMAT2 inhibitor (Figure 4). These observations are consistent with the conversion of L-DOPA to DA by β-cell aromatic L-amino acid decarboxylase (13) and the known action of VMAT2 in the transport of cytoplasmic DA into vesicles for sequestration and later delivery to extracellular compartment upon exocytosis (9). These experiments demonstrate that DA opposes the action of incretins during in vitro GSIS and that L-DOPA inhibits GSIS in manner similar to DA, arguably via its transformation into DA and VMAT2-mediated vesicular storage.
Figure 2.

Measurement of incretin enhanced GSIS in human islets in the presence of DA. Static incubation experiments were performed in pools of islets from 3 donors (mixed 1:1:1) in. Each pool was tested against 3.0mM glucose, 15mM glucose, and 15mM glucose with indicated concentration of incretin and/or DA in replicate wells (n = 6). After a 1-hour incubation, the insulin concentration in the buffer beyond the transwell membrane for each well was determined and normalized to the DNA content within the transwell. The mean normalized insulin concentration for replicate wells is indicated. Error bars indicate the SEM. ○○ or •• indicates significantly different from ○ or • (P < .05); ○○○ or ••• indicates significantly different from ○○ or • • (P < .05).
Figure 3.

Rodent β-cell line INS-1E incretin enhanced GSIS is sensitive to exogenous DA. INS-1E cells were cultured in 24-well plates, rested in low glucose media, and then challenged with the indicated concentration of glucose, incretin, and DA. After incubation, the culture supernatants were collected and the insulin concentration determined by a homogenous time-resolved fluorescent immunoassay. Cell monolayers remaining in the well were lysed, and the protein concentration was determined. The insulin concentration was then normalized to the wells protein concentration, and the protein normalized insulin concentration from replicate wells (n = 6) was averaged. Results shown are means from a representative experiment in a series of 3. Error bars indicate the SEM. ** or ♦♦ indicates significantly different from * or ♦ (P < .01); •• indicates significantly different from • (P < .05).
Figure 4.

Rat β-cell line INS-1E GSIS is sensitive to exogenous L-DOPA in a VMAT2-dependent manner. INS-1E cells were cultured in 24-well plates, rested in low glucose media overnight, and then preincubated indicated concentration of L-DOPA and TBZ, a known VMAT2 inhibitor, for 90 minutes, washed, and then challenged with the indicated concentrations of glucose, GLP-1, and DA for 1 hour. After incubation, the culture supernatants were collected and the insulin concentration was determined by a homogenous time-resolved fluorescent immunoassay. Cell monolayers remaining in the well were lysed, and the protein concentration was determined. The insulin concentration was then normalized to the wells protein concentration, and the protein normalized insulin concentration from replicate wells (n = 8) was averaged. Error bars indicate the SEM. •••• indicates significantly different from ••• (P < .05); ••• indicates significantly different from •• (P < .05); •• indicates significantly different from • (P < .05); □ indicates not significantly different from •• (P = .4).
Integration of incretin and DA cell signaling events during GSIS
In several β-cell-line models, it has been shown that GLP-1R couples with heterotrimeric G proteins (eg, Gαβγ) containing Gαs subunits, which may activate adenylate cyclase to stimulate cAMP production. GLP-1 has been shown to stimulate cAMP production as well as activate multiple signaling pathways, including protein kinase A, atypical protein kinase C (PKC)-ξ, enhanced docking with β-arrestins (34), and closure of K(ATP) channels (35). Like the GLP-1 receptor, DA D2R are also members of the GPCR family. However, D2R is couples to G complexes containing the Gαi/o proteins (36).
Rubí et al (13) began the characterization of the effects of DA on GSIS induced β-cell signaling using INS-1E β-cells. They reported that although GLP-1 in the presence of 15mM glucose raised cytosolic cAMP levels, DA did not at the concentration tested (10μM) (13). We revisited the early events signaling events in GSIS and found that DA at 50μM reproducibly reduced cytosolic cAMP concentrations in each instance relative to INS-1E cells treated with 10mM glucose, 10mM glucose and 10nM GIP or 10nM GLP-1 (Supplemental Figure 1). These results are consonant with the reported activation of adenylyl cyclase activity by agonism at GLP-1R and inhibition adenylyl cyclase activity by agonism at D2R (37). We next examined changes in cytosolic [Ca+2] evoked in INS-1E cells by treatment with glucose and combinations of GLP-1 and/or DA. As expected, raising glucose to 8mM or 15mM resulted in elevations of cytosolic [Ca+2] as revealed by enhanced fluo-4 AM fluorescence. Addition of GLP-1 to cells treated with 15mM glucose enhanced cytosolic [Ca+2], whereas addition of DA to INS-1E cells treated 15mM glucose alone or 15mM glucose with 20nM GLP-1 generally reversed the enhancement of cytosolic [Ca+2] levels (Supplemental Figure 2). These results suggest that the effects of DA on INS-1E β-cells calcium signaling are similar to those reported for neuronal cell models treated with DA and that D2R agonism opposes the changes in Ca+2 signaling evoked by GLP-1 agonism at GLP-1R. Increased Ca+2 fluxes resulting from agonism at GLP-1R results are likely via the action of stimulatory G proteins on voltage-dependent Ca+2 channels (38).
In β-cells, the combination of forskolin and IBMX, represents a potent stimulator of intracellular cAMP levels leading to closure of K(ATP) channels and membrane depolarization. Similarly, tolbutamide binding to the regulatory subunit of the K(ATP) channel (ie, the sulfonylurea receptor SUR-1) (39, 40) results in closure of the channel, membrane depolarization, rise of [Ca2+]i and insulin secretion (41–43). We examined the effects of D2R agonism by DA on insulin secretion in INS-1E cells stimulated by tolbutamide (100μM) or forskolin (10μM) with IBMX (10μM) under low glucose conditions (3mM) (Supplemental Figure 3). D2R agonism by DA (or the selective D2, 3R agonist Ropinirole) effectively reduced insulin release in INS-1E cells treated with either tolbutamide or forskolin/IBMX, suggesting that DA acts at stages after or separate from modulation of intracellular cAMP and K(ATP) channel closure. In the CNS, D2R stimulation increases K+ efflux at G protein-coupled inwardly rectifying potassium channels (GIRKs) and decreases Ca2+ influx at L,N and P/Q channels via Gβγ (44, 45). Human islets express Kir 3.1 (GIRK1) and Kir 3.2 (GIRK2) as well as the ATP-sensitive Kir 6.x (which are normally open, allowing K to flow out of the cells). As a first approximation, we might propose that D2R signaling in β-cells is similar to neuronal cell line models and the release of Gβγ, opens GIRK1 and GIRK2 channels, and “short circuits” the glucose-induced closing of the ATP-sensitive KIR 6.x channels (35) in addition to any effects D2R agonism may have on adenylyl cyclase activity (Supplemental Figure 1) (37).
GLP-1 agonism at GLP-1 R evokes multiple protein phosphorylation changes in several well-documented signaling pathways (reviewed in Refs. 46, 47). In rodent β-cells and β-cell models, the PI3K/AKT signaling pathways have been shown to be important in regulating β-cell growth, proliferation, apoptosis, and differentiation (48). We examined the effects of exogenous DA and incretins during in vitro GSIS in INS-1E cells with microarray measurements of the phosphorylation status of 16 signaling proteins within the PI3K/AKT pathway. INS-1E cell cultures were treated with 3mM or 15mM glucose in the presence and absence of GLP-1, GIP, and/or DA. Insulin secretion was measured in the supernatants and the cell monolayers were lysed and analyzed by a sandwich immunoassay. The relative chemiluminescence of replicate spots on the microarray (representing one type of phosphoprotein) was measured under each condition. The chemiluminescence data was then analyzed by hierarchical clustering to reveal differences in the phosphorylation pattern of the molecules present on the array evoked by culture in incretins and DA (Figure 5). We found that within the PI3K/AKT pathway, 15mM glucose alone, 15mM glucose plus GLP-1 (20nM), and 15mM glucose plus GIP (20nM) induced similar profile of protein phosphorylation (eg, increased phospho-AKT [serine 473] and phospho-GSK 3β [serine 9]). Addition of DA to cultures containing 15mM glucose and either GLP-1 or GIP returned a phosphoprotein phosphorylation pattern most similar to that evoked by 3mM glucose alone as demonstrated by hierarchical clustering of the treatment groups. It is interesting to note that this pattern of protein phosphorylation is distinct from that observed after D2R agonism in neuronal cell models (49).
Figure 5.
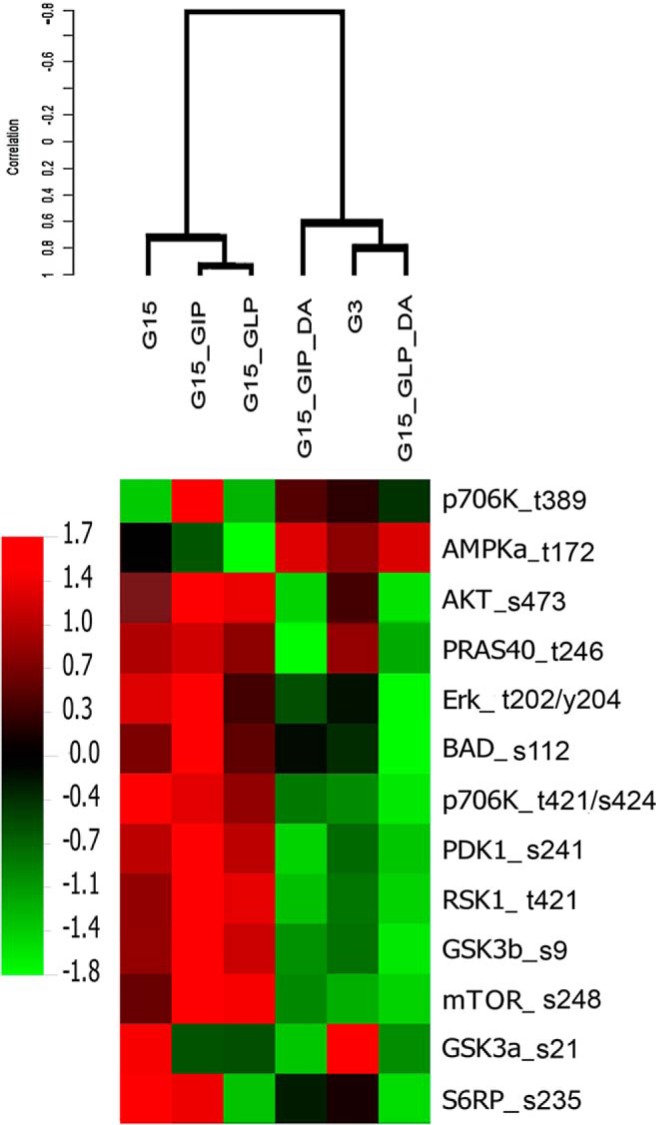
Hierarchical clustering of INS-1E phosphorylated proteins in response to incretin enhanced GSIS in the presence of DA. Hierarchical clustering of the levels of expression of 13 phosphoprotein determined by a microarray sandwich immunoassay in lysates of INS-1E cells treated with 3mM glucose (G3), 15mM glucose (G15), 15mM glucose with 10nM GLP-1 (G15_GLP), 15mM glucose with 10nM GIP(G15_GIP), 15mM glucose with 10nM GLP-1 plus 100μM DA (G15_GLP_DA), or 15mM glucose with 10nM GIP plus 100μM DA (G15_GIP_DA) for 1 hour. Expression data for each condition represents the average value gathered from at least 5 replicate microarrays, each replicate derived from a separate lysate and INS-1E culture experiment. Red and green colors indicate high and low phosphoprotein expression relative to a median value. The dendrogram illustrates the similarity of each pattern of phosphoprotein evoked by the different culture conditions using Pearson's correlation coefficient as the metric (eg, the phosphoprotein expression pattern in cultures of INS-1E cells with 15mM glucose and 10nM GLP-1 was more similar to cultures of INS-1E cells with 15mM glucose and 10nM GIP than to cultures of INS-1E cells in 3mM glucose). The abbreviations used for the phosphoproteins on the vertical axis are p706K_t389, ribosomal protein S6 kinase-β-1 (threonine 389); AMPKa_t172, AMP-activated PK (threonine 172); AKT_s473, PKB (serine 473); PRAS40_t246: proline-rich AKT1 substrate 1 (threonine 246); Erk_t202/y204, ERK 1and 2 (threonine 202 and tyrosine 204); BAD_s112, Bcl-2-associated death promoter (serine 112); p706K_t421/s424, ribosomal protein S6 kinase-β-1 (threonine 412) and (serine 424); PDK1_s241, phosphoinositide-dependent PK1 (serine 241); RSK1_t421, ribosomal S6 kinases-1 (p90) (threonine421); GSK3b_s9, glycogen synthase kinase-3-β (serine 9); mTOR_s248, mammalian target of rapamycin (serine 248); GSK3a_s21, glycogen synthase kinase-3-α (serine 21); S6RP_s235, ribosomal protein S6 (serine 235).
We next examined the phosphorylation status of several of the proteins present on the array by Western blotting methods for confirmation of the microarray sandwich immunoassay data. We found that phospho-AKT (Ser473) was increased in INS-1E treated with 15mM glucose or 15mM glucose plus 20nM GLP-1 relative to INS-1E cells treated with 3mM glucose. Addition of DA to cultures with high glucose or high glucose and GLP-1 inhibited the enhancement of phospho-Akt levels (Supplemental Figure 4). Similar results were found when we examined the phosphorylation status of GSK3β (serine 9) (Supplemental Figure 5) confirming the array data. GLP-1-mediated enhancement of phospho-GSK3β levels has been previously reported (50, 51).
GLP-1 stimulates β-cell mass expansion in rodents in vivo and in isolated rodent islets ex vivo via the promotion of β-cell proliferation and survival (52–54). The antiapoptotic effects of GLP-1 have been causally linked to activation of β-arrestin-1/ERK1/2 pathway in β-cell line models (55), whereas the growth promoting activity of GLP-1 in INS cells has been traced to the formation of agonist-stimulated GLP-1Rs, β-arrestin-1, and c-src complexes (56). We examined the effects of both GLP-1, GIP, and DA on the phosphorylation status of β-arrestin-1 in whole-cell lysates prepared from INS-1E cells (Figure 6). INS-1E cells held at 3mM glucose (basal) showed moderate phosphorylation of β-arrestin-1 consonant with previous reports (57). INS-1E cells treated with 15mM glucose with or without incretins showed loss of phosphorylation of β-arrestin-1 relative to levels seen at basal glucose concentration. The addition of DA to INS-1E cells cultured with 15mM alone or 15mM glucose with GLP-1 or GIP resulted in an increase in the amount of phospho-β-arrestin-1 (Ser412) as seen by Western blotting with specific antibodies. The results suggest that DA opposes specific scaffolding function of β-arrestin-1 by enhancing levels of phosphorylation at serine 412.
Figure 6.

DA enhances β-arrestin-1 phosphorylation in cultures of INS-1E cells. β-Arrestin-1 phosphorylation at serine 412 was analyzed in whole-cell lysates from cultures of INS-1E cells treated with the indicated concentrations of glucose, incretin, and/or DA. Representative immunoblots are shown. β-Arrestin-1 phosphorylation at serine 412 was quantified by digital densitometry and normalized to total β-arrestin. Results represent densitometry results from 3 separate experiments. Error bars are the SEM. **, significantly different from * (P = .03); ##, approaching significance from # (P = .08).
Proliferation of rodent β-cells and cell lines can be stimulated in vitro and/or in vivo by GLP-1 as well as parathyroid hormone-related protein and hepatocyte growth factor. Both hepatocyte growth factor and parathyroid hormone-related protein have been shown to enhance phosphorylation of PKC-ζ (at threonine 410/403) in cultures of INS1 cells (58). The action of GLP-1 on INS (832/13) β-cell proliferation has been shown to depend on PKC-ζ function as shown by experiments using adenoviral transduction of constitutively active and inactive forms of PKC-ζ (59). PKC-ζ gains its full kinase activity when phosphorylated at threonine 410 (by PDK1) and threonine 560 (60). Given the important role of PKC-ζ in β-cell proliferation, we examined the phosphorylation status of PKC-ζ in whole-cell lysates (61, 62). Cultures of INS-1E treated with glucose and GLP-1 in the presence or absence of DA (Figure 7). We found that the addition of either glucose (15mM) alone or in combination with GLP-1 (10nM) appeared to enhanced phosphor-PKC-ζ levels in INS-1E cells relative to level observed in cells treated with 3mM glucose. Addition of DA to these cultures resulted in a significant decrease in phospho-PKC-ζ (threonine 410/403) to levels similar or below those observed in cells treated with basal glucose. Similar results were found in cultures substituting GIP for GLP-1 (Supplemental Figure 6).
Figure 7.

DA suppresses atypical PKC-ζ threonine 410 phosphorylation. PKC-ζ phosphorylation at threonine 410 was analyzed in whole-cell lysates from cultures of INS-1E cells treated with the indicated combinations of glucose, incretin, and/or DA for 1 hour. In some experiments (filled columns), INS-1E cells were treated with 15mM and GLP-1 for 45 minutes, followed by the addition of DA for the indicated time. Representative immunoblots are shown with approximate position of the molecular weight markers in the right hand margin. PKC-ζ phosphorylation at threonine 410 was quantified by digital densitometry and normalized to total PKC-ζ. Results represent densitometry results from 4 separate experiments. Error bars are the SEM. ** or ♦♦, significantly different from * or ♦ (P < .05).
Like DA, SST-14 is a potent inhibitor of insulin secretion. SST-14 receptors (SSTRs) in rodent β-cell lines are predominantly of the SSTR2 and SSTR3 subtype (63), and like D2Rs, SSTRs are GCPRs that are functionally coupled to inhibition of 1) adenylate cyclase via a pertussis-toxin-sensitive protein, Gαi/o (64, 65); and 2) voltage-gated Ca+2 channels (66). We measured the effects of DA and/or SST-14 on the phosphorylation status of signaling proteins using the microarrays in glucose stimulated INS-1E cells and compared the evoked phosphoprotein patterns (Supplemental Figure 7). Both DA and SST-14 evoked closely correlated (but not identical) patterns of protein phosphorylation. When added together, SST-14 and DA in INS-1E cultures, returned a pattern of protein phosphorylation similar to either compound alone but with unique features that suggested synergy. Further study of these effects, however, is needed. Interestingly, chimeric molecules containing structural elements of both SST-14 and DA in a single molecule and retaining potent, selective binding to D2R and SSTR2 are powerful growth inhibitors of neuroendocrine tumors in vitro (67, 68). Unlike DA, however, it appears that are no postprandial excursions of SST-14 (69).
Synapsins are a family of proteins implicated in the regulation of neurotransmitter release at synapses and are thought to be involved in regulating the number of synaptic vesicles available for release via exocytosis at any one time (70). We observed that, similar to AKT activation in INS-1E cells, phosphosynapsin levels were increased in response to GLP-1 and that this enhancement was suppressed in INS-1E cells treated with GLP-1 and DA (Supplemental Figure 8).
The proapoptotic BCL-2 family member BAD has been assigned dual roles in β-cell function; first, BAD is an active participant in the chain of signaling events leading to insulin secretion, and second, BAD acts to promote apoptosis in its unphosphorylated form (71). The incretin GLP-1 has been reported to mediate its antiapoptotic effects through at least one pathway that depends on β-arrestin-1, activation of ERK1/2 and p90RSK (see Figures 5–7) and the inactivation of BAD by phosphorylation at Ser112. We examined the phosphorylation of BAD at Ser112 in cultures of INS-1E cells treated with glucose (3mM and 15mM) in the presence of 10nM GIP with and without added DA. We found that that GIP stimulation of INS-1E cells enhanced BAD phosphorylation and this enhancement could be partially blocked by DA in culture (Figure 8).
Figure 8.

DA suppresses GIP enhanced BAD phosphorylation at serine 122. Phosphorylated BAD was evaluated in whole-cell lysates from cultures of INS-1E cells treated with the indicated combinations of glucose, GIP, and/or DA for 1 hour. In some experiments, INS-1E cells were treated with 15mM and GIP-1 for 45 minutes as indicated. Representative immunoblots are shown with approximate position of the molecular weight markers in the right hand margin. Phospho-BAD and BAD were quantified by digital densitometry and the amount of phospho-BAD was normalized to total BAD. Results represent densitometry results from 3 separate experiments. Error bars are the SEM. *, significantly different from **; and **, significantly different from *** (P ≤ .05).
The proapoptotic action of DA on BAD phosphorylation, however, did not extend towards the cleavage of the Caspase-3 zymogen into its activated p17 fragment. In INS-1E cultures treated with 15mM glucose, incretins, and/or DA (50μM), for 1 hour, we were unable to detect significant amounts of the p17 effector Caspase molecule produced by the upstream initiator Caspases. Similar results (ie, no cleavage products) were found in Western blottings probed with anti-Caspase 7 antibodies (data not shown). However, when INS-1E cells were cultured in low serum, low glucose medium (0.5% FBS/5mM glucose) for 24 hours, and then assayed for cleavage of Z-DEVD-R110, a Caspase 3 and 7 substrate, we detected specific enzyme activity. Relative to the Caspase activity in control cultures (5mM glucose alone), we found that 50μM DA treatment of INS-1E cells significantly reduced the substrate cleavage activity in cell lysates. As a positive control, we treated INS1-E cells with the chemical endoplasmic reticulum stress inducer Thapsigargin (1μM). In these lysates, substrate cleavage activity was increased 50% relative to control cultures. As expected, addition of GLP-1 to Thapsigargin-treated cultures reduced detectable caspase 3/7 activity relative to cultures treated with Thapsigargin alone. Addition of DA or Ropinirole (a D2,3 R-selective agonist) to Thapsigargin-treated INS-1E cultures significantly reduced detectable caspase 3/7 activity relative Thapsigargin treatment alone or Thapsigargin plus GLP-1. (Figure 9), suggesting that D2R agonism is antiapoptotic under these conditions.
Figure 9.

Caspase 3 and 7 activity in DA-treated INS-1E cells cultured in low glucose-low serum conditions. Cultures of INS-1E cells were treated with the indicated concentrations of glucose, GLP-1, DA, Ropinirole, and thapsigargin for 24 hours. Both adherent and nonadherent cells were harvested, washed, and lysed in hypotonic buffer with protease inhibitors and then cleared by centrifugation. The protein concentration was adjusted to 1 μg/mL and aliquots (25-μg protein) were incubated with rhodamine 110, bis-N-CBZL-aspartyl-L-glutamyl-L-valyl-L-aspartic acid amide (Z-DEVD-R110) in a caspase assay buffer at 37°C. The rate of the rhodamine-leaving group released was determined by monitoring fluorescence at 520 nm at 2-minute intervals over a 45-minute period. Results represent averages from 4 or more independent experiments. Error bars are the SEM. *, significantly different from ** (P ≤ .05); and #, significantly from *** (P ≤ .05).
That DA might have antiapoptotic activity is counterintuitive to the conclusions of a number of studies of the effects of DA on neuronal cell line cultures. In neuronal cell line models, treatment with DA (100μM–500μM) induces an apoptotic phenotype (72–76). It should be noted that in the neuronal cell models it is thought that DA oxidation products (eg, dopaminochrome) are the direct stressors leading to apoptosis as a number of antioxidants (eg, glutathione or N-acetyl-L-cysteine) reduce the generation of the oxidation products and the apoptotic effects (77). In the experiments presented above, we used lower concentrations of DA than the cited neuronal cell cultures and the INS-1E culture media contains β-mercaptoethanol, which may have resulted in some antioxidant activity in DA containing cultures. Our results, suggesting an apoptosis-sparing activity of DA on β-cells are most easily explained by the calcium ion dependence of the intrinsic apoptotic pathway (78, 79). The Ca+2-dependent proapoptotic activities of calpains (a cysteine proteases family) and calcineurin are well described (80, 81). In Supplemental Figure 2, we demonstrated that DA treatment of INS-1E cells results in a net loss of [Ca+2]i relative to DA-free cultures, supporting the hypothesis that the apoptosis-sparing activity of DA on INS-1E cells is directly related to its action on [Ca+2]i fluxes in INS-1E cells. The apparent discrepancy of action of DA in these experiments; the proapoptotic action on pBAD to BAD ratios and apoptosis-sparing effects on caspase 3/7 activity can be reconciled by noting the differences of culture conditions. Under conditions of a short-duration, high-glucose-with-incretin challenge, DA suppressed the prosurvival effects of GIP (Figure 8) and GLP-1 (data not shown), but under chronic low glucose conditions, DA, perhaps via its significant effects on inhibiting elevations of [Ca+2]i (Supplemental Figure 2), interfered in the activation of calcium-sensitive apoptotic pathways, leading to a net reduction in caspase 3/7 activity. It is also possible, that the change in phospho-BAD to BAD ratios effected by DA relates more to its role in glucose sensing (82) than it role in apoptosis. Further study will be required to determine which way the balance is tipped in vivo.
Anti-proliferative activity of DA
Given the clear anti-incretin action of DA on signaling in INS-1E cells, we examined the effects of DA on INS-1E cell proliferation. Addition of GLP-1 or GIP to cultures enhanced both absolute cell numbers as well thymidine incorporation by INS-1E cells. Where DA had been added to cultures treated with GLP-1 or GIP, we observed that cell numbers were similar to that measured in cultures of media alone. Active DNA synthesis was enhanced in incretin-treated cultures of INS-1E cells relative to media alone and DA reduced incretin-enhanced tritiated thymidine incorporation to levels below that observed in control cultures (Figure 10). Because cell cycle regulation in tumor cell lines (ie, INS-1E cells) is abnormal, we tested the effects of DA on authentic murine β-cell proliferation in islet cultures. DA suppressed β-cell proliferation to control levels (ie, cultured in 3mM glucose) in islets cultured under conditions evoking a proliferative response (15mM glucose and 15mM glucose plus GLP-1) (Figure 11).
Figure 10.

DA suppresses incretin enhanced proliferation of INS-1E cells. Cell proliferation of INS-1E cells was assessed by measuring [3H]thymidine incorporation or total cell numbers in replicate wells using the MTT assay after incubation in media alone or the indicated combinations of incretin and/or DA. Results are from a representative experiment in a series of 4. ** or ♦♦, significantly different from * or ♦, respectively, (P < .05).
Figure 11.

Effect of DA on β-cell proliferation in C57Bl/6J islets. Mouse islets were isolated, and cells dispersed and plated as previously described (27). Next day, medium was changed, and 3mM or 15mM glucose with GLP-1 or vehicle was added to the cells. Twenty-four hours later, islet cells were fixed and stained for insulin and Ki67. An average of 2300 β-cells were counted per sample. Results are the average from 4 separate experiments using duplicate samples per experimental condition. Error bas are the SEM. **, significantly different from * (P < .05); ***, significantly different from ** (P < .05); ****, significantly different from ** (P < .05); +, approached significance different from * (P = .08).
The purpose of this study was to explore basic aspects of 2 related hypotheses: that 1) foregut derived DA may act as an anti-incretin by opposing the β-cell GSIS enhancing activities of GLP-1 and GIP; and 2) that surgical manipulation of foregut DA production, as might arise in RYGB, may underlie some of the rapid metabolic changes observed after weight loss surgery. Toward this goal, we established there are significant excursions of plasma DA (relative to basal levels) after mixed meal challenges in a rat model. Similar to humans, these plasma DA excursions are contemporary with increases in plasma incretins provoked by a mixed meal. We show that exogenous DA in in vitro cultures of both human islets and INS-1E cells counters the GSIS enhancing effects of GLP-1 and GIP and that exogenous L-DOPA, like DA, can regulate in vitro GSIS. At the subcellular level, we demonstrate that DA receptor agonism opposes early cell signaling events (eg, Ca+2 fluxes, cAMP levels) that are triggered by glucose and amplified by GLP-1 and GIP as well as specific distal events that are associated with β-cell survival and proliferation (eg, BAD and PKC-ζ phosphorylation). Given the broad counter regulatory activity of DA on GLP-1, a peptide hormone, know to promote the proliferation of rodent β-cells in vitro and in vivo, we determined whether DA would also regulate in vitro β-cell line proliferation. As might be predicted from the pattern of PI3K/AKT signaling evoked in cultures of INS-1E cells challenged with glucose and GLP-1 or GIP, in the presence and absence of DA, DA at the concentrations tested was a strong inhibitor of GLP-1 and GIP enhanced β-cell line proliferation.
DA alone in vitro, in the absence of incretins, also countered most of the changes in INS-1E cells triggered by glucose, ranging from [Ca2+]i fluxes to insulin secretion and proliferation. Thus, classifying DA as an anti-incretin may only apply in an in vivo context, where circulating DA and incretin (and glucose) excursions follow a mixed meal challenge. Weaknesses of this study include: 1) we were confined to cell lines for some of our biochemical studies; and 2) the concentrations of DA (and L-DOPA) studied may not represent physiological amounts. There is, however, an abundance of anecdotal clinical observations that suggest that DA is an important in vivo regulator of insulin secretion and β-cell proliferation.
In support of the importance of DA in β-cell function and proliferation in vivo are reports documenting that 1) aromatic L-amino acid decarboxylase-deficient individuals (resulting in a deficiency in the conversion of L-DOPA to DA) suffer from hypoglycemia (83); 2) Parkinson's patients receiving oral DA precursor L-DOPA have reduced insulin secretion during oral glucose tolerance testing (84); 3) food content of L-DOPA and DA has been proposed as major source of tissue DA (85); and 4) increased β-cell mass after gastric (ie, foregut inclusive) bypass surgery in swine (86), rat models (31, 87), and perhaps humans (88).
In the specific context of metabolic surgery for the treatment of T2D, a recent commentary (89), questioning the validity of the “foregut hypothesis,” notes that sleeve gastrectomy (SG), which does not exclude the upper intestine, has a similar clinical effect on diabetes remission (90, 91), and a very low-calorie diet can induce the identical very early effects of RYGB in patients with diabetes (92). However, all of these cited clinical observations remain consonant with the proposal that gut DA acts as an anti-incretin. Because the duodenum and jejunum together appear to store and release as much DA as does the stomach (18, 85, 93), it might be reasonable to expect that SG (which removes only DA producing tissues in the stomach, but spares the foregut) compared with RYGB (which bypasses DA producing tissues in the stomach as well as the foregut) results in quantitatively different postprandial serum DA excursions (SG>RYGB) and different serum insulin excursions after mixed meal testing (RYGB>SG). This latter prediction is borne out by at least one recent clinical study (94).
Lastly, Sakano et al (95) have recently reported that VMAT2 is an essential regulator of late stage β-cell differentiation and proliferation, presumably via its role in managing β-cell vesicular DA storage. These observations, together with our data showing the antiproliferative activity of DA, suggest that DA may play an important role, not only in insulin secretion, but in homeostasis of β-cell mass.
Acknowledgments
This work was supported by the United States Public Health Service, National Institutes of Health, the National Institute of Diabetes and Digestive and Kidney Diseases Grant 5 R01 DK063567, and the Helmsley Charitable Trust Grant 09PG-T1D020.
Disclosure Summary: The authors have nothing to disclose.
Footnotes
- [Ca2+]i
- intracellular calcium
- DA
- dopamine
- DAT
- DA active transporter
- D2R
- D2-like receptor
- FBS
- fetal bovine serum
- GIP
- glucose-dependent insulinotropic polypeptide
- GIRK
- G protein-coupled inwardly rectifying potassium channel
- GLP-1
- Glucagon-like peptide 1
- GSIS
- glucose-stimulated insulin secretion
- HBSS
- HEPES-buffered salt solution
- IBMX
- 3-isobutyl-1-methylxanthine
- L-DOPA
- L-3,4-dihydroxyphenylalanine
- MMTT
- mixed meal tolerance testing
- MTT
- 3-(4,5-dimethylthiazol-2-yl)-2,5-diphenyltetrazolium bromide
- PKC
- protein kinase C
- RYGB
- Roux-en-Y-gastric bypass
- SG
- sleeve gastrectomy
- SST-14
- somatostatin
- SSTR
- SST-14 receptor
- TBZ
- tetrabenazine
- T2D
- type 2 diabetes
- VMAT2
- vesicular monoamine transporter type 2.
References
- 1. Ionut V, Burch M, Youdim A, Bergman RN. Gastrointestinal hormones and bariatric surgery-induced weight loss. Obesity (Silver Spring). 2013;21(6):1093–1103. [DOI] [PMC free article] [PubMed] [Google Scholar]
- 2. Buchwald H, Avidor Y, Braunwald E, et al. Bariatric surgery: a systematic review and meta-analysis. JAMA. 2004;292(14):1724–1737. [DOI] [PubMed] [Google Scholar]
- 3. Pories WJ, MacDonald KG, Jr, Morgan EJ, et al. Surgical treatment of obesity and its effect on diabetes: 10-y follow-up. Am J Clin Nutr. 1992;55(2 suppl):582S–585S. [DOI] [PubMed] [Google Scholar]
- 4. Guidone C, Manco M, Valera-Mora E, et al. Mechanisms of recovery from type 2 diabetes after malabsorptive bariatric surgery. Diabetes. 2006;55(7):2025–2031. [DOI] [PubMed] [Google Scholar]
- 5. Pournaras DJ, Osborne A, Hawkins SC, et al. Remission of type 2 diabetes after gastric bypass and banding: mechanisms and 2 year outcomes. Ann Surg. 2010;252(6):966–971. [DOI] [PubMed] [Google Scholar]
- 6. Pories WJ, Swanson MS, MacDonald KG, et al. Who would have thought it? An operation proves to be the most effective therapy for adult-onset diabetes mellitus. Ann Surg. 1995;222(3):339–350; discussion 350–332. [DOI] [PMC free article] [PubMed] [Google Scholar]
- 7. Schauer PR, Burguera B, Ikramuddin S, et al. Effect of laparoscopic Roux-en Y gastric bypass on type 2 diabetes mellitus. Ann Surg. 2003;238(4):467–484; discussion 484–485. [DOI] [PMC free article] [PubMed] [Google Scholar]
- 8. Rubino F, R'bibo SL, del Genio F, Mazumdar M, McGraw TE. Metabolic surgery: the role of the gastrointestinal tract in diabetes mellitus. Nat Rev Endocrinol. 2010;6(2):102–109. [DOI] [PMC free article] [PubMed] [Google Scholar]
- 9. Simpson N, Maffei A, Freeby M, et al. Dopamine-mediated autocrine inhibitory circuit regulating human insulin secretion in vitro. Mol Endocrinol. 2012;26(10):1757–1772. [DOI] [PMC free article] [PubMed] [Google Scholar]
- 10. Ustione A, Piston DW. Dopamine synthesis and D3 receptor activation in pancreatic β-cells regulates insulin secretion and intracellular [Ca(2+)] oscillations. Mol Endocrinol. 2012;26(11):1928–1940. [DOI] [PMC free article] [PubMed] [Google Scholar]
- 11. Raffo A, Hancock K, Polito T, et al. Role of vesicular monoamine transporter type 2 in rodent insulin secretion and glucose metabolism revealed by its specific antagonist tetrabenazine. J Endocrinol. 2008;198(1):41–49. [DOI] [PMC free article] [PubMed] [Google Scholar]
- 12. Ustione A, Piston DW, Harris PE. Minireview: dopaminergic regulation of insulin secretion from the pancreatic islet. Mol Endocrinol. 2013;27(8):1198–1207. [DOI] [PMC free article] [PubMed] [Google Scholar]
- 13. Rubí B, Ljubicic S, Pournourmohammadi S, et al. Dopamine D2-like receptors are expressed in pancreatic β cells and mediate inhibition of insulin secretion. J Biol Chem. 2005;280(44):36824–36832. [DOI] [PubMed] [Google Scholar]
- 14. Cragg SJ, Rice ME. DAncing past the DAT at a DA synapse. Trends Neurosci. 2004;27(5):270–277. [DOI] [PubMed] [Google Scholar]
- 15. Shankar E, Santhosh KT, Paulose CS. Dopaminergic regulation of glucose-induced insulin secretion through dopamine D2 receptors in the pancreatic islets in vitro. IUBMB Life. 2006;58(3):157–163. [DOI] [PubMed] [Google Scholar]
- 16. García-Tornadú I, Ornstein AM, Chamson-Reig A, et al. Disruption of the dopamine d2 receptor impairs insulin secretion and causes glucose intolerance. Endocrinology. 2010;151(4):1441–1450. [DOI] [PubMed] [Google Scholar]
- 17. Eisenhofer G, Aneman A, Friberg P, et al. Substantial production of dopamine in the human gastrointestinal tract. J Clin Endocrinol Metab. 1997;82(11):3864–3871. [DOI] [PubMed] [Google Scholar]
- 18. Vieira-Coelho MA, Soares-da-Silva P. Dopamine formation, from its immediate precursor 3,4-dihydroxyphenylalanine, along the rat digestive tract. Fundam Clin Pharmacol. 1993;7(5):235–243. [DOI] [PubMed] [Google Scholar]
- 19. Iturriza FC, Thibault J. Immunohistochemical investigation of tyrosine-hydroxylase in the islets of Langerhans of adult mice, rats and guinea pigs. Neuroendocrinology. 1993;57(3):476–480. [DOI] [PubMed] [Google Scholar]
- 20. Kozicz T, Arimura A. Distribution of urocortin in the rat's gastrointestinal tract and its colocalization with tyrosine hydroxylase. Peptides. 2002;23(3):515–521. [DOI] [PubMed] [Google Scholar]
- 21. Mezey E, Eisenhofer G, Harta G, et al. A novel nonneuronal catecholaminergic system: exocrine pancreas synthesizes and releases dopamine. Proc Natl Acad Sci USA. 1996;93(19):10377–10382. [DOI] [PMC free article] [PubMed] [Google Scholar]
- 22. Goldstein DS, Swoboda KJ, Miles JM, et al. Sources and physiological significance of plasma dopamine sulfate. J Clin Endocrinol Metab. 1999;84(7):2523–2531. [DOI] [PubMed] [Google Scholar]
- 23. Blum I, Vered Y, Graff E, et al. The influence of meal composition on plasma serotonin and norepinephrine concentrations. Metabolism. 1992;41(2):137–140. [DOI] [PubMed] [Google Scholar]
- 24. Rask E, Olsson T, Söderberg S, et al. Impaired incretin response after a mixed meal is associated with insulin resistance in nondiabetic men. Diabetes Care. 2001;24(9):1640–1645. [DOI] [PubMed] [Google Scholar]
- 25. Merglen A, Theander S, Rubi B, Chaffard G, Wollheim CB, Maechler P. Glucose sensitivity and metabolism-secretion coupling studied during two-year continuous culture in INS-1E insulinoma cells. Endocrinology. 2004;145(2):667–678. [DOI] [PubMed] [Google Scholar]
- 26. Hansen KB, Bräuner-Osborne H. FLIPR assays of intracellular calcium in GPCR drug discovery. Methods Mol Biol. 2009;552:269–278. [DOI] [PubMed] [Google Scholar]
- 27. Fiaschi-Taesch NM, Kleinberger JW, Salim FG, et al. Cytoplasmic-nuclear trafficking of G1/S cell cycle molecules and adult human β-cell replication: a revised model of human β-cell G1/S control. Diabetes. 2013;62(7):2460–2470. [DOI] [PMC free article] [PubMed] [Google Scholar]
- 28. Cadavez L, Montane J, Alcarraz-Vizan G, et al. Chaperones ameliorate β cell dysfunction associated with human islet amyloid polypeptide overexpression. PLoS One. 2014;9(7):e101797. [DOI] [PMC free article] [PubMed] [Google Scholar]
- 29. Martins LM, Mesner PW, Kottke TJ, et al. Comparison of Caspase Activation and Subcellular Localization in HL-60 and K562 Cells Undergoing Etoposide-Induced Apoptosis. Blood. 1997;90(11):4283–4296. [PubMed] [Google Scholar]
- 30. El-Assaad W, Buteau J, Peyot ML, et al. Saturated fatty acids synergize with elevated glucose to cause pancreatic β-cell death. Endocrinology. 2003;144(9):4154–4163. [DOI] [PubMed] [Google Scholar]
- 31. Speck M, Cho YM, Asadi A, Rubino F, Kieffer TJ. Duodenal-jejunal bypass protects GK rats from β-cell loss and aggravation of hyperglycemia and increases enteroendocrine cells coexpressing GIP and GLP-1. Am J Physiol Endocrinol Metab. 2011;300(5):E923–E932. [DOI] [PubMed] [Google Scholar]
- 32. Straub SG, Sharp GW. Evolving insights regarding mechanisms for the inhibition of insulin release by norepinephrine and heterotrimeric G proteins. Am J Physiol Cell Physiol. 2012;302(12):C1687–C1698. [DOI] [PMC free article] [PubMed] [Google Scholar]
- 33. Clarke WL, Santiago JV, Thomas L, Ben-Galim E, Haymond MW, Cryer PE. Adrenergic mechanisms in recovery from hypoglycemia in man: adrenergic blockade. Am J Physiol. 1979;236(2):E147–E152. [DOI] [PubMed] [Google Scholar]
- 34. Lee YS, Jun HS. Anti-diabetic actions of glucagon-like peptide-1 on pancreatic β-cells. Metabolism. 2014;63(1):9–19. [DOI] [PubMed] [Google Scholar]
- 35. Light PE, Manning Fox JE, Riedel MJ, Wheeler MB. Glucagon-like peptide-1 inhibits pancreatic ATP-sensitive potassium channels via a protein kinase A- and ADP-dependent mechanism. Mol Endocrinol. 2002;16(9):2135–2144. [DOI] [PubMed] [Google Scholar]
- 36. Park SW, Seo MK, Cho HY, et al. Differential effects of amisulpride and haloperidol on dopamine D2 receptor-mediated signaling in SH-SY5Y cells. Neuropharmacology. 2011;61(4):761–769. [DOI] [PubMed] [Google Scholar]
- 37. Missale C, Nash SR, Robinson SW, Jaber M, Caron MG. Dopamine receptors: from structure to function. Physiol Rev. 1998;78(1):189–225. [DOI] [PubMed] [Google Scholar]
- 38. Hodson DJ, Tarasov AI, Gimeno Brias S, et al. Incretin-modulated β cell energetics in intact islets of Langerhans. Mol Endocrinol. 2014;28(6):860–871. [DOI] [PMC free article] [PubMed] [Google Scholar]
- 39. Aguilar-Bryan L, Bryan J. Molecular biology of adenosine triphosphate-sensitive potassium channels. Endocr Rev. 1999;20(2):101–135. [DOI] [PubMed] [Google Scholar]
- 40. Ashcroft FM, Gribble FM. ATP-sensitive K+ channels and insulin secretion: their role in health and disease. Diabetologia. 1999;42(8):903–919. [DOI] [PubMed] [Google Scholar]
- 41. Gilon P, Henquin JC. Influence of membrane potential changes on cytoplasmic Ca2+ concentration in an electrically excitable cell, the insulin-secreting pancreatic B-cell. J Biol Chem. 1992;267(29):20713–20720. [PubMed] [Google Scholar]
- 42. Panten U, Schwanstecher M, Schwanstecher C. Sulfonylurea receptors and mechanism of sulfonylurea action. Exp Clin Endocrinol Diabetes. 1996;104(1):1–9. [DOI] [PubMed] [Google Scholar]
- 43. Satin LS. New mechanisms for sulfonylurea control of insulin secretion. Endocrine. 1996;4(3):191–198. [DOI] [PubMed] [Google Scholar]
- 44. Zylbergold P, Ramakrishnan N, Hebert T. The role of G proteins in assembly and function of Kir3 inwardly rectifying potassium channels. Channels (Austin). 2010;4(5):411–421. [DOI] [PMC free article] [PubMed] [Google Scholar]
- 45. Neve KA, Seamans JK, Trantham-Davidson H. Dopamine receptor signaling. J Recept Signal Transduct Res. 2004;24(3):165–205. [DOI] [PubMed] [Google Scholar]
- 46. Dalle S, Burcelin R, Gourdy P. Specific actions of GLP-1 receptor agonists and DPP4 inhibitors for the treatment of pancreatic β-cell impairments in type 2 diabetes. Cell Signal. 2013;25(2):570–579. [DOI] [PubMed] [Google Scholar]
- 47. Kulkarni RN, Mizrachi EB, Ocana AG, Stewart AF. Human β-cell proliferation and intracellular signaling: driving in the dark without a road map. Diabetes. 2012;61(9):2205–2213. [DOI] [PMC free article] [PubMed] [Google Scholar]
- 48. Bernal-Mizrachi E, Kulkarni RN, Scott DK, Mauvais-Jarvis F, Stewart AF, Garcia-Ocaña A. Human β-cell proliferation and intracellular signaling part 2: still driving in the dark without a road map. Diabetes. 2014;63(3):819–831. [DOI] [PMC free article] [PubMed] [Google Scholar]
- 49. Beaulieu JM, Gainetdinov RR, Caron MG. The Akt-GSK-3 signaling cascade in the actions of dopamine. Trends Pharmacol Sci. 2007;28(4):166–172. [DOI] [PubMed] [Google Scholar]
- 50. Li L, El-Kholy W, Rhodes CJ, Brubaker PL. Glucagon-like peptide-1 protects β cells from cytokine-induced apoptosis and necrosis: role of protein kinase B. Diabetologia. 2005;48(7):1339–1349. [DOI] [PubMed] [Google Scholar]
- 51. Liu H, Remedi MS, Pappan KL, et al. Glycogen synthase kinase-3 and mammalian target of rapamycin pathways contribute to DNA synthesis, cell cycle progression, and proliferation in human islets. Diabetes. 2009;58(3):663–672. [DOI] [PMC free article] [PubMed] [Google Scholar]
- 52. Buteau J, Roduit R, Susini S, Prentki M. Glucagon-like peptide-1 promotes DNA synthesis, activates phosphatidylinositol 3-kinase and increases transcription factor pancreatic and duodenal homeobox gene 1 (PDX-1) DNA binding activity in β (INS-1)-cells. Diabetologia. 1999;42(7):856–864. [DOI] [PubMed] [Google Scholar]
- 53. Farilla L, Hui H, Bertolotto C, et al. Glucagon-like peptide-1 promotes islet cell growth and inhibits apoptosis in Zucker diabetic rats. Endocrinology. 2002;143(11):4397–4408. [DOI] [PubMed] [Google Scholar]
- 54. Li Y, Hansotia T, Yusta B, Ris F, Halban PA, Drucker DJ. Glucagon-like peptide-1 receptor signaling modulates β cell apoptosis. J Biol Chem. 2003;278(1):471–478. [DOI] [PubMed] [Google Scholar]
- 55. Quoyer J, Longuet C, Broca C, et al. GLP-1 mediates antiapoptotic effect by phosphorylating Bad through a β-arrestin 1-mediated ERK1/2 activation in pancreatic β-cells. J Biol Chem. 2010;285(3):1989–2002. [DOI] [PMC free article] [PubMed] [Google Scholar]
- 56. Talbot J, Joly E, Prentki M, Buteau J. β-Arrestin1-mediated recruitment of c-Src underlies the proliferative action of glucagon-like peptide-1 in pancreatic β INS832/13 cells. Mol Cell Endocrinol. 2012;364(1–2):65–70. [DOI] [PubMed] [Google Scholar]
- 57. Hupfeld CJ, Resnik JL, Ugi S, Olefsky JM. Insulin-induced β-arrestin1 Ser-412 phosphorylation is a mechanism for desensitization of ERK activation by Gαi-coupled receptors. J Biol Chem. 2005;280(2):1016–1023. [DOI] [PubMed] [Google Scholar]
- 58. Vasavada RC, Gonzalez-Pertusa JA, et al. Growth factors and β cell replication. Int J Biochem Cell Biol. 2006;38(5–6):931–950. [DOI] [PubMed] [Google Scholar]
- 59. Buteau J, Foisy S, Rhodes CJ, Carpenter L, Biden TJ, Prentki M. Protein kinase Cζ activation mediates glucagon-like peptide-1-induced pancreatic β-cell proliferation. Diabetes. 2001;50(10):2237–2243. [DOI] [PubMed] [Google Scholar]
- 60. Hirai T, Chida K. Protein kinase Cζ (PKCζ): activation mechanisms and cellular functions. J Biochem. 2003;133(1):1–7. [DOI] [PubMed] [Google Scholar]
- 61. Naranatt PP, Akula SM, Zien CA, Krishnan HH, Chandran B. Kaposi's sarcoma-associated herpesvirus induces the phosphatidylinositol 3-kinase-PKC-ζ-MEK-ERK signaling pathway in target cells early during infection: implications for infectivity. J Virol. 2003;77(2):1524–1539. [DOI] [PMC free article] [PubMed] [Google Scholar]
- 62. Xie Z, Singh M, Siwik DA, Joyner WL, Singh K. Osteopontin inhibits interleukin-1β-stimulated increases in matrix metalloproteinase activity in adult rat cardiac fibroblasts: role of protein kinase C-ζ. J Biol Chem. 2003;278(49):48546–48552. [DOI] [PubMed] [Google Scholar]
- 63. Mergler S, Singh V, Grötzinger C, Kaczmarek P, Wiedenmann B, Strowski MZ. Characterization of voltage operated R-type Ca2+ channels in modulating somatostatin receptor subtype 2- and 3-dependent inhibition of insulin secretion from INS-1 cells. Cell Signal. 2008;20(12):2286–2295. [DOI] [PubMed] [Google Scholar]
- 64. Lahlou H, Guillermet J, Hortala M, et al. Molecular signaling of somatostatin receptors. Ann NY Acad Sci. 2004;1014:121–131. [DOI] [PubMed] [Google Scholar]
- 65. Degtiar VE, Wittig B, Schultz G, Kalkbrenner F. A specific G(o) heterotrimer couples somatostatin receptors to voltage-gated calcium channels in RINm5F cells. FEBS Lett. 1996;380(1–2):137–141. [DOI] [PubMed] [Google Scholar]
- 66. Schmidt A, Hescheler J, Offermanns S, et al. Involvement of pertussis toxin-sensitive G-proteins in the hormonal inhibition of dihydropyridine-sensitive Ca2+ currents in an insulin-secreting cell line (RINm5F). J Biol Chem. 1991;266(27):18025–18033. [PubMed] [Google Scholar]
- 67. Peverelli E, Olgiati L, Locatelli M, et al. The dopamine–somatostatin chimeric compound BIM-23A760 exerts antiproliferative and cytotoxic effects in human non-functioning pituitary tumors by activating ERK1/2 and p38 pathways. Cancer Lett. 2010;288(2):170–176. [DOI] [PubMed] [Google Scholar]
- 68. Zitzmann K, Andersen S, Vlotides G, et al. The novel somatostatin receptor 2/dopamine type 2 receptor chimeric compound BIM-23A758 decreases the viability of human GOT1 midgut carcinoid cells. Neuroendocrinology. 2013;98(2):128–136. [DOI] [PubMed] [Google Scholar]
- 69. Serrano P, Yago MD, Mañas M, Calpena R, Mataix J, Martínez-Victoria E. Influence of type of dietary fat (olive and sunflower oil) upon gastric acid secretion and release of gastrin, somatostatin, and peptide YY in man. Dig Dis Sci. 1997;42(3):626–633. [DOI] [PubMed] [Google Scholar]
- 70. Bykhovskaia M. Synapsin regulation of vesicle organization and functional pools. Semin Cell Dev Biol. 2011;22(4):387–392. [DOI] [PubMed] [Google Scholar]
- 71. Danial NN, Walensky LD, Zhang CY, et al. Dual role of proapoptotic BAD in insulin secretion and β cell survival. Nat Med. 2008;14(2):144–153. [DOI] [PMC free article] [PubMed] [Google Scholar]
- 72. Panet H, Barzilai A, Daily D, Melamed E, Offen D. Activation of nuclear transcription factor κ B (NF-κB) is essential for dopamine-induced apoptosis in PC12 cells. J Neurochem. 2001;77(2):391–398. [DOI] [PubMed] [Google Scholar]
- 73. Chen XC, Zhu YG, Wang XZ, Zhu LA, Huang C. Protective effect of ginsenoside Rg1 on dopamine-induced apoptosis in PC12 cells. Acta Pharmacol Sin. 2001;22(8):673–678. [PubMed] [Google Scholar]
- 74. Song JH, Slot AJ, Ryan RW, Ross GM. Dopamine-induced death of PC12 cells is prevented by a substituted tetrahydronaphthalene. Neuropharmacology. 2004;46(7):984–993. [DOI] [PubMed] [Google Scholar]
- 75. Chen XC, Zhu YG, Zhu LA, et al. Ginsenoside Rg1 attenuates dopamine-induced apoptosis in PC12 cells by suppressing oxidative stress. Eur J Pharmacol. 2003;473(1):1–7. [DOI] [PubMed] [Google Scholar]
- 76. Lee MK, Kang SJ, Poncz M, Song KJ, Park KS. Resveratrol protects SH-SY5Y neuroblastoma cells from apoptosis induced by dopamine. Exp Mol Med. 2007;39(3):376–384. [DOI] [PubMed] [Google Scholar]
- 77. Lai CT, Yu PH. Dopamine- and L-β-3,4-dihydroxyphenylalanine hydrochloride (L-Dopa)-induced cytotoxicity towards catecholaminergic neuroblastoma SH-SY5Y cells. Effects of oxidative stress and antioxidative factors. Biochem Pharmacol. 1997;53(3):363–372. [DOI] [PubMed] [Google Scholar]
- 78. Kondratskyi A, Kondratska K, Skryma R, Prevarskaya N. Ion channels in the regulation of apoptosis. Biochim Biophys Acta. Published online ahead of print October 27, 2014. doi:10.1016/j.bbamem.2014.10.030. [DOI] [PubMed] [Google Scholar]
- 79. Fei H, Zhao B, Zhao S, Wang Q. Requirements of calcium fluxes and ERK kinase activation for glucose- and interleukin-1β-induced β-cell apoptosis. Mol Cell Biochem. 2008;315(1–2):75–84. [DOI] [PubMed] [Google Scholar]
- 80. Gil-Parrado S, Fernández-Montalván A, Assfalg-Machleidt I, et al. Ionomycin-activated calpain triggers apoptosis. A probable role for Bcl-2 family members. J Biol Chem. 2002;277(30):27217–27226. [DOI] [PubMed] [Google Scholar]
- 81. Wang HG, Pathan N, Ethell IM, et al. Ca2+-induced apoptosis through calcineurin dephosphorylation of BAD. Science. 1999;284(5412):339–343. [DOI] [PubMed] [Google Scholar]
- 82. Szlyk B, Braun CR, Ljubicic S, et al. A phospho-BAD BH3 helix activates glucokinase by a mechanism distinct from that of allosteric activators. Nat Struct Mol Biol. 2014;21(1):36–42. [DOI] [PMC free article] [PubMed] [Google Scholar]
- 83. Arnoux JB, Damaj L, Napuri S, et al. Aromatic L-amino acid decarboxylase deficiency is a cause of long-fasting hypoglycemia. J Clin Endocrinol Metab. 2013;98(11):4279–4284. [DOI] [PubMed] [Google Scholar]
- 84. Rosati G, Maioli M, Aiello I, Farris A, Agnetti V. Effects of long-term L-dopa therapy on carbohydrate metabolism in patients with Parkinson's disease. Eur Neurol. 1976;14(3):229–239. [DOI] [PubMed] [Google Scholar]
- 85. Eldrup E, Richter EA. DOPA, dopamine, and DOPAC concentrations in the rat gastrointestinal tract decrease during fasting. Am J Physiol Endocrinol Metab. 2000;279(4):E815–E822. [DOI] [PubMed] [Google Scholar]
- 86. Lindqvist A, Spégel P, Ekelund M, et al. Gastric bypass improves β-cell function and increases β-cell mass in a porcine model. Diabetes. 2014;63(5):1665–1671. [DOI] [PubMed] [Google Scholar]
- 87. Inabnet WB, Milone L, Harris P, et al. The utility of [(11)C] dihydrotetrabenazine positron emission tomography scanning in assessing β-cell performance after sleeve gastrectomy and duodenal-jejunal bypass. Surgery. 2010;147(2):303–309. [DOI] [PMC free article] [PubMed] [Google Scholar]
- 88. Service GJ, Thompson GB, Service FJ, Andrews JC, Collazo-Clavell ML, Lloyd RV. Hyperinsulinemic hypoglycemia with nesidioblastosis after gastric-bypass surgery. N Engl J Med. 2005;353(3):249–254. [DOI] [PubMed] [Google Scholar]
- 89. Weiss R. Effects of Roux-en-Y gastric bypass on β-cell function. Diabetes. 2014;63(4):1171–1173. [DOI] [PubMed] [Google Scholar]
- 90. Schauer PR, Kashyap SR, Wolski K, et al. Bariatric surgery versus intensive medical therapy in obese patients with diabetes. N Engl J Med. 2012;366(17):1567–1576. [DOI] [PMC free article] [PubMed] [Google Scholar]
- 91. Keidar A, Hershkop KJ, Marko L, et al. Roux-en-Y gastric bypass vs sleeve gastrectomy for obese patients with type 2 diabetes: a randomised trial. Diabetologia. 2013;56(9):1914–1918. [DOI] [PubMed] [Google Scholar]
- 92. Malandrucco I, Pasqualetti P, Giordani I, et al. Very-low-calorie diet: a quick therapeutic tool to improve β cell function in morbidly obese patients with type 2 diabetes. Am J Clin Nutr. 2012;95(3):609–613. [DOI] [PubMed] [Google Scholar]
- 93. Landsberg L, Taubin HL. Uptake and metabolism of L-3,4-dihydroxyphenylalanine (DOPA) in rat tissues. Biochem Pharmacol. 1973;22(22):2789–2800. [DOI] [PubMed] [Google Scholar]
- 94. Jiménez A, Ceriello A, Casamitjana R, Flores L, Viaplana-Masclans J, Vidal J. Remission of type 2 diabetes after Roux-en-Y gastric bypass or sleeve gastrectomy is associated with a distinct glycemic profile. Ann Surg. 2015;261(2):316–322. [DOI] [PubMed] [Google Scholar]
- 95. Sakano D, Shiraki N, Kikawa K, et al. VMAT2 identified as a regulator of late-stage β-cell differentiation. Nat Chem Biol. 2014;10(2):141–148. [DOI] [PubMed] [Google Scholar]