Abstract
Sorafenib (Nexavar®) is currently the only FDA-approved small molecule targeted therapy for advanced hepatocellular carcinoma. The use of structural analogues and derivatives of sorafenib has enabled the elucidation of critical targets and mechanism(s) of cell death for human cancer lines. We previously performed a structure-activity relationship study on a series of sorafenib analogues designed to investigate the inhibition overlap between the major targets of sorafenib Raf-1 kinase and VEGFR-2, and an enzyme shown to be a potent off-target of sorafenib, soluble epoxide hydrolase. In the current work, we present the biological data on our lead sorafenib analogue, t-CUPM, demonstrating that this analogue retains cytotoxicity similar to sorafenib in various human cancer cell lines and strongly inhibits growth in the NCI-60 cell line panel. Co-treatment with the pan-caspase inhibitor, Z-VAD-FMK, failed to rescue the cell viability responses of both sorafenib and t-CUPM, and immunofluorescence microscopy shows similar mitochondrial depolarization and apoptosis-inducing factor release for both compounds. These data suggest that both compounds induce a similar mechanism of caspase-independent apoptosis in hepatoma cells. In addition, t-CUPM displays anti-proliferative effects comparable to sorafenib as seen by a halt in G0/G1 in cell cycle progression. The structural difference between sorafenib and t-CUPM significantly reduces inhibitory spectrum of kinases by this analogue, and pharmacokinetic characterization demonstrates a 20-fold better oral bioavailability of t-CUPM than sorafenib in mice. Thus, t-CUPM may have the potential to reduce the adverse events observed from the multikinase inhibitory properties and the large dosing regimens of sorafenib.
Keywords: Sorafenib analogue, Hepatoma cells, Kinase selectivity profile, Pharmacokinetics, Caspase-independent cell death, NCI-60 cell lines
Introduction
Hepatocellular carcinoma (HCC) is the most common primary malignancy of the liver and is the third leading cause of cancer-related deaths worldwide [1, 2]. Currently, the only FDA-approved targeted therapy for advanced HCC is sorafenib (Nexavar®), a multikinase inhibitor originally designed to inhibit Raf-1 kinase [3–5]. Sorafenib was found to exhibit a broad inhibitory profile which includes vascular epithelial growth factor receptor (VEGFR), b-Raf kinase, p38α, ABL1, FLT-3, c-kit, Ret, fibroblast growth factor receptor (FGFR), and platelet-derived growth factor receptor [6–8]. This broad-spectrum inhibition on various signaling pathways results in a multitude of adverse effects in patients including the significant onset of hypertension [9], leading to intolerance and a large drop-off rate from a full course of therapy. In addition, poor absorption of sorafenib in the gastrointestinal tract results in large inter-individual variations in pharmacokinetics [10], thus requiring large dosing regimens. For these reasons, investigations of novel compounds that minimize sorafenib's disadvantages while not compromising its chemotherapeutic efficacy are of paramount importance.
Our previous work identified structural similarities between sorafenib and inhibitors of soluble epoxide hydro-lase (sEH), demonstrating that sorafenib displays potent inhibitory activity against sEH (IC50 = 12 nM) [11]. The inhibition of sEH results in biological responses including anti-inflammatory [12], antihypertensive [13], and analgesic [14], and the blood levels of sorafenib in cancer patients indicate there would be significant inhibition of sEH during treatment [15]. While these physiological responses are desirable for sorafenib treatment, the inhibition of sEH, in concert with the vascular endothelial growth factor (VEGF) pathway, also induces both pro-angiogenic and anti-angiogenic properties through interactions of its substrates, epoxyeicosatrienoic acids [16] and epoxydocosahexaenoic acids, respectively [17]. Thus, we hypothesized that the inhibition of the VEGF receptors by sorafenib may counterbalance the pro-angiogenic responses from the inhibition of sEH during sorafenib treatment.
Based on this hypothesis, we designed a structure–activity relationship (SAR) study to investigate the structural overlap between sorafenib and sEH inhibitors [18]. We observed that a major difference in the structural scaffolds between sorafenib and sEH inhibitors was the central phenyl-urea found in sorafenib and the central cyclohexyl-urea found in sEH inhibitors [19]. In this study, we introduce a novel sorafenib analogue, t-CUPM, and compare its cytotoxicity, kinase inhibition profile, and oral bioavailability to sorafenib.
Materials and methods
Synthesis of compounds
Sorafenib and sunitinib were purchased from LC Laboratories (Worburn, MA). All other compounds were synthesized as previously described [18].
Cell lines
The HepG2 human cell line was obtained from American Type Culture Collection (ATCC, Rockville, MD). The Huh-7 human cell line was provided by Prof. Mark Feitelson, Temple University, Philadelphia, PA. The PC-3 human cell line was provided by Prof. Maria Mudryj, UC Davis, Davis, CA. The SKBR3 and T47D cells were provided by Prof. Colleen Sweeney, UC Davis School of Medicine, Sacramento, CA. HepG2, Huh-7, and PC-3 cells were cultured in Eagle's minimum essential medium (EMEM) containing 10 % fetal bovine serum (FBS) and 1 % penicillin–streptomycin. SKBR3 cells were cultured in Dulbecco's modified Eagle medium containing 15 % FBS and 1 % penicillin–streptomycin. T47D cells were cultured in RPMI containing 10 % FBS, 10 mM HEPES, 1 mM sodium pyruvate, 14 mM glucose, 1 μg/mL insulin, and 1 % penicillin–streptomycin. All cells were incubated in 5 % CO2 at 37 °C.
Cell viability and caspase induction detection
Cells were plated at 10,000 cells per well in 96-well plates and allowed to attach overnight under the growth conditions described above. Test compounds were added to each well and incubated for the length of time as indicated. Compounds were dissolved in dimethyl sulfoxide (DMSO) and diluted with EMEM to the desired concentration of 0.1, 1.0, 5.0, 10, and 25 μM, with a final DMSO concentration of 0.1 % for all cell-based in vitro studies. Cell viability was determined using the MTT Cell Viability Assay Kit from ATCC according to manufacturer's instructions. The 96-well plates were measured at 570 nm using SpectroMax 190 plate reader (Molecular Devices, Sunnyvale, CA). The effective concentrations (EC50) were calculated using nonlinear regression analysis with the KaleidaGraph graphing program (Synergy Software). Caspase 3/7 activation was determined using Caspase-Glo 3/7 Assay kit (Promega, Madison, WI), and luminescence readings were performed using a SpectroFluor Plus luminescence plate reader (Tecan, San Jose, CA). All calculations were performed as described by the manufacturer.
Mitochondrial membrane depolarization and apoptosis-inducing factor release
Caspase-independent programmed cell death responses were determined by analyzing the mitochondrial membrane depolarization and release of apoptosis-inducing factor (AIF). HepG2 cells were seeded at 200,000 cells/well in 12-well plates containing an 18-mm glass coverslip. Cells were allowed to attach overnight and then incubated with test compounds at the indicated concentration for 6 h. Mitochondrial staining was performed by incubating cells with MitoTracker® Red CMXRos (Invitrogen, Carlsbad, CA) for 15 min. Cells were then rinsed with PBS and fixed in 4 % paraformaldehyde/PBS solution for 15 min. Fixed cells were permeabilized using 0.2 % Triton X-100/PBS for 5 min, washed, and then incubated with primary rabbit antibody against AIF (Cell Signaling Technology Inc., Beverly, MA) for 1 h. Cells were then treated with anti-rabbit Alexa Fluor® 488 secondary antibody (Cell Signaling Technology Inc., Beverly, MA) and incubated for an additional hour. Samples were then washed and placed cell side down onto a drop of DAPI-containing mounting solution (Vector Laboratories, Burlingame, CA) on a glass slide and dried for 30 min. Confocal fluorescence microscopy was carried out with an Olympus FV1000 laser point microscope, and data were analyzed using Olympus FLUOVIEW (FV10-ASW) Software Package.
Cell cycle analysis
Cell cycle analysis was performed using the Click-it® EdU Alexa Fluor® Flow Cytometry Assay Kit (Invitrogen, Carlsbad, CA). HepG2 cells were seeded at 1 × 10⁶ cells per well in six-well plates in serum-containing medium and allowed to recover prior to serum-free synchronization for 36 h. Cell proliferation was re-initiated with the addition of serum-containing medium for 1 h in the presence of EdU (5-ethynyl-2′-deoxyuridine) (10 μM). Cells were then incubated with the test compounds at the indicated concentration for 24 h. The cells were fixed and then incubated with the cell cycle dye 7-aminoactinomycin D (7-AAD) for 30 min just prior to analysis using a Becton–Dickinson (San Jose, CA) FACScan with a Cytek (Fremont, CA) ×P5 upgrade. Data acquisition and analysis were performed using BD CellQuest and FlowJo (Tree Star, Ashland, OR) software packages, respectively.
Immunoblot analysis
Huh-7 cells were plated at 500,000 cells per well in six-well plates in EMEM and allowed to recover overnight. The medium was then replaced with fresh media containing the desired concentrations of the test compounds at 0.1 % DMSO. Cells were then washed with cold PBS and lysed using cell lysis buffer [50 mM HEPES (pH 7.4), 4 mM EDTA, 100 mM sodium fluoride, 10 mM sodium pyrophosphate, and 1 % Triton X-100] containing protease and phosphotase inhibitors [100 mM phenylmethyl sulfonylfluoride (PMSF) and 100 mM sodium orthovandate, 1 mg/mL aprotinin]. The cell lysates were centrifuged at 20,000g for 15 min, and protein concentration was determined using BCA Protein Assay Reagent (Thermo Scientific, Rockford, IL). Twenty micrograms of protein from each sample was separated using SDS-PAGE gels (10 %) and transferred onto PVDF Immobilon-P transfer membrane (Millipore, Billerica, MA). Blots were probed with the anti-phospho-ERK, anti-phospho-STAT3 (Tyr750) (pSTAT3), and horse-radish peroxidase (HRP)-conjugated secondary antibody (Cell Signaling Technology Inc., Beverly, MA). Loading controls were determined by stripping each Western blot and re-probing for GAPDH. Blots were then developed with ECL plus Western blotting detection system from Amersham Hyperfilm (GE Healthcare, Piscataway, NJ). All experiments were performed in triplicate as previously performed [20].
Pharmacokinetic (PK) study of t-CUPM and sorafenib in mice
Male Swiss-Webster mice (10 weeks old, 30–35 g) were used for PK studies. Sorafenib and t-CUPM were dissolved in oleic acid-rich triglyceride containing 10 % PEG400 (v/v) to give a clear solution for cassette oral administration at a dose of 1 mg/kg (n = 3) as previously described [21]. Upon oral administration of these compounds, 10= μL of blood was collected from tail vein at time points 0, 0.25, 0.5, 1, 2, 4, 6, 8, 24, and 48 h. Analytes were detected by negative mode electrospray ionizations tandem quadrupole trap mass spectrometry in multiple reaction monitoring mode on a Trap 4000 Mass Spectrometer (ABI, Milford, MA). The parameters of MS condition were the same as previously described [11]. PK parameters were based on parent compound blood concentrations. The PK parameters were calculated from the blood concentration–time course, which showed the best fit (R2 > 0.9, Table 1) to a non-compartmental model (WinNonlin software, Pharsight, Mountainview, CA). To assess overall exposure to sorafenib and t-CUPM, AUC was calculated from time 0.5 to 48 h from the blood concentration–time curve using the trapezoidal rule.
Table 1.
Comparison of half-maximum effective concentration (EC50) values (μM) on the cell viability of various cancer cell lines
| Compound name | Structures | EC50 (μ,M)a |
|||||
|---|---|---|---|---|---|---|---|
| Liver |
Kidney | Prostate | Breast |
||||
| HepG2 | Huh-7 | ACHN | PC-3 | T47D | SKBR3 | ||
| Sorafenib |
|
4.5 ± 0.7 | 4.2 ± 0.5 | 4.0 ± 0.5 | 5.5 ± 0.8 | 3.0 ± 0.5 | 6.5 ± 0.5 |
| t-CUPM |
|
7.0 ± 0.7 | 8.0 ± 0.6 | 7.5 ± 0.7 | 7.0 ± 1.0 | 5.0 ± 0.8 | 7.0 ± 5.0 |
| Sunitinib |
|
7.5 ± 0.8 | 8.0 ± 0.9 | 8.0 ± 1.0 | 8.0 ± 0.5 | 12.0 ± 1.0 | 10.0 ± 0.9 |
Data presented as mean standard deviation
Cell viability was determined using MTT assay after 72-h treatment and performed in 96-well plates with 10,000 cells/well
Kinase selective profiling
Inhibition of kinases was screened by the KinaseSeeker™ assay with Luceome Biotechnologies, LLC (Tucson, AZ) as previously described [22]. All compounds were dissolved in DMSO and tested in duplicate at a final concentration of 10 μM for all recombinant kinase assays.
Statistical analysis
Data were analyzed using one-way analysis of variance followed by Student–Newman–Keuls post hoc analysis for pairwise multiple comparison, using Sigma Plot software suite. A p value <0.05 was considered statistically significant.
Results
t-CUPM exhibits strong cytotoxic responses in variety of tumor cell lines and in the NCI-60 cell line screen
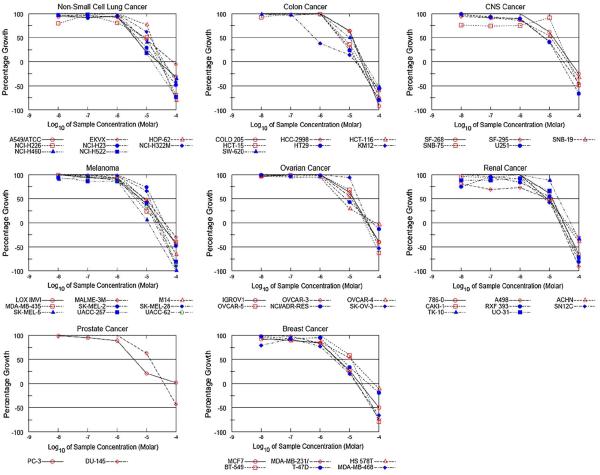
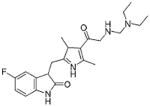
Our previous work demonstrated that t-CUPM exhibited cytotoxicity comparable to sorafenib in hepatoma cell lines [18]. Here, we compared the cytotoxicity of t-CUPM to both sorafenib and the multikinase inhibitor sunitinib in various tumor cell lines. Sunitinib is currently FDA approved for renal cancer [23] and has been investigated as a treatment option of HCC patients unresponsive to sorafenib [24]. As seen in Table 1, t-CUPM displayed cytotoxicity comparable to sorafenib and sunitinib in the entire set of human tumor cell lines screened in house. Based on these data, we promptly submitted t-CUPM for the NCI-60 human tumor cell line screen. The NCI-60 screening data yields three parameters: growth inhibition (GI50), total growth inhibition (TGI), and lethal concentration (LC50). Results from this screening demonstrated that t-CUPM displays significant growth inhibitory effects across many cancer cell lines (Fig. 1). Nineteen different cell lines displayed GI50 of <0 μM, and one cell line in particular, KM12 (colon cancer), was exceptionally susceptible to t-CUPM treatment (GI50 = 0.64 μM) (Fig. 1). In addition, the effectiveness of t-CUPM in the NCI-60 cell line screen was found to be in the range of FDA-approved anti-cancer therapies (Table 2) [25].
Fig. 1.
NCI-60 human tumor cell line screen data from t-CUPM treatment. 51 cell lines from various cancer types were screened according to the NCI-60 cell line screening procedure. Comparison of the NCI-60 data for t-CUPM to known FDA-approved targeted therapies is presented in Table 2
Table 2.
Comparison of t-CUPM to selected FDA-approved targeted drugs in the NCI-60 panel
| Compound | Potency (μM) |
||
|---|---|---|---|
| Mean GI50 | Mean TGI50 | Mean LC50 | |
| t-CUPM | 9.0 | 34 | 82 |
| Sorafenib (Nexavar®)a | 1.9 | 6.0 | 30 |
| Sunitinib (Sutent®)a | 2.2 | 9.6 | 31 |
| Gefitinib (Iressa®)a | 3.2 | 19 | 49 |
| Erlotinib (Tarceva®)a | 5.5 | 59 | >90 |
| Imatinib (Gleevac®)a | 15 | 43 | 81 |
Data presented as the average response from all cell lines tested
Data from Ref. [25]
t-CUPM displays reduced broad-spectrum kinase inhibition
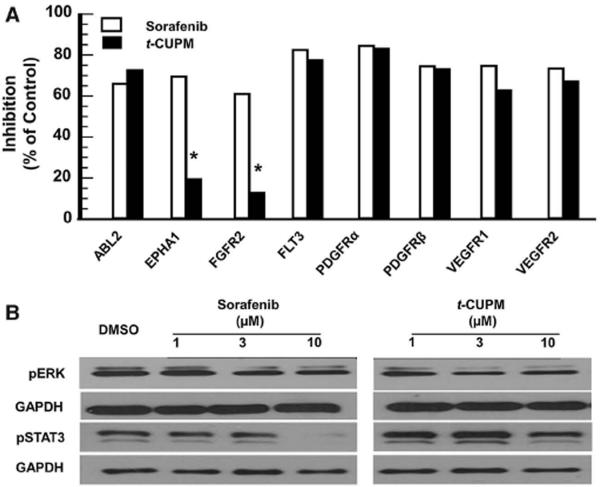
A broad-spectrum inhibition on kinases by sorafenib is directly linked to clinical side effects [9]. Therefore, increasing specificity without sacrificing effectiveness is of great interest for the next generation of sorafenib-like multikinase inhibitors. The SAR in which t-CUPM was synthesized identified the critical structural attributes required for Raf-1 kinase and VEGFR2 inhibition [18]. To further understand the differences in kinase selectivity between sorafenib and t-CUPM, both compounds were screened against a panel of known sorafenib targets (Fig. 2a). The introduction of the cyclohexyl-urea moiety in the structure of t-CUPM reduced its kinase inhibitory activity toward FGFR2 and EPHA1. Interestingly, both of these kinases have been implicated in HCC [26, 27]; however, the similarities in the cytotoxicity between sorafenib and t-CUPM in hepatoma cells suggest that the inhibition of FGFR2 and EPHA1 may not be involved in the mechanism of sorafenib-induced hepatoma cell death. In addition to the reduced selectivity toward the chosen panel of kinases, our SAR study demonstrated t-CUPM exhibited a 40-fold loss in the activity toward oncogenic b-Raf (V600E) kinase [18]. Overexpression or activation of b-Raf kinase has not been associated with HCC [28], which is likely a distinct advantage of t-CUPM over sorafenib potentially reducing b-Raf kinase related off-target effects.
Fig. 2.
Comparison of the kinase inhibitory profile of sorafenib and t-CUPM. a Selected kinase targets of sorafenib were screened for inhibition at 10 μM test concentrations. Data were collected from a 2-point kinase screen, limiting statistical analysis calculations. However, a change in inhibition of >40 % is deemed significant for these data. b Comparison of sorafenib and t-CUPM on the suppression of the RAF/MEK/ERK and JAKs/STAT3 signaling pathways using western blot analysis. HepG2 cells were exposed to compounds for 24 h at indicated concentrations. Note that the apparent suppression of total ERK by sorafenib is considered an artifact
To further characterize the biological differences between t-CUPM and sorafenib, we evaluated two relevant mitogenic/apoptotic pathways that have been shown to be linked to HCC: Raf/MEK/ERK and JAKs/STAT pathways. ERK phosphorylation is a downstream indicator of Raf-1 kinase inhibition previously shown to be inhibited by sorafenib [29], and the inhibition of STAT3 phosphorylation was shown to be important for sorafenib-induced hepatoma cell cytotoxicity [30]. Similar effects on ERK phosphorylation were observed for both compounds consistent with our recombinant Raf-1 kinase inhibition data (IC50 = 45 and 75 nM for sorafenib and t-CUPM, respectively [18]); however, t-CUPM was not as effective as sorafenib in suppressing STAT3 phosphorylation at 10 μM (Fig. 2b). Recent work has demonstrated that sorafenib inhibits SHP-1, a phosphatase responsible for the phosphorylation state of STAT3 [30]. These data support the claim that t-CUPM is more selective than sorafenib without significantly affecting overall cytotoxicity.
t-CUPM induces caspase activation similar to sorafenib in hepatoma cells
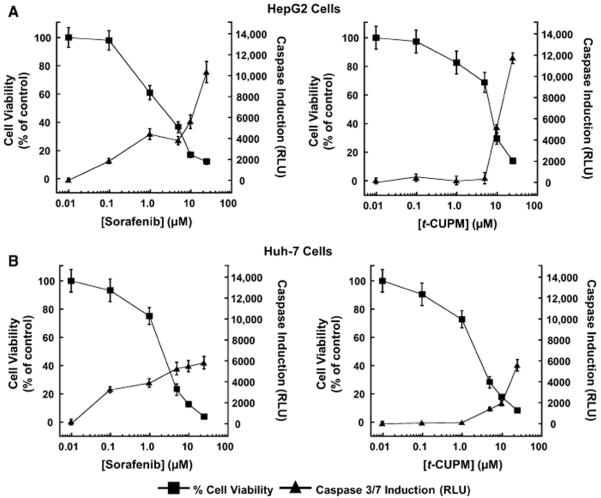
Sorafenib exhibits unique cell line-specific apoptotic responses [31–34]. Surprisingly, the mechanism of hepatoma cell death has yet to be fully investigated. Thus, we first investigated caspase-dependent apoptosis in HepG2 and Huh-7 cell lines. t-CUPM displayed levels of caspase induction similar to sorafenib at high concentrations (25 μM), but sorafenib-induced caspase activation was observable at levels as low as 0.1 μM in both cell lines (Fig. 3). However, the EC50 for t-CUPM was <twofold of that of sorafenib and identical to that of sunitinib, suggesting that caspase activation may not be a significant contributing factor in the overall mechanism of cell death.
Fig. 3.
t-CUPM exhibits similar caspase-dependent apoptosis to sorafenib. Dose response effects of sorafenib and t-CUPM on HepG2 (a) and Huh-7 (b) cell viability and caspase 3/7 induction. Data for cell viability (MTT assay) and caspase 3/7 induction (luminescence) were determined after a 72-h incubation period for each compound
t-CUPM and sorafenib exhibit conserved caspase-independent apoptosis
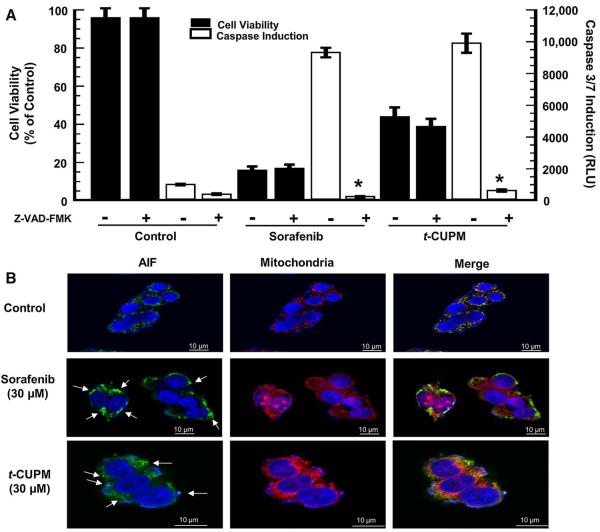
Caspase-independent apoptosis has previously not been identified as a sorafenib-induced hepatoma cellular response. Thus, we first investigated if abolishing caspase activity with the pan-caspase inhibitor, Z-VAD-FMK, during treatment with either sorafenib or t-CUPM, and observed no protective effect in the first 24 h of cell death (Fig. 4a). These data indicated that both sorafenib and t-CUPM elicited a caspase-independent component in the early stages of apoptosis. We then examined the possible role of the AIF. Under a normal cellular condition, this proapoptotic protein is localized in the mitochondria [35, 36] which was observed in the control sample. The Alexa Fluor® 488-labeled AIF protein overlays with the MitoTracker® Red-labeled mitochondria indicating co-localization (Fig. 4b). However, the initiation of the caspase-independent cell death pathway can result in mitochondrial membrane depolarization and release of AIF, which was observed for both compounds. These responses were seen after only 6 h of exposure, suggesting that sorafenib and t-CUPM elicit hepatoma cell death in part, through a caspase-independent mechanism that is potentially related to AIF.
Fig. 4.
t-CUPM exhibits similar caspase-independent apoptosis. a HepG2 cells were pre-incubated for 60 min with the pan-caspase inhibitor, Z-VAD-FMK (20 μM), prior to 24-h incubation with 30 μM of test compound. *P value < 0.05 as compared to Z-VAD-FMK addition. b HepG2 cells were incubated at 30 μM of each compound for 6 h. MitoTracker® Red CMXRos and DAPI were used to stain mitochondria and nuclei, respectively. AIF primary antibody was stained using Alexa Fluor® 488 conjugated secondary antibody. Arrows show areas of AIF nuclear accumulation after mitochondrial depolarization
t-CUPM displays effect similar to sorafenib on cell cycle progression
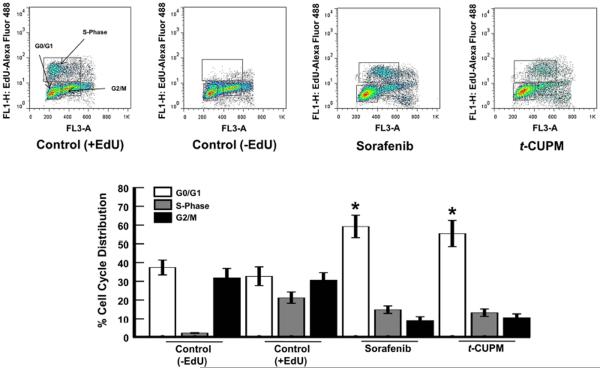
To determine whether the effects on cell viability by t-CUPM were associated with anti-proliferative responses, we compared the effects to sorafenib on cell cycle progression. Cell cycle analysis was performed with FACScan using the incorporation of EdU (5-ethynyl-2′-deoxyuridine) as an indicator of newly synthesized DNA. After 24-h exposure, t-CUPM caused an identical arrest in G0/G1 transition in HepG2 cells at concentrations similar to that of sorafenib (Fig. 5). These data confirm that t-CUPM and sorafenib display similar cytotoxicity and anti-proliferation in hepatoma cells, despite their differences in broad-spectrum inhibition.
Fig. 5.
t-CUPM exhibits similar anti-proliferative responses to sorafenib. Effects of sorafenib and t-CUPM on hepatoma cell cycle distribution. HepG2 cells were exposed at concentrations of 30 μM for 24 h and fluorescence detection of incorporated EdU, and 7AAD was analyzed by flow cytometry. *P value < 0.05 (n = 3) as compared to DMSO control (+EdU)
t-CUPM exhibits significantly improved oral bioavailability compared with sorafenib
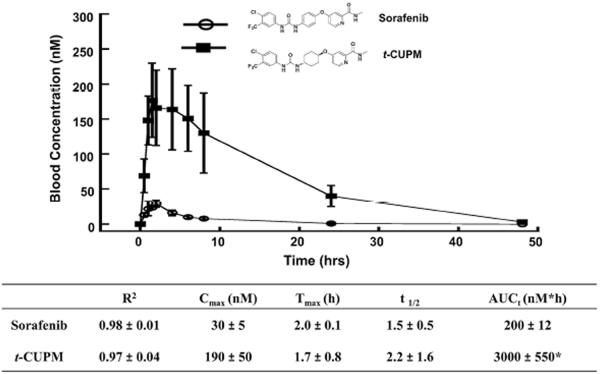
Sorafenib has poor bioavailability, which leads to large inter-individual variations in pharmacokinetics [10, 15]. sEH inhibitor design from our laboratory has led to the development of cyclohexyl-urea containing compounds with excellent oral bioavailability [19, 21]. Direct comparison of the pharmacokinetic profiles between sorafenib and t-CUPM upon oral administration of these compounds to mice (1 mg/kg) revealed t-CUPM displayed nearly tenfold higher blood levels than that of sorafenib from 0.5 to 48 h (Fig. 6). Both compounds showed similar rapid absorption as indicated by their Tmax values; however, t-CUPM reached a higher Cmax than the sorafenib at all of the time points evaluated. As a result, t-CUPM displayed significantly higher AUCt and thus a better overall exposure compared to sorafenib.
Fig. 6.
Comparison of the pharmacokinetic profiles of sorafenib and t-CUPM. PK study was performed by cassette oral administration at a dose of 1 mg/kg (n = 3) in mice. R2 is the square of the correlation coefficient between predict and observed value; Tmax the time of maximum concentration, Cmax the maximum blood concentration, t1/2 half-life, and AUCt area under the concentration–time curve to terminal time. *P value < 0.05 as compared to the AUCt of sorafenib
Discussion
Sorafenib has revolutionized targeted therapies for the treatment of cancer; however, poor oral bioavailability has lead to large dosing regimens, and broad-spectrum inhibition results in significant side effects [37]. Our laboratory previously demonstrated that sorafenib is not only a multikinase inhibitor, but also a potent inhibitor of sEH [11], leading to our most recent work describing a series of sorafenib analogues which combined the structural features of sorafenib and sEH inhibitors [18]. Here, we introduce a novel sorafenib analogue, t-CUPM, which has more selective inhibition with better oral bioavailability than sorafenib.
Our preliminary studies with t-CUPM have demonstrated that this analogue has comparable cytotoxicity to both sorafenib and sunitinib in various human tumor cell lines (Table 1). Based on these positive data, t-CUPM was chosen for the NCI-60 cell line screen. The cytotoxicity of t-CUPM was as effective as many FDA-approved molecularly target agents in the NCI-60 screening panel, with parameters most similar to that of imatinib (Gleevac®) (Table 2). Interestingly, imatinib displays a broader spectrum of kinase inhibition than that of sorafenib [6], indicating that selectivity does not directly correlate with the NCI-60 screening parameters. From these data, it is clear that t-CUPM may be potentially effective in a variety of tumor models.
Previous research indicates that the mechanism of sorafenib-induced cell death is cancer cell type specific. Sorafenib induced caspase-dependent cell death in models of prostate cancer and chronic lymphatic leukemia [31, 32], but caspase-independent cell death in melanoma cells [33] and in malignant pleural mesothelioma [34]. Surprisingly, although sorafenib is FDA approved for HCC, its mechanism of programmed cell death in hepatoma cells has yet to be fully elucidated. Here, we demonstrate that abolishing caspase activity does not affect the cytotoxicity of either sorafenib or t-CUPM, indicating that caspase-independent pathways are the primary contributor to sorafenib-induced programmed cell death in the early stages of apoptosis in hepatoma cells. t-CUPM was observed to be more selective than sorafenib in our kinase panel; thus, the reduced broad-spectrum inhibition compared with sorafenib does not affect the overall mechanism of cell death.
Sorafenib has poor bioavailability, initiating a few studies to improve the pharmacokinetic profile of sorafenib by changing delivery systems such as microemulsion or nanoparticle technologies [38, 39]. However, there has been little attention on how modifications to the structural scaffold of sorafenib may affect pharmacokinetics. Our study shows that t-CUPM displays markedly higher blood levels and a better AUCt compared with sorafenib following oral dosing in mice. This better ADME in mice could result in lower dosing regimens, thus having the potential to reduce the adverse events among patients [10].
In conclusion, direct comparison with sorafenib shows t-CUPM improves on two deficiencies of sorafenib which lead to its significant adverse events: oral bioavailability and broad-spectrum kinase inhibition. This analogue retains (1) inhibition of sEH, VEGFR2, and Raf-1 kinase, (2) the desire therapeutic responses such as growth inhibition through cell cycle arrest and caspase-independent apoptosis induction, and (3) improved oral bioavailability. Thus, t-CUPM has the potential to reduce the dose-dependent side effects of sorafenib. The novel structural scaffold of t-CUPM allows for further tailoring of kinase selectivity for future targeted therapies.
Acknowledgments
We thank Dr. Michael Praddy of the MCB Imaging Facility for help with collecting and analyzing our immunohistochemical data on the Olympus FV100 laser point scanning microscope. Special thanks to Carol Oxford and the UCD Flow Cytometry Shared Resource facility for help with collecting and analyzing cell cycle data. This work was supported in part by NIEHS Grant ES02710, NIEHS Superfund Grant P42 ES04699, and NIHLB Grant HL059699 (all to B.D.H.). This work was also supported by NIH Grants 5UO1CA86402 (Early Detection Research Network), 1R01CA135401-01A1, and 1R01DK082690-01A1 (all to R.H.W.), and the Medical Service of the US Department of Veterans' Affairs (R.H.W.). A.T.W. was support by Award No. T32CA108459 from the National Institutes of Health. B.D.H. is a George and Judy Marcus senior fellow of the American Asthma Foundation.
Abbreviations
- HCC
Hepatocellular carcinoma
- t-CUPM
trans-4-{4-[3-(4-Chloro-3-trifluoromethylphenyl)-ureido]-cyclohexyloxy-pyridine-2- carboxylic acid methylamide
Footnotes
Conflict of interest None declared.
References
- 1.Sherman M. Epidemiology of hepatocellular carcinoma. Oncology. 2010;78(Suppl 1):7–10. doi: 10.1159/000315223. [DOI] [PubMed] [Google Scholar]
- 2.Jemal A, et al. Cancer statistics, 2009. CA Cancer J Clin. 2009;59(4):225–249. doi: 10.3322/caac.20006. [DOI] [PubMed] [Google Scholar]
- 3.Zhang T, et al. Sorafenib improves the survival of patients with advanced hepatocellular carcinoma: a meta-analysis of randomized trials. Anticancer Drugs. 2010;21(3):326–332. doi: 10.1097/CAD.0b013e3283350e26. [DOI] [PubMed] [Google Scholar]
- 4.Furuse J. Sorafenib for the treatment of unresectable hepatocellular carcinoma. Biologics. 2008;2(4):779–788. doi: 10.2147/btt.s3410. [DOI] [PMC free article] [PubMed] [Google Scholar]
- 5.Lowinger TB, et al. Design and discovery of small molecules targeting raf-1 kinase. Curr Pharm Des. 2002;8(25):2269–2278. doi: 10.2174/1381612023393125. [DOI] [PubMed] [Google Scholar]
- 6.Liu H, et al. Enhanced selectivity profile of pyrazole-urea based DFG-out p38alpha inhibitors. Bioorg Med Chem Lett. 2010;20(16):4885–4891. doi: 10.1016/j.bmcl.2010.06.073. [DOI] [PubMed] [Google Scholar]
- 7.Wilhelm SM, et al. BAY 43-9006 exhibits broad spectrum oral antitumor activity and targets the RAF/MEK/ERK pathway and receptor tyrosine kinases involved in tumor progression and angiogenesis. Cancer Res. 2004;64(19):7099–7109. doi: 10.1158/0008-5472.CAN-04-1443. [DOI] [PubMed] [Google Scholar]
- 8.Wilhelm S, et al. Discovery and development of sorafenib: a multikinase inhibitor for treating cancer. Nat Rev Drug Discov. 2006;5(10):835–844. doi: 10.1038/nrd2130. [DOI] [PubMed] [Google Scholar]
- 9.Wood LS. Management of vascular endothelial growth factor and multikinase inhibitor side effects. Clin J Oncol Nurs. 2009;13(Suppl):13–18. doi: 10.1188/09.CJON.S2.13-18. [DOI] [PubMed] [Google Scholar]
- 10.Strumberg D, et al. Results of phase I pharmacokinetic and pharmacodynamic studies of the Raf kinase inhibitor BAY 43-9006 in patients with solid tumors. Int J Clin Pharmacol Ther. 2002;40(12):580–581. doi: 10.5414/cpp40580. [DOI] [PubMed] [Google Scholar]
- 11.Liu JY, et al. Sorafenib has soluble epoxide hydrolase inhibitory activity, which contributes to its effect profile in vivo. Mol Cancer Ther. 2009;8(8):2193–2203. doi: 10.1158/1535-7163.MCT-09-0119. [DOI] [PMC free article] [PubMed] [Google Scholar]
- 12.Schmelzer KR, et al. Soluble epoxide hydrolase is a therapeutic target for acute inflammation. Proc Natl Acad Sci USA. 2005;102(28):9772–9777. doi: 10.1073/pnas.0503279102. [DOI] [PMC free article] [PubMed] [Google Scholar]
- 13.Chiamvimonvat N, et al. The soluble epoxide hydrolase as a pharmaceutical target for hypertension. J Cardiovasc Pharmacol. 2007;50(3):225–237. doi: 10.1097/FJC.0b013e3181506445. [DOI] [PubMed] [Google Scholar]
- 14.Inceoglu B, et al. Soluble epoxide hydrolase and epoxyeicosatrienoic acids modulate two distinct analgesic pathways. Proc Natl Acad Sci USA. 2008;105(48):18901–18906. doi: 10.1073/pnas.0809765105. [DOI] [PMC free article] [PubMed] [Google Scholar]
- 15.van Erp NP, Gelderblom H, Guchelaar HJ. Clinical pharmacokinetics of tyrosine kinase inhibitors. Cancer Treat Rev. 2009;35(8):692–706. doi: 10.1016/j.ctrv.2009.08.004. [DOI] [PubMed] [Google Scholar]
- 16.Webler AC, et al. Epoxyeicosatrienoic acids are part of the VEGF-activated signaling cascade leading to angiogenesis. Am J Physiol Cell Physiol. 2008;295(5):C1292–C1301. doi: 10.1152/ajpcell.00230.2008. [DOI] [PMC free article] [PubMed] [Google Scholar]
- 17.Zhang G, et al. Epoxy metabolites of docosahexaenoic acid (DHA) inhibit angiogenesis, tumor growth, and metastasis. Proc Natl Acad Sci USA. 2013;110(16):6530–6535. doi: 10.1073/pnas.1304321110. [DOI] [PMC free article] [PubMed] [Google Scholar]
- 18.Hwang SH, et al. Synthesis and biological evaluation of sorafenib- and regorafenib-like sEH Inhibitors. BMCL. 2013;23(13):3732–3737. doi: 10.1016/j.bmcl.2013.05.011. [DOI] [PMC free article] [PubMed] [Google Scholar]
- 19.Hwang SH, et al. Orally bioavailable potent soluble epoxide hydrolase inhibitors. J Med Chem. 2007;50(16):3825–3840. doi: 10.1021/jm070270t. [DOI] [PMC free article] [PubMed] [Google Scholar]
- 20.Inoue H, et al. Sorafenib attenuates p21 in kidney cancer cells and augments cell death in combination with DNA-damaging chemotherapy. Cancer Biol Ther. 2011;12(9):827–836. doi: 10.4161/cbt.12.9.17680. [DOI] [PMC free article] [PubMed] [Google Scholar]
- 21.Rose TE, et al. 1-Aryl-3-(1-acylpiperidin-4-yl)urea inhibitors of human and murine soluble epoxide hydrolase: structure–activity relationships, pharmacokinetics, and reduction of inflammatory pain. J Med Chem. 2010;53(19):7067–7075. doi: 10.1021/jm100691c. [DOI] [PMC free article] [PubMed] [Google Scholar]
- 22.Jester BW, et al. A coiled-coil enabled split-luciferase three-hybrid system: applied toward profiling inhibitors of protein kinases. J Am Chem Soc. 2010;132(33):11727–11735. doi: 10.1021/ja104491h. [DOI] [PMC free article] [PubMed] [Google Scholar]
- 23.Sulkes A. Novel multitargeted anticancer oral therapies: sunitinib and sorafenib as a paradigm. Isr Med Assoc J. 2010;12(10):628–632. [PubMed] [Google Scholar]
- 24.Worns MA, et al. Sunitinib in patients with advanced hepatocellular carcinoma after progression under sorafenib treatment. Oncology. 2010;79(1–2):85–92. doi: 10.1159/000320363. [DOI] [PubMed] [Google Scholar]
- 25.Holbeck SL, Collins JM, Doroshow JH. Analysis of Food and Drug Administration-approved anticancer agents in the NCI60 panel of human tumor cell lines. Mol Cancer Ther. 2010;9(5):1451–1460. doi: 10.1158/1535-7163.MCT-10-0106. [DOI] [PMC free article] [PubMed] [Google Scholar]
- 26.Harimoto N, et al. The significance of fibroblast growth factor receptor 2 expression in differentiation of hepatocellular carcinoma. Oncology. 2010;78(5–6):361–368. doi: 10.1159/000320463. [DOI] [PubMed] [Google Scholar]
- 27.Chen G, et al. EphA1 receptor silencing by small interfering RNA has antiangiogenic and antitumor efficacy in hepatocellular carcinoma. Oncol Rep. 2010;23(2):563–570. [PubMed] [Google Scholar]
- 28.Tannapfel A, et al. Mutations of the BRAF gene in cholangio-carcinoma but not in hepatocellular carcinoma. Gut. 2003;52(5):706–712. doi: 10.1136/gut.52.5.706. [DOI] [PMC free article] [PubMed] [Google Scholar]
- 29.Liu L, et al. Sorafenib blocks the RAF/MEK/ERK pathway, inhibits tumor angiogenesis, and induces tumor cell apoptosis in hepatocellular carcinoma model PLC/PRF/5. Cancer Res. 2006;66(24):11851–11858. doi: 10.1158/0008-5472.CAN-06-1377. [DOI] [PubMed] [Google Scholar]
- 30.Tai WT, et al. Signal transducer and activator of transcription 3 is a major kinase-independent target of sorafenib in hepato-cellular carcinoma. J Hepatol. 2011;55(5):1041–1048. doi: 10.1016/j.jhep.2011.01.047. [DOI] [PubMed] [Google Scholar]
- 31.Huang R, et al. The multikinase inhibitor sorafenib induces caspase-dependent apoptosis in PC-3 prostate cancer cells. Asian J Androl. 2010;12(4):527–534. doi: 10.1038/aja.2010.21. [DOI] [PMC free article] [PubMed] [Google Scholar]
- 32.Fecteau JF, et al. Sorafenib-induced apoptosis of chronic lymphocytic leukemia cells is associated with downregulation of RAF and Mcl-1. Mol Med. 2011;18(1):19–28. doi: 10.2119/molmed.2011.00164. [DOI] [PMC free article] [PubMed] [Google Scholar]
- 33.Panka DJ, et al. The Raf inhibitor BAY 43-9006 (sorafenib) induces caspase-independent apoptosis in melanoma cells. Cancer Res. 2006;66(3):1611–1619. doi: 10.1158/0008-5472.CAN-05-0808. [DOI] [PubMed] [Google Scholar]
- 34.Katz SI, et al. Sorafenib inhibits ERK1/2 and MCL-1(L) phosphorylation levels resulting in caspase-independent cell death in malignant pleural mesothelioma. Cancer Biol Ther. 2009;8(24):2406–2416. doi: 10.4161/cbt.8.24.10824. [DOI] [PMC free article] [PubMed] [Google Scholar]
- 35.Joza N, et al. Essential role of the mitochondrial apoptosis-inducing factor in programmed cell death. Nature. 2001;410(6828):549–554. doi: 10.1038/35069004. [DOI] [PubMed] [Google Scholar]
- 36.Norberg E, Orrenius S, Zhivotovsky B. Mitochondrial regulation of cell death: processing of apoptosis-inducing factor (AIF) Biochem Biophys Res Commun. 2010;396(1):95–100. doi: 10.1016/j.bbrc.2010.02.163. [DOI] [PubMed] [Google Scholar]
- 37.Jain L, et al. Hypertension and hand-foot skin reactions related to VEGFR2 genotype and improved clinical outcome following bevacizumab and sorafenib. J Exp Clin Cancer Res. 2010;29:95. doi: 10.1186/1756-9966-29-95. [DOI] [PMC free article] [PubMed] [Google Scholar]
- 38.Liu Y-O, et al. Preparation of sorafenib selfmicroemulsifying drug delivery system and its relative bioavailability in rats. J Chin Pharm Sci. 2011;20:164–170. [Google Scholar]
- 39.Wang XQ, et al. Bioavailability and pharmacokinetics of sorafenib suspension, nanoparticles and nanomatrix for oral administration to rat. Int J Pharm. 2011;419(1–2):339–346. doi: 10.1016/j.ijpharm.2011.08.003. [DOI] [PubMed] [Google Scholar]


