

Summary
The present study shows that cholera-toxin suppresses azoxymethane-initiated, dextran sodium sulfate-promoted colonic polypoidogenesis in mice. The oral administration of cholera-toxin disrupts the tumor-promoting character of colitis, by downregulating neutrophils and upregulating regulatory T-cells and IL-10 in the colonic mucosa.
Abstract
Human studies and clues from animal models have provided important links between gastrointestinal (GI) tract bacteria and colon cancer. Gut microbiota antigenic stimuli play an important role in shaping the intestinal immune responses. Therefore, especially in the case of inflammation-associated colon cancer, gut bacteria antigens may affect tumorigenesis. The present study aimed to investigate the effects of the oral administration of a bacterial product with known immunomodulatory properties on inflammation-driven colorectal neoplasmatogenesis. For that, we used cholera-toxin and a well-established mouse model of colon cancer in which neoplasia is initiated by a single dose of the genotoxic agent azoxymethane (AOM) and subsequently promoted by inflammation caused by the colitogenic substance dextran sodium sulfate (DSS). We found that a single, low, non-pathogenic dose of CT, given orally at the beginning of each DSS treatment cycle downregulated neutrophils and upregulated regulatory T-cells and IL-10 in the colonic mucosa. The CT-induced disruption of the tumor-promoting character of DSS-induced inflammation led to the reduction of the AOM-initiated colonic polypoidogenesis. This result adds value to the emerging notion that certain GI tract bacteria or their products affect the immune system and render the microenvironment of preneoplastic lesions less favorable for promoting their evolution to cancer.
Introduction
The prevalence of certain neoplasms, including colorectal cancer (CRC), is alarmingly high in the industrialized world (1). In recent years, human studies and clues from animal models have provided important links between gastrointestinal (GI) tract bacteria and colon cancer (2,3). Gut microbiota antigenic stimuli play an important role in shaping the intestinal immune responses (4). Therefore, at least in the case of inflammation-associated colon cancer, gut bacteria antigens may influence carcinogenesis (5–7).
In a series of studies in mice we have shown that some GI tract bacteria induce regulatory T-cells (Treg) of increased anti-inflammatory potency, which in turn counteract epithelial tumors throughout the body, instead of promoting them through anti-tumor immunity downregulation (6,8–11). Importantly, the bacteria-primed Treg activate clinically silent local GI tract and systematic immunity networks, which confer decreased risk of epithelial carcinogenesis (10,11). These findings are in line with the recognized importance of immune cells and factors in tumor evolution and their emergence as key elements of the tumor micro- and macro-environment (12). Further, they suggest that tumor survival and progression may be more vitally dependent on elevated and sustained local and systematic proinflammatory signaling than previously thought (6,12).
Following this reasoning, the use of selected bacterial antigens to modulate cancer-promoting inflammatory events is worth exploring (2,5,6). These products may be a safe and effective approach for reinforcing the regulatory arm of the human immune system. Ideally, they may contribute to the decrease of the modern living-associated uncontrolled inflammation and cancer risk at the population level (6,8,13).
The small intestinal pathogenic bacterium Vibrio cholerae is the causative agent of cholera. The developing world is not endemic, however, cholera is endemic in the developing world (14). The major pathogenic factor of V.cholerae is cholera-toxin (CT), a protein exotoxin responsible for the life-threatening massive diarrhea, which is the main clinical presentation of cholera (14). CT’s mode of pathogenic action has been well characterized (14,15). The bulk of research now focuses more on its powerful immune response adjuvant and immunomodulating properties (15,16). Orally introduced CT in low, non-pathogenic doses alters gut mucosal immunity and effectively enhances the induction of antigen-specific oral tolerance (15–17). For that, CT is considered an attractive component of oral tolerance-based immunotherapy schemes for the treatment of immune-related disorders (15–17). CT activates antigen-presenting cells (16,18–21), induces Tregs and expands their population (16,17,19), affects the expression of cytokines and modulates both Th1 and Th2 immune responses (16,17,20,22). Interestingly, these immune events have been shown to affect carcinogenic processes (12).
In the present study, we sought to examine the effects of CT oral administration on colorectal neoplasmatogenesis. For that, we used a well-established mouse model of CRC in which cancer is initiated by a single dose of the genotoxic agent azoxymethane (AOM) and subsequently promoted by inflammation caused by the colitogenic substance dextran sodium sulfate (DSS) (23). We found that by downregulating neutrophils and upregulating Treg and IL-10, CT alters the inflammatory milieu of cancer-promoting colitis and decreases the risk of CRC.
Materials and methods
Animals
Specific pathogen-free certified BALB/cJ mice were purchased from Jackson Laboratories (Bar Harbor, ME). Mice were kept bio-contained in static micro-isolator cages, fed with sterilized regular mouse chow, and given sterilized water. Their helicobacter-free status was confirmed by polymerase chain reaction (PCR) as described previously (24). Animal experiments were approved by the Faculty of Veterinary Medicine, Aristotle University of Thessaloniki and licensed by the National Veterinary Administration authorities (License No. 13/10621/11.08.2008).
Experimental design
A total of 90 male mice were used. At the age of 5–6 weeks mice were injected with a single i.p. injection of the carcinogen AOM (10mg/kg of body weight). One week later, 1% DSS (molecular weight: 36–50kDa; MP Biomedicals, Cleveland, OH) was given in the drinking water for 1 week followed by 1 week of regular water. This cycle was repeated three times. At the first day of each cycle of DSS exposure, 10 μg of CT were inoculated by gastric gavage. Mice were either treated with DSS, AOM and CT in all possible combinations or remained untreated. Mice were killed either at 3.5 months (first experiment—long term) or at 3 days (second experiment—short term) after the last week of DSS exposure. Numbers of mice per experimental group for each experiment were as follows: first experiment: Control (n = 10), CT (n = 10), DSS (n = 10), AOM (n = 10), DSS-CT (n = 10), AOM-CT (n = 10), AOM-DSS (n = 10), AOM-DSS-CT (n = 10); second experiment: AOM-DSS (n = 5), AOM-DSS-CT (n = 5).
Necropsy and tissue sampling
Mice were killed with an overdose of isofluorane, weighted and necropsied. The colon of mice was removed, cut-open and photographed in high resolution for grossly visible polyp counts. For gene expression analysis 1cm colon samples were collected from a standard area of the proximal part of descending colon, immediately immersed in an RNA-later solution (Takara Bio, Shiga, Japan) and stored at −80°C until further processing. The remaining colon was fixed in 10% neutral-buffered formalin for histological and immunohistochemical analyses.
Histopathology, immunohistochemistry and morphometry
For histologic evaluation, formalin-fixed colon and mesenteric lymph nodes (MLN) were embedded in paraffin, cut at 5 μm, and stained with hematoxylin and eosin or immunohistochemistry (IHC). Dysplastic and neoplastic lesions and mucosal/submucosal inflammation in the colon were scored on 0–4 ascending scales using criteria which have been previously described in detail (24,25). Primary antibodies for IHC included (i) rabbit polyclonal antibodies against β-catenin, myeloperoxidase (ThermoFisher Scientific/Lab Vision, Fremont, CA), E-cadherin, IL-17, Tgfβ-1 (Santa Cruz Biotechnology, Santa Cruz, CA), cleaved caspase-3 (Cell Signaling, Beverly, MA) and CD3 (Cell Marque, Rocklin, CA); (ii) rabbit monoclonal antibodies against Ki-67 and c-kit (Cell Marque); (iii) rat monoclonal antibodies against Foxp3 (eBioscience, San Diego, CA) and F4/80 (Serotec, Oxford, UK); and (iv) a goat polyclonal antibody against interleukin (IL)-16 (Santa Cruz Biotechnology). IHC and quantitative histomorphometry were performed as described previously (24).
Quantitative gene expression analysis
Real-time PCR based on the SYBR Green chemistry was used to quantitatively analyze the expression of tumor necrosis factor (TNF)-α, IL-6, IL-10 and transforming growth factor (Tgf)-β1, as described previously (24).
Statistical analyses
Adenomatous polyp counts were analyzed by unpaired Student’s t-test with Welch’s correction. Histomorphomety and relative gene expression data were compared between groups using Kruskal–Wallis one-way analysis of variance and Dunn’s post-test or Mann–Whitney U analysis. Statistical significance was set at P < 0.05. All analyses were performed with the Graphpad Prism version 5.0 for windows, GraphPad software, San Diego, CA.
Results
The oral administration of CT during DSS treatment suppresses AOM/DSS polypoidogenesis
Starting from the first week of DSS administration until 1 week after the last exposure to DSS, all DSS-treated experimental groups presented comparable levels of transient irregularities in stool consistency, without diarrhea or anal bleeding. In the remaining course of the study the mice did not show clinical signs of colitis. The last 2 weeks before the termination of the study, however, 5 of the 10 AOM-DSS treated mice had a dull fur, whereas 3 of these 5 also consistently showed loose feces. At the same time mice of the AOM-DSS-CT group remained asymptomatic. At the end of the study, the body weight of mice did not differ significantly among the experimental groups (Supplementary Figure S1a, available at Carcinogenesis Online).
At necropsy, 3.5 months post DSS treatments, 7 of the 10 mice of the AOM-DSS group had a total number of 20 polypoid adenomas in the colon. By contrast, 3 of the 10 AOM-DSS-CT mice had a significantly smaller total number of 5 (Figure 1a–c and Supplementary Figure S1b, available at Carcinogenesis Online). Colonic polyps did not exist in the remaining experimental groups. The size and the distribution of the polyps were similar between the two AOM/DSS-treated experimental groups. Polyps were located in the rectum and the descending colon (Figure 1a and b) and their sizes ranged from 0.5 to 2.5mm in diameter. Histopathologically, polyps from both groups showed the typical features of polypoid adenomas (Figure 1d and e) seen in AOM/DSS (26) and other mouse models of intestinal neoplasia (24,27). Although the small number of polyps found in the AOM-DSS-CT mice makes it difficult to draw safe conclusions, the classification of polyps according to the most advanced dysplasia/adenoma lesion they contained, suggests that the polyps of the AOM-DSS group had lesions that were in a more advanced stage of the epithelial ‘dysplasia to carcinoma’ sequence compared with their AOM-DSS-CT counterparts. Specifically, from the 20 polyps found in the AOM-DSS mice, 9 had carcinoma in situ (CIS; 45%), 9 had high grade dysplasia (HGD; 45%) and 2 had low grade dysplasia (LGD; 10%) as their most advanced lesion (Figure 1e). In the AOM-DSS-CT group, 1 of the 5 polyps found had CIS (20%), 1 had HGD (20%) and 3 had LGD (60%). The immunohistochemical staining patterns of β-catenin, E-cadherin and Tgfβ-1, and the proliferating (ki-67+) or apoptotic (caspase-3+) neoplastic cells (Supplementary Figure S2, available at Carcinogenesis Online) were similar in the adenomas of both groups and according to what we have recently described in a different mouse model of colonic polypoidosis (24). Likewise, the topographical distribution of polyp-associated inflammatory cells (Supplementary Figure S3, available at Carcinogenesis Online) was in line with our previous findings in mouse intestinal adenomas (24) and comparable in both CT-treated and non-treated AOM/DSS groups. These results suggest that CT, when orally introduced during the DSS-induced promotion of AOM-initiated carcinogenesis, decreases the risk of colonic adenoma formation.
Figure 1.

CT reduces AOM/DSS-induced colorectal adenomatous polyp formation. (a) Gross pathology of the descending colon and rectum of selected mice (five animals per group). Grossly visible polyps are indicated with arrow-heads. Treatment with CT reduced both the multiplicity and occurrence of polyps. (b) Close-up macroscopical view of multiple polyps in the distal part of descending colon and rectum of an AOM-DSS-treated mouse. The normal colorectal mucosa of an AOM-DSS-CT-treated mouse is shown on the side for comparison. (c) The beneficial effect of CT is statistically significant. (d) Low power magnification microscopical overview of a typical AOM/DSS broad-based, non-pedunculated adenomatous polyp with closely packed tubular abnormal glands (tubular adenoma) and occasional cystic glands filled with mucin. (e) Histopathological grades of dysplasia/adenoma lesions contained in polyps. The progression from low grade dysplasia/adenoma to high grade dysplasia/adenoma and CIS is characterized by progressively increased morphological abnormalities such as glandular shape and size irregularities, epithelial pseudostratification, cellular atypia, nuclear pleomorphism and mitotic figures. (c) Numbers on the y-axis of bar graph correspond to the mean ± SEM of histological parameters assessed; *P < 0.05. (d) Hematoxylin and Eosin. Scale bars: 1500 μm (c) and 50 μm (d).
The oral administration of CT during DSS treatment reduces AOM/DSS epithelial dysplasia in the colon
To further characterize the effect of oral CT treatment, we next examined the colon of mice for dysplastic lesions in non-polypoid epithelium. Three and a half months after DSS treatment, foci of epithelial dysplasia (Figure 2a) were found only in AOM-DSS (6 of the 10), AOM-DSS-CT (2 of the 10) and DSS (1 of the 10) mice. The histomorphology and immunohistochemical features of non-polypoid epithelial foci of dysplasia found in the three groups were typical and correlated to their grade (Figure 2a and Supplementary Figure S4a, available at Carcinogenesis Online), as earlier described (24). Remaining experimental groups had no dysplastic lesions in their colon. The histopathological score for dysplasia was significantly lower in the AOM-DSS-CT-treated mice compared with their AOM-DSS counterparts (P < 0.05) (Figure 2a). These findings suggest that CT reduces the occurrence and severity of AOM/DSS preneoplasia in the colon of mice.
Figure 2.
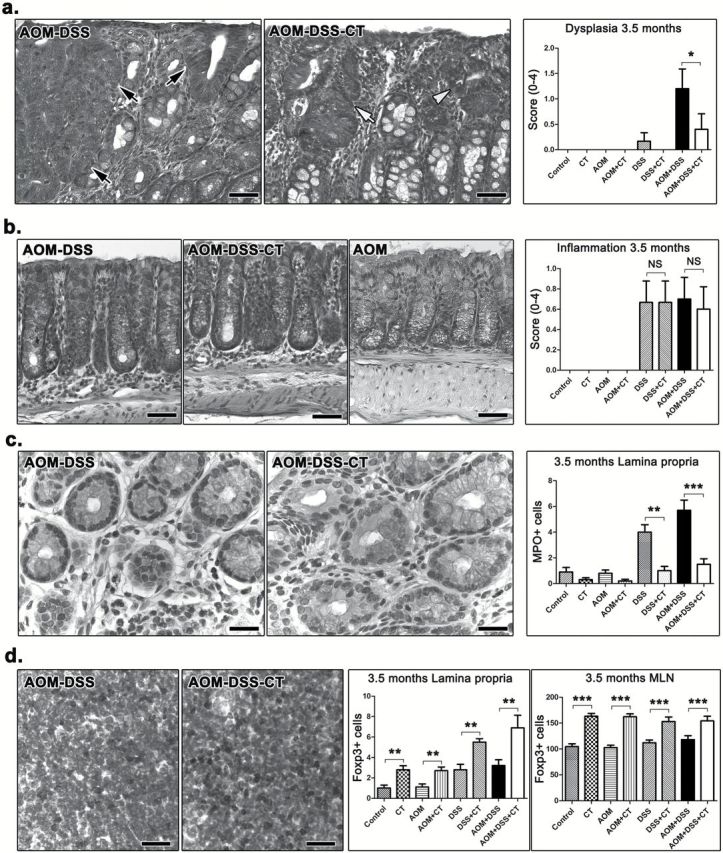
Dysplasia and inflammatory cells at 3.5 months after DSS treatment. (a) Focal dysplasia in the non-neoplastic colonic mucosa of AOM-DSS-treated mice. A mouse that received no further treatment has HGD lesions (black arrows), while its non-treated counterpart on the right has mild (white arrow-head) and LGD (white arrow). The effect of CT on reducing the total number and severity of these dysplastic lesions is statistically significant as shown in the dysplasia score bar graph. (b) While their colon architecture is by large restored and colitis absent, the mice which sustained colitogenic insults show more resident immune cells in the colonic mucosa lamina propria compared to their treatment-matched controls. The total population of these cells, however, was comparable between CT-treated and non-treated mice. (c) Morphometric counts of immunohistochemically labeled neutrophils (MPO+) provide evidence that CT contributed significantly toward a more effective long-term regression of this inflammatory cell type to the normal colon mucosa base-line level. (d) At the same time, Treg (Foxp3+) are significantly upregulated due to CT treatment in both MLN (compare side-by-side images) and the colonic lamina propria. (a) and (b) Hematoxylin and Eosin. (c) and (d) IHC; diaminobenzidine chromogen, hematoxylin counterstain. Scale bars: 50 μm (a and b); 25 μm (c and d). Numbers on the y-axis of bar graphs correspond to the mean ± SEM of the histological parameters assessed; *P < 0.05, **P < 0.001, ***P < 0.0001. MPO+ cells were counted in ×20 and Foxp3+ cells in ×40 high power magnification images.
The oral administration of CT during colitis induction has a long-term effect on the composition of resident inflammatory cell population in the colon
Three and a half months after DSS treatment, colitis was practically absent from mice (Figure 2b). Four of the 10 AOM-DSS and 5 of the 10 DSS mice, however, had a single or two at the most focal, small-sized typical DSS chronic colitis residual lesions in the distal descending colon or the rectum (Supplementary Figure S4b, available at Carcinogenesis Online). Interestingly, none of the AOM-DSS-CT or DSS-CT mice had such lesions, which suggests that CT may have conferred protection from occasional abnormalities of colonic mucosa wound healing and remodeling process. The histopathologic score for the presence of resident inflammatory cells in the colonic mucosa and submucosa (excluding polyp, dysplastic and solitary residual chronic colitis areas) showed that CT treatment did not affect the total number of immune cells in the colon (P > 0.05) (Figure 2b). DSS-treated experimental groups, however, were given higher scores for total resident inflammatory cells compared with the normal baseline scores of their matching treatment controls (Figure 2b). It follows that increased numbers of inflammatory cells persist in the colon of mice even at 3.5 months after the episodes of colitis induced by DSS. This finding is consistent with our observation that, at the same time-point, mice treated with DSS had MLN and mucosa-associated lymphoid tissue of increased size compared with non DSS-treated mice (Supplementary Figure S5a, available at Carcinogenesis Online).
Noting that CT did not have a histopathologically identifiable long-term effect on the total population of colonic mucosa immune cells, we next examined whether it affected the composition of this population. For that, we performed morphometric counts of immunohistochemically labeled immune cells in colonic mucosa excluding polyps and dysplastic or residual colitis foci. We found that the presence of c-kit+ mast cells was universally unremarkable and that CT-treated mice had more F4/80+ macrophages than non-CT-treated. This difference, however, did not reach statistical significance (AOM-DSS-CT versus AOM-DSS, P = 0.0649) (Supplementary Figure S5b, available at Carcinogenesis Online). Likewise, CT had no significant effect on the CD3+ cell number. Yet, DSS-treated animals had significantly more CD3+ cells than their treatment-matching controls (Control versus DSS, P = 0.0331) (Supplementary Figure S5c, available at Carcinogenesis Online). The most profound effect of CT was on MPO+ neutrophils and Foxp3+ Tregs. Specifically, while DSS treatment correlated with high numbers of persistent colonic mucosa MPO+ cells, CT negated this effect and led to the regression of MPO+ cells to baseline control levels (P < 0.01) (Figure 2c). Similarly, CT administration consistently co-existed with a long-standing significant increase of Tregs in both colonic mucosa (P < 0.01) and MLN (P < 0.001) (Figure 2d). In order to examine whether these long-term effects of CT on resident colonic immune cells translate into alterations in the colonic mucosa cytokine milieu, we next quantified the expression of IL-6, TNF-α and IL-10 in the colon of AOM-DSS-CT and AOM-DSS mice by real-time PCR. We found that the levels of cytokine gene expression in the two experimental groups did not differ significantly (P > 0.05) (Supplementary Figure S5d, available at Carcinogenesis Online). In addition, both groups showed unremarkable presence of IL-6+ and IL-17+ cells in colonic mucosa, low IL-17 expression in MLN and normal epithelial cell proliferation (ki-67+ cells) and apoptosis (caspase-3+ cells) patterns, by IHC (Supplementary Figure S6, available at Carcinogenesis Online).
At 3 days after DSS treatment, AOM-DSS-CT and AOM-DSS mice have colitis and epithelial dysplasia of comparable extent and severity
In order to explain why the CT-driven inflammatory milieu of DSS colitis does not favor the evolution of preneoplastic lesions to neoplasia in the long term, we examined the colon of AOM-DSS-CT and AOM-DSS mice at the early time point of 3 days after DSS treatment. We found that both groups had typical DSS colitis lesions of comparable extent and severity and, consequently, their histopathological scores for colitis did not differ (P > 0.05) (Figure 3a). We next probed colonic epithelia for dysplastic lesions, which were evident by their characteristic histomorphology and immunohistochemical features of proliferation, apoptosis and β-catenin aberrant staining patterns (Figure 3b). The histopathological scores for epithelial dysplasia did not differ significantly (P > 0.05) in the two experimental groups of mice (Figure 3c). These results suggest that neither the severity of colitis nor AOM/DSS dysplastic lesions differ between CT-treated and non-treated mice.
Figure 3.

Colitis and dysplasia at 3 days after DSS treatment. (a) DSS-induced focal mucosal ulcerative lesions with neutrophil-rich granulation tissue formation were evident in both AOM-DSS and AOM-DSS-CT mice. Both groups were given similar histopathological scores for colitis. (b) Dysplastic glands showed typical IHC features including highly increased cellular proliferation (ki-67), increased epithelial cell apoptosis (caspase-3) and cytoplasmic stabilization of β-catenin. (c) Focal dysplasia (outlined by arrows) was found in comparable extent and severity grade in both groups of AOM/DSS-treated mice. (a) and (c) Hematoxylin and Eosin. (b) IHC; diaminobenzidine chromogen, hematoxylin counterstain. Scale bars: 100 μm (a, Ki-67 and β-catenin of b; AOM-DSS-CT of c); 50 μm (caspase-3 of b), 250 μm (AOM-DSS of c). The y-axis depicts the mean ± SEM of histological scores given in each experimental group; NS: P > 0.05.
CT shapes a Treg/IL-10-rich mucosal environment that suppresses the evolution of preneoplastic lesions
Our findings show that the oral administration of CT during DSS-induced inflammatory promotion of AOM-initiated carcinogenesis did not protect from colonic epithelial preneoplasia in the short term, yet it counteracted colonic polypoid adenoma formation in the long term. Taken together these results led us to hypothesize that CT modulated DSS-induced inflammation and hindered its tumor promoting character. To test our hypothesis we quantitatively assessed critical immune cells and factors in the colon and MLN of AOM-DSS-CT and AOM-DSS mice at 3 days after DSS treatment. We found that CT reduced MPO+ neutrophils in both DSS ulcerative lesions (P = 0.1431) and the lamina propria of the remaining mucosa with difference reaching significance, however, only in the latter area (P = 0.0002) (Figure 4a). CT, also significantly reduced CD3+ lymphocytes in all areas examined, namely the ulcerative lesions (P = 0.0185), mucosal lymphoid follicles (P = 0.0256) and lamina propria (P = 0.0009) of the remaining mucosa (Figure 4b). On the other hand, it significantly upregulated Foxp3+ Tregs in the colonic ulcerative lesions (P = 0.0099), mucosal lymphoid follicles (P = 0.0113) and lamina propria (P = 0.0088), and in MLN (P = 0.0101) (Figure 5a and b). CT-treated mice had increased numbers of F4/80+ macrophages in the lamina propria of colonic mucosa; this difference, however, did not reach statistical significance (P = 0.1092). The analysis of the gene expression of selected cytokines with important roles in colitis-associated colon carcinogenesis by real-time PCR showed that CT upregulated all four cytokines tested. However, the CT effect was found to be statistically significant for IL-10 (P = 0.0079) and TNF-α (P = 0.0259) (Figure 6a), but not for IL-6 (P = 0.2222) and Tgfβ-1 (P = 0.3095). By IHC we found that the primary source of IL-6 in the colonic mucosa was the neutrophils and macrophages of the granulomatous inflammation foci in the areas of DSS-induced mucosal ulceration (Figure 6b). Morphometric counts of IL-6+ cells in these areas revealed no statistically significant difference between AOM-DSS-CT and AOM-DSS mice (P = 0.0576) (Figure 6b). Likewise, we found that both groups had non-significantly different amounts of IL-17 in their MLN (P = 0.0524) (Figure 6c).
Figure 4.

CT downregulates neutrophils and CD3+ lymphocytes at 3 days after DSS treatment. (a) MPO+ cells (neutrophils) in the lamina propria of the colon. The acute inflammation cell component is significantly reduced with CT administration. (b) Likewise, CD3+ cells are significantly decreased in the ulcerative lesions (upper left panel), the mucosal lymphoid follicles (upper right panel) and, also, in the colonic mucosa lamina propria. (a) and (b) IHC; diaminobenzidine chromogen, hematoxylin counterstain. Scale bars: 50 μm. The y-axis of bar graphs depicts the mean ± SEM of IHC-labeled cell counts in ×20 high power magnification images. *P < 0.05, **P < 0.001, ***P < 0.0001.
Figure 5.

CT upregulates Treg at 3 days after DSS treatment. In both (a) granulation tissue of focal typical DSS-induced colonic mucosa lesions and (b) MLN, Foxp3+ cell numbers are higher in AOM/DSS-treated mice that also received CT compared with the mice that received no further treatment. (c) Foxp3+ cell morphometric counts in these two sites as well as in colonic mucosa lamina propria and lymphoid follicles yield a consistent statistical significance for this effect of CT. (a) and (b) IHC; diaminobenzidine chromogen, hematoxylin counterstain. Scale bars: 25 μm. (c) Numbers on the y-axis of bar graphs correspond to the mean ± SEM of Foxp3+ cells counted in ×40 high power magnification images. *P < 0.05, **P < 0.001, ***P < 0.0001.
Figure 6.

CT upregulates the expression of cytokines at 3 days after DSS treatment. (a) Quantitative cytokine gene expression analysis of mouse colon shows that IL-10, TNF-a, IL-6 and Tgf-β are in higher levels after treatment with CT. Statistical significant differences between experimental groups are reached for IL-10 and TNF-a. In situ detection of (b) IL-6+ cells in ulcerative lesions (primarily neutrophils) and (c) IL-17 in MLN. Morphometric counts reveal a CT-induced increase for both cytokines. Statistical significance, however, is not reached. (b) and (b) IHC; diaminobenzidine chromogen, hematoxylin counterstain. Scale bars: 25 μm. (b); 50 μm (c). Numbers on the y-axis of bar graphs correspond to the mean ± SEM of IL6+ cells counted in ×40 high power or IL-17+ image pixels counted in ×20 high power magnification images. *P < 0.05, **P < 0.001, ***P < 0.0001.
Discussion
We show here that the oral administration of CT disrupts the tumor-promoting character of DSS-induced inflammation and reduces AOM-initiated colonic polypoidogenesis in mice. We find that a single, low, non-pathogenic dose of CT, given orally at the beginning of each DSS treatment cycle, renders the typical inflammatory milieu of DSS colitis less favorable for the evolution of preneoplastic lesions to polypoid adenomas.
The histomorphology of epithelial dysplastic lesions that have the propensity to evolve to polypoid adenomas through a well-characterized sequence of events has been described in both colitis-associated CRC mouse models (25,27) and humans (28). In the present study, such lesions were found in the colon of AOM/DSS-treated mice as early as 3 days after the last cycle of DSS treatment and 5.5 weeks after the induction of colonic epithelial mutagenesis by AOM. Based on the current knowledge of colonic neoplasmatogenesis (27,28), it is safe to conclude that the well-sized polyps found in the colon of AOM-DSS-treated mice at 3.5 months after DSS colitogenic insults, have originated from those dysplastic (preneoplastic) lesions. This is in line with the results of previous studies that used AOM-DSS and different strains of mice, including the Balb/c strain also used here (23,26,29). One such study in Balb/c mice, however, reports a 100% polypoid adenoma incidence and a mean of 11.4 colonic polyps per mouse (29), notably exceed the corresponding values observed in our study (70% and 2 polyps/mouse, respectively). Furthermore, that group describes a 100% incidence of colonic adenocarcinoma, whereas no invasive carcinoma lesions were identified in our study, despite the exhaustive histologic sectioning of the mice colon. Although the dosing scheme for AOM is similar in the two studies, we have used a relatively more aggressive inflammatory promotion protocol. Specifically, we applied three weekly cycles of 1% DSS compared with the single 4-days-long cycle of 1% DSS used in that earlier study (29). Yet, our results do not match the robust carcinogenesis described in that particular report. It is possible that differences in the intestinal microflora between mouse facilities may account for this discrepancy (23). Indeed, accumulating data suggest that the GI flora has a significant impact in colorectal carcinogenesis (2,3,8,13).
By contrast to other mouse strains, such as the C57BL/6, the Balb/c strain used in this study does not develop chronic colitis due to the initial episodes of acute DSS-induced inflammation (30). This was confirmed in our study since bowel histopathology at 3.5 months after DSS administration showed no evidence of colitis and restoration of mucosal architecture. However, by comparison with their treatment-matched controls, DSS-treated experimental groups had higher numbers of resident inflammatory cells in their colonic mucosa in the absence of colitis. The difference reached statistical significance for neutrophils, CD3+ lymphocytes and Tregs. This, along with our observation that DSS-treated mice had MLN of particularly increased size compared to their controls, suggests that inflammatory insults in the gut mucosa early in life may have an unexpectedly extended long-term effect in mucosal immunity. Interestingly, administration of CT also had a similar long-term effect. Specifically, CT administration induced enlarged MLN and significantly increased Tregs in the colon mucosa and GI lymphoid tissue not only in DSS-treated but in untreated normal controls as well. These effects were evident as long as 3.5 months after CT treatments. The long-term consequences of either DSS or CT administration on resident colonic mucosa inflammatory cells, however, did not translate into significant alterations of cytokine gene expression in the colon, which is in line with the subclinical nature of this phenomenon. Nonetheless, these findings support a key role for Tregs in the long-term effects of microbial antigens on mucosal immunity (5,6,8,13).
Although at 3.5 months after DSS treatment evidence of colitis was practically absent, almost half of the DSS treated mice had occasional small focal residual DSS colitis lesions. This finding matches our recently reported observations in a different DSS-induced polypoidogenesis mouse model (24). The reason why such lesions persist for such a long time is unknown. However, the localization of the lesions in the most distal part of the descending colon and the rectum indicates that incomplete mucosal healing may be due to anatomical or physiological site-specific conditions. In DSS-treated mice that were also treated with CT, however, such lesions were absent. It follows that CT may contribute toward more effective colonic mucosa wound healing and remodeling. This result is reminiscent of our recent observation in mice consuming the probiotic bacterium Lactobacillus reuteri which presented accelerated skin wound healing due to systemic immune system-related events that largely depended upon Tregs and IL-10 (31).
Apart from detectable but otherwise subtle alterations in the cellular component of gut mucosal immunity we confirmed that the mouse model of CRC we have used does not develop long-term chronic colitis (30). Therefore, we theorized that the critical preneoplasia evolution events leading to polypoidogenesis probably occur during the early stages of active chronic colitis at the time of DSS administration. Indeed, altering the character of colitis at that time by orally administering CT led to the suppression of neoplasmatogenesis. By examining the histopathology of the colon of mice at 3 days after the last cycle of DSS, we found that CT affects neither the severity of colitis nor the multiplicity or the stage of dysplastic lesions. We therefore reasoned that CT suppressed the evolution of preneoplastic colonic gland foci into adenomatous polyps by altering their microenvironment, specifically, by intervening with the tumor-promoting character of the chronic active DSS-induced inflammatory milieu (23,26). The powerful adjuvant, immunomodulatory and oral tolerance inducing properties of CT and its B subunit have been shown to prevent experimentally induced autoimmune diseases and allergies in various preclinical rodent models (17,32–34). CT has been reported to modulate the expression of both Th1 and Th2 cytokines (16,17,19,20,22). Although the results of different studies vary, most researchers agree that CT downregulates the pro-inflammatory cytokines IL-12, IL-6 and TNF-α, and upregulates the anti-inflammatory cytokines IL-10 and Tgf-β (16,17,19,22). Using a mouse model of trinitrobenzene sulfonic acid (TNBS)-induced colitis Coccia et al. (22) have shown that the B subunit of CT downregulated IL-12 and IFN-γ secretion from colonic lamina propria mononuclear cells. In our study, oral CT administration up-regulated all four cytokines tested at 3 days after DSS treatment, namely IL-6, TNF-α, IL-10 and Tgf-β. The effect of CT, however, reached significance only for TNF-α and, particularly, IL-10. Using mouse models, our group as well as others have shown previously that blocking TNF-α reduces intestinal neoplasmatogenesis (9,35–38). Yet, the correlation of elevated TNF-α levels with reduced carcinogenesis we find here is not surprising, since TNF-α has been reported to have both anti-tumoral and tumor-promoting roles (39).On the other hand, IL-10 has almost universally been associated with reducing carcinogenesis. Using an exogenous IL-10 administration strategy and various mouse models of CRC we have consistently shown over the last years that IL-10 is suppressing carcinogenesis (9,36,38). The results of the present study add value to the key role of IL-10 in protecting mucosal surfaces from cancer (40).
The significant CT-induced elevation of IL-10 at the time-point of 3 days after DSS treatment co-exists with a profound elevation of colonic Treg. This was somewhat expected, since Treg are a major cellular source of IL-10 (40). Also, because CT is known to have a profound effect in expanding Treg through enhancing antigen presentation by activated professional antigen cells and B-lymphocytes (16,17,19). The role of Treg in cancer is paradoxical (6,40,41). Treg have been traditionally viewed as cancer-promoting cells based on their function to suppress protective antineoplastic immune responses (40,41). However, our original studies in mice showing that the adoptive transfer of Treg not only protected but it further counteracted already established intestinal, breast and prostate neoplasia (6,9,10,25,36,42,43), are now supported by many other animal and human studies (8,40,41). All this accumulating evidence suggests that the role of Treg in cancer needs to be further explored. The anti-neoplastic effect of a bacterial product, such as CT in the present study, provides further support to our most recent data that bridge previous discrepancies and point out that the beneficial or negative roles of Treg in cancer depend upon their prior exposure to bacterial antigens in the gut (6,8,10,11). Our results suggest that CT may be listed among those bacterial antigens that can awake Treg-mediated beneficial capabilities, which remain latent in the modern life’s stringent hygienic conditions (5,6).
The CT-induced Treg-IL10-rich environment of colitis was also characterized by decreased numbers of neutrophils and CD3+ lymphocytes. The decrease of the total CD3+ population in the colonic mucosa and lymphoid tissue, despite the significant increase of CD3+ Treg in the same sites, is suggestive of a considerable decrease of effector lymphocytes. Detailed studies using additional tools of immunology, however, are needed to better characterize this phenomenon. Nonetheless, these effects are in line with the well-known fact that neutrophils and effector lymphocyte responses are major targets of the immunoregulatory arm of the immune system (44). Using adoptive cell transfer and IL-10 exogenous administration we have shown in previous mouse studies that the anti-neoplastic roles of Treg and IL-10 coincide with suppression of these particular responses (6,31,35,38,42), which when are uncontrolled enhance carcinogenesis (12). The important role of neutrophils in AOM/DSS mouse colonic carcinogenesis in particular has been recently highlighted by Shang et al. (45).
Further studies are needed to elucidate the possibility that other immune cell populations may have contributed to the anti-carcinogenic effect of CT observed in our experimental setting. CD8+ cytotoxic lymphocytes with increased potency to recognize and kill cancer cells have been demonstrated to occur with the use of CT in a dendritic cell vaccination-based anti-neoplastic therapy of tumor transplanted mice (46). Further research is also needed to assess the role of resident gut microbiota in the anti-neoplastic effect of CT. For example, Verdù et al. have shown that CT administration was able to ameliorate DSS-induced colitis in mice only when co-administered with anaerobic bacteria. According to these authors when CT was given along with a pool of gram-positive and negative bacteria the treatment failed to reduce colonic inflammation (47). Due to the nature of the mouse model of CRC used here (23), CT, resident gut microbiota, inflammation and mucosal wound healing were all inter-related factors in the carcinogenesis process. Using CT in the early stages of carcinogenesis in different mouse models will further dissect the associations of this- practically obsolete from the industrialized world-bacterial product (14) with the neoplastic disease.
Even in the absence of environmental genotoxic events, the probability of random gene mutation during lifetime is astronomical. Therefore, the presence of focal epithelial dysplasia and preneoplasia throughout the body of human beings is inevitable (48). While these lesions rarely develop into cancer, co-existing local or even systematic overt or smoldering inflammatory events have a trophic effect on them, promote their evolution and increase the odds of carcinogenesis by many-fold (6,12). The results of the present study add value to the emerging notion that certain GI tract bacteria or their products affect the immune system and render the microenvironment of preneoplastic lesions less favorable for promoting their evolution to cancer (5,6,8,13). This opens new possibilities for dietary interventions to reduce cancer risk at a population level.
Supplementary material
Supplementary Figures S1–S6 can be found at http://carcin.oxfordjournals.org/
Funding
National Institutes of Health Grant (RO1CA108854 to S.E.E).
Supplementary Material
Acknowledgements
We thank the Bodossaki Foundation for the kind donation of real-time PCR instrumentation.
Conflict of interest statement: None declared.
Glossary
Abbreviations:
- AOM
azoxymethane
- CIS
carcinoma in situ
- CRC
colorectal cancer
- CT
cholera-toxin
- DSS
dextran sodium sulfate
- HGD
high grade dysplasia
- IHC
immunohistochemistry
- IL
interleukin
- LGD
low grade dysplasia
- MLN
mesenteric lymph nodes
- MPO
myeloperoxidase
- Treg
Regulatory T-cells
References
- 1. Boyle P., et al. (2008). World Cancer Report 2008. International Agency for Research on Cancer; Distributed by WHO Press, Lyon. [Google Scholar]
- 2. Zhu Y., et al. (2011). Gut microbiota and probiotics in colon tumorigenesis. Cancer Lett., 309, 119–127. [DOI] [PMC free article] [PubMed] [Google Scholar]
- 3. Abreu M.T., et al. (2014). Gastrointestinal malignancy and the microbiome. Gastroenterology, 146, 1534.e3–1546.e3. [DOI] [PMC free article] [PubMed] [Google Scholar]
- 4. Round J.L., et al. (2009). The gut microbiota shapes intestinal immune responses during health and disease. Nat. Rev. Immunol., 9, 313–323. [DOI] [PMC free article] [PubMed] [Google Scholar]
- 5. Rook G.A., et al. (2011). Infection, immunoregulation, and cancer. Immunol. Rev., 240, 141–159. [DOI] [PubMed] [Google Scholar]
- 6. Erdman S.E., et al. (2010). Cancer inflammation and regulatory T cells. Int. J. Cancer, 127, 768–779. [DOI] [PMC free article] [PubMed] [Google Scholar]
- 7. Uronis J.M., et al. (2009). Modulation of the intestinal microbiota alters colitis-associated colorectal cancer susceptibility. PLoS One, 4, e6026. [DOI] [PMC free article] [PubMed] [Google Scholar]
- 8. Poutahidis T., et al. (2014). Gut microbiota and the paradox of cancer immunotherapy. Front. Immunol., 5, 157. [DOI] [PMC free article] [PubMed] [Google Scholar]
- 9. Poutahidis T., et al. (2007). Rapid reversal of interleukin-6-dependent epithelial invasion in a mouse model of microbially induced colon carcinoma. Carcinogenesis, 28, 2614–2623. [DOI] [PubMed] [Google Scholar]
- 10. Erdman S.E., et al. (2009). Unifying roles for regulatory T cells and inflammation in cancer. Int. J. Cancer, 126, 1651–1665. [DOI] [PMC free article] [PubMed] [Google Scholar]
- 11. Lakritz J.R., et al. (2014). Beneficial bacteria stimulate host immune cells to counteract dietary and genetic predisposition to mammary cancer in mice. Int. J. Cancer, 135, 529–540. [DOI] [PMC free article] [PubMed] [Google Scholar]
- 12. Grivennikov S.I., et al. (2010). Immunity, inflammation, and cancer. Cell, 140, 883–899. [DOI] [PMC free article] [PubMed] [Google Scholar]
- 13. Erdman S.E., et al. (2014). The microbiome modulates the tumor macroenvironment. Oncoimmunology, 3, e28271. [DOI] [PMC free article] [PubMed] [Google Scholar]
- 14. Harris J.B., et al. (2012). Cholera. Lancet, 379, 2466–2476. [DOI] [PMC free article] [PubMed] [Google Scholar]
- 15. Sanchez J., et al. (2011). Cholera toxin—a foe & a friend. Indian J. Med. Res., 133, 153–163. [PMC free article] [PubMed] [Google Scholar]
- 16. Lavelle E.C., et al. (2004). Effects of cholera toxin on innate and adaptive immunity and its application as an immunomodulatory agent. J. Leukoc. Biol., 75, 756–763. [DOI] [PubMed] [Google Scholar]
- 17. Sun J.B., et al. (2010). Mucosally induced immunological tolerance, regulatory T cells and the adjuvant effect by cholera toxin B subunit. Scand. J. Immunol., 71, 1–11. [DOI] [PubMed] [Google Scholar]
- 18. Cong Y., et al. (2001). Effects of cholera toxin on macrophage production of co-stimulatory cytokines. Eur. J. Immunol., 31, 64–71. [DOI] [PubMed] [Google Scholar]
- 19. Lavelle E.C., et al. (2003). Cholera toxin promotes the induction of regulatory T cells specific for bystander antigens by modulating dendritic cell activation. J. Immunol., 171, 2384–2392. [DOI] [PubMed] [Google Scholar]
- 20. Eriksson K., et al. (2003). Cholera toxin and its B subunit promote dendritic cell vaccination with different influences on Th1 and Th2 development. Infect. Immun., 71, 1740–1747. [DOI] [PMC free article] [PubMed] [Google Scholar]
- 21. Kawamura Y.I., et al. (2003). Cholera toxin activates dendritic cells through dependence on GM1-ganglioside which is mediated by NF-kappaB translocation. Eur. J. Immunol., 33, 3205–3212. [DOI] [PubMed] [Google Scholar]
- 22. Coccia E.M., et al. (2005). Cholera toxin subunit B inhibits IL-12 and IFN-{gamma} production and signaling in experimental colitis and Crohn’s disease. Gut, 54, 1558–1564. [DOI] [PMC free article] [PubMed] [Google Scholar]
- 23. Neufert C., et al. (2007). An inducible mouse model of colon carcinogenesis for the analysis of sporadic and inflammation-driven tumor progression. Nat. Protoc., 2, 1998–2004. [DOI] [PubMed] [Google Scholar]
- 24. Karamanavi E., et al. (2014). Urokinase-type plasminogen activator deficiency promotes neoplasmatogenesis in the colon of mice. Transl. Oncol., 7, 174.e5–187.e5. [DOI] [PMC free article] [PubMed] [Google Scholar]
- 25. Erdman S.E., et al. (2003). CD4+ CD25+ regulatory T lymphocytes inhibit microbially induced colon cancer in Rag2-deficient mice. Am. J. Pathol., 162, 691–702. [DOI] [PMC free article] [PubMed] [Google Scholar]
- 26. Tanaka T., et al. (2003). A novel inflammation-related mouse colon carcinogenesis model induced by azoxymethane and dextran sodium sulfate. Cancer Sci., 94, 965–973. [DOI] [PMC free article] [PubMed] [Google Scholar]
- 27. Ward J.M., et al. (2014). Rodent intestinal epithelial carcinogenesis: pathology and preclinical models. Toxicol. Pathol., 42, 148–161. [DOI] [PubMed] [Google Scholar]
- 28. Riddell R.H. (2003). Tumors of the Intestines. Armed Forces Institute of Pathology, Washington, DC. [Google Scholar]
- 29. Suzuki R., et al. (2006). Strain differences in the susceptibility to azoxymethane and dextran sodium sulfate-induced colon carcinogenesis in mice. Carcinogenesis, 27, 162–169. [DOI] [PubMed] [Google Scholar]
- 30. Melgar S., et al. (2005). Acute colitis induced by dextran sulfate sodium progresses to chronicity in C57BL/6 but not in BALB/c mice: correlation between symptoms and inflammation. Am. J. Physiol. Gastrointest. Liver Physiol., 288, G1328–G1338. [DOI] [PubMed] [Google Scholar]
- 31. Poutahidis T., et al. (2013). Microbial symbionts accelerate wound healing via the neuropeptide hormone oxytocin. PLoS One, 8, e78898. [DOI] [PMC free article] [PubMed] [Google Scholar]
- 32. Bergerot I., et al. (1997). A cholera toxoid-insulin conjugate as an oral vaccine against spontaneous autoimmune diabetes. Proc. Natl. Acad. Sci. U. S. A., 94, 4610–4614. [DOI] [PMC free article] [PubMed] [Google Scholar]
- 33. Yura M., et al. (2001). Nasal administration of cholera toxin (CT) suppresses clinical signs of experimental autoimmune encephalomyelitis (EAE). Vaccine, 20, 134–139. [DOI] [PubMed] [Google Scholar]
- 34. Su S.B., et al. (2004). Cholera toxin prevents Th1-mediated autoimmune disease by inducing immune deviation. J. Immunol., 173, 755–761. [DOI] [PubMed] [Google Scholar]
- 35. Rao V.P., et al. (2006). Proinflammatory CD4+ CD45RB(hi) lymphocytes promote mammary and intestinal carcinogenesis in Apc(Min/+) mice. Cancer Res., 66, 57–61. [DOI] [PubMed] [Google Scholar]
- 36. Rao V.P., et al. (2006). Innate immune inflammatory response against enteric bacteria Helicobacter hepaticus induces mammary adenocarcinoma in mice. Cancer Res., 66, 7395–7400. [DOI] [PubMed] [Google Scholar]
- 37. Popivanova B.K., et al. (2008). Blocking TNF-alpha in mice reduces colorectal carcinogenesis associated with chronic colitis. J. Clin. Invest., 118, 560–570. [DOI] [PMC free article] [PubMed] [Google Scholar]
- 38. Erdman S.E., et al. (2009). Nitric oxide and TNF-alpha trigger colonic inflammation and carcinogenesis in Helicobacter hepaticus-infected, Rag2-deficient mice. Proc. Natl. Acad. Sci. U. S. A., 106, 1027–1032. [DOI] [PMC free article] [PubMed] [Google Scholar]
- 39. Balkwill F. (2009). Tumour necrosis factor and cancer. Nat. Rev. Cancer, 9, 361–371. [DOI] [PubMed] [Google Scholar]
- 40. Dennis K.L., et al. (2013). Current status of interleukin-10 and regulatory T-cells in cancer. Curr. Opin. Oncol., 25, 637–645. [DOI] [PMC free article] [PubMed] [Google Scholar]
- 41. Whiteside T.L. (2012). What are regulatory T cells (Treg) regulating in cancer and why? Semin. Cancer Biol., 22, 327–334. [DOI] [PMC free article] [PubMed] [Google Scholar]
- 42. Erdman S.E., et al. (2003). CD4(+)CD25(+) regulatory lymphocytes require interleukin 10 to interrupt colon carcinogenesis in mice. Cancer Res., 63, 6042–6050. [PubMed] [Google Scholar]
- 43. Poutahidis T., et al. (2009). CD4+ lymphocytes modulate prostate cancer progression in mice. Int. J. Cancer, 125, 868–878. [DOI] [PMC free article] [PubMed] [Google Scholar]
- 44. Sehrawat S., et al. (2011). Tregs and infections: on the potential value of modifying their function. J. Leukoc. Biol., 90, 1079–1087. [DOI] [PMC free article] [PubMed] [Google Scholar]
- 45. Shang K., et al. (2012). Crucial involvement of tumor-associated neutrophils in the regulation of chronic colitis-associated carcinogenesis in mice. PLoS One, 7, e51848. [DOI] [PMC free article] [PubMed] [Google Scholar]
- 46. Eriksson K., et al. (2004). Coupling of antigen to cholera toxin for dendritic cell vaccination promotes the induction of MHC class I-restricted cytotoxic T cells and the rejection of a cognate antigen-expressing model tumor. Eur. J. Immunol., 34, 1272–1281. [DOI] [PubMed] [Google Scholar]
- 47. Verdù E.F., et al. (2000). Oral administration of antigens from intestinal flora anaerobic bacteria reduces the severity of experimental acute colitis in BALB/c mice. Clin. Exp. Immunol., 120, 46–50. [DOI] [PMC free article] [PubMed] [Google Scholar]
- 48. Folkman J., et al. (2004). Cancer without disease. Nature, 427, 787. [DOI] [PubMed] [Google Scholar]
Associated Data
This section collects any data citations, data availability statements, or supplementary materials included in this article.