

Abstract
Study Objectives:
To investigate gray matter volume and concentration and cerebral perfusion in people with untreated obstructive sleep apnea (OSA) while awake.
Design:
Voxel-based morphometry to quantify gray matter concentration and volume. Arterial spin labeling perfusion imaging to quantify cerebral perfusion.
Setting:
Lying supine in a 3-T magnetic resonance imaging scanner in the early afternoon.
Participants:
19 people with OSA (6 females, 13 males; mean age 56.7 y, range 41–70; mean AHI 18.5, range 5.2–52.8) and 19 controls (13 females, 6 males; mean age: 50.0 y, range 41–81).
Interventions:
N/A.
Results:
There were no differences in regional gray matter concentration or volume between participants with OSA and controls. Neither was there any difference in regional perfusion between controls and people with mild OSA (n = 11). However, compared to controls, participants with moderate-severe OSA (n = 8) had decreased perfusion (while awake) in three clusters. The largest cluster incorporated, bilaterally, the paracingulate gyrus, anterior cingulate gyrus, and subcallosal cortex, and the left putamen and left frontal orbital cortex. The second cluster was right-lateralized, incorporating the posterior temporal fusiform cortex, parahippocampal gyrus, and hippocampus. The third cluster was located in the right thalamus.
Conclusions:
There is decreased regional perfusion during wakefulness in participants with moderate-severe obstructive sleep apnea, and these are in brain regions which have shown decreased regional gray matter volume in previous studies in people with severe OSA. Thus, we hypothesize that cerebral perfusion changes are evident before (and possibly underlie) future structural changes.
Citation:
Innes CR, Kelly PT, Hlavac M, Melzer TR, Jones RD. Decreased regional cerebral perfusion in moderate-severe obstructive sleep apnoea during wakefulness. SLEEP 2015;38(5):699–706.
Keywords: obstructive sleep apnea, cerebral perfusion, arterial spin labelling, voxel-based morphometry
INTRODUCTION
Obstructive sleep apnea (OSA) is a common sleep disorder, characterized by recurrent partial or complete upper airway obstruction during sleep, which leads to events where breathing stops (apnea) or becomes very shallow (hypopnea). This respiratory disturbance in turn leads to cyclical oxygen desaturation, frequent arousals, and sleep fragmentation. OSA severity is usually defined in terms of the number of apneas and hypopneas per hour, the apnea-hypopnea index (AHI). A review of the pathophysiology of OSA can be found in Dempsey et al.1
Continuous positive airway pressure (CPAP) during sleep is the treatment of choice for OSA. CPAP treatment has been shown to have beneficial effects on vascular function,2 reduce sleep fragmentation, and reduce daytime sleepiness, which also improves attentional processes.3 However, cognitive dys-function can persist even after compliant CPAP treatment, and it is thought that the negative effects of chronic intermittent hypoxia prior to treatment of OSA may lead to permanent structural and chemical changes in the brain.3,4
There is a high prevalence of untreated OSA in the community due to underdiagnosis and lack of funding for treatment.5 The non-treatment of OSA is associated with hypertension, cardiovascular disease, stroke, diabetes, excessive daytime sleepiness, and cognitive dysfunction.3–15 Patients frequently report having had OSA symptoms for 5–10 years before being diagnosed and, in New Zealand, public funding for CPAP is generally only available for people with the most severe OSA (e.g., ∼25% of referrals to the Sleep Unit, Christchurch Hospital), while the majority of people with this condition must self-fund or remain untreated. In addition, up to 30% of people who are prescribed CPAP cannot tolerate it, and thus may also remain untreated.16–18
Several neuroimaging studies have investigated whether there is evidence of OSA-related structural changes in the brain. No studies have reported an OSA-related decrease in total gray matter volume. However, one study observed an OSA-related decrease in cortical gray matter volume.19 Interestingly, this difference was significant after controlling for age, sex, Ep-worth Sleepiness Scale (ESS), and comorbidities but was not evident after controlling for BMI. Several studies have shown that untreated severe OSA is associated with decreases in regional gray matter volume19–25 and concentration.26,27 Conversely, other studies observed no difference in regional gray matter volume between people with untreated severe OSA and controls.27–29 In the studies where OSA-related changes were observed, changes were most frequently observed in the hippocampus, temporal lobe, cerebellum, thalamus, parahippocampal gyrus, anterior cingulate, parietal cortex, frontal cortex, and caudate nucleus.19–27
Based on the results of human studies30,31 and experimental animal models32,33 of OSA, it has been hypothesized that the intermittent hypoxia associated with untreated OSA can lead to oxidative stress, inflammation, atherosclerosis, endothelial dysfunction, and hypertension. Combined, these can cause changes in the regulatory mechanisms of cerebral circulation, leading to pathological alterations in cerebral perfusion and are thought to ultimately be the main cause of cerebrovascular disease in OSA.34–37
As far as we are aware, no studies have investigated OSA-related changes in total cerebral perfusion, but three studies have investigated OSA-related changes in regional gray matter perfusion when patients were awake. Joo et al. observed a decrease in perfusion in the bilateral parahippocampal gyrus and left lingual gyrus in people with severe OSA (mean AHI 60.4, range 33–104). They also observed a negative correlation between AHI and perfusion in the right pericentral gyrus and right cuneus.38 Yadav et al. measured perfusion in a priori selected regions of interest and observed decreased perfusion in several white matter tracts but few gray matter changes. Right-lateralized decreased gray matter perfusion was observed in the red nucleus and midbrain but no cortical changes were observed.39 Prilipko et al. observed no differences in perfusion between controls and people described as having moderate-severe OSA (although AHI mean and range were not provided).40 Yaouhi et al. used positron emission tomography (PET) to measure regional metabolism in people with OSA (mean AHI 38.3).23 PET measures tissue metabolic activity based on regional glucose uptake rather than perfusion per se, although local brain metabolism is closely tied to regional perfusion.41 Compared with controls, they observed right-lateralized decreases in glucose metabolism in the precuneus, middle and posterior cingulate gyrus, parietal cortex, occipital cortex, and superior temporal gyrus in people with OSA when awake (but at rest).
There has been a lack of accounting for confounding factors such as age, sex, and mean total perfusion in the previous literature. Females have higher mean perfusion than males,42 while mean perfusion decreases with increasing age.42,43 Thus, when investigating group differences in total and regional per-fusion, it is now standard to include age and sex as covariates. In addition, increasing age is associated with increasing prevalence of OSA, and thus age should be included in the model as a confounding factor. When investigating regional perfusion, mean total gray matter perfusion should also be included as a covariate. Individual differences in mean total gray matter per-fusion can vary widely, thus accounting for global differences increases confidence in being able to quantify regional per-fusion differences between groups. Unsurprisingly, the three studies investigating OSA-related changes in regional perfusion or metabolism did not include sex as a covariate, as the studies included exclusively38,40 or almost exclusively, males (one study included 1 female with OSA23). However, exclusion of females is a limitation of the studies in itself.
When considering the study of people with OSA, covariates which are specific to this population should also be included. For example, body mass index (BMI) should be included as a covariate as there is a link between body weight and OSA, especially in middle-aged populations, with an OSA prevalence of 20% in people considered overweight (i.e., BMI of 25–28).5 However, the relationship between BMI and OSA diminishes with increasing age.44 Studies have reported extremely high rates of OSA in older adults (OSA prevalence of up to 70% of men and 56% of women aged 65–95 years), with BMI becoming less of a risk factor,44 as presumably other age-related factors become more important.
Our previous research using ASL perfusion imaging to investigate changes in resting (but awake) perfusion after acute sleep restriction in healthy participants found an overall reduction in perfusion in the right fronto-parietal attentional network after sleep restriction, but this was largely driven by participants who showed strong signs of drowsiness during the ASL scan.45 We concluded that the pattern of cerebral activity after acute sleep restriction is highly dependent on the level of drowsiness. Thus, the effect of drowsiness during the ASL scan also needs to be included as a covariate to ensure that any differences in perfusion between the groups are due to OSA-related differences and not just due to increased drowsiness in the OSA group. This factor has not been taken into account in previous research investigating OSA-related perfusion change.
One previous study included age when correlating AHI with regional perfusion but failed to include age as a covariate when comparing regional perfusion between control and OSA groups.38 Otherwise, no other confounding factor has been accounted for in previous studies. Thus, it is not clear what proportion of reported differences in regional cerebral perfusion is due to OSA as opposed to group differences in age, sex, BMI, total perfusion, or drowsiness during the scan or, more likely, a combined effect of several factors. In addition to the lack of accounting for confounding variables, only two studies comparing regional cerebral perfusion in people with OSA with controls corrected for multiple comparisons.38,40
Previous studies have also concentrated primarily on people with untreated severe OSA and, thus, it is unclear whether cerebral perfusion and gray matter concentration changes are also apparent in those with more moderate disease.
This study aimed to investigate differences in total gray matter volume, regional gray matter volume or concentration, and perfusion between controls and people with a range of OSA severity (mild, moderate, and severe), taking into account any variation due to confounding factors.
METHODS
Ethics approval for the study was obtained from the New Zealand Northern X Regional Ethics Committee.
Participants
Participants were 19 people with OSA (13 males and 6 females, mean age 56.7 ± 7.8 years, range 41–70) and 19 people without OSA (6 males and 13 females, mean age 50.0 ± 9.7 years, range 41–81). For inclusion in the study, participants had to report no history of moderate or severe head injury, stroke, neurodegenerative disorder, psychiatric disorder (other than mild depression), or sleep disorder (other than OSA); not be taking any sedating or stimulating medications; normally drink < 4 cups of coffee or tea per day; and not be undergoing or have previously undertaken, OSA treatment. Participants also needed to report a usual time to bed between 22:00 and 24:00 and a usual time in bed of between 7.0 and 8.5 hours. Control participants were recruited through personal contacts and advertisements posted at Christchurch Hospital. Many of the volunteers were hospital employees or their friends and relatives.
Polysomnographic Assessment
All participants undertook an overnight Level 2 polysomnographic sleep assessment to determine the presence or absence of OSA. Sleep architecture was staged according to the 2012 American Academy of Sleep Medicine Manual for the Scoring of Sleep and Associated Events recommendations.46 The Level 2 polysomnography studies were undertaken in the participants' homes and not supervised. Absence of OSA was defined as an AHI < 5. OSA severity was defined by AHI: mild OSA with an AHI of 5 to < 15, moderate OSA with an AHI of 15 to < 30, and severe OSA with an AHI ≥ 30.
Study Procedure
Participants were asked to refrain from stimulants or depressants (e.g., caffeine, alcohol, antihistamines) on the day of the magnetic resonance imaging (MRI) scan. None of the participants were current smokers.
Participants completed a set of questionnaires to assess their self-reported everyday sleep propensity (Epworth Sleepiness Scale [ESS]),47 sleep quality (Pittsburgh Sleep Quality Index [PSQI]),48 and circadian type (Horne-Ostberg Morning-Eveningness Questionnaire [MEQ]).49 We scored the Horne-Ostberg MEQ as appropriate for a middle-aged population (definite evening type 16–46, moderate evening type 47–52, neither type 53–64, moderate morning type 65–69, and definite morning type 70–86).50,51 Body mass index (BMI) was calculated as mass divided by height squared (kg/m2).
Just prior to entering the MRI scanner, participants were asked to rate their current subjective sleepiness using the Karolinska Sleepiness Scale (KSS)52 and Stanford Sleepiness Scale (SSS).53
Imaging Procedure
All participants underwent imaging using a Signa HDx 3.0 T MRI Scanner (GE Medical Systems, Milwauke, WI, USA) with an 8-channel head coil. High-resolution anatomic images of the whole brain were acquired using a T1-weighted spoiled gradient recalled echo (SPGR) acquisition (repetition time: 6.5 ms; echo time: 2.8 ms; inversion time: 400 ms; field of view: 250 × 250 mm; acquisition matrix: 256 × 256; slice thickness: 1 mm). Whole-brain perfusion was measured quantitatively using a stack of spiral fast-spin-echo-acquired images prepared with pseudo-continuous ASL and background suppression54 (repetition time: 6 s; echo spacing: 9.2 ms; postlabeling delay: 1.525 s; labeling duration: 1.5 s; 8 interleaved spiral arms with 512 samples at 62.5 kHz bandwidth; FOV = 240 mm; 30 phase-encoded 5-mm-thick slices; reconstructed in-plane resolution: 1.88 × 1.88 mm; NEX = 5; total scan time: 6 min 46 s; units: mL100g/min). To demonstrate the quality of our ASL cerebral perfusion images, Figure S1 (supplemental material) includes data from 4 example participants.
Preprocessing of MRI Data
The structural and perfusion MRI data were preprocessed using VBM8 (http://dbm.neuro.uni-jena.de/vbm/), a toolbox of SPM8 (Wellcome Trust Centre for Neuroimaging, University College London, UK; http://www.fil.ion.ucl.ac.uk/spm), and custom scripts in MATLAB 7.10 (R2010a; Mathworks, Natick, MA, USA) as follows: structural images were bias corrected, tissue classified, and normalized using linear and nonlinear transformations (DARTEL)55 within a unified model. Gray-matter segments for each subject were modulated using nonlinear components of the normalization only, thereby preserving actual tissue values locally to account for individual brain size globally. Modulated, normalized gray matter segments were smoothed with a 10-mm FWHM Gaussian kernel to improve signal to noise and to minimize the effect of any residual misalignment. Perfusion images were quantified, coregistered to SPGR images, brain extracted (using FSL 5.0.2 www.fmrib.ox.ac.uk/fsl), and normalized using the deformation fields generated during segmentation and normalization of the SPGR images. Normalized perfusion images were also smoothed with a 10-mm FWHM Gaussian kernel. All images were visually inspected. A study-specific gray matter mask, used to exclude non-gray matter contributions in subsequent analyses, was created by averaging the modulated, normalized gray matter segment from all subjects. Values < 0.10 were excluded from the mask, as were all slices inferior to the superior cerebellum as spiral artefacts were present in this area on per-fusion images; periventricular white matter regions misclassified as gray matter (partial voluming) were manually excluded from the gray matter mask. Gray matter segments were also normalized without modulation and smoothed to investigate gray matter concentration.
Observer Rating of Drowsiness
Eye-video was captured using a Visible Eye system incorporating a fiberoptic camera during the ASL scans (Avotec Inc., Stuart, FL, USA). The video-capture software recorded 352 × 288-resolution eye-video at 25 fps. Each participant's 7-min eye video was visually rated for signs of drowsiness by an experienced rater (CI). Drowsiness was rated based on the visual scoring method proposed by Wierwille and Ellsworth.56 This rating system is based on observable personal characteristics including eye blinks, eye closures, and staring. The rating system has 5 levels of drowsiness on an analog scale of 0 to 100 (not drowsy = 0, slightly drowsy = 25, moderately drowsy = 50, very drowsy = 75, and extremely drowsy = 100). Level of drowsiness was rated as an average rating over each min, and then an overall average across the 7 min was calculated. In our previous study,45 drowsiness was rated by 2 raters using the Wierwille and Ellsworth scoring method and an average score used. We found very high interrater reliability (intraclass correlation reliability coefficient α = 0.95); thus, in this study, it was decided that drowsiness rating from a single experienced rater would be sufficient.
Data Analysis
Unpaired t-tests (2-sided) were used to investigate any differences between the OSA and control groups in terms of age, body mass, usual daytime sleepiness, circadian type, sleep quality, depression and anxiety, PSG measures (i.e., actual sleep time, sleep efficiency, number of arousals), and drowsiness prior to the ASL scan.
Total gray matter volume in mm3 and mean total gray matter perfusion in mL/100g/min were calculated. Unpaired t-tests (one-sided) were performed to investigate differences in total gray matter volume and mean total gray matter perfusion between the control group and (1) participants with mild OSA, (2) participants with moderate or severe OSA, and (3) all participants with OSA.
Correlations between mean drowsiness during the scan and (1) mean total gray volume, (2) mean total gray matter perfusion, and (3) regional cerebral perfusion were investigated.
False discovery rate (FDR) corrected P values are reported for all correlations and OSA vs control group comparisons.
A general linear model (GLM) for unpaired t-tests (one-sided) was built to investigate voxel-by-voxel differences in gray matter volume and concentration and gray matter perfusion between the control group and (1) participants with mild OSA, (2) participants with moderate or severe OSA, and (3) all participants with OSA. Age, sex, and BMI were included in the GLM as covariates for both the regional gray matter volume/ concentration and perfusion analyses. Drowsiness during the ASL scan and total gray matter perfusion were also included as covariates for the gray matter perfusion analyses. A permutation-based inference tool was used for nonparametric statistical thresholding (“randomise” in FSL 5.0.2; www.fmrib.ox.ac.uk/fsl). For each contrast, the null distribution was generated over 5,000 permutations and the α level set at P < 0.05, corrected for multiple comparisons using threshold-free cluster enhancement.57 The identification of brain regions corresponding to significant activity was guided by the Harvard-Oxford Cortical and Subcortical Structural Atlas (included in the FSL software).
RESULTS
Thirty-three people were recruited from the community as potential healthy control participants. However, following an overnight Level 2 polysomnographic sleep assessment, 14/33 participants were found to have OSA (9 mild, 2 moderate, and 3 severe). An additional 5 people were recruited from the Sleep Unit at Christchurch with OSA (2 mild, 2 moderate, and 1 severe). This led to a final group of 19 controls and 19 people with OSA (11 mild, 4 moderate, and 4 severe).
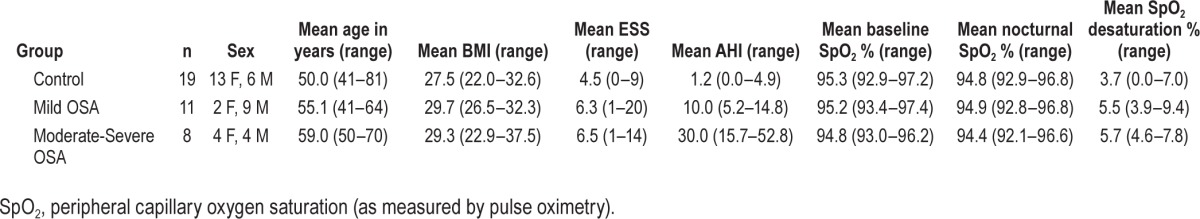
The moderate and severe OSA groups were both evenly split between males and females. However, while proportionately the control group included more females (13 females, 6 males), the mild OSA group included more males (2 females, 9 males). There was a trend for participants with OSA to be older than controls (mean 56.7 vs 50.0 years, t36 = 2.36, P = 0.09). There was no difference in body mass index (BMI) in participants with OSA compared to controls (mean BMI 29.5 vs 27.5, t36 = 1.98, P = 0.13). There was no difference between participants with OSA and controls in self-reported usual daytime sleepiness (mean ESS 6.4 vs 4.5, t36 = 1.30, P = 0.28), circadian type (mean MEQ score 62.2 vs 62.5, t36 = −0.11, P = 0.91), sleep quality (mean PSQI score 5.8 vs 4.8, t36 = 0.77, P = 0.47), or depression and anxiety (mean DASS21 score 4.6 vs 3.7, t36 = 0.76, P = 0.47).
To account for individual variation in demographic measures, sex, age, and BMI were all included as covariates in the primary analyses. A summary of group demographic variables is provided in Table 1.
Table 1.
Summary of group demographics and polysomnography measures.
Following analysis of the overnight polysomnography, there was no difference between participants with OSA and controls in terms of actual sleep (mean 6 h 41 min vs 6 h 42 min, t36 = −0.04, P = 0.91) or sleep efficiency (mean 86.9% vs 89.7%, t36 = −1.21, P = 0.29). However, participants with OSA had more arousals per hour than controls (mean 16.7 vs 7.4, t36 = −5.20, P < 0.001).
There was a trend for participants with OSA to report feeling drowsier than controls just prior to the ASL scan based on KSS score (4.1 vs 2.9, t36 = −2.65, P = 0.06) but not on SSS score (2.5 vs 2.1, t36 = −1.96, P = 0.13). Based on the Wierwille visual rating criteria, there was a trend for participants with OSA to be drowsier during the ASL scan than controls (mean drowsiness score 44.8% vs 25.8%, t36 = 2.27, P = 0.10).
There was no correlation between mean drowsiness during the scan and mean total gray volume. However, there was a correlation between mean drowsiness during the scan and mean total gray matter perfusion (r = −0.46, P = 0.04). Despite the relationship with perfusion at a global level, no relationship was observed between drowsiness during the scan and regional cerebral perfusion.
Reported medications for other health conditions in each of the groups were for the treatment of mild hypertension (1 control, 3 mild OSA), asthma (4 controls), hypercholesterolemia (1 mild OSA, 2 moderate-severe OSA), mild depression (1 control, 1 mild OSA), angina (class II; 1 moderate-severe OSA).
There was no difference in total gray matter volume in participants with OSA compared with controls (mean 647.4 vs 644.4 cm3, t36 = −0.13, P = 0.28). Total gray matter volume in the mild OSA and moderate-severe OSA groups were also compared with controls separately. There was no difference in total gray matter volume in participants with mild OSA compared with controls (mean 668.1 vs 644.4 cm3, t28 = −0.13, P = 0.28), and no difference between moderate-severe OSA and controls (mean 618.9 vs 644.4 cm3, t25 = 0.89, P = 0.28).
Following voxel-based morphometry analysis (including correction for multiple comparisons), there were no differences in regional gray matter volume or concentration between (1) controls and participants with OSA, (2) controls and participants with mild OSA, or (3) controls and participants with moderate-severe OSA.
There was no difference in mean total gray matter perfusion in participants with OSA compared with controls (mean 47.7 vs 53.8 mL/100g/min, t36 = −1.78, P = 0.11). There was also no difference in mean total gray matter perfusion between participants with mild OSA and controls (mean 47.9 vs 53.8 mL/100g/min, t28 = −1.37, P = 0.16). There was also no difference in mean total gray matter perfusion between participants with moderate-severe OSA and controls (mean 47.4 vs 53.8 mL/100g/min, t25 = −1.46, P = 0.16).
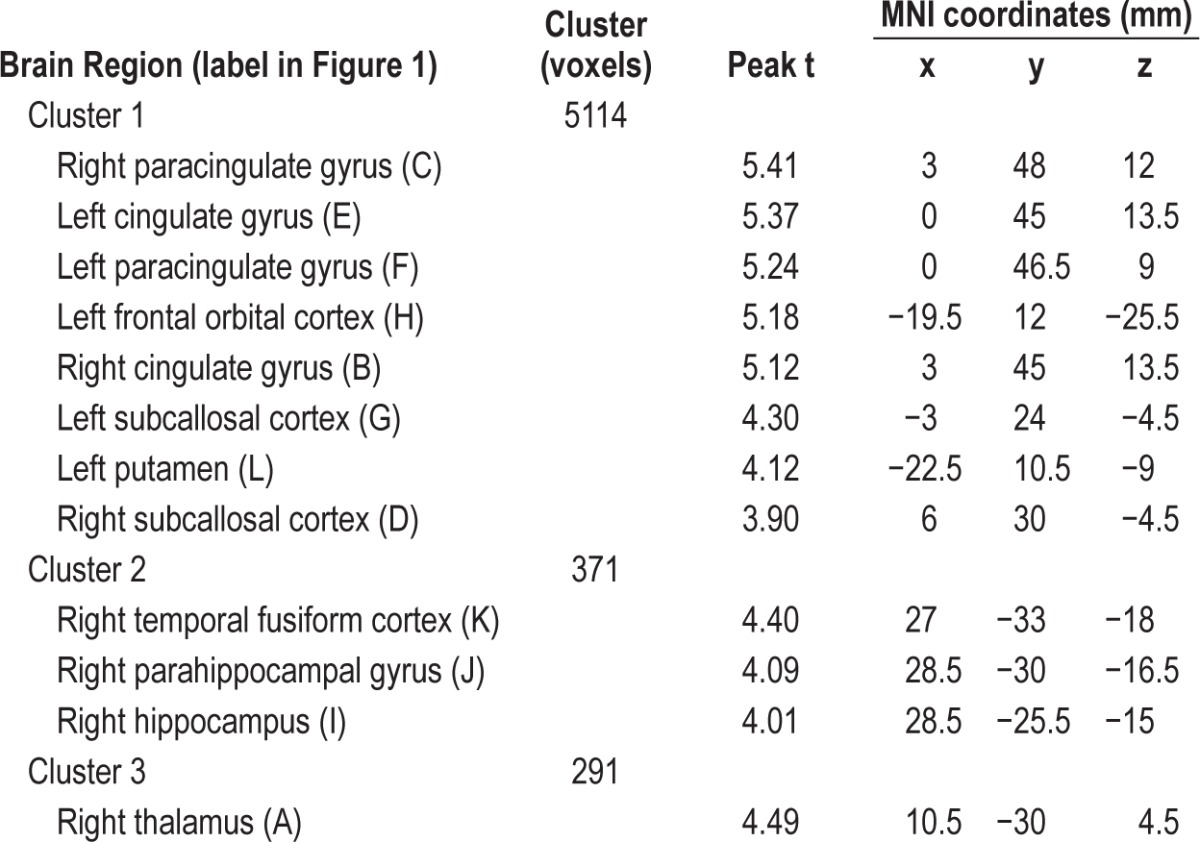
There was no difference in regional cerebral perfusion between participants with mild OSA and controls following multiple-comparisons correction. However, there were 3 clusters of voxels where controls had greater perfusion than those with moderate-severe OSA (Figure 1). The largest cluster (5114 voxels) incorporated the bilateral paracingulate gyrus, bilateral cingulate gyrus (anterior division), bilateral subcallosal cortex, left putamen, and left frontal orbital cortex. The second cluster (371 voxels) was right-lateralized and incorporated the temporal fusiform cortex (posterior division), parahippocampal gyrus, and hippocampus. The third cluster (291 voxels) was in the right thalamus. Table 2 provides peak t-values and MNI coordinates for brain regions in each cluster showing decreased cerebral perfusion.
Figure 1.

Decreased regional perfusion (blue areas) in participants with moderate-severe OSA compared with controls at a threshold of P < 0.05 (corrected for multiple comparisons using TFCE). The regions are A, right thalamus; B, right cingulate; C, right paracingulate; D, right subcallosal cortex; E, left cingulate; F, left paracingulate; G, left subcallosal cortex; H, left frontal orbital cortex; I, right hippocampus; J, right parahippocampal gyrus; K, right temporal fusiform cortex; and L, left putamen. X, Y, and Z are MNI coordinates in mm.
Table 2.
Brain regions included in the clusters that showed a decrease in cerebral perfusion in participants with moderate-severe OSA compared to controls (P < 0.05, threshold-free cluster enhancement correction).
DISCUSSION
We observed decreased perfusion in three large clusters in participants with moderate-severe OSA compared with participants without OSA while awake but at rest. Importantly, we can be confident that these decreases in perfusion were over and above any group variation in drowsiness during the scan, BMI, sex, or age. In addition, the model also took into account individual variation in total gray matter perfusion and was corrected for multiple comparisons. Some of the same areas of decreased perfusion identified in our study had been identified in previous studies, such as parahippocampal gyrus, cingulate gyrus, and temporal gyrus. However, compared with previous studies investigating perfusion, our study identified more regions with significantly decreased perfusion in participants with OSA. This is presumably because OSA-related changes were hidden by confounding factors which were not accounted for in previous studies.
We consider that drowsiness during cerebral perfusion measurement is one of the most important factors that other researchers have not previously investigated or taken into account. In our previous perfusion study in healthy controls, we observed relationships between drowsiness during an ASL scan and cerebral perfusion in arousal-promoting and attentional regions.45 We also observed that within-subject change in drowsiness level from a normally-rested baseline condition to a sleep-restriction condition was strongly negatively correlated with change in regional perfusion in the basal forebraincingulate gyrus network. This shows that transient changes in brain state (e.g., change in drowsiness level) can lead to transient changes in regional cerebral perfusion. Thus, it is vital that drowsiness is included as a covariate so that any additional group differences in regional perfusion can be attributed to OSA-related pathological decreases in cerebral perfusion rather than simply due to group differences in drowsiness level.
In contrast to other studies, we did not observe any differences in regional gray matter concentration or volume. Our differing results could be explained by other studies having larger sample sizes and thus higher power to observe more subtle changes. However, other studies also compared controls with OSA groups with much more severe symptoms than in our study; we hypothesize that initial impairments in autoregulation of regional cerebral blood flow may lead to gray matter loss over time and/or with increasing severity of OSA symptoms. Despite observing no changes in regional gray matter concentration or volume in our group of participants with OSA, it is notable that the majority of regions we identified as having decreased perfusion (specifically, the hippocampus, thalamus, parahippocampal gyrus, anterior cingulate gyrus, putamen, and temporal fusiform cortex) are regions that have been previously identified as showing decreased gray matter volume and/or concentration in studies of people with more severe OSA. There is evidence in the literature of altered perfusion leading to (or at least preceding) reduced gray matter volume in other neurological conditions. For example, Mattsson et al. reported that in Alzheimer disease, “amyloid-β pathology has different associations with cerebral blood flow and volume, and may cause more loss of blood flow in early stages, whereas volume loss dominates in late disease stages.”58 Further studies to elucidate the possible relationship between impaired cerebral perfusion and gray matter loss in OSA will be important.
Previous studies have observed correlations between decreased gray matter volume in people with severe OSA and cognitive performance measures. For example, negative correlations have been observed between reduced gray matter volume in the (1) posterior parietal cortex, superior frontal gyrus, and parahippocampal gyrus and errors on the Stroop test (executive function),25 (2) posterior parietal cortex and performance on the Raven test (abstract reasoning),25 (3) hippo-campus and delayed recall on the Rey Auditory-Verbal learning test19,24 and Rey-Osterrieth Complex Figure.24 In future studies, it would be useful to investigate the correlation between cognitive performance and the regional reduced cerebral perfusion that we observed in people with moderate-severe OSA.
People with severe OSA commonly have significant comorbidities (e.g., severe hypertension or heart disease) which can directly or indirectly (via medications) affect perfusion and drowsiness and which excluded them from our study. People with severe OSA who reported other sleep disorders, such as periodic limb movements and central apnea, were also excluded from our study. The findings of the study are thus limited to people without other sleep disorders or serious health conditions; hence it is possible that there are more widespread and substantial changes in gray matter volume and perfusion in people with additional health conditions. The exclusion, inclusion, or matching of participants with other major health conditions can have a substantial impact on results. For instance, gray matter loss has been observed by two research groups comparing people with OSA with healthy controls,20,26,59 whereas another study found no difference in gray matter volume when OSA and healthy control groups were matched for diabetes, hypertension, and cardiovascular disease.28 Another study observed that an OSA-related decrease in cortical gray matter volume disappeared when controlled for BMI.19
We chose to only look at gray matter perfusion in the current study and excluded analysis of white matter perfusion. White matter perfusion is up to 4.6-fold lower than gray matter per-fusion.60–62 Until recently, the consensus was that ASL lacked the sensitivity necessary for measurement of white matter perfusion.63 However, recent papers have reported that with the introduction of pseudo-continuous labelling, background suppression, and the use of optimized labelling duration and a longer post-labelling delay, it is possible to detect the white matter perfusion signal,64 although there is still a question about the sensitivity in deep white matter regions.60,63
A large number of male participants initially recruited as controls were diagnosed with mild OSA following the overnight sleep study—especially those older than 50 years. This is perhaps an indication of the prevalence of undiagnosed OSA especially in middle-aged males. We could have perhaps decreased the likelihood of recruiting people with undiagnosed OSA by imposing an upper limit on self-reported ESS in prospective controls. That is, although we excluded volunteers who had a previously diagnosed sleep disorder, those taking sedating or stimulating medications (including drinking 4 or more cups of coffee or tea per day), and those with unusual sleep schedules, we did not include an upper limit on ESS for our control group. We considered that if we had an ESS upper limit exclusion criterion for controls but not for people with OSA that this could add a false separation between our groups based on daytime sleepiness rather than OSA per se. That is, would we be able to determine whether the differences between the groups were due to OSA or to increased sleepiness in the OSA group? Ultimately, only 2 of 33 people recruited as controls met the ESS criteria for excessive daily sleepiness and these two people did have OSA. It is possible that these two participants volunteered for the study as they had a suspicion they may have had OSA. Interestingly, 14 of 19 people who were diagnosed with OSA did not meet the ESS criteria for excessive daily sleepiness. This supports studies which have found only a weak relationship between AHI severity and self-reported sleepiness.65,66
In New Zealand only those with the most severe OSA meet the threshold for publicly-funded CPAP treatment while the majority of sufferers with mild-moderate disease remain largely untreated. Thus, while CPAP may be a suitable treatment for OSA, if it is only applied once the person has severe OSA symptoms, irreversible neural and cardiovascular damage may have already occurred.
DISCLOSURE STATEMENT
This was not an industry supported study. This work was funded by a grant from the Canterbury Medical Research Foundation. The authors have indicated no financial conflicts of interest. This work was performed at the New Zealand Brain Research Institute and the Sleep Unit, Christchurch Hospital.
ABBREVIATIONS
- AHI
apnea-hypopnea index
- ASL
arterial spin labeling
- BMI
body mass index
- CPAP
continuous positive airway pressure
- ESS
Epworth Sleepiness Scale
- KSS
Karolinska Sleepiness Scale
- MEQ
Horne-Ostberg Morning-Eveningness Questionnaire
- MNI coordinates
Montreal Neurological Institute coordinates in mm
- MRI
magnetic resonance imaging
- ODI
oxygen desaturation index
- OSA
obstructive sleep apnea
- PSQI
Pittsburgh Sleep Quality Index
- SPECT
single-photon emission computed tomography
- PET
positron emission tomography
- SSS
Stanford Sleepiness Scale
- SpO2
peripheral capillary oxygen saturation
- VBM
voxel-based morphometry
SUPPLEMENTAL MATERIAL
To demonstrate the quality of our arterial spin labelling cerebral brain perfusion images, perfusion data (mL/100g/min) from four example participants with images in subject space (emphasizing the orbitofrontal area which is particularly susceptible to inhomogeneity artifacts) varying in the Z direction (z = 8 to z = 17 voxel coordinates) are provided. Row 1: Participant 450. 51-year-old control (AHI 0.0). Row 2: Participant 449. 46-year-old male with mild OSA (AHI 5.2). Row 3: Participant 404. 55-year-old female with mild OSA (AHI 6.4). Row 4: Participant 443. 59-year-old female with mild OSA (AHI 12.7).
REFERENCES
- 1.Dempsey JA, Veasey SC, Morgan BJ, O'Donnell CP. Pathophysiology of sleep apnea. Physiol Rev. 2010;90:47–112. doi: 10.1152/physrev.00043.2008. [DOI] [PMC free article] [PubMed] [Google Scholar]
- 2.Oyama J, Yamamoto H, Maeda T, Ito A, Node K, Makino N. Continuous positive airway pressure therapy improves vascular dysfunction and decreases oxidative stress in patients with the metabolic syndrome and obstructive sleep apnea syndrome. Clin Cardiol. 2012;35:231–6. doi: 10.1002/clc.21010. [DOI] [PMC free article] [PubMed] [Google Scholar]
- 3.Sforza E, Roche F. Sleep apnea syndrome and cognition. Front Neurol. 2012;3:87. doi: 10.3389/fneur.2012.00087. [DOI] [PMC free article] [PubMed] [Google Scholar]
- 4.Beebe DW, Gozal D. Obstructive sleep apnea and the prefrontal cortex: towards a comprehensive model linking nocturnal upper airway obstruction to daytime cognitive and behavioral deficits. J Sleep Res. 2002;11:1–16. doi: 10.1046/j.1365-2869.2002.00289.x. [DOI] [PubMed] [Google Scholar]
- 5.Young T, Peppard PE, Gottlieb DJ. Epidemiology of obstructive sleep apnea: a population health perspective. Am J Respir Crit Care Med. 2002;165:1217–39. doi: 10.1164/rccm.2109080. [DOI] [PubMed] [Google Scholar]
- 6.Marin JM, Carrizo SJ, Vicente E, Agusti AG. Long-term cardiovascular outcomes in men with obstructive sleep apnoea-hypopnoea with or without treatment with continuous positive airway pressure: an observational study. Lancet. 2005;365:1046–53. doi: 10.1016/S0140-6736(05)71141-7. [DOI] [PubMed] [Google Scholar]
- 7.Grigg-Damberger M. Why a polysomnogram should become part of the diagnostic evaluation of stroke and transient ischemic attack. J Clin Neurophysiol. 2006;23:21–38. doi: 10.1097/01.wnp.0000201077.44102.80. [DOI] [PubMed] [Google Scholar]
- 8.Ancoli-Israel S, Klauber MR, Butters N, Parker L, Kripke DF. Dementia in institutionalized elderly: relation to sleep apnea. J Am Geriatr Soc. 1991;39:258–63. doi: 10.1111/j.1532-5415.1991.tb01647.x. [DOI] [PubMed] [Google Scholar]
- 9.Daulatzai MA. Quintessential risk factors: their role in promoting cognitive dysfunction and Alzheimer's disease. Neurochem Res. 2012;37:2627–58. doi: 10.1007/s11064-012-0854-6. [DOI] [PubMed] [Google Scholar]
- 10.Daulatzai MA. Pathogenesis of cognitive dysfunction in patients with obstructive sleep apnea: a hypothesis with emphasis on the nucleus tractus solitarius. Sleep Disord. 2012;2012:251096. doi: 10.1155/2012/251096. [DOI] [PMC free article] [PubMed] [Google Scholar]
- 11.Somers VK, White DP, Amin R, et al. Sleep apnea and cardiovascular disease: an American Heart Association/American College Of Cardiology Foundation Scientific Statement from the American Heart Association Council for High Blood Pressure Research Professional Education Committee, Council on Clinical Cardiology, Stroke Council, and Council On Cardiovascular Nursing. In collaboration with the National Heart, Lung, and Blood Institute National Center on Sleep Disorders Research (National Institutes of Health) Circulation. 2008;118:1080–111. doi: 10.1161/CIRCULATIONAHA.107.189375. [DOI] [PubMed] [Google Scholar]
- 12.Parati G, Lombardi C, Narkiewicz K. Sleep apnea: epidemiology, pathophysiology, and relation to cardiovascular risk. Am J Physiol Regul Integr Comp Physiol. 2007;293:R1671–83. doi: 10.1152/ajpregu.00400.2007. [DOI] [PubMed] [Google Scholar]
- 13.Yaggi H, Mohsenin V. Obstructive sleep apnoea and stroke. Lancet Neurol. 2004;3:333–42. doi: 10.1016/S1474-4422(04)00766-5. [DOI] [PubMed] [Google Scholar]
- 14.Durgan DJ, Bryan RM., Jr Cerebrovascular consequences of obstructive sleep apnea. J Am Heart Assoc. 2012;1:e000091. doi: 10.1161/JAHA.111.000091. [DOI] [PMC free article] [PubMed] [Google Scholar]
- 15.Arzt M, Young T, Finn L, Skatrud JB, Bradley TD. Association of sleep-disordered breathing and the occurrence of stroke. Am J Respir Crit Care Med. 2005;172:1447–51. doi: 10.1164/rccm.200505-702OC. [DOI] [PMC free article] [PubMed] [Google Scholar]
- 16.Waldhorn RE, Herrick TW, Nguyen MC, O'Donnell AE, Sodero J, Potolicchio SJ. Long-term compliance with nasal continuous positive airway pressure therapy of obstructive sleep apnea. Chest. 1990;97:33–8. doi: 10.1378/chest.97.1.33. [DOI] [PubMed] [Google Scholar]
- 17.Rauscher H, Popp W, Wanke T, Zwick H. Acceptance of CPAP therapy for sleep apnea. Chest. 1991;100:1019–23. doi: 10.1378/chest.100.4.1019. [DOI] [PubMed] [Google Scholar]
- 18.Krieger J. Long-term compliance with nasal continuous positive airway pressure (CPAP) in obstructive sleep apnea patients and nonapneic snorers. Sleep. 1992;15:S42–6. doi: 10.1093/sleep/15.suppl_6.s42. [DOI] [PubMed] [Google Scholar]
- 19.Torelli F, Moscufo N, Garreffa G, et al. Cognitive profile and brain morphological changes in obstructive sleep apnea. NeuroImage. 2011;54:787–93. doi: 10.1016/j.neuroimage.2010.09.065. [DOI] [PMC free article] [PubMed] [Google Scholar]
- 20.Morrell MJ, McRobbie DW, Quest RA, Cummin AR, Ghiassi R, Corfield DR. Changes in brain morphology associated with obstructive sleep apnea. Sleep Med. 2003;4:451–4. doi: 10.1016/s1389-9457(03)00159-x. [DOI] [PubMed] [Google Scholar]
- 21.Morrell MJ, Jackson ML, Twigg GL, et al. Changes in brain morphology in patients with obstructive sleep apnoea. Thorax. 2010;65:908–14. doi: 10.1136/thx.2009.126730. [DOI] [PubMed] [Google Scholar]
- 22.Morrell MJ, Twigg G. Neural consequences of sleep disordered breathing: the role of intermittent hypoxia. Adv Exp Med Biol. 2006;588:75–88. doi: 10.1007/978-0-387-34817-9_8. [DOI] [PubMed] [Google Scholar]
- 23.Yaouhi K, Bertran F, Clochon P, et al. A combined neuropsychological and brain imaging study of obstructive sleep apnea. J Sleep Res. 2009;18:36–48. doi: 10.1111/j.1365-2869.2008.00705.x. [DOI] [PubMed] [Google Scholar]
- 24.Gale SD, Hopkins RO. Effects of hypoxia on the brain: neuroimaging and neuropsychological findings following carbon monoxide poisoning and obstructive sleep apnea. J Int Neuropsychol Soc. 2004;10:60–71. doi: 10.1017/S1355617704101082. [DOI] [PubMed] [Google Scholar]
- 25.Canessa N, Castronovo V, Cappa SF, et al. Obstructive sleep apnea: brain structural changes and neurocognitive function before and after treatment. Am J Respir Crit Care Med. 2011;183:1419–26. doi: 10.1164/rccm.201005-0693OC. [DOI] [PubMed] [Google Scholar]
- 26.Macey PM, Henderson LA, Macey KE, et al. Brain morphology associated with obstructive sleep apnea. Am J Respir Crit Care Med. 2002;166:1382–7. doi: 10.1164/rccm.200201-050OC. [DOI] [PubMed] [Google Scholar]
- 27.Joo EY, Tae WS, Lee MJ, et al. Reduced brain gray matter concentration in patients with obstructive sleep apnea syndrome. Sleep. 2010;33:235–41. doi: 10.1093/sleep/33.2.235. [DOI] [PMC free article] [PubMed] [Google Scholar]
- 28.O'Donoghue FJ, Briellmann RS, Rochford PD, et al. Cerebral structural changes in severe obstructive sleep apnea. Am J Respir Crit Care Med. 2005;171:1185–90. doi: 10.1164/rccm.200406-738OC. [DOI] [PubMed] [Google Scholar]
- 29.Huynh NT, Prilipko O, Kushida CA, Guilleminault C. Volumetric brain morphometry changes in patients with obstructive sleep apnea syndrome: effects of CPAP treatment and literature review. Front Neurol. 2014;5:58. doi: 10.3389/fneur.2014.00058. [DOI] [PMC free article] [PubMed] [Google Scholar]
- 30.Phillips BG, Narkiewicz K, Pesek CA, Haynes WG, Dyken ME, Somers VK. Effects of obstructive sleep apnea on endothelin-1 and blood pressure. J Hypertens. 1999;17:61–6. doi: 10.1097/00004872-199917010-00010. [DOI] [PubMed] [Google Scholar]
- 31.Saletu M, Nosiska D, Kapfhammer G, et al. Structural and serum surrogate markers of cerebrovascular disease in obstructive sleep apnea (OSA): association of mild OSA with early atherosclerosis. J Neurol. 2006;253:746–52. doi: 10.1007/s00415-006-0110-6. [DOI] [PubMed] [Google Scholar]
- 32.Capone C, Faraco G, Coleman C, et al. Endothelin 1-dependent neurovascular dysfunction in chronic intermittent hypoxia. Hypertension. 2012;60:106–13. doi: 10.1161/HYPERTENSIONAHA.112.193672. [DOI] [PMC free article] [PubMed] [Google Scholar]
- 33.Crossland RF, Durgan DJ, Lloyd EE, et al. A new rodent model for obstructive sleep apnea: effects on ATP-mediated dilations in cerebral arteries. Am J Physiol Regul Integr Comp Physiol. 2013;305:R334–42. doi: 10.1152/ajpregu.00244.2013. [DOI] [PMC free article] [PubMed] [Google Scholar]
- 34.Minoguchi K, Yokoe T, Tazaki T, et al. Silent brain infarction and platelet activation in obstructive sleep apnea. Am J Respir Crit Care Med. 2007;175:612–7. doi: 10.1164/rccm.200608-1141OC. [DOI] [PubMed] [Google Scholar]
- 35.Foster GE, Poulin MJ, Hanly PJ. Intermittent hypoxia and vascular function: implications for obstructive sleep apnoea. Exp Physiol. 2007;92:51–65. doi: 10.1113/expphysiol.2006.035204. [DOI] [PubMed] [Google Scholar]
- 36.Faraci FM. Oxidative stress: the curse that underlies cerebral vascular dysfunction? Stroke. 2005;36:186–8. doi: 10.1161/01.STR.0000153067.27288.8b. [DOI] [PubMed] [Google Scholar]
- 37.Lavie L. Oxidative stress in obstructive sleep apnea and intermittent hypoxia - Revisited - The bad ugly and good: implications to the heart and brain. Sleep Med Rev. 2015;20C:27–45. doi: 10.1016/j.smrv.2014.07.003. [DOI] [PubMed] [Google Scholar]
- 38.Joo EY, Tae WS, Han SJ, Cho JW, Hong SB. Reduced cerebral blood flow during wakefulness in obstructive sleep apnea-hypopnea syndrome. Sleep. 2007;30:1515–20. doi: 10.1093/sleep/30.11.1515. [DOI] [PMC free article] [PubMed] [Google Scholar]
- 39.Yadav SK, Kumar R, Macey PM, et al. Regional cerebral blood flow alterations in obstructive sleep apnea. Neurosci Lett. 2013;555:159–64. doi: 10.1016/j.neulet.2013.09.033. [DOI] [PMC free article] [PubMed] [Google Scholar]
- 40.Prilipko O, Huynh N, Thomason ME, Kushida CA, Guilleminault C. An fMRI study of cerebrovascular reactivity and perfusion in obstructive sleep apnea patients before and after CPAP treatment. Sleep Med. 2014;15:892–8. doi: 10.1016/j.sleep.2014.04.004. [DOI] [PubMed] [Google Scholar]
- 41.Baron JC, Lebrun-Grandie P, Collard P, Crouzel C, Mestelan G, Bousser MG. Noninvasive measurement of blood flow, oxygen consumption, and glucose utilization in the same brain regions in man by positron emission tomography: concise communication. J Nucl Med. 1982;23:391–9. [PubMed] [Google Scholar]
- 42.Liu Y, Zhu X, Feinberg D, et al. Arterial spin labeling MRI study of age and gender effects on brain perfusion hemodynamics. Magn Reson Med. 2012;68:912–22. doi: 10.1002/mrm.23286. [DOI] [PubMed] [Google Scholar]
- 43.Chen JJ, Rosas HD, Salat DH. Age-associated reductions in cerebral blood flow are independent from regional atrophy. NeuroImage. 2011;55:468–78. doi: 10.1016/j.neuroimage.2010.12.032. [DOI] [PMC free article] [PubMed] [Google Scholar]
- 44.Ancoli-Israel S, Kripke DF, Klauber MR, Mason WJ, Fell R, Kaplan O. Sleep-disordered breathing in community-dwelling elderly. Sleep. 1991;14:486–95. doi: 10.1093/sleep/14.6.486. [DOI] [PMC free article] [PubMed] [Google Scholar]
- 45.Poudel GR, Innes CRH, Jones RD. Cerebral perfusion differences between drowsy and non-drowsy individuals following acute sleep restriction. Sleep. 2012;35:1085–96. doi: 10.5665/sleep.1994. [DOI] [PMC free article] [PubMed] [Google Scholar]
- 46.Berry RB, Budhiraja R, Gottlieb DJ, et al. Rules for scoring respiratory events in sleep: update of the 2007 AASM Manual for the Scoring of Sleep and Associated Events. Deliberations of the Sleep Apnea Definitions Task Force of the American Academy of Sleep Medicine. J Clin Sleep Med. 2012;8:597–619. doi: 10.5664/jcsm.2172. [DOI] [PMC free article] [PubMed] [Google Scholar]
- 47.Johns MW. A new method for measuring daytime sleepiness: the Epworth sleepiness scale. Sleep. 1991;14:540–5. doi: 10.1093/sleep/14.6.540. [DOI] [PubMed] [Google Scholar]
- 48.Buysse DJ, Reynolds CF, 3rd, Monk TH, Berman SR, Kupfer DJ. The Pittsburgh Sleep Quality Index: a new instrument for psychiatric practice and research. Psychiatry Res. 1989;28:193–213. doi: 10.1016/0165-1781(89)90047-4. [DOI] [PubMed] [Google Scholar]
- 49.Horne JA, Ostberg O. A self-assessment questionnaire to determine morningness-eveningness in human circadian rhythms. Int J Chronobiol. 1976;4:97–110. [PubMed] [Google Scholar]
- 50.Paine SJ, Gander PH, Travier N. The epidemiology of morningness/ eveningness: influence of age, gender, ethnicity, and socioeconomic factors in adults (30-49 years) J Biol Rhythms. 2006;21:68–76. doi: 10.1177/0748730405283154. [DOI] [PubMed] [Google Scholar]
- 51.Taillard J, Philip P, Chastang J-F, Bioulac B. Validation of Horne and Ostberg Morningness-Eveningness Questionnaire in a middle-aged population of French workers. J Biol Rhythms. 2004;19:76–86. doi: 10.1177/0748730403259849. [DOI] [PubMed] [Google Scholar]
- 52.Åkerstedt T, Gillberg M. Subjective and objective sleepiness in the active individual. Int J Neurosci. 1990;52:29–37. doi: 10.3109/00207459008994241. [DOI] [PubMed] [Google Scholar]
- 53.Hoddes E, Dement W, Zarcone V. The development and use of the Stanford sleepiness scale. Psychophysiology. 1972;9:150. [Google Scholar]
- 54.Dai W, Garcia D, de Bazelaire C, Alsop DC. Continuous flow-driven inversion for arterial spin labeling using pulsed radio frequency and gradient fields. Magn Reson Med. 2008;60:1488–97. doi: 10.1002/mrm.21790. [DOI] [PMC free article] [PubMed] [Google Scholar]
- 55.Ashburner J. A fast diffeomorphic image registration algorithm. NeuroImage. 2007;38:95–113. doi: 10.1016/j.neuroimage.2007.07.007. [DOI] [PubMed] [Google Scholar]
- 56.Wierwille WW, Ellsworth LA. Evaluation of driver drowsiness by trained raters. Accid Anal Prev. 1994;26:571–81. doi: 10.1016/0001-4575(94)90019-1. [DOI] [PubMed] [Google Scholar]
- 57.Smith SM, Nichols TE. Threshold-free cluster enhancement: addressing problems of smoothing, threshold dependence and localisation in cluster inference. NeuroImage. 2009;44:83–98. doi: 10.1016/j.neuroimage.2008.03.061. [DOI] [PubMed] [Google Scholar]
- 58.Mattsson N, Tosun D, Insel PS, et al. Association of brain amyloid-beta with cerebral perfusion and structure in Alzheimer's disease and mild cognitive impairment. Brain. 2014;137:1550–61. doi: 10.1093/brain/awu043. [DOI] [PMC free article] [PubMed] [Google Scholar]
- 59.Macey PM, Kumar R, Woo MA, Valladares EM, Yan-Go FL, Harper RM. Brain structural changes in obstructive sleep apnea. Sleep. 2008;31:967–77. [PMC free article] [PubMed] [Google Scholar]
- 60.van Osch MJ, Teeuwisse WM, van Walderveen MA, Hendrikse J, Kies DA, van Buchem MA. Can arterial spin labeling detect white matter perfusion signal? Magn Reson Med. 2009;62:165–73. doi: 10.1002/mrm.22002. [DOI] [PubMed] [Google Scholar]
- 61.Roberts DA, Detre JA, Bolinger L, Insko EK, Leigh JS., Jr Quantitative magnetic resonance imaging of human brain perfusion at 1.5 T using steady-state inversion of arterial water. Proc Natl Acad Sci U S A. 1994;91:33–7. doi: 10.1073/pnas.91.1.33. [DOI] [PMC free article] [PubMed] [Google Scholar]
- 62.Asllani I, Borogovac A, Brown TR. Regression algorithm correcting for partial volume effects in arterial spin labeling MRI. Magn Reson Med. 2008;60:1362–71. doi: 10.1002/mrm.21670. [DOI] [PubMed] [Google Scholar]
- 63.van Gelderen P, de Zwart JA, Duyn JH. Pittfalls of MRI measurement of white matter perfusion based on arterial spin labeling. Magn Reson Med. 2008;59:788–95. doi: 10.1002/mrm.21515. [DOI] [PubMed] [Google Scholar]
- 64.Wu WC, Lin SC, Wang DJ, Chen KL, Li YD. Measurement of cerebral white matter perfusion using pseudocontinuous arterial spin labeling 3T magnetic resonance imaging - an experimental and theoretical investigation of feasibility. PLoS One. 2013;8:e82679. doi: 10.1371/journal.pone.0082679. [DOI] [PMC free article] [PubMed] [Google Scholar]
- 65.Guilleminault C, Brooks SN. Excessive daytime sleepiness: a challenge for the practising neurologist. Brain. 2001;124:1482–91. doi: 10.1093/brain/124.8.1482. [DOI] [PubMed] [Google Scholar]
- 66.Weaver EM, Kapur V, Yueh B. Polysomnography vs self-reported measures in patients with sleep apnea. Arch Otolaryngol Head Neck Surg. 2004;130:453–8. doi: 10.1001/archotol.130.4.453. [DOI] [PubMed] [Google Scholar]
Associated Data
This section collects any data citations, data availability statements, or supplementary materials included in this article.
Supplementary Materials
To demonstrate the quality of our arterial spin labelling cerebral brain perfusion images, perfusion data (mL/100g/min) from four example participants with images in subject space (emphasizing the orbitofrontal area which is particularly susceptible to inhomogeneity artifacts) varying in the Z direction (z = 8 to z = 17 voxel coordinates) are provided. Row 1: Participant 450. 51-year-old control (AHI 0.0). Row 2: Participant 449. 46-year-old male with mild OSA (AHI 5.2). Row 3: Participant 404. 55-year-old female with mild OSA (AHI 6.4). Row 4: Participant 443. 59-year-old female with mild OSA (AHI 12.7).