

Abstract
Background
The cancer/testis antigens (CTAs) are a unique group of proteins normally expressed in germ cells but aberrantly expressed in several types of cancers including prostate cancer (PCa). However, their role in PCa has not been fully explored.
Methods
CTA expression profiling in PCa samples and cell lines was done utilizing a custom microarray that contained probes for two-thirds of all CTAs. The data were validated by quantitative PCR (Q-PCR). Functional studies were carried out by silencing gene expression with siRNA. DNA methylation was determined by methylation-specific PCR.
Results
A majority of CTAs expressed in PCa are located on the X chromosome (CT-X antigens). Several CT-X antigens from the MAGEA/CSAG subfamilies are coordinately upregulated in castrate-resistant prostate cancer (CRPC) but not in primary PCa. In contrast, PAGE4 is highly upregulated in primary PCa but is virtually silent in CRPC. Further, there was good correlation between the extent of promoter DNA methylation and CTA expression. Finally, silencing the expression of MAGEA2 the most highly upregulated member, significantly impaired proliferation of prostate cancer cells while increasing their chemosensitivity.
Conclusions
Considered together, the remarkable stage-specific expression patterns of the CT-X antigens strongly suggests that these CTAs may serve as unique biomarkers that could potentially be used to distinguish men with aggressive disease who need treatment from men with indolent disease not requiring immediate intervention. The data also suggest that the CT-X antigens may be novel therapeutic targets for CRPC for which there are currently no effective therapeutics.
Keywords: cancer/testis antigens, prostate cancer, castrate-resistant prostate cancer, biomarker
Introduction
In the western world, the prevalence of prostate cancer (PCa) is high with significant mortality associated with it. In fact, it is the most commonly diagnosed malignancy and the second leading cause of cancer-related death among men in the US [1]. Treatment for advanced PCa typically begins with androgen ablation, but eventually castrate-resistant prostate cancer (CRPC) emerges often resulting in metastases and death. Unfortunately, at present, there is no known cure for metastatic PCa and standard treatments such as androgen deprivation and chemotherapy that may provide transient relief are not considered curative [2,3]. Further, CRPC is a disease spectrum ranging from asymptomatic patients with rising PSA levels and a prognosis measured in several years, to highly symptomatic patients with widespread metastases requiring end-of-life care [4]. Thus, a clinical dilemma today in the management of PCa is to distinguish men with aggressive disease who need definitive treatment from those who have indolent disease not requiring immediate intervention. Given the high prevalence of the disease, aging population, and potential morbidity of treatment, there is a dire need for novel biomarkers that distinguish aggressive from indolent forms as well as new and effective therapeutics to treat CRPC.
The cancer/testis antigens (CTAs) are a unique group of heterogeneous proteins that are normally confined to germ cells but aberrantly expressed in several types of cancers [5]. Broadly speaking, CTAs can be divided into two groups based on their chromosomal location; the CT-X antigens located on the X chromosome and non-X CT antigens located on autosomes. The CT-X antigens represent more than half of all CTAs and often constitute multigene families organized in well-defined clusters along the X chromosome. The CT-X antigens are frequently expressed in many types of cancers [5] and several studies have shown that their expression patterns are frequently associated with higher grade lesions and advanced disease with a poorer outcome [6–10].
Numerous studies have also revealed a multitude of CTA functions especially, in tumorigenesis. Thus, for example, while several of them including MAGEA1 and MAGEA4 [11], M-phase phospho-protein 1 (MPHOSPH1) [12], CAGE [13,14], PIWIL2 [15], and PDZ-binding kinase/T-LAK cell-originated protein kinase (PBK/T-LAK) [16] appear to function as putative oncogenes and mediators of proliferative signals, others such as the SYT/SSX oncogene [17,18], BRDT [19], BORIS [20], and the histone H3K4 demethylase JARID1B [21], function as chromatin modifiers and epigenetic mediators. Indeed, one of the CT-X antigens, MAGEA11, has also been observed to function as a transcriptional modulator and co-regulator of the androgen receptor [22] underscoring their potential involvement in PCa. Furthermore, the CTAs are widely recognized as attractive immunotherapeutic targets because of their restricted expression in an immune-privileged organ and several clinical trials with promising results have been reported [23].
Despite these significant advances in our knowledge regarding the CTAs in several different types of cancers their role in PCa in particular, remains virtually unexplored. In this manuscript we describe our results on the first systematic study of the CTAs in PCa.
Materials and Methods
Design and Fabrication of CT Array V2.0
The CT Array V2.0 focused microarray contained probes representing 90 CTA genes [5]. Sixty-mer oligonucleotide probes corresponding to each CTA from Agilent Whole Human Genome 44K expression array and eArray 5.0 probe databases were printed with multiple replicates [20–30], together with standard controls and housekeeping genes used on Agilent catalog expression arrays.
Cell Lines and Treatments
Normal prostrate epithelial (PrEC) cells were purchased from Lonza Corp. (Walkersville, MD) and cultured as per the supplier's instructions. The LNCaP, CWR22, DU-145, and the PC3 PCa cell lines were from ATCC and maintained under standard culture conditions. Cells were treated with 3 μmol/L of 5AZA (Sigma–Aldrich, St. Louis, MO) for 72 hr. Fresh medium with drug was changed every 24 hr. R1881 in ethanol was added at a concentration of 10nM final directly to charcoal stripped serum-containing medium.
RNA Extraction and RNA Quality Assessment
Total RNA was isolated with TriZol reagent (Invitrogen, Carlsbad, CA) followed by clean-up using RNeasy mini kit (Qiagen, Valencia, CA). Isolated RNA was quantified with NanoDrop ND-1000 followed by quality assessment with 2100 Bioanalyzer (Agilent Technologies, Santa Clara, CA) according to manufacturer's protocol.
Sample Amplification and Labeling
Sample amplification and labeling procedures were performed using a Low RNA Input Fluorescent Linear Amplification kit (Agilent Technologies). Four hundred nanograms of total RNA was reverse transcribed into first strand and second strand cDNA by MMLV-RT using an oligo dT primer plus T7 promoter sequence followed by labeling reaction containing T7 RNA polymerase and Cyanine-3-CTP (Perkin Elmer, Waltham, MA). The labeled cRNA was purified using RNeasy mini kit (Qiagen). RNA spike-in controls (Agilent Technologies) were added to RNA samples before amplification and labeling according to manufacturer's protocol.
Target Fragmentation and Microarray Hybridization
Fragmentation was carried out by incubating at 60°C for 30 min and stopped by adding an equal volume of 2× hybridization buffer (Agilent Technologies). Fragmented targets were added to the CTArray V2.0, assembled into a hybridization chamber (Agilent Technologies) and hybridized at 65°C for 17 hr in a hybridization oven with rotation. Microarrays were washed and dried according to the Agilent microarray processing protocol.
Microarray Scanning and Data Acquisition
Microarrays are scanned with Agilent G2565BA microarray scanner under default settings recommended by Agilent Technologies for expression microarrays with 100% PMT and 5mm resolutions. Data are extracted using Feature Extraction Software v8.1 (Agilent Technologies) under default settings for expression microarrays with linear and Lowess normalization. Microarrays with >5% feature outlier numbers are excluded.
Data Analysis
Data quality check and analysis were conducted using GeneSpring GX 9.1 or 10 (Agilent Technologies). Background subtracted and log 2 transformed data are quantile-normalized across arrays. P-value is calculated if duplicates are used in the experiment and differentially expressed genes are selected by fold change equal or larger than two combined with P-value (<0.05). The resulting gene list of significance is further filtered by at least one of signal intensities in comparison being called present by Feature Extraction software.
Quantitative Real-Time PCR
One microgram RNA was transcribed into first strand cDNA using QuantiTect Reverse Transcription Kit (Qiagen) according to the manufacturer's protocol in a total volume of 20 μl. Quantitative real-time PCR were carried out with the i-Cycler IQ Real-Time Detection System (Bio-Rad Laboratories, Inc., Hercules, CA). The PCR reaction was performed with 0.2 μl of cDNA template in 25 μl of reaction mixture containing 12.5 μl of iQ SYBR Green Supermix (Bio-Rad Laboratories, Inc.) and 0.25mmol/L each primer. PCR reaction was subjected to hot start at 95°C for 3min followed by 45 cycles of denaturation at 95°C for 10 sec, annealing at 60°C for 30 sec, and extension at 72°C for 30 sec. Amplification of TATA-binding protein (TBP) was used as a control for RNA integrity for all samples. Analysis and fold differences were determined using the comparative CT method. Fold change was calculated from the ΔΔCT values with the formula 2−ΔΔCT.
DNA Isolation and Quantitative Methylation-Specific PCR (MSP)
Total DNA was extracted from cells using DNeasy Tissue Kit (Qiagen). Sodium bisulfite modification was done using 1 μg genomic DNA using EZ DNA Methylation-Gold Kit (Zymo Research Corp.) following the manufacturer's protocol. MSP was performed with a technique based on principles of the MethyLight assay as previously described [31] with some modifications. Briefly, the MSP was performed with 1 μl (50 ng of input DNA before bisulfite modification) of bisulfite-modified DNA template in 25 μl of reaction mixture containing 12.5 μl of iQ SYBR Green Supermix and 0.25 mmol/L each primer. PCR reaction was subjected to hot start at 95°C for 10 min followed by 45 cycles of denaturation at 95°C for 10 sec, annealing at 60°C for 30 sec, and extension at 72°C for 30 sec. Bisulfite converted SssI-treated white blood cell DNA served as a positive control of fully methylated. Fully unmethylated DNA was generated from white blood cell DNA using GenomiPhi DNA Amplification Kit (GE healthcare, Piscataway, NJ). Bisulfite converted fully unmethylated DNA and blank reactions with water substituted for DNA served as negative controls. The normalized index of methylation (NIM) was defined as the ratio of the amount of methylated templates at the alleles of MAGEA2 to the amount of methylated + unmethylated templates. The NIM serves as an index of the percentage of input copies of DNA that are fully methylated at the primer-binding sites.
Short Interfering RNA knock Down (siRNA Knock Down)
MAGEA2 ON-TARGET plus SMART pool siRNA was obtained from Dharmacon. siRNA was transfected with 1 × 10⁴ LNCaP cells at 100nM total oligo concentration, using 0.2 ml DharmaFECT-3 transfection reagent in a 96-well plate.
Cell Proliferation Assay
Cell proliferation was measured using WST-1 (4-[3-{4-iodophenyl}-2-{4-nitrophenyl}-2H-5-tetrazolio]-1,3-benzene disulfonate) (Roche) following manufacture's protocol. Two thousand cells per well were seeded in 96-well plates, after 4 hr incubation with WST-1 reagent, WST-1 absorbance at 450nm was measured.
Detection of Apoptosis
DNA fragmentation was quantified as the percentage of cells with hypodiploid DNA (sub-G1). Cells were fixed with 70% ethanol. The nuclei were stained with Guava Cell Cycle Reagent (Guava Technologies, Hayward, CA). DNA content was measured using a Guava system (Guava Technologies). For every assay, 5 × 10⁴ cells were counted.
Results
Coordinated Expression of the CT-X Antigens in Prostate Cancer Cell Lines
To gain new insight, we determined CTA expression in the androgen-responsive LNCaP and androgen-independent PC-3 cell lines using a focused microarray tiled with probes representing >90 known CTAs that we designed and fabricated. When compared to normal epithelial cells, ∼20% of the CTAs were upregulated (>2- to >800-fold) in androgen-responsive LNCaP but not androgen-independent PC-3 cells (Table I). Remarkably, with one exception, all the upregulated CTAs were located on the X chromosome (CT-X antigens) and >80% belonged to the MAGE-A and CSAG subfamilies (Table I). The MAGE-A subfamily that maps to Xq28 (148.5–152 Mbp) consists of 12 members organized into four subclusters (I–IV). Interestingly, while genes from subcluster I remained virtually silent, those from subclusters II–IV were coordinately upregulated (Table I). Since MAGEA2 was the highest upregulated (>800-fold), we validated its expression by Q-PCR (Supplemental Fig. 1) and focused our attention on this MAGEA antigen for further studies.
Table I. Summary of Cancer/Testis Antigen Expression in Prostate Cells.
| Gene name | Chromosome | Fold change average (LNCaP) | Fold change average (PC-3) | MAGEA subcluster |
|---|---|---|---|---|
| MAGEA2B | Xq28 | 844 | ND | III |
| GAGE7 | Xp11.2 | 745 | ND | |
| MAGEA3 | Xq28 | 154 | ND | III |
| MAGEA1 | Xq28 | 105 | ND | IV |
| MAGEA4 | Xq28 | 94.9 | ND | II |
| CSAG2 | Xq28 | 86.4 | ND | III |
| MAGEA12 | Xq28 | 84.4 | ND | III |
| MAGEA6 | Xq28 | 38.2 | ND | III |
| CTAG1A | Xq28 | 31.2 | ND | |
| XAGE1 | Xp11.22 | 26 | ND | |
| GAGE4 | Xp11.4 | 16.5 | ND | |
| FMR1NB | Xq27.3-q28 | 13.8 | ND | |
| DDX43 | 6q12-q13 | 11.8 | ND | |
| GAGE3 | Xp11.4p11.2 | 7.86 | ND | |
| SSX6 | Xp11.2 | 5.63 | ND | |
| SSX7 | Xp11.23 | 4.52 | ND | |
| CSAG1 | Xq28 | 3.71 | ND | III |
| MAGEA8 | Xq28 | 3.57 | ND | I |
| MAGEA5 | Xq28 | 2.93 | ND | II |
| FTHL17 | Xp21 | ND | 3.97 |
RNA samples from normal prostate epithelial cells (PrEC), LNCaP and PC-3 cells were profiled for CTA expression using the CT Array v2.0 as described in the Experimental Procedures. The average of two independent experiments is shown. Roman numbers indicate the number of the MAGE-A subcluster. ND, expression was not detectable in the microarray experiment.
Detection of the MAGEA/CSAG Subfamily of CT-X Antigens in Prostate Cancer Specimens
To determine the stage at which MAGEA2 is reactivated in PCa, we interrogated microarray data obtained by profiling organ-confined and CRPC samples (Fig. 1). While the organ-confined samples were obtained at the time of surgery, the CRPC samples were from “rapid” autopsies and subsequently propagated as xenografts [24]. Remarkably, MAGEA2, together with several members of subclusters II–IV, was highly upregulated in CRPC but not organ-confined disease. Again, the genes from subcluster I remained virtually silent in these clinical samples (Fig. 1). Furthermore, a Q-PCR analysis of a subset of the same samples demonstrated a good concordance between the two platforms (Fig. 2a–e).
Fig. 1.
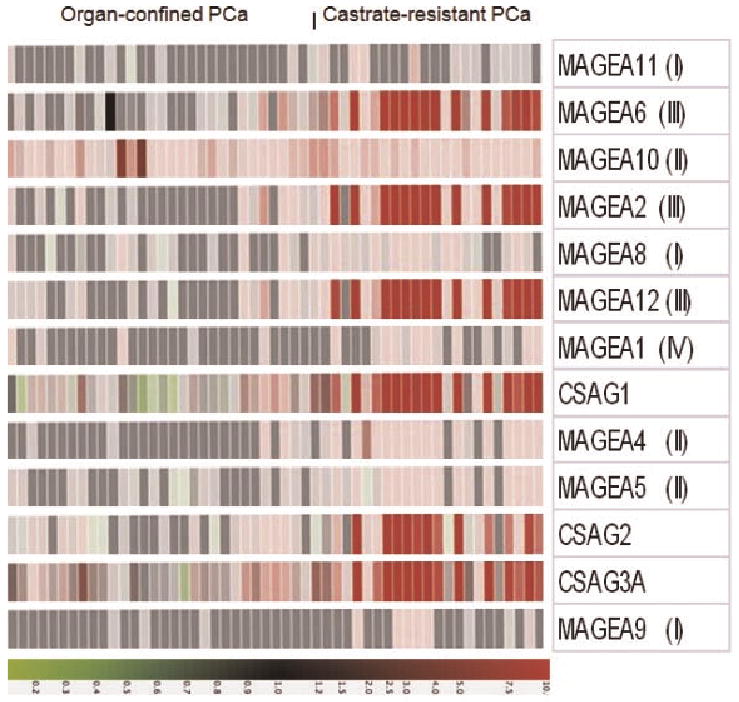
MAGEA2 is predominantly expressed in castrate-resistant prostate cancer. Primary prostate cancer samples were obtained from radical prostatectomy while castrate-resistant prostate cancer were obtained from“rapid”autopsies and propagated as xenografts. Details of these samples are described in Supplemental Tables I and II. RNAsamples were run on awhole genome microarray as described in the Materials and Methods Section. Heat map shows the predominant upregulation of MAGEA genes from subclusters II–IV indicated in parenthesis as well as the CSAG genes. The color display is on a10-fold scale and red indicates overexpression relative to BPH. Green indicates downregulation.
Fig. 2.


Q-PCRvalidationofCT-X antigen expression in prostate cancer specimens. A subset of samples from Figure 1 was used to determine expression by Q-OCR. Relative expression (normalized toTATA-binding protein, TBP) is shown for MAGEA12, CSAG2, MAGEA2, MAGEA6, and PAGE 4 (a–e), respectively.
Intrigued by the striking expression pattern of the MAGEA antigens, we interrogated data from the Gene Expression Omnibus (http://www.ncbi.nlm.nih.gov/geo) to determine their expression in multiple sample sets. We specifically examined those that contained expression data for the CT-X antigens we identified. As shown in Table II of the members of the MAGEA and CSAG subfamilies that were represented on the microarray, all were highly upregulated only in metastatic disease. In contrast, another member of the CT-X family namely, PAGE4, that is upregulated in symptomatic benign prostatic hyperplasia (BPH) [25] and in PCa [26], was highly expressed in BPH and organ-confined PCa but not CRPC (Table II). Furthermore, this complementary expression pattern of PAGE4 was also confirmed by Q-PCR (Fig. 2e). On the other hand, the gene encoding TATA-binding protein, a housekeeping gene, showed no significant variation between all three groups (Table II) indicating that the quality and quantity of the RNA used in the Q-PCR validation were not confounding the differential expression of the CTAs in these samples. Taken together, these data from multiple datasets supported by cross-platform validation have uncovered a coordinated expression pattern of the CT-X antigens that demonstrate remarkable stage/grade-specificity in PCa.
Table II. Differential Expression of CT-X Antigens in Benign Prostate, Organ-Confined (Primary), and Castrate -resistant Prostate Cancer.
| GEO accession #GDS1439 | Benign (n=6) | Primary prostate cancer (n=7) | Metastatic disease (n=6) |
|---|---|---|---|
| PAGE4 (205564_at) | 6732.5 | 5702.8 | 56.6 |
| CSAG2 (220445_s_at) | 16.6 | 20.6 | 1026.4 |
| MAGEA2 (214603_at) | 46.7 | 42.7 | 1343.9 |
| MAGEA6 (214612_x_at) | 30.5 | 16.2 | 2785.1 |
| MAGEA12 (210467_x_at) | 34.9 | 52.9 | 1168.4 |
| TBP (203135_at) | 608.66 | 577.58 | 882.20 |
Microarray data were obtained from GEO (http://www.ncbi.nlm.nih.gov/geo). Number of samples used in each group is indicated in parenthesis. Values from absent calls were floored to zero.
MAGEA2 Expression in Prostate Cancer Is Androgen-Independent
Since the data using a focused microarray demonstrated that the CT-X antigens were expressed only in androgen-responsive LNCaP cells, the involvement of androgens in regulating their expression appeared imminent. To determine the potential involvement of androgens, we cultured LNCaP cells in charcoal-stripped serum-containing medium for 4 days and treated them with the synthetic androgen, R1881. However, we observed no significant stimulation of MAGEA2 expression while that of prostate-specific antigen (PSA), a bona fide androgen-responsive gene, was stimulated ∼5-fold (Supplemental Fig. 2). These data suggest that androgens may not be involved in MAGEA2 regulation.
Epigenetic Regulation of MAGEA2 Expression
The lack of CTA expression in PC-3 cells indicated possible repression due to DNA methylation. To test this possibility, we first determined MAGEA2 expression in additional androgen-responsive and androgen-independent PCa cell lines (Fig. 3). MAGEA2 was upregulated in the androgen-responsive LNCaP and CWR22 cells but not in the androgen-independent PC-3 and DU-145 cells (Fig. 3b). Next we determined the extent of DNA methylation in the MAGEA2 promoter by methylation-specific PCR (MSP) and as expected, it was highly methylated (80–100%) in PC-3 and DU-145 (Fig. 3a). In contrast, the same region was almost completely (>99%) unmethylated in LNCaP and CWR22 cells in which MAGEA2 is upregulated. To confirm this correlation between DNA hypermethylation and suppression of MAGEA2 expression, we treated with the DNA methyltransferase inhibitor 5′-aza-2′-deoxy-azacytidine (5AZA). Indeed, while the 5AZA treatment resulted in the upregulation of MAGEA2 expression in PC-3 and DU-145 cells in which the promoter was hypermethylated, it had no significant effect in LNCaP or CWR22 cells in which the promoter was hypomethylated (Fig. 3c).
Fig. 3.

Epigenetic regulation of MAGEA2 expression in prostate cancer cells. a: Extent of methylation of cytosine residues in the androgen-responsive and androgen-independent prostate cancer cell lines. b: Relative expression of MAGEA2 normalized to TBP before and after 5AZA treatment. c: Fold-change of MAGEA2 expression before and after 5AZA treatment.
Having determined a strong correlation between DNA hypermethylation and CT-X antigen repression, we asked if there was a similar correlation in clinical samples. Again, as expected, we observed that the cytosine residues in the CpG island of the MAGEA2 promoter were highly methylated (>90%) in primary PCa specimens that do not express the CT-X antigens. In contrast, CRPC specimens in which the antigens are aberrantly expressed, the cytosine residues were severely(>90%)hypomethylated(Supplemental Fig. 3).
Silencing MAGEA2 Expression Impairs Cell Growth
To determine the potential function of MAGEA2, we silenced its expression in LNCaP cells using siRNA. As shown in Supplemental Figure 4a, knocking down MAGEA2 expression with the specific siRNA resulted in a 90% decrease in the MAGEA2 mRNA when compared to the control siRNA. Furthermore, knocking down MAGEA2 with the specific siRNA significantly impaired cell proliferation compared to the scrambled (control) siRNA (Supplemental Fig. 4b). However, given the high degree of sequence similarity among the members of this large subfamily, it is possible that the siRNA could have “off-target” effects contributing to the observed phenotype. To rule out this possibility, we determined the levels of several members of the MAGEA subfamily that were also highly upregulated together with MAGEA2. However, aside from MAGEA2, the expression of the other MAGEA members were not affected to any significant extent suggesting that the knock down was specific to MAGEA2 (not shown).
MAGEA2 Upregulation Is Associated With Chemoresistance in Prostate Cancer Cells
Several studies have demonstrated that aberrant expression of CTAs is associated with chemoresistance of tumor cells. In particular, the MAGEA tumor antigens were shown to confer drug resistance by targeting transactivation of p53 in a variety of cancer cells [27]. To investigate whether upregulation of MAGEA2 in PCa was also associated with chemoresistance, MAGEA2 expression was knocked down in LNCaP cells and subsequently treated with docetaxel approved for late-stage PCa. As shown in Figure 4a, reducing the expression of MAGEA2 with the specific siRNA resulted in a marked reduction of cell survival by ∼30% compared to cells treated with the scrambled siRNA especially in the lower concentrations (1 nM) of the drug used in this study. The enhancement of MAGEA2 knock down on chemosensitivity was also confirmed by detecting apoptosis by flow cytometry. Knocking down MAGEA2 expression resulted in apoptosis in >28% of the cells compared to >14% in LNCaP cells transfected with the control siRNA (Fig. 4b).
Fig. 4.

MAGEA2 upregulation is associated with chemoresistance in prostate cancer cells. a: Effect of docetaxel treatment for 3 days on androgen-responsive LNCaP cells. b: Extent of apoptosis as detected by DNA fragmentation determined by flow cytometry.
Discussion
The processes of gametogenesis and tumorigenesis share several important similarities such as immortalization/transformation; implantation/invasion; meiosis/aneuploidy; and migration/metastasis. These similarities have led to the concept that the activation of gametogenic programs that are normally silent in somatic cells may contribute to properties of tumor formation and progression [28].
The CTAs are important constituents of such a gametogenic program in which they are expressed in a precisely orchestrated spatial and temporal manner resulting in highly differentiated and specialized end products, the gametes. Thus, while their aberrant expression could confer tumor cells with a range of phenotypic traits that are highly advantageous to them their expression in “normal” somatic cells could be highly deleterious [28]. Therefore, identifying the CTAs that are “hijacked” by tumor cells, and understanding how the tumor cells deploy them to achieve their “goal” is imperative to understanding and treating cancer.
In this study we have demonstrated for the first time that the CT-X antigens are aberrantly expressed in a coordinated fashion at a specific grade/stage of PCa. Global gene expression profiling of PCa has been well documented and numerous genes [29] and gene fusions [30] that may play important roles in PCa have been identified. However, the present study utilizing a focused CTA microarray has clearly identified a set of genes that have potential both as biomarkers as well as therapeutic targets that have not been reported thus far. Perhaps, additional studies with this focused array using well-defined sample sets may allow a more detailed subclassification of prostate tumors with prognostic implications and therefore, address a critical clinical need.
Although CT-X antigens have previously been observed to be aberrantly expressed in several types of cancers including hematological malignancies, to our knowledge, a distinct expression pattern associated tumor grade/stage has not been demonstrated. For example, Glazer et al. [32] using an integrative epigenetic screening approach identified coordinately expressed genes in human non-small cell lung cancer (NSCLC) whose transcription is driven by promoter demethylation. The authors found that some members of the MAGEA subfamily in addition to several other genes that included those that did not encode CTAs (non-CTAs), were coordinately upregulated in NSCLC but found no correlation between CTA expression and disease stage/grade or subtype. Recently, however, Grigoriadis et al. [10] who investigated CT-X expression in breast cancer observed that, whereas the CT-X antigens were expressed in a minority of the unselected breast cancers, a significantly higher expression frequency was detected in estrogen and progesterone receptor-negative cell lines and clinical samples. Further, the authors found that a coordinated expression pattern of some of the same CT-X antigens reported in the present study in CRPC, to be highly upregulated in high-grade, ER/PR-negative breast tumors that do not overexpress HER2 and have a basal-like phenotype with a distinct tendency for brain metastasis. Given the similarities between PCa and breast cancer, it is striking that these genes are associated with highly aggressive hormone-independent metastatic tumors with very poor outcomes.
It is well known that CTAs, especially the CT-X antigens, are derepressed in response to DNA hypo-methylation [33] but the functional significance of such an association remains unclear. It is possible that the robust expression of these CT-X antigens in response to DNA hypomethylation results in the “selection” of tumor cells that can counter an altered systemic environment by activating alternate pathways, for example, and promote rapid proliferation, tissue invasion and metastasis to distant sites. Interestingly, in a recent study aimed at determining the extent and timing of DNA hypomethylation changes in human PCa, Yegnasubramanian et al. [34] observed that contrary to the prevailing notion, significant DNA hypomethylation occurred only in metastatic PCa. Remarkably, the authors found that several CTA genes including members of the MAGEA subfamily were reactivated by DNA hypomethylation during disease progression and metastatic dissemination. Thus, the correlation between DNA hypomethylation and MAGEA gene expression in CRPC together with the fact that silencing MAGEA2 significantly impaired cell proliferation of PCa cells while increasing their sensitivity to chemo toxic drugs, lends further support to such a hypothesis.
Conclusion
Considered together, these data strongly suggest that the CT-X antigens identified in the present study represent novel biomarkers and therapeutic targets offering new hope for patients with CRPC.
Supplementary Material
Acknowledgments
We thank Dr. Donald Coffey, Dr. William Nelson, and Dr. Srinivasan Yegnasubramanian for thoughtful comments and members of our laboratory for critically reading the manuscript. This work was supported by the Patana Fund, a gift from Mr. H Christian Evenson, a NCI SPORE grant P50CA058236, and The Prostate Cancer Foundation, and NIH grants PO1CA085859 and P50CA097186.
Footnotes
Additional Supporting Information may be found in the online version of this article.
References
- 1.Jemal A, Siegel R, Ward E, Hao Y, Xu J, Thun MJ. Cancer statistics, 2009. CA Cancer J Clin. 2009;59:225–249. doi: 10.3322/caac.20006. [DOI] [PubMed] [Google Scholar]
- 2.Feldman BJ, Feldman D. The development of androgen-independent prostate cancer. Nat Rev Cancer. 2001;1:34–45. doi: 10.1038/35094009. [DOI] [PubMed] [Google Scholar]
- 3.Chen CD, Welsbie DS, Tran C, Baek SH, Chen R, Vessella R, Rosenfeld MG, Sawyers CL. Molecular determinants of resistance to antiandrogen therapy. Nat Med. 2004;10:33–39. doi: 10.1038/nm972. [DOI] [PubMed] [Google Scholar]
- 4.Potvin K, Winquist E. Hormone-refractory prostate cancer: A primer for the primary care physician. Can J Urol. 2008;15(Suppl 1):14–20. [PubMed] [Google Scholar]
- 5.Scanlan MJ, Simpson AJ, Old LJ. The cancer/testis genes: Review, standardization, and commentary. Cancer Immun. 2004;4:1. [PubMed] [Google Scholar]
- 6.Gure AO, Chua R, Williamson B, Gonen M, Ferrera CA, Gnjatic S, Ritter G, Simpson AJ, Chen YT, Old LJ, Altorki NK. Cancer-testis genes are coordinately expressed and are markers of poor outcome in non-small cell lung cancer. Clin Cancer Res. 2005;11:8055–8062. doi: 10.1158/1078-0432.CCR-05-1203. [DOI] [PubMed] [Google Scholar]
- 7.Velazquez EF, Jungbluth AA, Yancovitz M, Gnjatic S, Adams S, O'Neill D, Zavilevich K, Albukh T, Christos P, Mazumdar M, Pavlick A, Polsky D, Shapiro R, Berman R, Spira J, Busam K, Osman I, Bhardwaj N. Expression of the cancer/testis antigen NY-ESO-1 in primary and metastatic malignant melanoma (MM)—Correlation with prognostic factors. Cancer Immun. 2007;7:11. [PMC free article] [PubMed] [Google Scholar]
- 8.Andrade VC, Vettore AL, Felix RS, Almeida MS, Carvalho F, Oliveira JS, Chauffaille ML, Andriolo A, Caballero OL, Zago MA, Colleoni GW. Prognostic impact of cancer/testis antigen expression in advanced stage multiple myeloma patients. Cancer Immun. 2008;8:2. [PMC free article] [PubMed] [Google Scholar]
- 9.Napoletano C, Bellati F, Tarquini E, Tomao F, Taurino F, Spagnoli G, Rughetti A, Muzii L, Nuti M, Benedetti-Panici P. MAGE-A and NY-ESO-1 expression in cervical cancer: Prognostic factors and effects of chemotherapy. Am J Obstet Gynecol. 2008;198:99.e1–99.e7. doi: 10.1016/j.ajog.2007.05.019. [DOI] [PubMed] [Google Scholar]
- 10.Grigoriadis A, Caballero OL, Hoek KS, da Silva L, Chen YT, Shin SJ, Jungbluth AA, Miller LD, Clouston D, Cebon J, Old LJ, Lakhani SR, Simpson AJ, Neville AM. CT-X antigen expression in human breast cancer. Proc Natl Acad Sci USA. 2009;106:13493–13498. doi: 10.1073/pnas.0906840106. [DOI] [PMC free article] [PubMed] [Google Scholar]
- 11.Laduron S, Deplus R, Zhou S, Kholmanskikh O, Godelaine D, De Smet C, Hayward SD, Fuks F, Boon T, De Plaen E. MAGE-A1 interacts with adaptor SKIP and the deacetylase HDAC1 to repress transcription. Nucleic Acids Res. 2004;32:4340–4350. doi: 10.1093/nar/gkh735. [DOI] [PMC free article] [PubMed] [Google Scholar]
- 12.Kanehira M, Katagiri T, Shimo A, Takata R, Shuin T, Miki T, Fujioka T, Nakamura Y. Oncogenic role of MPHOSPH1, a cancer-testis antigen specific to human bladder cancer. Cancer Res. 2007;67:3276–3285. doi: 10.1158/0008-5472.CAN-06-3748. [DOI] [PubMed] [Google Scholar]
- 13.Shim E, Shim H, Bae J, Lee H, Jeoung D. CAGE displays oncogenic potential and induces cytolytic T lymphocyte activity. Biotechnol Lett. 2006;28:515–522. doi: 10.1007/s10529-006-0008-5. [DOI] [PubMed] [Google Scholar]
- 14.Kim Y, Jeoung D. Role of CAGE, a novel cancer/testis antigen, in various cellular processes, including tumorigenesis, cytolytic T lymphocyte induction, and cell motility. J Microbiol Biotechnol. 2008;18:600–610. [PubMed] [Google Scholar]
- 15.Lee JH, Schütte D, Wulf G, Füzesi L, Radzun HJ, Schweyer S, Engel W, Nayernia K. Stem-cell protein Piwil2 is widely expressed in tumors and inhibits apoptosis through activation of Stat3/Bcl-XL pathway. Hum Mol Genet. 2006;15:201–211. doi: 10.1093/hmg/ddi430. [DOI] [PubMed] [Google Scholar]
- 16.Ayllón V, O'connor R. PBK/TOPK promotes tumour cell proliferation through p38 MAPK activity and regulation of the DNA damage response. Oncogene. 2007;26:3451–3461. doi: 10.1038/sj.onc.1210142. [DOI] [PubMed] [Google Scholar]
- 17.Soulez M, Saurin AJ, Freemont PS, Knight JC. SSX and the synovial-sarcoma-specific chimaeric protein SYT-SSX co-localize with the human Polycomb group complex. Oncogene. 1999;18:2739–2746. doi: 10.1038/sj.onc.1202613. [DOI] [PubMed] [Google Scholar]
- 18.Thaete C, Brett D, Monaghan P, Whitehouse S, Rennie G, Rayner E, Cooper CS, Goodwin G. Functional domains of the SYT and SYT-SSX synovial sarcoma translocation proteins and co-localization with the SNF protein BRM in the nucleus. Hum Mol Genet. 1999;8:585–591. doi: 10.1093/hmg/8.4.585. [DOI] [PubMed] [Google Scholar]
- 19.Pivot-Pajot C, Caron C, Govin J, Vion A, Rousseaux S, Khochbin S. Acetylation-dependent chromatin reorganization by BRDT, a testis-specific bromodomain-containing protein. Mol Cell Biol. 2003;23:5354–5365. doi: 10.1128/MCB.23.15.5354-5365.2003. [DOI] [PMC free article] [PubMed] [Google Scholar]
- 20.Smith IM, Glazer CA, Mithani SK, Ochs MF, Sun W, Bhan S, Vostrov A, Abdullaev Z, Lobanenkov V, Gray A, Liu C, Chang SS, Ostrow KL, Westra WH, Begum S, Dhara M, Califano J. Coordinated activation of candidate proto-oncogenes and cancer testes antigens via promoter demethylation in head and neck cancer and lung cancer. PLoS One. 2009;4:e4961. doi: 10.1371/journal.pone.0004961. [DOI] [PMC free article] [PubMed] [Google Scholar]
- 21.Barrett A, Santangelo S, Tan K, Catchpole S, Roberts K, Spencer-Dene B, Hall D, Scibetta A, Burchell J, Verdin E, Freemont P, Taylor-Papadimitriou J. Breast cancer associated transcriptional repressor PLU-1/JARID1B interacts directly with histone deacetylases. Int J Cancer. 2007;121:265–275. doi: 10.1002/ijc.22673. [DOI] [PubMed] [Google Scholar]
- 22.Bai S, He B, Wilson EM. Melanoma antigen gene protein MAGE-11 regulates androgen receptor function by modulating the interdomain interaction. Mol Cell Biol. 2005;25:1238–1257. doi: 10.1128/MCB.25.4.1238-1257.2005. [DOI] [PMC free article] [PubMed] [Google Scholar]
- 23.Brichard VG, Lejeune D. GSK's antigen-specific cancer immunotherapy programme: Pilot results leading to Phase III clinical development. Vaccine. 2007;25(Suppl 2):B61–B71. doi: 10.1016/j.vaccine.2007.06.038. [DOI] [PubMed] [Google Scholar]
- 24.Ellis WJ, Vessella RL, Buhler KR, Bladou F, True LD, Bigler SA, Curtis D, Lange PH. Characterization of a novel androgen-sensitive, prostate-specific antigen-producing prostatic carcinoma xenograft: LuCaP 23. Clin Cancer Res. 1996;2:1039–1048. [PubMed] [Google Scholar]
- 25.Prakash K, Pirozzi G, Elashoff M, Munger W, Waga I, Dhir R, Kakehi Y, Getzenberg RH. Symptomatic and asymptomatic benign prostatic hyperplasia: Molecular differentiation by using microarrays. Proc Natl Acad Sci USA. 2002;99:7598–7603. doi: 10.1073/pnas.112191399. [DOI] [PMC free article] [PubMed] [Google Scholar]
- 26.Iavarone C, Wolfgang C, Kumar V, Duray P, Willingham M, Pastan I, Bera TK. PAGE4 is a cytoplasmic protein that is expressed in normal prostate and in prostate cancers. Mol Cancer Ther. 2002;1:329–335. [PubMed] [Google Scholar]
- 27.Monte M, Simonatto M, Peche LY, Bublik DR, Gobessi S, Pierotti MA, Rodolfo M, Schneider C. MAGE-A tumor antigens target p53 transactivation function through histone deacetylase recruitment and confer resistance to chemotherapeutic agents. Proc Natl Acad Sci USA. 2006;103:11160–11165. doi: 10.1073/pnas.0510834103. [DOI] [PMC free article] [PubMed] [Google Scholar]
- 28.Simpson AJ, Caballero OL, Jungbluth A, Chen YT, Old LJ. Cancer/testis antigens, gametogenesis and cancer. Nat Rev Cancer. 2005;5:615–625. doi: 10.1038/nrc1669. [DOI] [PubMed] [Google Scholar]
- 29.Luo J, Isaacs WB, Trent JM, Duggan DJ. Looking beyond morphology: Cancer gene expression profiling using DNA microarrays. Cancer Invest. 2003;21:937–949. doi: 10.1081/cnv-120025096. [DOI] [PubMed] [Google Scholar]
- 30.Tomlins SA, Rhodes DR, Perner S, Dhanasekaran SM, Mehra R, Sun XW, Varambally S, Cao X, Tchinda J, Kuefer R, Lee C, Montie JE, Shah RB, Pienta KJ, Rubin MA, Chinnaiyan AM. Recurrent fusion of TMPRSS2 and ETS transcription factor genes in prostate cancer. Science. 2005;310:644–648. doi: 10.1126/science.1117679. [DOI] [PubMed] [Google Scholar]
- 31.Eads CA, Danenberg KD, Kawakami K, Saltz LB, Blake C, Shibata D, Danenberg PV, Laird PW. MethyLight: A high-throughput assay to measure DNA methylation. Nucleic Acids Res. 2000;28:E32. doi: 10.1093/nar/28.8.e32. [DOI] [PMC free article] [PubMed] [Google Scholar]
- 32.Glazer CA, Smith IM, Ochs MF, Begum S, Westra W, Chang SS, Sun W, Bhan S, Khan Z, Ahrendt S, Califano JA. Integrative discovery of epigenetically derepressed cancer testis antigens in NSCLC. PLoS One. 2009;4:e8189. doi: 10.1371/journal.pone.0008189. [DOI] [PMC free article] [PubMed] [Google Scholar]
- 33.De Smet C, Lurquin C, Lethe B, Martelange V, Boon T. DNA methylation is the primary silencing mechanism for a set of germ line- and tumor-specific genes with a CpG-rich promoter. Mol Cell Biol. 1999;19:7327–7335. doi: 10.1128/mcb.19.11.7327. [DOI] [PMC free article] [PubMed] [Google Scholar]
- 34.Yegnasubramanian S, Haffner MC, Zhang Y, Gurel B, Cornish TC, Wu Z, Irizarry RA, Morgan J, Hicks J, DeWeese TL, Isaacs WB, Bova GS, De Marzo AM, Nelson WG. DNA hypomethylation arises later in prostate cancer progression than CpG island hypermethylation and contributes to metastatic tumor heterogeneity. Cancer Res. 2008;68:8954–8967. doi: 10.1158/0008-5472.CAN-07-6088. [DOI] [PMC free article] [PubMed] [Google Scholar]
Associated Data
This section collects any data citations, data availability statements, or supplementary materials included in this article.