

Abstract
Purpose
To report methodological details and feasibility of conducting an accelerometer ancillary study in a large U.S. cohort being followed for stroke and cognitive decline.
Methods
REGARDS is a national, population-based study of 30,239 blacks and whites, aged ≥ 45 years, enrolled January 2003–October 2007. Baseline evaluations were conducted through computer-assisted telephone interview (CATI) and an in-home visit. Participants are followed by CATI every 6 months. Starting with May 2009 follow-up, contingent on accelerometer availability, participants were invited to wear an accelerometer for 7 days. Device inventory was 1,150. Accelerometer, instructions, log sheet and stamped addressed return envelope were mailed to consenting participants. Postcard acknowledgement and reminders, and ≤ two calls were made to encourage compliance.
Results
Between May 2009 and January 2013, 20,076 were invited to participate; 12,146 (60.5%) consented. Participation rates by race-sex groups were similar: black women 58.6%, black men 59.6%, white women 62.3% and white men 60.5%. Mean age of the 12,146 participants to whom devices were shipped was 63.5 ± 8.7 years. Return rate was 92%. Of 11,174 returned, 1,187 were not worn, 14 had device malfunction, and of 9,973 with data, 8,096 (81.2%) provided usable data, defined as ≥ 4 days of 10+ hours of wear time, ranging from 74.4% among black women to 85.2% among white men.
Conclusions
Using mail and telephone methods, it is feasible to obtain objective measures of physical activity from a sizeable proportion of a national cohort of adults, with similar participation rates among blacks and whites. Linked with the clinical health information collected through follow-up, these data will allow future analyses on the association between objectively-measured sedentary time, physical activity and health outcomes.
Keywords: physical activity, adults, participation, longitudinal studies, measurement
Introduction
Physical inactivity is an important public health problem and a major modifiable cardiovascular risk factor.(6, 9, 10, 26) Two meta-analyses of physical activity (PA) and stroke have been conducted.(20, 31) In total, 31 relevant published studies on PA and stroke risk have found moderately or highly active individuals had lower risk of incident stroke or mortality than did low-active persons. Being moderately active during leisure time was associated with 15%–20% lower total stroke incidence and mortality, compared with being inactive. Being highly active during leisure time was associated with 20%–27% lower total stroke incidence and mortality, compared with being inactive. However, evidence of a dose-response relationship between PA and stroke risk is inconclusive, and meager data exist for certain subgroups including women and racial minorities.(4, 5, 15, 17, 18, 21, 27, 32) Most recently, data from the large, national prospective cohort study, REasons for Geographic and Racial Differences in Stroke (REGARDS), of men and women, blacks and whites, of mean age 64.6 years, showed that regular PA, defined by self-report as engaging in intense PA four or more times a week, was associated with decreased risk of the combined outcome of stroke and transient ischemic attack.(24) While there was not a difference by race groups, there was a trend for difference by sex groups with an increased risk of stroke for men reporting PA 1–3 three times a week compared with four or more times a week.(24) No prospective studies have examined associations between objectively measured physical activity (PA) and stroke, the fourth leading cause of death in the United States.(6)
There are differences in the incidence of stroke across racial groups and geographic regions.(12, 14) Accurately and objectively measuring PA will allow for an examination of the degree to which varying rates of PA contribute to these disparities. No published study has been specifically designed to examine racial or geographical variations in PA and stroke in the US. Therefore, our study was designed to fill these gaps by obtaining objective measures of PA in REGARDS, an ongoing epidemiologic study of risk factors for stroke that is national in coverage and includes large numbers of women and blacks. Herein we describe the methodological details and experience of obtaining objective measures of PA through the use of accelerometers in the study.
Methods
REGARDS is an ongoing, national, population-based, longitudinal study of 30,239 blacks and whites, aged ≥ 45 years, enrolled January 2003–October 2007. REGARDS was designed to investigate causes of regional and black-white disparities in stroke mortality, oversampling blacks and residents of the Stroke Belt, an area in the southeastern U.S. characterized by high stroke mortality (North Carolina, South Carolina, Georgia, Alabama, Mississippi, Tennessee, Arkansas, and Louisiana).(1, 19) Participants were recruited by a combination of mail and telephone contact from a commercially available list of US residents. Demographic information, socioeconomic factors, medical history and verbal informed consent were obtained at baseline by computer-assisted telephone interview (CATI). At a subsequent in-home examination, written informed consent, blood pressure, anthropomorphic measures, blood samples, electrocardiogram (ECG), and medication inventory were obtained using standardized methods as previously reported. (13) Self-administered questionnaires were left with participants at that time. Participants were recruited from all 48 of the lower United States and include residents of 1,855 of their 3,069 unique counties. Approximately 21% of the cohort is from the “buckle” of the Stroke Belt (coastal plains of North Carolina, South Carolina, and Georgia), 35% from the remainder of the Stroke Belt, and the remaining 44% from the other 40 contiguous states. The final cohort was 45% men, 55% women, 58% whites and 42% blacks; mean age at enrollment was 65.3 years. Participants are followed by CATI every 6 months for incident stroke events and change in cognitive function. The primary performance site for the study is the University of Alabama at Birmingham (UAB) that houses both the Operations Center and the Survey Research Unit (SRU) for the baseline and follow-up CATI interviews. Study methods were reviewed and approved by the Institutional Review Boards (IRBs) at each study institution. All participants gave written informed consent.
Physical Activity Accelerometer Ancillary Study
An ancillary study proposal for an accelerometer supplement to REGARDS was approved by the REGARDS Executive Committee and developed into a research application that was funded by NIH to the University of South Carolina (USC) in October 2008 for implementation into the ongoing REGARDS follow-up. Consent was obtained verbally by phone. The ancillary study was approved by the IRBs at UAB and USC.
The accelerometers used were Actical™ activity monitors (Mini Mitter Respironics, Inc., Bend, OR). The choice was based on several factors: validity and reliability, goals of the study (to quantify the frequency, duration, and intensity of physical activity), cost/convenience in that the investigators had an initial supply on hand to start with (including peripherals such as computer interface and software), cost of supplies to attach the monitor, familiarity with the technology (30) and feasibility/acceptability of use in older adults. (11) The initial supply of devices was 600, but with some budget readjustment and additional unrestricted funds, an additional 550 devices were purchased in year 2 to accelerate enrollment.
All active members of the cohort were targeted to be invited to wear an accelerometer (i.e., those who had not withdrawn/died and were still being followed through regular six-month telephone calls.) Accelerometer study recruitment began at a slow rate to allow for an assessment of staffing needs, participant cooperation and communication needs, and database systems refinement for tracking of devices, critical dates, supplies, and communications among the SRU, Operations, and USC for data transfer. See Figure 1 for flow chart of processes and data systems. During one of the participant’s routine biannual follow-up telephone calls, when an accelerometer was available, a screening question was asked: “on a typical day, are you physically able to go outside where you live and walk, whether or not you actually do?” When there were no devices currently available, the “switch” was turned off such that the screening question was not asked, and that participant was deferred to potentially be screened on their next follow-up call. If the participant response was “yes,” a brief explanation of the purpose of the study was given and the participant was asked if he/she was willing to wear the accelerometer for seven consecutive days and complete a daily log sheet. If the response was “no,” the participant could be screened again on a subsequent call.
Figure 1.

Flow Chart of Recruitment of Participants, Tracking of Accelerometer, and Participant Study Completion
Participants who answered “yes,” to the screening question were invited to participate; they were told it did not matter what their current level of physical activity was, that the device would arrive in the mail within the next week, and they would need to start wearing the device the day after receipt. Response options were “yes,” a definitive “no” or “not now, maybe later,” i.e., deferred. “Deferred”, indicated that the participant either was not interested or not available at that time to wear the device, and could be asked again on a subsequent follow-up call. If the participant agreed to wear the device (i.e., verbal consent) and indicated availability to do so immediately upon receipt, the SRU notified UAB staff responsible for implementing the accelerometer protocol. Staff initialized the Actical™, attached it to an adjustable nylon belt, and mailed it via regular US mail to the participant along with a cover letter, written and pictorial wear instructions, daily log sheet, protocol check list, and pre-addressed postage-paid, padded, return envelope (also by regular US mail). Instructions included: to wear the device the day after receipt, remove it at bedtime and reattach upon awakening, place the device over the right hipbone crest, make sure the belt was snug around the waist, complete the daily log sheet with start date and time the device was put on and taken off each day, and return the device immediately after wearing for the seven day period. Participants were encouraged to call the REGARDS toll-free telephone number for any questions or concerns. Reminder post cards were mailed two to three days following the initial mailing of the device to encourage compliance including recording and return of log sheet. Additional return efforts included staff initiated follow-up postcards and telephone calls if the device was not received back at UAB within 45 and 65 days, respectively.
Upon return of a device, any available data were downloaded using a serial port computer interface and transferred from UAB to USC. The reusable belts were sent to commercial laundry for cleaning/sanitizing. Batteries in devices were checked and changed if necessary and the device was re-initialized for re-use. Within a few weeks of return of the device, to provide feedback to the participant, USC performed a preliminary examination of the data to obtain an approximate estimate of wear time and minutes of moderate to vigorous physical activity (MVPA). Results were reported in broad categories: minimal (0–29 minutes), less than recommended (30–149 minutes), or meeting recommendation (≥150 minutes). All participants for whom some meaningful wear time was evident on the majority of days, even if not the full 10 hours, were given feedback. Those who did not wear the Actical™ on most days were informed that their MVPA could not be estimated. The mailed results letter to the participant also included advice/examples and encouragement related to staying active or increasing activity level.
Initial recruitment for the parent REGARDS study occurred January 2003–October 2007. Screening and enrollment for the accelerometer ancillary study occurred May 2009-January 2013. Of the original REGARDS participants, the cohort sample available for the accelerometer study was 24,408. After accounting for those who withdrew from the parent REGARDS study (n=834) or died (n=1,026) prior to being screened, the number who could have been invited to participate in the accelerometer study was 22,548. Participant characteristics, collected at time of enrollment into the parent REGARDS study, were used to describe the participants. Age, race, sex, highest education level, annual household income, smoking (current, never, past), physical activity, physician diagnosis of stroke, history of diabetes, history of kidney disease/kidney failure and self-rated health status (“In general, would you say that your health is excellent, very good, good, fair, or poor?) were defined by self-report. Physical activity level was defined by numeric response to the open-ended question “How many times per week do you engage in intense physical activity, enough to work up a sweat?” categorized as 4 or more times per week, 1–3 times a week or none. History of heart disease was defined as self-reported myocardial infarction (MI), coronary artery bypass surgery, coronary angioplasty or stenting, or evidence of MI from study ECG. Body mass index (BMI) was determined as a function of measured height and weight. A returned accelerometer was defined as providing usable data if all of the following conditions were met: (a) a log sheet with valid start date was returned with device, (b) the device was worn for 4 or more days with at least 10 hours of wear time, and (c) there were no device errors (e.g. spurious activity counts >20,000 or lengthy strings of repeated activity counts). Non-wear time was defined as 150 or more continuous minutes of zero counts, based on a validation study from REGARDS.(16)
Statistical analyses
Participation rates and data on tracking of devices and devices returned with usable data were summarized and reported by race-sex groups. To examine differences in baseline characteristics between those who agreed to wear the device vs. those who declined, the chi-square test was used for categorical variables and the t-test was used for continuous variables. Participants who were deferred and were not re-offered the opportunity to wear the accelerometer were omitted from the comparison.
Results
Of the 22,548 REGARDS participants who could have been invited to participate in the accelerometer study, 481 were screened and determined not to be eligible and for 1,991 a device was not available for them to be screened and/or invited to participate. Of the 20,076 participants who were invited, 12,146 (60.5%) agreed, 7,312 (36.4%) declined, and 618 (3.1%) were deferred and did not have the opportunity to be asked again during the enrollment period. Participation rates did not differ substantially by race-sex groups: black women 58.6%, black men 59.6%, white women 62.3%,, and white men 60.5% (Table 1.) The mean time from parent study enrollment (baseline in-home visit) to agreeing to wear the accelerometer was 5.75± 1.5 years. Demographic and baseline descriptive characteristics for those who agreed to participate and those who did not are shown in Table 2. Participants who agreed had higher education level and higher household income, but other significant differences were not clinically meaningful.
Table 1.
Invitation and response to participate in REGARDS accelerometer study by race-sex groups (N=20,076)
| Sex- Race Group |
Invited to wear accelerometer (N=20,076) |
Agreed to participate (n=12,146) |
Not Now and not recontacted (n=618) |
Declined to participate (n=7,312) |
|---|---|---|---|---|
| Black women | 4840 | 2835 (58.6%) | 180 (3.7%) | 1825 (37.7%) |
| Black men | 2749 | 1638 (59.6%) | 101 (3.7%) | 1010 (36.7%) |
| White women | 6411 | 3995 (62.3%) | 185 (2.9%) | 2231 (34.8%) |
| White men | 6076 | 3678 (60.5%) | 152 (2.5%) | 2246 (37.0%) |
Table 2.
Characteristics of participants compared to nonparticipants in REGARDS accelerometer study. (N=19,458)
| Characteristic (% or mean±SD) | Yes (n=12,146) | No (n=7,312) | p-value |
|---|---|---|---|
| Age (years)a | 63.5 ± 8.7 | 64.9 ± 8.9 | < 0.0001 |
| Race-Sex Groups | 0.0033 | ||
| Black women | 2835 (23%) | 1825 (25%) | |
| Black men | 1638 (13%) | 1010 (14%) | |
| White women | 3995 (33%) | 2231 (31%) | |
| White men | 3678 (30%) | 2246 (31%) | |
| Region | 0.0002 | ||
| Belt | 4009 (33%) | 2601 (36%) | |
| Buckle | 2629 (22%) | 1597 (22%) | |
| Nonbelt | 5508 (45%) | 3114 (43%) | |
| Urban Group | 0.88 | ||
| Urban | 8399 (77%) | 5108 (77%) | |
| Mixed | 1283 (12%) | 764 (12%) | |
| Rural | 1292 (12%) | 773 (12%) | |
| Highest Education | <0.0001 | ||
| Less than HS | 933 (8%) | 834 (11%) | |
| HS Graduate | 2763 (23%) | 2044 (28%) | |
| Some college | 3298 (27%) | 1918 (26%) | |
| College graduate and above | 5150 (42%) | 2512 (34%) | |
| Annual household income | <0.0001 | ||
| < 20,000 | 1555 (14%) | 1158 (18%) | |
| 20,000–34,000 | 2715 (25%) | 1716 (27%) | |
| 35,000–74,000 | 4119 (38%) | 2269 (36%) | |
| > 75,000 | 2520 (23%) | 1153 (18%) | |
| Body Mass Indexb | 0.07 | ||
| Underweight | 116 (1%) | 50 (1%) | |
| Normal weight | 2890 (24%) | 1661 (23%) | |
| Overweight | 4559 (38%) | 2783 (38%) | |
| Obese | 4525 (37%) | 2776 (38%) | |
| BMIa, kg/m2 | 29.2 ± 6.0 | 29.3 ± 6.0 | 0.1 |
| Smoking | 0.0003 | ||
| Current | 1433 (12%) | 935 (13%) | |
| Never | 5910 (49%) | 3342 (46%) | |
| Past | 4760 (39%) | 3006 (41%) | |
| Physical activity level | <0.0001 | ||
| None | 3520 (29%) | 2403 (33%) | |
| 1–3 times/week | 4740 (40%) | 2660 (37%) | |
| ≥ 4 times/week | 3742 (31%) | 2154 (30%) | |
| Self-rated health | <0.0001 | ||
| Excellent | 2372 (20%) | 1161 (16%) | |
| Very good | 4184 (35%) | 2339 (32%) | |
| Good | 4054 (33%) | 2627 (36%) | |
| Fair | 1309 (11%) | 1005 (14%) | |
| Poor | 209 (2%) | 168 (2%) | |
| History of: | |||
| Stroke | 492 (4%) | 359 (5%) | 0.004 |
| Heart disease | 716 (6%) | 553 (8%) | <0.0001 |
| Kidney failure/disease | 108 (1%) | 106 (1%) | 0.0003 |
| Diabetes | 2216 (18%) | 1513 (21%) | <0.0001 |
| Hypertension | 6490 (54%) | 4202 (58%) | <0.0001 |
mean ± SD.
underweight: <18.5 kg.m2; normal weight: 18.5–24.9 kg.m2; overweight: 25–29.9 kg.m2; obese: ≥30.0 kg.m2.
Mean age of the 12,146 participants to whom devices were shipped was 63.5 ± 8.7 years. The return rate was 92%. Of the devices that were mailed, 972 (8.0%) were lost/not returned, 1,187 (9.8%) were returned not worn, 14 (0.11%) were returned and found to be defective such that no data could be downloaded, and 9,973 (82.1%) were returned with data (Table 3). The percentage of returned devices that were not worn varied across the race-sex groups, ranging from a low of 7.9% in white men to a high of 12.2% in black women. Of the 9,973 participants who returned and wore the accelerometer, 8,096 (81.1%) provided usable data (Table 4), after exclusions for device error, missing log sheet, and wear time < 4 days with ≥ 10 hr/day. The proportion with usable data was significantly higher in whites (83.4%–85.2%) than blacks (74.4%–76.6%), driven largely by the higher rate of lost/not returned devices in blacks. Using the denominator of accelerometers mailed out to 12,146 participants, 66.7% (8,096) provided usable data with the highest yield from white men (74.5%) and lowest from black women (56.1%). Figure 2 shows the age distribution of the 8,096 with usable data, ranging from 49–98 years.
Table 3.
Tracking of accelerometer return by race-sex groups (N=12,146)
| Accelerometer Return Category | Total (12,146) (100%) |
Black Women (2835) |
Black Men (1638) |
White Women (3995) |
White Men (3678) |
|---|---|---|---|---|---|
| Lost/not returned | 972 (8.0%) |
346 (12.2%) |
232 (14.2%) |
227 (5.7%) |
167 (4.5%) |
| Returned, but not worn | 1,187 (9.8%) |
346 (12.2%) |
140 (8.5%) |
410 (10.3%) |
291 (7.9%) |
| Returned, but device defective | 14 (0.1%) |
5 (0.2%) |
1 (0.1%) |
4 (0.1%) |
4 (0.1%) |
| Returned and worn | 9,973 (82.1%) |
2138 (75.4%) |
1265 (77.2%) |
3354 (84.0%) |
3216 (87.4%) |
Table 4.
Usable and unusable data from returned and worn accelerometers by race-sex groups (N=9,973)
| Usability Category of returned and worn accelerometer |
Total (9,973) (100%) |
Black Women (2,138) |
Black Men (1,265) |
White Women (3,354) |
White Men (3,216) |
|
|---|---|---|---|---|---|---|
| Exclusions resulting in unusable data* | 1,877 | 548 | 296 | 558 | 475 | |
| Less those with device errors | 231 | 53 | 31 | 85 | 62 | |
| Less those missing log sheet | 952 | 275 | 161 | 287 | 229 | |
| Less those with < 4 days with ≥ 10 hr/day wear time | 694 | 220 | 104 | 186 | 184 | |
| Usable data | 8,096 (81.1%) |
1,590 (74.4%) |
969 (76.6%) |
2,796 (83.4%) |
2,741 (85.2%) | |
Exclusion reasons were applied sequentially, e.g., subtracting those with device errors, then subtracting those missing log sheet, and finally, subtracting those worn < 4 days with ≥ 10 hr/day wear time
Figure 2.
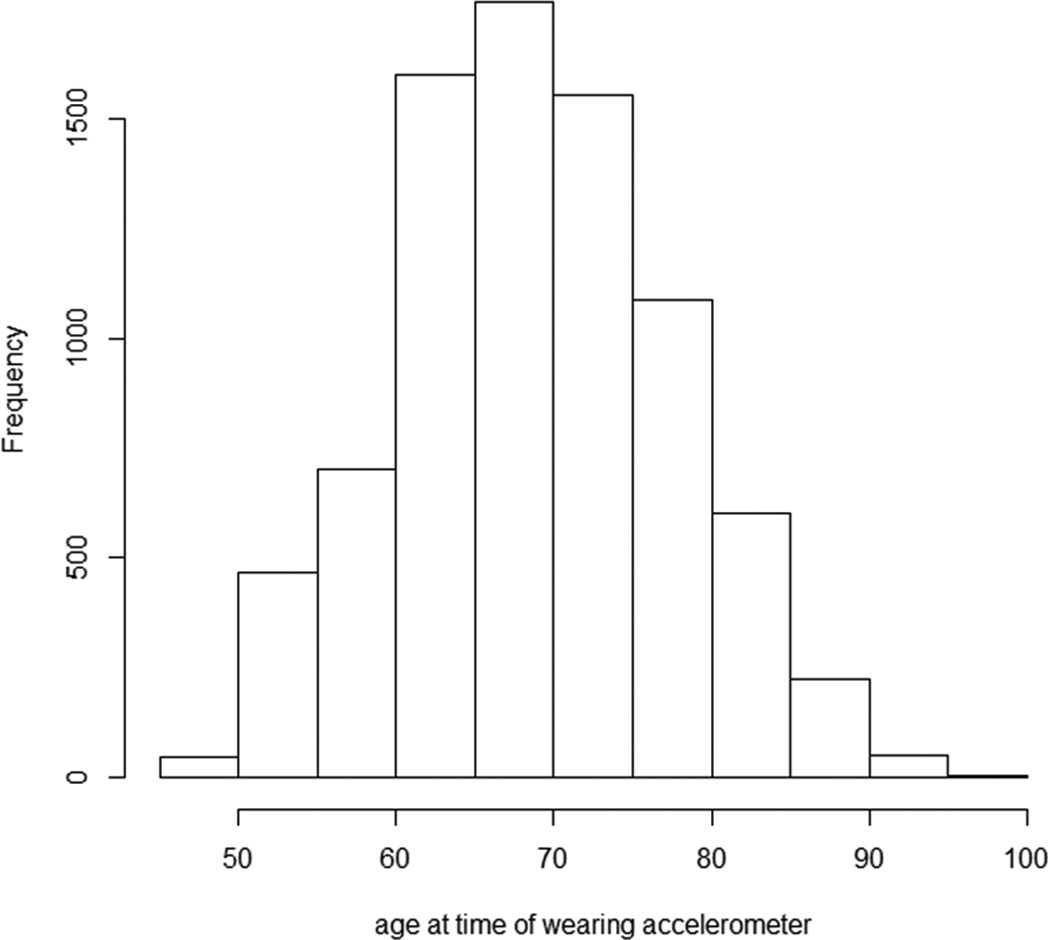
Age distribution of REGARDS Participants with Usable Accelerometer Data (N=8,096)
Discussion
We described the methodology and feasibility of collecting accelerometer data from an established and ongoing large, national cohort study of adults aged 49 and older, 2.1– 9.6 years after their enrollment in the parent study. With a sample size of 8,096 participants who provided usable data according to our definition, this is one of the largest studies in the US that provides national accelerometer data from black and white adults, middle-aged and older. We contend that there were no substantial differences by race-sex groups in those agreeing to participate compared with those who did not, with the exception that those who participated had higher socioeconomic status defined by higher education level and higher household income. Importantly, we have herein focused on “clinically significant differences” rather than statistical testing in this large sample size where differences that are unimportant are nearly uniformly statistically significant. This approach requires a subjective judgment regarding whether the observed difference could act as a meaningful confounder of associations that may be seen in subsequent manuscripts. There were, however, differences by race in the final proportions of usable data with blacks providing a smaller yield. This is somewhat as expected based on well-documented lower participation rates in research studies overall for blacks. (2, 33) This needs to be considered when describing and interpreting the accelerometer-derived physical activity levels across the cohort and making comparisons to other studies.
Overall compliance defined as returning and wearing the device, was high in our cohort: 82% returned the device having worn the device for some time. Especially given the older average age of our cohort, this compares quite favorably with data from the 2003–2004 National Health and Nutritional Examination Survey (NHANES) that used a different protocol, and included much younger ages and other race-ethnic groups. (29) In NHANES, staff hand-delivered the accelerometer to participants with instructions, used express mail to have devices returned, and participants were provided remuneration. After excluding data from devices not in calibration, 84% of NHANES participants over age 60 years who returned the device had ≥4 valid wear days (29), whereas 81% of REGARDS participants (aged 49 years and older) who returned the device had ≥4 days of valid wear and met all other criteria for usable data. Only 45–46% of the NHANES sample over age 60 years had seven valid days of wear compared to 72% in REGARDS.
The national accelerometer study in Norway started with a random sample of 11,248 adults aged 20–85 invited to participate, but only 34% consented.(8) Their methods included regular mail for delivery and express mail for return. Of the 3,867 who consented to participate, 90% returned the accelerometer, and of these, 86 (2.5%) were not worn, 14 (0.4%) were defective, 118 (3.4%) did not wear the minimum number of days/hours, and 3,267 (93.4%) had ≥4 days of valid accelerometer data.(8) While their acceptance rate was much lower than that of our study, the study’s yield of usable data was much higher than in our study (81%) or NHANES (84%), and may reflect higher education level in the Norwegian cohort (level of education was the strongest predictor of participation), much smaller number of older adults included (i.e., <600), or other characteristics not able to be compared (e.g. recruitment methods).
Preliminary results from an ancillary observational study to the US Women’s Health Study clinical trial (WHS) found valid data (i.e., worn ≥ 10 hrs/day on ≥4 days) from 95% of 8,373 participants who returned their device. (22) Final participation numbers are unknown as the study is ongoing and some participants had deferred their participation. (22) Similar to REGARDS, the WHS methods include an eligibility question related to ability to walk outside, delivery and return of the device by regular mail, and inviting participants on a rolling basis based on availability of accelerometer. At the time of invitation, participants had been in the original WHS an average of 17 years, so commitment and retention is expected to produce high compliance.
There were several challenges to the methods of our approach. In the study design, practical considerations related to budget, participant burden, and avoidance of negative interference with the ongoing activities of retention and follow-up of the parent study had to be addressed. There was discussion among the REGARDS investigators that the opportunity to participate in this additional part of the study could be a positive incentive for retention because of its newness and uniqueness added to the standardized biannual telephone follow-up. Although the overall return rate of accelerometers was high (92%) and is similar or higher than return rates in other population-based direct-mail protocols (7, 8, 29), we underestimated the number of accelerometers that would not be returned. We made the decision to re-adjust the budget to purchase additional accelerometers and also received grants-in-aid that were used exclusively for devices. During the month of December each year, when staff time was more available because new participants were not being enrolled, a special request for recovery of lost accelerometers was mailed to participants who were long overdue for return of the device. This included a picture of the accelerometer attached to the belt and the promise of a $20 incentive. The return rate following this was only 8%, but even up to 2 years following closeout, we occasionally still receive a device in the mail.
We found post-cards and follow-up phone calls within a reasonable time period relative to shipping-return or non-return of devices were necessary, but had not originally budgeted sufficient staff time to cover these activities. Because of the importance of the return of the log sheet for dates/times the device was worn and taken off, resources were reallocated to have staff telephone participants immediately upon return of device without a log sheet to obtain these data. The consenting-shipment-wearing-tracking-return-processing-cleaning cycle was about 7–9 weeks per device, suggesting that approximately 6–7 participants were evaluated per available device per year. This estimated cycle time is specific to our methods. Other studies that use different methods of distribution/return of devices or have more resources would likely be able to shorten it. However, when engaging specific groups, such as black men and black women who respectively, in our study, had the highest rates of devices lost or returned without being used, the supply of accelerometers and overall timeline may need to be adjusted. For those who initially consented but did not wear the monitor or removed it prematurely, we do not have qualitative data on reasons but anecdotal reports suggest the primary reasons were forgetfulness followed by illness, as well as potentially discomfort/annoyance with method of attachment as we received a number of comments related to the elastic belts and movement of the monitor on the belt. Our overall experience may assist other population-based researchers in logistical issues related to accelerometer studies conducted on the local or national level. (3, 22, 23, 25, 28, 30)
This study does have limitations. Some of the participant characteristics collected at baseline several years prior to being asked to wear accelerometer may have changed (e.g. BMI, self-rated health, etc.). However, even moderate changes over time in a descriptive variable within a participant and/or in a small proportion of participants within our large samples would not significantly impact group means, proportions, or comparisons. Because of the large sample size, some results may be statistically significant but not clinically meaningful. Our study also only included blacks and whites as that was the targeted population for the parent REGARDS study. Not all active participants were invited to participate in the study due to lack of an available accelerometer in conjunction with their biannual follow-up call; additionally some participants became inactive during the enrollment period. For some future analyses, consideration will be given to inclusion of the approximately 700 participants with 1, 2, or 3 days of valid wear time. The major strength of this study is the resulting usable accelerometer data to provide an objective measure of time spent being sedentary and level of physical activity in a large, national sample of adults, blacks and whites, across the US. These data will be used to describe the overall sedentary behavior and physical activity levels and patterns by age, race, and sex groups. Linked with the clinical health information collected at baseline and through follow-up, these data will allow future analyses on the association between objectively-measured sedentary time and physical activity and stroke risk, risk factors, cognitive decline and other health conditions. The accelerometer data will also be connected to geographical location and features of the built environment to examine the interactions between behavior, concepts such as walk ability, and health outcomes.
Acknowledgements
This research is supported by an investigator- initiated grant 5R01NS061846 from the National Institute of Neurological Disorders and Stroke, National Institutes of Health, Department of Health and Human Service. Additional support was provided by unrestricted research grants from The Coca-Cola Company. The REGARDS research project is supported by a cooperative agreement U01 NS041588 from the National Institute of Neurological Disorders and Stroke, National Institutes of Health, Department of Health and Human Service. The content is solely the responsibility of the authors and does not necessarily represent the official views of the National Institute of Neurological Disorders and Stroke or the National Institutes of Health.
Representatives of the funding agency, NIH-NINDS, have been involved in the review of the manuscript but not directly involved in the collection, management, analysis or interpretation of the data. The authors thank the other investigators, the staff, and the participants of the REGARDS study for their valuable contributions. A full list of participating REGARDS investigators and institutions can be found at http://www.regardsstudy.org
We acknowledge Charles Alcorn, Ram Bhavaraju, Mickey Doubleman, Shubha Luckshmy, Richard Mailhot, Chris Parks, and Robbie Reach for programming support; Libby Wagner and Paul Wolff for recruitment support; Ria Hearld, Suzanne Judd, Anh Le, Vena Seshadri, and Ya Yuan for data management support; and Silvia Bowers, Robert Caldwell, Heather Hogan, Cassandra Johnson, and Tamika Pilgrom for outstanding project management support.
The results of the present study do not constitute endorsement by the American College of Sports Medicine.
Footnotes
There are no conflicts of interest to disclose.
References
- 1.Borhani NO. Changes and Geographic Distribution of Mortality from Cerebrovascular Disease. Am J Public Health Nations Health. 1965;55:673–681. doi: 10.2105/ajph.55.5.673. [DOI] [PMC free article] [PubMed] [Google Scholar]
- 2.Byrd GS, Edwards CL, Kelkar VA, et al. Recruiting intergenerational African American males for biomedical research Studies: a major research challenge. Journal of the National Medical Association. 2011;103(6):480–487. doi: 10.1016/s0027-9684(15)30361-8. [DOI] [PubMed] [Google Scholar]
- 3.Chen HF, Lee SP, Li CY. Sex differences in the incidence of hemorrhagic and ischemic stroke among diabetics in Taiwan. Journal of women's health. 2009;18(5):647–654. doi: 10.1089/jwh.2008.0918. [DOI] [PubMed] [Google Scholar]
- 4.Diep L, Kwagyan J, Kurantsin-Mills J, Weir R, Jayam-Trouth A. Association of physical activity level and stroke outcomes in men and women: a meta-analysis. Journal of women's health (2002) 2010;19(10):1815–1822. doi: 10.1089/jwh.2009.1708. [DOI] [PMC free article] [PubMed] [Google Scholar]
- 5.Gillum RF, Mussolino ME, Ingram DD. Physical activity and stroke incidence in women and men. The NHANES I Epidemiologic Follow-up Study. American journal of epidemiology. 1996;143(9):860–869. doi: 10.1093/oxfordjournals.aje.a008829. [DOI] [PubMed] [Google Scholar]
- 6.Go AS, Mozaffarian D, Roger VL, et al. Heart disease and stroke statistics--2014 update: a report from the american heart association. Circulation. 2014;129(3):e28–e292. doi: 10.1161/01.cir.0000441139.02102.80. [DOI] [PMC free article] [PubMed] [Google Scholar]
- 7.Hagstromer M, Oja P, Sjostrom M. Physical activity and inactivity in an adult population assessed by accelerometry. Medicine and science in sports and exercise. 2007;39(9):1502–1508. doi: 10.1249/mss.0b013e3180a76de5. [DOI] [PubMed] [Google Scholar]
- 8.Hansen BH, Kolle E, Dyrstad SM, Holme I, Anderssen SA. Accelerometer-determined physical activity in adults and older people. Medicine and science in sports and exercise. 2012;44(2):266–272. doi: 10.1249/MSS.0b013e31822cb354. [DOI] [PubMed] [Google Scholar]
- 9.Haskell WL, Blair SN, Hill JO. Physical activity: health outcomes and importance for public health policy. Preventive medicine. 2009;49(4):280–282. doi: 10.1016/j.ypmed.2009.05.002. [DOI] [PubMed] [Google Scholar]
- 10.Haskell WL, Lee IM, Pate RR, et al. Physical activity and public health: updated recommendation for adults from the American College of Sports Medicine and the American Heart Association. Circulation. 2007;116(9):1081–1093. doi: 10.1161/CIRCULATIONAHA.107.185649. [DOI] [PubMed] [Google Scholar]
- 11.Hooker SP, Feeney A, Hutto B, et al. Validation of the actical activity monitor in middle-aged and older adults. Journal of physical activity & health. 2011;8(3):372–381. doi: 10.1123/jpah.8.3.372. [DOI] [PubMed] [Google Scholar]
- 12.Howard VJ. Reasons underlying racial differences in stroke incidence and mortality. Stroke; a journal of cerebral circulation. 2013;44(6 Suppl 1):S126–S128. doi: 10.1161/STROKEAHA.111.000691. [DOI] [PMC free article] [PubMed] [Google Scholar]
- 13.Howard VJ, Cushman M, Pulley L, et al. The reasons for geographic and racial differences in stroke study: objectives and design. Neuroepidemiology. 2005;25(3):135–143. doi: 10.1159/000086678. [DOI] [PubMed] [Google Scholar]
- 14.Howard VJ, Kleindorfer DO, Judd SE, et al. Disparities in stroke incidence contributing to disparities in stroke mortality. Annals of neurology. 2011;69(4):619–627. doi: 10.1002/ana.22385. [DOI] [PMC free article] [PubMed] [Google Scholar]
- 15.Hu FB, Stampfer MJ, Colditz GA, et al. Physical activity and risk of stroke in women. JAMA : the journal of the American Medical Association. 2000;283(22):2961–2967. doi: 10.1001/jama.283.22.2961. [DOI] [PubMed] [Google Scholar]
- 16.Hutto B, Howard VJ, Blair SN, et al. Identifying accelerometer nonwear and wear time in older adults. The international journal of behavioral nutrition and physical activity. 2013;10(1):120. doi: 10.1186/1479-5868-10-120. [DOI] [PMC free article] [PubMed] [Google Scholar]
- 17.Kiely DK, Wolf PA, Cupples LA, Beiser AS, Kannel WB. Physical activity and stroke risk: the Framingham Study. American journal of epidemiology. 1994;140(7):608–620. doi: 10.1093/oxfordjournals.aje.a117298. [DOI] [PubMed] [Google Scholar]
- 18.Kohl HW., 3rd Physical activity and cardiovascular disease: evidence for a dose response. Medicine and science in sports and exercise. 2001;33(6 Suppl):S472–S483. doi: 10.1097/00005768-200106001-00017. discussion S93–4. [DOI] [PubMed] [Google Scholar]
- 19.Lanska DJ, Kuller LH. The geography of stroke mortality in the United States and the concept of a stroke belt. Stroke; a journal of cerebral circulation. 1995;26(7):1145–1149. doi: 10.1161/01.str.26.7.1145. [DOI] [PubMed] [Google Scholar]
- 20.Lee CD, Folsom AR, Blair SN. Physical Activity and Stroke Risk: A Meta-Analysis. Stroke. 2003;34:2475–2482. doi: 10.1161/01.STR.0000091843.02517.9D. [DOI] [PubMed] [Google Scholar]
- 21.Lee IM, Hennekens CH, Berger K, Buring JE, Manson JE. Exercise and risk of stroke in male physicians. Stroke; a journal of cerebral circulation. 1999;30(1):1–6. doi: 10.1161/01.str.30.1.1. [DOI] [PubMed] [Google Scholar]
- 22.Lee IM, Shiroma EJ. Using accelerometers to measure physical activity in large-scale epidemiological studies: issues and challenges. Br J Sports Med. 2014;48(3):197–201. doi: 10.1136/bjsports-2013-093154. [DOI] [PMC free article] [PubMed] [Google Scholar]
- 23.Matthews CE, Hagstromer M, Pober DM, Bowles HR. Best practices for using physical activity monitors in population-based research. Medicine and science in sports and exercise. 2012;44(1 Suppl 1):S68–S76. doi: 10.1249/MSS.0b013e3182399e5b. [DOI] [PMC free article] [PubMed] [Google Scholar]
- 24.McDonnell MN, Hillier SL, Hooker SP, Le A, Judd SE, Howard VJ. Physical activity frequency and risk of incident stroke in a national US study of blacks and whites. Stroke; a journal of cerebral circulation. 2013;44(9):2519–2524. doi: 10.1161/STROKEAHA.113.001538. [DOI] [PMC free article] [PubMed] [Google Scholar]
- 25.Morris SF, Kolbe MB, Moore JB. Lessons learned from a collaborative field-based collection of physical activity data using accelerometers. Journal of public health management and practice : JPHMP. 2014;20(2):251–258. doi: 10.1097/PHH.0b013e3182893b9b. [DOI] [PubMed] [Google Scholar]
- 26.Nelson ME, Rejeski WJ, Blair SN, et al. Physical activity and public health in older adults: recommendation from the American College of Sports Medicine and the American Heart Association. Circulation. 2007;116(9):1094–1105. doi: 10.1161/CIRCULATIONAHA.107.185650. [DOI] [PubMed] [Google Scholar]
- 27.Sattelmair JR, Kurth T, Buring JE, Lee IM. Physical activity and risk of stroke in women. Stroke; a journal of cerebral circulation. 2010;41(6):1243–1250. doi: 10.1161/STROKEAHA.110.584300. [DOI] [PMC free article] [PubMed] [Google Scholar]
- 28.Sharpe PA, Wilcox S, Rooney LJ, et al. Adherence to accelerometer protocols among women from economically disadvantaged neighborhoods. Journal of physical activity & health. 2011;8(5):699–706. doi: 10.1123/jpah.8.5.699. [DOI] [PMC free article] [PubMed] [Google Scholar]
- 29.Troiano RP, Berrigan D, Dodd KW, Masse LC, Tilert T, McDowell M. Physical activity in the United States measured by accelerometer. Medicine and science in sports and exercise. 2008;40(1):181–188. doi: 10.1249/mss.0b013e31815a51b3. [DOI] [PubMed] [Google Scholar]
- 30.Trost SG, McIver KL, Pate RR. Conducting accelerometer-based activity assessments in field-based research. Medicine and science in sports and exercise. 2005;37(11 Suppl):S531–S543. doi: 10.1249/01.mss.0000185657.86065.98. [DOI] [PubMed] [Google Scholar]
- 31.Wendel-Vos GCW, Schuit AJ, Feskens EJM, Verschuren WMM, Saris WHM. Physical activity and stroke. A meta-analysis of observational data. International Journal of Epidemiology. 2004;33:787–798. doi: 10.1093/ije/dyh168. [DOI] [PubMed] [Google Scholar]
- 32.Willey JZ, Moon YP, Paik MC, Boden-Albala B, Sacco RL, Elkind MS. Physical activity and risk of ischemic stroke in the Northern Manhattan Study. Neurology. 2009;73(21):1774–1779. doi: 10.1212/WNL.0b013e3181c34b58. [DOI] [PMC free article] [PubMed] [Google Scholar]
- 33.Yancey AK, Ortega AN, Kumanyika SK. Effective recruitment and retention of minority research participants. Annual review of public health. 2006;27:1–28. doi: 10.1146/annurev.publhealth.27.021405.102113. [DOI] [PubMed] [Google Scholar]