

Abstract
The gut microbiota plays an important role in nutrient digestibility in animals. To examine changes in the pig gut microbiota across growth stages and its effects on nutrient digestion, the gut microbiota population in pigs at 28 days (before weaning), and 60, 90, and 150 days of age was assessed by 16S rDNA gene sequencing. The apparent digestibility of crude fiber (CF), neutral detergent fiber (NDF), acid detergent fiber (ADF), crude protein (CP) and ether extract (EE) was also assessed in these pigs. A total of 19,875 operational taxonomic units (OTUs) were identified from all samples. Both bacterial abundance and diversity increased with age. A total of 22 phyla and 249 genera were identified from all fecal samples; Firmicutes and Bacteroidetes were the most dominant phyla in all samples. With increasing age, the proportion of TM7 and Tenericutes increased, whereas the proportion of Lentisphaerae and Synergistetes decreased. The abundance of 36 genera varied with age, and the apparent digestibility of CF increased with age. Three phyla, Proteobacteria, Tenericutes and TM7, and 11 genera, including Anaeroplasma, Campylobacter, and Clostridium, were correlated with apparent CF digestibility.
The large and diverse microbial population contained in the mammalian gastrointestinal tract plays an important role in health and nutrient digestion1,2,3. The distal gut harbors the majority of human gut microorganisms, with approximately 1012 microbes per milliliter of luminal contents, and there are at least 500–1,000 species reside in the adult human intestine4,5,6,7. The microbes of animals live in intimate contact with each other, and a set of mutualistic or even symbiotic relationships has developed between the host and microbes8. Gut microbiota participate in digestion, absorption, and metabolism of the host through the absorption of nutrients and the expulsion of metabolic wastes from the host7,9,10. The gut microbiota is dynamic and varies according to time, age and many other factors2. Because bacteria reproduce within the host and change with age1,8,9, it is important to study the community structure of gut bacteria and to recognize the functions of the gut microbiota in contact with the host. Pigs provide products for human consumption on a large scale, and serve as an important animal model for human diseases, including obesity, diabetes and metabolic disorders, because of the similarity between pigs and humans in physiology, organ development and disease progression7,11. Elucidating changes in the pig gut microbiota and the correlation of these changes with nutrient digestibility across growth stages not only is essential for determining the function of the microbiota in nutrient digestion in pigs but also is beneficial for understanding how the gut microbiota of humans is related to complex traits such as obesity and metabolic disorders. However, information regarding how the pig gut microbiota varies across growth stages is limited. Likewise, little is known regarding how the pig gut microbiota contributes to swine nutrient digestion across growth stages. Dietary fiber is mainly degraded by the gut microbiota, and bacterial fermentation end products in the colon provide pigs with 5–20% of their total energy10,12.
We hypothesized that the growth stage of pigs would affect the gut microbiota and apparent crude fiber (CF) digestibility. The objective of this study was to investigate changes in the gut microbiota and apparent CF digestibility in pigs at different growth stages, as well as to elucidate the correlation between the microbiota and apparent CF digestibility in pigs.
Results
DNA sequence data and bacterial community structure
A total of 5,737,794 paired-end 250-bp reads were acquired. The total read length was 5.96 gigabases (GB), and the average read length per sample was 0.18 GB, with 1,532,635, 1,532,635, 1,364,816 and 1,307,708 raw reads at 28, 60, 90 and 150 days of age, respectively (Table S1).
After initial quality control, 3,928,659 high quality sequences were obtained. On average, 119,050 sequences were obtained per sample. Based on 97% species similarity, 14,306, 15,051, 16,329 and 17,593 operational taxonomic units (OTUs) were separately obtained from samples at 28, 60, 90 and 150 days of age (Table S1). A total of 19,875 OTUs were identified from all fecal samples, with 9,108 of those existing in all groups defined as core OTUs (Fig. 1A). The core OTUs comprised approximately 46% of the total OTUs while 361, 115, 151 and 445 OTUs were uniquely identified at 28, 60, 90 and 150 days of age, respectively.
Figure 1. Comparison of the OTUs in the four groups.
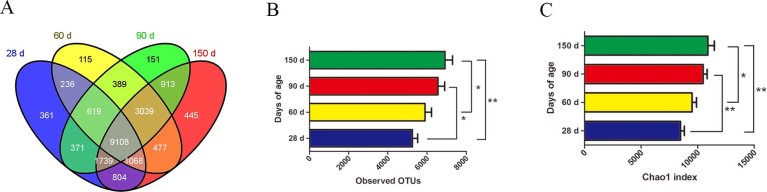
The number of observed OTUs sharing ≥97% nucleotide sequence identity. (A) A Venn diagram was generated to describe the common and unique OTUs among the 4 groups. (B) From the numbers of OTUs in the four groups, we found that bacterial diversity increased with age. (C) The bacterial abundance is reflected in the Chao1 index; the Chao1 index was significantly different between the four groups (*P<0.05, **P<0.01), indicating that bacterial abundance increased with age.
Good's coverage was 98.0, 97.2, 97.2 and 97.3% for 28, 60, 90 and 150 days of age, respectively, suggesting that the present study captured the dominant phylotypes. Both the abundance (R2 = 0.30, P<0.01) and diversity (R2 = 0.34, P<0.01) of the gut microbiota were correlated with the age of the pigs (Fig. 1B, C). The principal coordinates analysis (PCoA) of UniFrac distance matrices indicated that the variation in our data set was primarily explained by the growth stages. The 28-d group microbiota clustered separately from the microbiota of the other three groups along principal coordinate 1 (Fig. S1A, C). In addition, the 150-d group microbiota clustered separately from the microbiota of the other three groups along principal coordinate 3 (Fig. S1B, C).
The results shown in Fig. 2A describe the distribution of DNA sequences into phyla. A total of 22 phyla were shared by the four growth-stage groups, as follows: Acidobacteria, Actinobacteria, Bacteroidetes, Chlamydiae, Chloroflexi, Cyanobacteria, Deferribacteres, Deinococcus-Thermus, Euryarchaeota, Fibrobacteres, Firmicutes, Fusobacteria, Gemmatimonadetes, Lentisphaerae, Nitrospira, Planctomycetes, Proteobacteria, Spirochaetes, Synergistetes, Tenericutes, TM7 and Verrucomicrobia. Firmicutes and Bacteroidetes were the most dominant among the 22 phyla (P<0.01) in the samples, regardless of age, and comprised more than 79% of the total sequences. The bacterial abundances of distinct phyla differed in the four groups. Firmicutes (P<0.01) was the most predominant phylum at 28 days of age, accounting for approximately 58% of the sequences. At 60, 90 and 150 days of age, a higher percentage (72, 69 and 65%, respectively) of the sequences was assigned to Firmicutes. Bacteroidetes (P<0.01) was the second largest phylum in all groups, comprising approximately 15, 12, 13 and 13% in the 28-d, 60-d, 90-d and 150-d groups, respectively. Significant differences in the bacterial abundance in 5 of the 22 phyla were found in the four groups (Fig. 3A-E). Moreover, the abundance in 4 of the 5 phyla changed with age (Table S2). The proportion of bacteria in TM7 (Fig. 3A) and Tenericutes (Fig. 3B) increased (P<0.01) as the pigs aged, whereas the proportion of bacteria in Synergistetes (P<0.01) (Fig. 3C) and Lentisphaerae (P<0.05) (Fig. 3D) decreased. The proportion of sequences that could not be assigned to a phylum using the Ribosomal Database Project (RDP) classifier was 17.4% in the fecal samples.
Figure 2. Phyla distribution of gut flora and a Venn diagram of the genera.
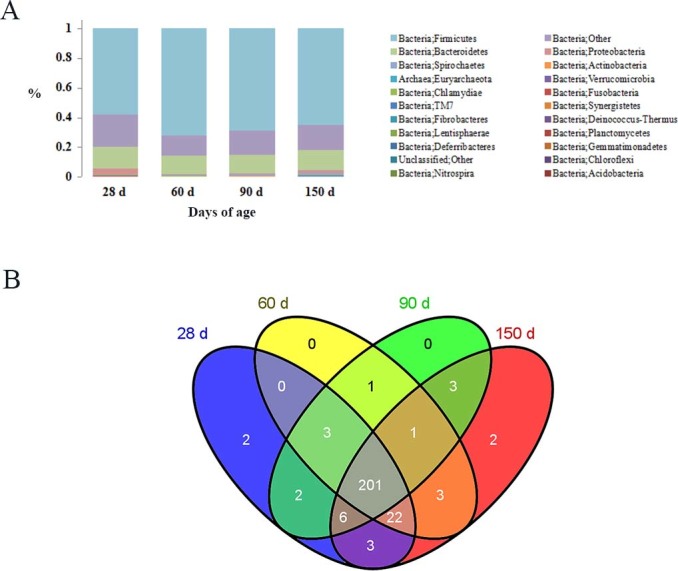
Distribution of the phyla as a percentage of the total number of identified 16S rDNA sequences in individual groups (A). A Venn diagram was generated to compare genera between the groups at the same time points and to depict genera that were unique to the 4 groups (B).
Figure 3. The bacterial abundances of 5 distinct phyla significantly differ among the four groups.

At the genus level, a total of 249 genera were identified from all samples, regardless of age (Fig. 2B). The 16 most abundant genera, containing more than 84% of the total sequences, were Lactobacillus, Subdoligranulum, Roseburia, Oscillibacter, Eubacterium, Dorea, Streptococcus, Clostridium, Megasphaera, Escherichia/Shigella, Oribacterium, Blautia, Faecalibacterium, Coprococcus, Ruminococcus and Treponema. One genus, Escherichia/Shigella, is a member of the phylum Proteobacteria, and Treponema belongs to the phylum Spirochaetes. The other 14 genera belong to the phylum Firmicutes. Among them, Lactobacillus, Gemmiger and Roseburia were the most predominant genera, accounting for 15, 13 and 11% of total sequences, respectively. The number of genera in the 28-d, 60-d, 90-d and 150-d groups was 239, 231, 217 and 241, respectively. A total of 201 genera were shared by the four different groups. Leptospirillum and Leuconostoc were unique to the 28-d group, and Solitalea and Porphyrobacter were specific to the 150-d group (Fig. 2B). The bacterial abundance of 36 genera changed as the pigs aged; 26 increased, whereas 10 decreased (Table S3).
In addition to the phylum and genus, bacterial diversity and abundance were also analyzed by class (Table S4), order (Table S5) and family (Table S6). A total of 48, 47, 44 and 49 classes, 80, 79, 72 and 83 orders and 155, 137, 84 and 159 families were identified at 28, 60, 90 and 150 days of age, respectively. The most predominant class and family shared in the 28-d, 60-d, 90-d and 150-d groups were Clostridia and Clostridiales, respectively. The most predominant order was Ruminococcaceae in the 28-d group and Lachnospiraceae in the 60-d, 90-d and 150-d groups.
Apparent nutrient digestibility in pigs and its correlation with the gut microbiota
The apparent digestibility of total tract CF and acid detergent fiber (ADF) increased as the pigs aged (P<0.01) (Table 1). At the phylum level, Proteobacteria, Tenericutes and TM7 were positively correlated with apparent CF digestibility (P<0.05) (Table 2). Proteobacteria and TM7 were positively correlated with apparent ADF digestibility (P<0.01) (Table 2). At the genus level, the bacterial abundance of Anaeroplasma, Campylobacter, Clostridium, Enterococcus, Methanobrevibacter, Nitrosospira, Propionibacterium, Pseudobutyrivibrio, Robinsoniella, Staphylococcus and Treponema was positively correlated with apparent CF digestibility (P<0.05) (Table 3). The bacterial abundance of Anaeroplasma, Campylobacter, Caulobacter, Cloacibacillus, Enterococcus, Lactobacillus, Methanobrevibacter, Nitrosospira, Propionibacterium, Pseudomonas, Robinsoniella, Staphylococcus and Treponema was positively correlated with apparent ADF digestibility (P<0.05) (Table 3). In addition to the phylum and genus, the correlation analysis between the apparent fiber digestibility and gut microbiota in pigs was also analyzed by class (Table S7), order (Table S8) and family (Table S9).
Table 1. The apparent nutrient digestibility in the four groups and Pearson's correlations with age. a,b,* The correlation is significant at a level of 0.05; A,B,** the correlation is significant at a level of 0.01.
| Age | ||||
|---|---|---|---|---|
| Sample component | 60 d | 90 d | 150 d | Pearson's correlation |
| CF % | 37.05±2.49 C | 49.11±3.14 B | 63.10±1.78 A | 0.84 ** |
| NDF % | 56.74±2.29 B | 69.35±1.48 A | 62.43±3.53 AB | 0.17 |
| ADF % | 28.46±2.71 B | 30.53±2.48 B | 44.55±2.70 A | 0.68 ** |
| Hemicellulose % | 74.95±4.19 | 74.30±3.86 | 73.93±2.34 | −0.03 |
| CP % | 73.66±1.14 Bb | 77.18±0.90 Aa | 77.39±0.68 Aa | 0.38 * |
| EE % | 26.83±3.77 | 20.83±3.78 | 26.97±2.73 | 0.07 |
Table 2. Phyla correlated to the apparent fiber digestibility and Pearson's correlation between phyla and apparent fiber digestibility. * The correlation is significant at a level of 0.05; ** the correlation is significant at a level of 0.01.
| Phyla | Apparent CF digestibility | Apparent ADF digestibility | Apparent hemicellulose digestibility |
|---|---|---|---|
| Pearson's correlation | Pearson's correlation | Pearson's correlation | |
| Euryarchaeota | −0.054 | −0.062 | 0.448* |
| Proteobacteria | 0.508** | 0.593** | −0.082 |
| Spirochaetes | −0.089 | −0.071 | 0.400* |
| Tenericutes | 0.445* | 0.301 | −0.114 |
| TM7 | 0.516** | 0.599** | 0.016 |
Table 3. Genera correlated to fiber digestibility and Pearson's correlation between genera and apparent fiber digestibility. * The correlation is significant at a level of 0.05; ** the correlation is significant at a level of 0.01.
| Genera | Apparent CF digestibility | Apparent NDF digestibility | Apparent ADF digestibility | Apparent hemicellulose digestibility |
|---|---|---|---|---|
| Pearson's correlation | Pearson's correlation | Pearson's correlation | Pearson's correlation | |
| Anaeroplasma | 0.60** | −0.1 | 0.48* | −0.18 |
| Campylobacter | 0.51** | −0.05 | 0.44* | −0.06 |
| Caulobacter | 0.3 | −0.17 | 0.44* | −0.12 |
| Cloacibacillus | 0.3 | −0.17 | 0.55** | −0.23 |
| Clostridium | 0.45* | −0.03 | 0.34 | −0.06 |
| Enterococcus | 0.42* | −0.3 | 0.43* | −0.24 |
| Janibacter | 0.4 | −0.21 | 0.34 | −0.22 |
| Lactobacillus | 0.12 | 0.1 | 0.50* | 0.07 |
| Methanobrevibacter | 0.57** | 0.45 | 0.56** | 0.33 |
| Nitrosospira | 0.43* | 0.09 | 0.49* | −0.01 |
| Parasporobacterium | 0.22 | 0.47* | 0.12 | 0.22 |
| Propionibacterium | 0.50* | 0.02 | 0.46* | 0.01 |
| Pseudobutyrivibrio | 0.51** | −0.14 | 0.37 | 0.07 |
| Pseudomonas | 0.25 | −0.05 | 0.46* | −0.1 |
| Robinsoniella | 0.61** | 0.34 | 0.65** | 0.22 |
| Staphylococcus | 0.40* | −0.28 | 0.48* | −0.33 |
| Sporobacter | 0.32 | 0.44 | 0.3 | 0.19 |
| Treponema | 0.54** | 0.55** | 0.54** | 0.33 |
The apparent total tract crude protein (CP) digestibility was higher in the 90-d (P<0.05) and 150-d (P<0.01) groups than that in the 60-d group, whereas the two younger groups showed no difference (Table 1). However, this study did not find a positive correlation between the gut microbiota and apparent CP digestibility among the three groups. No significant difference was found for the apparent ether extract (EE) digestibility among the three groups (Table 1).
Discussion
The first goal of this study was to address the question of how the pig gut microbiota change as pigs grow. So far, few reports have been published on the distribution of the gut microbiota across pig growth stages1,2,3,13,14.
A total of 3,928,659 high-quality sequences were obtained from samples at all ages; the average number of reads per sample was 119,050, and the read counts were greater than those in previous studies in pigs1,13,14,15. Moreover, according to Good's coverage index of each sample, the modified sequences were comprehensive enough to cover most bacterial diversity. The number of total effective OTUs in this study was higher than that in the studies of Kim HB et al13, Ye L, Zhang T14 and Whitehead TR and Cotta MA17, indicating a much higher level of diversity than reported in previous studies.
As bacterial abundance and diversity increased with age, growth stages and growth conditions were important factors affecting pig gut microbiota. In a previous study, Kim HB et al13 described the changes in bacterial microbiota composition that occurred between pigs in different age groups. Savage DC18 demonstrated that the gastrointestinal microbiota changed over time from birth through adulthood. Rosenberg E19 reported considerable species variation in the gut microbiota among healthy individuals17. Furthermore, the human gut microbiota undergoes maturation from birth to adulthood and is further altered with aging20. Moreover, considering any of the other taxonomic units, i.e., class, order and family, the bacterial diversity of the 150-d group was always higher than that of the other three groups.
Using the RDP classifier, taxon-dependent analysis revealed that Firmicutes and Bacteroidetes were the most dominant phyla, regardless of age, representing approximately 79% of the total sequences. These results were similar to what others have observed in pig and human fecal samples1,13,17. Kim HB et al13 reported that the bacterial communities of all samples were primarily comprised of Firmicutes and Bacteroidetes, which accounted for more than 90% of the total sequences. Lamendella R et al15 confirmed previous observations that most of the bacteria identified were in two phyla: Firmicutes and Bacteroidetes. Additionally, these two phyla comprised over 90% of the known phylogenetic categories, representing the dominant distal gut microbiota in the human intestinal tract21. However, the proportion of TM7 and Tenericutes increased as the pigs aged, and the proportion of Lentisphaerae, Synergistetes and Fusobacteria decreased. Kim HB et al1 found that the proportion of bacteria in the phyla Firmicutes and Spirochaetes increased as the pigs aged, whereas the proportion of bacteria in the phyla Bacteroidetes, Actinobacteria and Proteobacteria decreased. The discrepancies between the present study and previous studies may have resulted from the use of pigs in different ages, environmental conditions or breeds2. Moreover, much deeper sequencing was performed for the samples in this study.
In the present study, the bacterial abundance of 36 genera changed as the pigs aged; 26 increased, whereas 10 decreased. Interestingly, of the 36 genera, Lactobacillus, Pseudobutyrivibrio and Butyricicoccus increased in our study but decreased in Kim HB's study1. The discrepancies between the present study and previous studies may also be due to the use of pigs in different ages, environmental conditions or breeds. Leptospirillum and Leuconostoc were unique to the 28-d group, and Solitalea and Porphyrobacter were specific to the 150-d group. Leuconostoc is an industrially important microorganism that is used as a starter culture in the manufacturing process of several fermented foods, including kimchi and sauerkraut, and has great potential for biotechnological applications such as enzyme and vaccine delivery systems22. Porphyrobacter functions to produce Bacteriochlorophyll a23. However, the functions of Leptospirillum and Solitalea require further study.
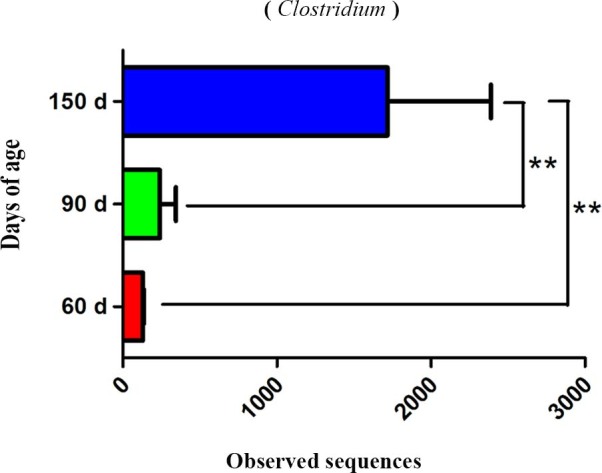
The second goal of this study was to preliminarily reveal changes in nutrient digestibility and the relationship with the abundance and diversity of the gut microbiota in pigs in different growth stages. The apparent digestibility of CF, NDF, ADF, hemicellulose, CP and EE in pig fecal samples was analyzed, except in piglets at 28 days of age because very few feces could be collected before weaning at 28 days of age. Ashida H10 and Tilg H12 showed that dietary fiber is mainly degraded by the gut microbiota. Jumpertz R et al24 described the associations between nutrient absorption and the gut microbiota in humans, which indicated a possible role of the human gut microbiota in the regulation of nutrient harvest. In previous studies, Bacteroides and Butyrivibrio were related to protein digestibility in sheep and cows, respectively25,26. In this study, the apparent digestibility of total tract CF increased as pigs aged (P<0.01). Furthermore, no difference in apparent neutral detergent fiber (NDF) digestibility was observed over the whole time period (R = 0.17). Although the apparent NDF digestibility increased from 60 to 90 days of age (P<0.01), no significant changes were observed during later growth stages. Additionally, the apparent ADF digestibility increased as the pigs aged (P<0.01), but the apparent hemicellulose digestibility showed nearly no change. In fact, the apparent ADF digestibility did not significantly increase from 60 to 90 days of age. Higher apparent ADF digestibility appeared at 150 days of age than that at 60 and 90 days of age (P<0.01) (Table 1). Coincidentally, significant differences in the abundance of Anaeroplasma, Campylobacter, Clostridium, Enterococcus, Methanobrevibacter, Nitrosospira, Propionibacterium, Pseudobutyrivibrio, Robinsoniella, Staphylococcus and Treponema (Fig. 4, Table 3) were found among the groups and were positively correlated with apparent CF digestibility (P<0.05). The bacterial abundances of Anaeroplasma, Campylobacter, Caulobacter, Cloacibacillus, Enterococcus, Lactobacillus, Methanobrevibacter, Nitrosospira, Propionibacterium, Pseudomonas, Robinsoniella, Staphylococcus and Treponema differed among the groups and were positively correlated with apparent ADF digestibility (P<0.05) (Table 3). Only Clostridium was related to the metabolism of dietary fiber27, which indicates that the other genera may be associated with apparent CF and ADF digestibility. However, no relationship was found between the microbiota and apparent CP digestibility among the three groups in this study. This may be because protein is mainly digested in the small intestine, as well as because the continual development of digestive organs and their functions improves the apparent nutrient digestibility in pigs4,28. Additionally, no significant difference was observed in the apparent EE digestibility. Therefore, the relationship between the apparent EE digestibility and the microbiota was not analyzed in this study.
Figure 4. The bacterial abundance of Clostridium significantly differs between the four groups.
Conclusion
Both the abundance and diversity of the gut microbiota in pigs increased with increasing age. With increasing age, the proportion of TM7 and Tenericutes increased, whereas the proportion of Lentisphaerae and Synergistetes decreased. The bacterial abundance of 36 genera changed as the pigs aged. A total of eleven genera, Anaeroplasma, Campylobacter, Clostridium, Enterococcus, Methanobrevibacter, Nitrosospira, Propionibacterium, Pseudobutyrivibrio, Robinsoniella, Staphylococcus and Treponema, were correlated with apparent CF digestibility; of these, Clostridium is associated with dietary fiber metabolism.
Materials and Methods
Animals and sample collection
Fecal and diet samples from 33 healthy Sutai pigs (who did not have disease or diarrhea in the week before sampling) at the ages of 28 (n = 8), 60 (n = 8), 90 (n = 8) and 150 (n = 9) days were randomly collected at the Sutai Pig Breeding Center, Suzhou, China, under similar husbandry conditions. Sutai is a synthetic Chinese breed that is derived from Western Duroc (50%) and Chinese Taihu (50%) after over 18 generations of artificial selection29,30,31. All Sutai pigs from the Sutai Pig Breeding Center were selected using a unified breeding standard. Animals were grouped based on a randomized block experimental design and fed a corn-soybean non-antibiotic diet. Details are provided in the supplementary material describing pig diet ingredients (Table S10A, B). All procedures involving animals were carried out in accordance with the Guide for the Care and Use of Laboratory Animals prepared by the Institutional Animal Care and Use Committee of Nanjing Agricultural University, Nanjing, China. All experimental protocols were approved by the Animal Care and Use Committee of Nanjing Agricultural University, 1999.
Pigs were housed in groups, 8 pigs in a pen. For each sampling (at the ages of 28, 60, 90 and 150 days), all pigs were selected from different pens. Fecal samples were individually collected using sterile 2 ml centrifuge tubes (without any treatment) and plastic bags (approximately 200 g of each fecal sample was fixed on site by mixing with 15 ml 10% sulfuric acid and was kept on ice for transportation) and then stored at −20 °C in the laboratory before DNA extraction and apparent nutrient digestibility assessment.
DNA extraction, PCR amplification of 16S rDNA, amplicon sequence and sequence data processing
Microbial genomic DNA was extracted from 220 mg of each fecal sample using a TIANamp Stool DNA Kit (Spin Column, Cat. no. DP328) according to the manufacturer's recommendation. Successful DNA isolation was confirmed by agarose gel electrophoresis23.
Based on previous comparisons32,33,34, the V4 hypervariable regions of 16S rDNA were PCR amplified from microbial genomic DNA harvested from fecal samples and were used for the remainder of the study. PCR primers flanking the V4 hyper variable region of bacterial 16S rDNA were designed. The barcoded fusion forward primer was 520F 5-AYTGGGYDTAAAGNG-3, and the reverse primer was 802R 5-TACNVGGGTATCTAATCC-3. The PCR conditions were as follows: one pre-denaturation cycle at 94°C for 4 min, 25 cycles of denaturation at 94°C for 30 s, annealing at 50°C for 45 s, and elongation at 72°C for 30 s, and one post-elongation cycle at 72°C for 5 min. The PCR amplicon products were separated on 0.8% agarose gels and extracted from the gels. Only PCR products without primer dimers and contaminant bands were used for sequencing by synthesis. Barcoded V4 amplicons were sequenced using the paired-end method by Illumina MiSeq with a 7-cycle index read. Sequences with an average phred score lower than 30, ambiguous bases, homopolymer runs exceeding 6 bp, primer mismatches, or sequence lengths shorter than 100 bp were removed. Only sequences with an overlap longer than 10 bp and without any mismatch were assembled according to their overlap sequence. Reads that could not be assembled were discarded. Barcode and sequencing primers were trimmed from the assembled sequence32.
Taxonomy classification and statistical analysis
Taxon-dependent analysis was conducted using the Ribosomal Database Project (RDP) classifier34. The RDP classifier is a web-based program that assigns 16S rRNA sequences to phylogenetically consistent bacterial taxonomy. OTUs were counted for each sample to express the richness of bacterial species with an identity cutoff of 97%. The OTU abundance of each sample was generated at the genus level. The mean length of all effective bacterial sequences without primers was 223 bp. The abundance count at the genus level was log2 transformed and then normalized as follows: from each log-transformed measure, the arithmetic mean of all transformed values was subtracted, and the difference was divided by the standard deviation of all log-transformed values for a given sample. After this procedure, the abundance profiles for all samples exhibited a mean of 0 and a standard deviation of 1.
A Venn diagram was generated to compare OTUs between groups, and the bacterial community indices applied here included Chao1 and Good's coverage. The bacterial diversity is shown by the number of OTUs. Unweighted clustering was performed using PCoA of UniFrac distance matrices.
Experimental feeds and chemical analysis
Diet samples were collected in plastic bags and stored at −20°C. Pigs did not receive antibiotics in the feed or for any therapeutic purposes.
For the piglets at 28 days of age and before weaning, measuring the apparent nutrient digestibility from the limited volume of feces was difficult. Fecal samples from pigs at 60, 90 and 150 days of age were dried at 65°C to a constant weight. Fecal and diet samples were ground through a 0.45 mm sieve by a high-speed universal disintegrator before analysis. Acid insoluble ash (AIA) was used as an indigestible marker to assess the digestibility of the dietary components (AOAC 942.05)35. Analysis of CF, NDF, ADF and hemicellulose digestibility was carried out using the ANKOM A200 filter bag technique (AOAC 962.09). The CP content was measured based on the Kjeldahl method (AOAC 984.13) using a Kjeltec 8400 analyzer unit (Foss, Sweden), and the EE content was measured using the soxhlet extraction method (AOAC 920.85), which was performed with a soxhlet apparatus.
The contents of different nutrient compositions were calculated as follows:
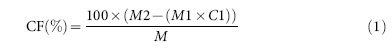 |
Where: M = Sample weight M1 = Bag tare weight M2 = Weight of organic matter (the loss of weight upon ignition of the bag and fiber) C1 = Ash-corrected blank bag factor (a running average of the loss of weight upon ignition of the blank bag/original blank bag)
 |
 |
 |
Where: M = Sample weight M1 = Bag tare weight M2 = Weight of organic matter after extraction by neutral detergent M3 = Weight of organic matter after extraction by acid detergent C1 = Ash-corrected blank bag factor (a running average of the loss of weight after extraction of the blank bag/original blank bag) C2 = Ash-corrected blank bag factor (a running average of the loss of weight after extraction of the blank bag/original blank bag)
 |
Where: M = Dry sample weight M1 = Filter paper weight before extraction M2 = Filter paper weight after extraction
The digestibility of each sample diet was calculated by the indicator technique36according to the equation:
 |
where CADD is the coefficient of the apparent digestibility of dietary components in the assay diet; DCF is the dietary component concentration in feces; AIAD is the AIA concentration in the assay diet; DCD is the dietary component concentration in the assay diet; and AIAF is the AIA concentration in feces.
Data analysis
High quality sequences were uploaded to QIIME for further study37. All effective bacterial sequences were compared to the RDP databases using the best hit classification option to classify the abundance count of each taxon34,38. The sequence length was archived by QIIME. The abundance and diversity indices were generated using Mothur with an OTU identity cutoff of 97% after implementing a pseudo-single linkage algorithm1,39. The relationship between the selected taxonomy group (abundant phyla, genera, classes, orders or families), the observed OTUs or the bacterial community index (Chao1) and the apparent nutrient digestibility was calculated using SPSS 13.0 software39. For all parameters, data were compared using a one-way analysis of variance (ANOVA) at the end of each bioassay. A mean comparison was performed using Fisher's least significant difference test (LSD) and the Duncan multiple range test with a significance level of P<0.05. Finally, Pearson's correlations were used to assess the associations among age, bacterial abundance and apparent nutrient digestibility (P<0.05).
Author Contributions
Conceived and designed the experiments: RHH, PHL, BZ. Performed the experiments: QN, PHL, SSH, HZL, YQZ, XM, SG. Analyzed the data: QN, PHL, BZ, LCH. Contributed reagents/materials/analysis tools: QN, RHH, PHL, XGH, JDH, WJW. Contributed to the writing of the manuscript: QN, PHL, RHH, SWK, BZ. All authors reviewed the manuscript.
Supplementary Material
Supplementary information
Acknowledgments
This work was supported by the National Science and Technology Program for the Twelfth Five Year Plan for Rural Development (2013BAD10B02-03), the Sanxin Agricultural Engineering Project of Jiangsu Province (SXGC[2014]138), and the Agricultural Science and Technology Support Programs in the City of Huaian (SN13094). The sequencing service was provided by Personal Biotechnology Co., Ltd., Shanghai, China.
References
- Kim H. B. et al. Microbial shifts in the swine distal gut in response to the treatment with antimicrobial growth promoter, tylosin. Proc. Natl. Acad. Sci. U. S. A. 109, 15485–15490 (2012). [DOI] [PMC free article] [PubMed] [Google Scholar]
- Yatsunenko T. et al. Human gut microbiome viewed across age and geography. Nature 486, 222–227 (2012). [DOI] [PMC free article] [PubMed] [Google Scholar]
- Looft T. et al. Bacteria, phages and pigs: the effects of in-feed antibiotics on the microbiome at different gut locations. ISME. J 8, 1566–1576 (2014). [DOI] [PMC free article] [PubMed] [Google Scholar]
- Sonnenburg J. L., Angenent L. T. & Gordon J. I. Getting a grip on things: how do communities of bacterial symbionts become established in our intestine? Nat. Immunol. 5, 569–573 (2004). [DOI] [PubMed] [Google Scholar]
- Bäckhed F., Ley R. E., Sonnenburg J. L., Peterson D. A. & Gordon J. I. Host-bacterial mutualism in the human intestine. Science. 307, 1915–1920 (2005). [DOI] [PubMed] [Google Scholar]
- Russell E. G. Types and distribution of anaerobic bacteria in the large intestine of pigs. Appl. Environ. Microb. 37, 187–193 (1979). [DOI] [PMC free article] [PubMed] [Google Scholar]
- Isaacson R. & Kim H. B. The intestinal microbiome of the pig. Anim. Health Res. Rev. 13, 100–109 (2012). [DOI] [PubMed] [Google Scholar]
- Krajmalnik-Brown R., Ilhan Z. E., Kang D. W. & DiBaise J. K. Effects of gut microbes on nutrient absorption and energy regulation. Nutr. Clin. Pract. 27, 201–214 (2012). [DOI] [PMC free article] [PubMed] [Google Scholar]
- Green G. L. et al. Molecular characterization of the bacteria adherent to human colorectal mucosa. J. Appl. Microbiol. 100, 460–469 (2006). [DOI] [PubMed] [Google Scholar]
- Ashida H., Ogawa M., Kim M., Mimuro H. & Sasakawa C. Bacteria and host interactions in the gut epithelial barrier. Nat. Chem. Biol. 8, 36–45 (2012). [DOI] [PubMed] [Google Scholar]
- Swindle M. M., Makin A., Herron A. J., Clubb F. J. & Frazier K. S. Swine as Models in biomedical research and toxicology testing. Vet. Pathol. 49, 344–356 (2011). [DOI] [PubMed] [Google Scholar]
- Tilg H. & Kaser A. Gut microbiome, obesity, and metabolic dysfunction. J. Clin. Invest. 121, 2126–2132 (2011). [DOI] [PMC free article] [PubMed] [Google Scholar]
- Kim H. B. et al. Longitudinal investigation of the age-related bacterial diversity in the feces of commercial pigs. Vet. Microbiol. 153, 124–133 (2011). [DOI] [PubMed] [Google Scholar]
- Lu X. M., Lu P. Z. & Zhang H. Bacterial communities in manures of piglets and adult pigs bred with different feeds revealed by 16S rDNA 454 pyrosequencing. Appl. Microbiol. Biot. 98, 2657–2665 (2014). [DOI] [PubMed] [Google Scholar]
- Lamendella R., Domingo J. W., Ghosh S., Martinson J. & Oerther D. B. Comparative fecal metagenomics unveils unique functional capacity of the swine gut. BMC. Microbiol. 11, 103 (2011). [DOI] [PMC free article] [PubMed] [Google Scholar]
- Ye L. & Zhang T. Bacterial communities in different sections of a municipal wastewater treatment plant revealed by 16S rDNA 454 pyrosequencing. Appl. Microbiol. Biot. 97, 2681–2690 (2013). [DOI] [PMC free article] [PubMed] [Google Scholar]
- Whitehead T. R. & Cotta M. A. Characterisation and comparison of microbial populations in swine faeces and manure storage pits by 16S rDNA Gene Sequence Analyses. Anaerobe 7, 181–187 (2001). [Google Scholar]
- Savage D. C. Microbial ecology of the gastrointestinal tract. Annu. Rev. Microbiol. 31, 107–133 (1977). [DOI] [PubMed] [Google Scholar]
- Rosenberg E. & Zilber-Rosenberg I. [Abundance and diversity of microbiota] The Hologenome Concept: Human, Animal and Plant Microbiota. [23–40] (Springer International Publishing Switzerland., 2013).
- Mariat D. et al. The Firmicutes/Bacteroidetes ratio of the human microbiota changes with age. BMC. Microbiol. 9, 123 (2009). [DOI] [PMC free article] [PubMed] [Google Scholar]
- Eckburg P. B. et al. Diversity of the human intestinal microbial flora. Science 308, 1635–1638 (2005). [DOI] [PMC free article] [PubMed] [Google Scholar]
- Weon H. Y. et al. Solitalea koreensis gen. nov., sp. nov. and the reclassification of [Flexibacter] canadensis as Solitalea canadensis comb. nov. Int. J. Syst. Evol. Micr. 59, 1969–1975 (2009). [DOI] [PubMed] [Google Scholar]
- Rathgeber C. et al. Porphyrobacter meromictius sp. nov., an appendaged bacterium, that produces Bacteriochlorophyll a. Curr. Microbiol. 55, 356–361 (2007). [DOI] [PubMed] [Google Scholar]
- Jumpertz R. et al. Energy-balance studies reveal associations between gut microbes, caloric load, and nutrient absorption in humans. Am. J. Clin. Nutr. 94, 58–65 (2011). [DOI] [PMC free article] [PubMed] [Google Scholar]
- Blackburn T. H. & Hobson P. N. Further studies on the isolation of proteolytic bacteria from the sheep rumen. J. Gen. Microbiol. 29, 69–81 (1962). [DOI] [PubMed] [Google Scholar]
- Geoffrey P. H., Colin G. O., Yvonne G. & Margaret E. B. Isolation of proteolytic rumen bacteria by use of selective medium containing leaf fraction 1 protein. Appl. Environ. Microbiol. 45, 1780–1784 (1983). [DOI] [PMC free article] [PubMed] [Google Scholar]
- Varel V. H., Richardson A. J. & Stewart C. S. Degradation of barley straw, ryegrass, and alfalfa cell walls by Clostridium longisporum and Ruminococcus albus. Appl. Environ. Microbiol. 55, 3080–3084 (1989). [DOI] [PMC free article] [PubMed] [Google Scholar]
- Zhang C. et al. Structural modulation of gut microbiota in life-long calorie-restricted mice. Nat. Commun. 4, 2163 (2013). [DOI] [PMC free article] [PubMed] [Google Scholar]
- Ma J. W. et al. A splice mutation in the PHKG1 gene causes high glycogen content and low meat quality in pig skeletal muscle. PLoS. Genet. 10, e1004710 ( 2014). [DOI] [PMC free article] [PubMed] [Google Scholar]
- Ma J. W. et al. Genome-wide association study of meat quality traits in a white Duroc×Erhualian F2 intercross and Chinese Sutai pigs. PLoS. One 8, e64047 (2013). [DOI] [PMC free article] [PubMed] [Google Scholar]
- Zhang F. et al. Genome-wide association studies for hematological traits in Chinese Sutai pigs. BMC. Genetics 15, 41 (2014). [DOI] [PMC free article] [PubMed] [Google Scholar]
- Meng H. et al. Body weight selection affects quantitative genetic correlated responses in gut microbiota. PLoS. One 9, e89862 (2014). [DOI] [PMC free article] [PubMed] [Google Scholar]
- Youssef N. et al. Comparison of species richness estimates obtained using nearly complete fragments and simulated pyrosequencing-generated fragments in 16S rRNA gene-based environmental surveys. Appl. Environ. Microbiol. 75, 5227–5236 (2009). [DOI] [PMC free article] [PubMed] [Google Scholar]
- Lan Y. M., Wang Q., James R. C. & Rosen G. L. Using the RDP classifier to predict taxonomic novelty and reduce the search space for finding novel organisms. PloS. one 7 e32491 (2012). [DOI] [PMC free article] [PubMed] [Google Scholar]
- Ngoc T. T., Len N. T. & Lindberg J. E. Impact of fibre intake and fibre source on digestibility, gut development, retention time and growth performance of indigenous and exotic pigs. Animal 7, 736–745 (2013). [DOI] [PubMed] [Google Scholar]
- Sauer W. C., Fan M. Z., Mosenthin R. & Drochner W. [Method for measuring ileal amino acid digestibility in pigs] Farm animal metabolism and nutrition [D'Mello, J. P. F. (ed.)] [279–306] (CAB Direct., 2000).
- Caporaso J. G. et al. QIIME allows analysis of high-throughput community sequencing data. Nat. Methods 7, 335–336 (2010). [DOI] [PMC free article] [PubMed] [Google Scholar]
- Cole J. R. et al. The Ribosomal Database Project: improved alignments and new tools for rRNA analysis. Nucleic Acids Res. 37, D141–145 (2009). [DOI] [PMC free article] [PubMed] [Google Scholar]
- Schloss P. D. et al. Introducing mothur: open-source, platform-independent, community-supported software for describing and comparing microbial communities. Appl. Environ. Microbiol. 75, 7537–7541 (2012). [DOI] [PMC free article] [PubMed] [Google Scholar]
- Shen Z. et al. Deep 16S rRNA pyrosequencing reveals a bacterial community associated with banana Fusarium Wilt disease suppression induced by bio-organic fertilizer application. PLoS. One 9, e98420 (2014). [DOI] [PMC free article] [PubMed] [Google Scholar]
Associated Data
This section collects any data citations, data availability statements, or supplementary materials included in this article.
Supplementary Materials
Supplementary information