

Summary
Covalent histone modifications are highly conserved and play multiple roles in eukaryotic transcription regulation. Here, we mapped 26 histone modifications genome-wide in exponentially growing yeast and during a dramatic transcriptional reprogramming—the response to diamide stress. We extend prior studies showing that steady-state histone modification patterns reflect genomic processes, especially transcription, and display limited combinatorial complexity. Interestingly, during the stress response we document a modest increase in the combinatorial complexity of histone modification space, resulting from roughly 3% of all nucleosomes transiently populating rare histone modification states. Most of these rare histone states result from differences in the kinetics of histone modification that transiently uncouple highly correlated marks, with slow histone methylation changes often lagging behind the more rapid acetylation changes. Explicit analysis of modification dynamics uncovers ordered sequences of events in gene activation and repression. Together, our results provide a comprehensive view of chromatin dynamics during a massive transcriptional upheaval.
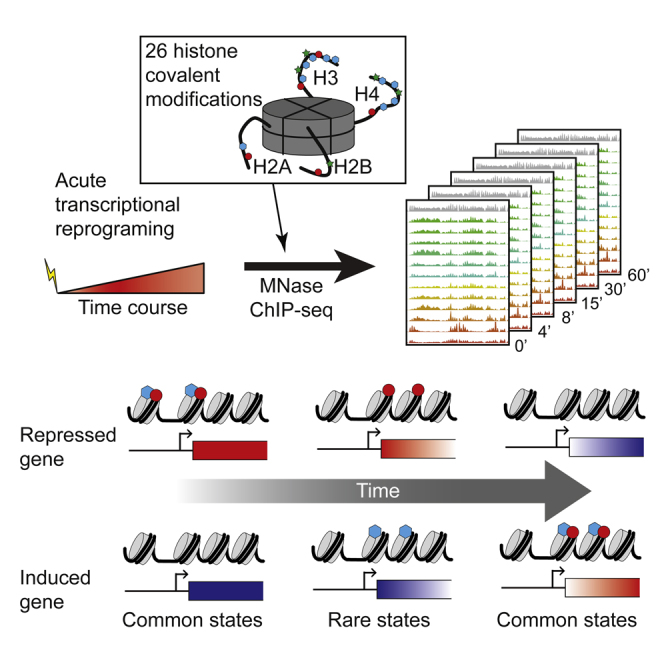
Graphical Abstract
Highlights
-
•
Comprehensive map of 26 histone marks during a transcriptional response in yeast
-
•
Stress does not alter global relationships between marks and transcription
-
•
Limited combinatorial complexity with transient modest increase during response
-
•
Ordered waves of histone modifications during transcriptional reprogramming
Weiner et al. carry out a thorough analysis of histone modification localization in budding yeast responding to stress. Histone modifications are highly correlated throughout the stress response, but a small number of nucleosomes enter unusual regions of 26-dimensional modification space during stress.
Introduction
All genomic transactions in eukaryotes take place in the context of a chromatin template (Kornberg and Lorch, 1999). Chromatin plays key regulatory roles in control of transcription and other processes, and a great deal of highly conserved cellular machinery is devoted to manipulation of nucleosome positioning (Hughes and Rando, 2014; Jiang and Pugh, 2009), histone subunit composition (Henikoff and Ahmad, 2005), and covalent modification states (Suganuma and Workman, 2008). Histone modifications play key roles in transcriptional control, cell state inheritance, and many other processes. Genome-wide maps of histone modifications exist for a variety of organisms, and have been used for identifying regulatory and functional elements of the genome (Ernst et al., 2011; Guttman et al., 2009; Hon et al., 2009).
Two outstanding questions in histone modification biology are raised by such genome-wide maps. First, histone modifications often occur at thousands of genomic locations (e.g., at every active transcription start site) yet typically have functional importance for transcription at a small subset of marked genes under standard growth conditions (Lenstra et al., 2011; Weiner et al., 2012). This raises the question of how a gene’s context—local sequence context and/or other histone modifications—impacts the functional readout of a given histone modification. The second question is why such a plethora of histone modifications are used by the cell—over 100 histone modifications have been identified, yet histone modifications co-occur in large, tightly correlated groups, and exhibit little combinatorial complexity (Rando, 2012).
Both of these observations—that histone modifications often occur at genes where they serve no apparent function, and that histone modifications co-occur—are at least partially the consequence of biological feedback. In other words, because transcript levels are buffered by feedback mechanisms, many of them are restored to wild-type levels in deletion mutants. Similarly, histone modifications often co-occur as a result of histone modification “crosstalk,” in which the enzyme that deposits mark B preferentially acts on A-marked nucleosomes (Suganuma and Workman, 2008). Histone modification networks thus include many feedforward and feedback loops of varying degrees of complexity. One way to uncover mechanisms of homeostasis is to perturb a network and study the time evolution of as many individual nodes in the network as possible—such observations can potentially distinguish direct effects from slower indirect effects.
Functional genetic studies confirm the value of extending steady-state studies to a dynamic context. Time course analyses of transcriptional response to perturbations have previously uncovered unanticipated effects of chromatin-related mutants—a multitude of single gene studies (see, e.g., Korber et al., 2006), as well as genome-scale studies (Weiner et al., 2012), have shown that chromatin regulators are more important during changes in transcription than they are for steady-state transcription.
These considerations lead us to further explore the effects of transcriptional reprogramming on histone modification dynamics. We used ChIP-seq to systematically map dynamic changes of 26 histone modifications in response to a stress signal in yeast (Figure 1A). Our data recover known aspects of the steady-state histone modification landscape, and show that relationships between histone modifications and transcription are maintained during the stress response. Most interestingly, during the stress response roughly 3% of all nucleosomes occupy unusual regions of histone modification space that are unoccupied in steady state. Inspection of these nucleosomes identifies differences in the kinetics of different histone modifications, and reveals multiple stages of the chromatin response to transcriptional changes.
Figure 1.

Epigenomic Landscape of a Yeast Stress Response
(A) Experimental outline. Yeast were subject to 1.5 mM diamide stress, and cultures were harvested for MNase-ChIP-seq mapping at the indicated time points.
(B) Steady-state histone modification landscape for budding yeast. ChIP-Seq signal for 26 histone modifications and nucleosome mapping data. Top panel shows genomic annotations.
(C) Histone modification dynamics over GLK1, a typical stress-induced gene. Data are shown for six time points following diamide stress.
Results
Genome-wide Patterns of Covalent Histone Modifications
We focus here on the yeast response to the sulfhydryl reducing agent diamide, which involves rapid and massive transcriptional reprograming of both the common stress response genes and ∼200 genes involved in cell wall protection and redox homeostasis (Gasch et al., 2000). Overall 19% of all mRNAs change expression during this response.
Using MNase-ChIP-seq (Liu et al., 2005; Radman-Livaja et al., 2011a) we mapped 26 histone modifications at mononucleosome resolution at varying times (t = 0, 4, 8, 15, 30, and 60 min) after diamide addition (Figure 1; see Table S1 available online). Easily apparent in the resulting genomic tracks (Figure 1B) are many well-described features of yeast chromatin, including (1) generally well-positioned nucleosomes, (2) nucleosome depletion at promoters, (3) H3K4me3 and acetylation enrichment at 5′ ends of genes, (4) H3K36me3 covering mid- and 3′ coding regions, and many more steady-state chromatin hallmarks. Zooming in on the dynamics during diamide response (Figure 1C) demonstrates typical behavior for the highly-induced gene GLK1 with H3K4me3, H3K36me3, and other transcription-correlated marks increasing over the gene body over time. Conversely, H4K16ac decreases over GLK1, presumably as a result of increased histone turnover during transcriptional induction.
Steady-State Histone Modifications Follow Stereotypical Patterns
We start by refining models of the chromatin landscape. Using the nucleosome mapping data to call 66,360 nucleosomes (Table S2), we calculated the occupancy of each nucleosome, as well as the level of the 26 mapped modifications, normalized to nucleosome occupancy (Table S3).
To explore the relationships between histone modifications, we calculated the correlation between the levels of all modifications, at all time points, across all nucleosomes (Figures 2A–2D). The 156 × 156 correlation matrix (Figure 2A) shows a strong concordance between all six time points for each modification—each 6 × 6 box on the diagonal is bright red—indicating that the global genomic landscape of any given modification is not drastically altered by diamide stress.
Figure 2.

Characterization of Histone Modification Patterns during Mid-Log Growth
(A) Correlation matrix for 26 histone modifications. For each modification, six time points are arranged from t = 0 to t = 60 from left to right.
(B–D) Scatterplots for strongly correlated (B), uncorrelated (C), and anticorrelated (D) pairs of modifications. Each scatterplot compares levels of the two modifications, normalized to nucleosome occupancy, for 66,360 individual nucleosomes in the yeast genome at t = 0. Colors indicate density.
(E–G) Metagene profiles for exemplary histone modifications. For each modification, data were aligned by the transcription start site (TSS) of annotated genes, grouped according to transcription rate (Churchman and Weissman, 2011).
The 26 marks studied here show relatively few basic types of genomic modification patterns. This is consistent with previous observations in yeast (Liu et al., 2005), flies (Filion et al., 2010), and mammals (Ernst et al., 2011) of low combinatorial complexity among histone modifications. The majority of histone modifications are found in two large groups (Figure 2A). The first group includes H3K4me3 and lysine acetylation marks that occur at the 5′ ends of coding regions and that scale with transcription rate (Figures 2E and S1). The second (albeit less coherent) group in Figure 2A is of modifications occurring over middle and 3′ ends of coding regions, such as H3K36me3 (Figure 2F). In addition, several modifications exhibit localization patterns related to gene structure that are somewhat distinct from the two main groups, including H4K16ac, the H2A variant Htz1 (H2A.Z), and various mono- and dimethylation marks (see below).
Finally, in addition to marks with localization patterns related to gene structure, the two phosphorylations stood out as unusual (Figures 2A and 2G). The localization pattern of H3S10ph is dominated by an ∼20 kb pericentric domain (Figure S2A) deposited every M phase (Crosio et al., 2002), a signal which overwhelms the minor coding region signal of anticorrelation with histone turnover (Weiner et al., 2012). The other unusual mark in this data set is the DNA damage-related H2AS129ph modification (often referred to as γ-H2AX), which occurs over subtelomeric regions and actively repressed genes (Szilard et al., 2010) (Figures 1B, 2G, and S2A). Analysis of the chromatin packaging state of rDNA genes (Figure S3) shows a similar correlation structure to that observed over the Pol2-transcribed regions of the genome.
Overall, our results recapitulate essentially all known aspects of the steady-state landscape of histone modifications in yeast, showing the quality of the data set.
Steady-State Histone Modifications Are Mostly Shaped by Transcription and Turnover
What are the major processes that shape the steady-state chromatin landscape? The first, detailed above, is the passage of RNA polymerase, which carries with it a large number of histone modifying enzymes as it traverses the genome (Buratowski, 2009). Second, genomic replication is pervasive and results in a dramatic but temporary restructuring of the chromatin template (Gruss et al., 1993). Finally, histone modifications are altered by replication-independent histone turnover—newly synthesized histones are incorporated into the genome and replace old ones, thus removing old marks. New histones also carry a set of covalent modifications, some of which are deposited by enzymes that act specifically on free, but not nucleosomal, histones (Deal and Henikoff, 2010; Dion et al., 2007; Kaplan et al., 2008; Rufiange et al., 2007). Beyond these pervasive processes, locus-specific processes can target specific chromosome positions, as, for example, observed at the pericentric domain of H3S10ph.
To quantify the extent to which the chromatin landscape is explained by these processes, we built a regression model that predicts the modification state of each nucleosome at mid-log, based on the nucleosome position along the gene, its occupancy levels, the RNA polymerase level (in sense and antisense directions; Churchman and Weissman, 2011), the nucleosome’s turnover rate (Dion et al., 2007), its position relative to the centromere or telomeres, and its relative replication timing (Raghuraman et al., 2001). This model explains 58% of the overall variation in the 26-dimensional histone modification data set, although the success of the model varies for different histone marks (Figure 3A). Some of the poorly explained modifications have higher inherent levels of measurement noise (Figure S2B), suggesting either a lower-quality antibody or a relatively even genomic distribution of the histone mark in vivo. Note that the reported percentages are based on a relatively simple linear regression model, and represent a lower bound on predictive power.
Figure 3.

Determinants of the Steady-State Modification Landscape
(A) Predicting modification data from genomic features. A model incorporating genomic features (sense and antisense transcription (Churchman and Weissman, 2011), nucleosome turnover rate (Dion et al., 2007), distance from centromere and telomere, replication timing (Raghuraman et al., 2001), and nucleosome position) predicts genomic patterns of all 26 histone marks. Plot shows the percent of signal explained per histone modification (see Figure S2B).
(B) Contribution of genomic processes to explanatory power of the model. Heatmap shows the percentage of explained signal that is lost when a given process is removed from the model. Synergistic refers to remaining explained variance not lost upon removing any single feature.
(C) Pie charts showing the variance explained by different aspects of the model for the indicated modifications.
(D) Predicting genomic features from modification data. For each entry, the heatmap shows the sparse linear regression coefficient for the mark in question.
(E) Turnover model parameters from (D) are shown here in numeric form.
(F) Turnover model accurately captures turnover rates genome-wide. Model predictions (x axis) are scatterplotted against experimental turnover data (y axis).
To quantify the contribution of each feature to these predictions, we removed each feature in turn from the overall model, re-estimated model parameters with remaining features, and determined the loss in variance explained (Figure 3B). These differences highlight the unique contribution of the removed feature to explaining a given process. These unique contributions do not necessarily sum to 100% of the signal, as many modifications are partially explained by several features (such as transcription and turnover, which are not purely uncorrelated with one another). In this case, removal of a single contributing feature will be partly compensated by other features in the relearned model. Therefore, we describe the remaining fraction of 100% as synergistic interactions between features.
The most informative feature in our model was nucleosome position within the gene, consistent with the observation that many histone modifying enzymes are recruited to genes by either the initiation or the elongation form of RNA Pol2 (Buratowski, 2009). The second most informative feature was transcription rate, which predicted both well-characterized transcription-deposited marks and marks that are anticorrelated with transcription (Figure 3C). Replication-independent turnover strongly predicts H3K56ac, a known mark of soluble histone proteins (Tsubota et al., 2007), as well as other marks of new histones such as H3K4ac and H3K9ac (Guillemette et al., 2011). Turnover was also predictive for slowly accumulating marks that are enriched in older nucleosomes—H3K79me3 and H4K16ac (Figure 3C). Chromosomal position was the best predictor of the pericentric H3S10ph and telomeric H2AS129ph marks (Figures 3C and S2A) but unexpectedly also contributed to prediction of H3K79me levels. Replication timing explained little overall variance—as expected given that every locus in the genome is duplicated once per cell cycle—with its strongest explanatory power for the subtelomeric H2AS129ph mark.
While our analysis recapitulates many known features of chromatin, many additional connections are also documented here. Most surprisingly, comparisons of sense and antisense transcription revealed a dichotomy among transcription-correlated marks between 5′-biased and gene body-enriched marks. Gene body marks were correlated mostly with sense transcription, while 5′ marks appeared to read out total Pol2 transit in both directions (Figures 3B and 3C). This likely reflects rapid termination of inappropriate antisense transcripts (Xu et al., 2009), which would prevent Pol2 from transitioning from initiation to elongation modification states.
Analysis of this predictive model shows subtle differences between otherwise highly correlated marks. For example, both H3K36me3 and H3K79me3 are transcription-correlated gene body marks (Figures 2A and S1). However, their levels are explained to a different extent by transcription and turnover (Figure 3C), with H3K36 methylation mostly explained by genic position and sense transcription levels, while H3K79me3 levels are far more influenced by turnover rates. This likely reflects the fact that there is no known H3K79 demethylase, and thus this mark is presumably removed only by nucleosome eviction (De Vos et al., 2011; Radman-Livaja et al., 2011b).
Histone Modifications Predict Genomic Processes
The fact that processes such as transcription and turnover are predictive of histone modifications allows the reverse—prediction of genomic transactions from chromatin data—to be used as a powerful experimental tool (Ernst et al., 2011; Garber et al., 2012; Guttman et al., 2009; Hon et al., 2009). We thus asked whether the larger number of modifications mapped here identify more precise predictors for genomic processes. We applied sparse linear regression (Experimental Procedures) to predict genomic features based on genome-wide modification data.
The regression coefficients of this model confirm the expectation that the most predictive histone modifications are usually the ones that are most closely associated with the genomic process (Figure 3D). Thus, for example, H3K18ac, H3K4me3, and H3K36me3 are predictive of transcription, with positive regression weights, while H3K79me3 and H2AS129ph are also predictive, with negative weights. The best predictor of turnover rates is H3K79me3, which is negatively correlated with turnover, while H3K18ac and H3K56ac provide positively correlated predictors of turnover (Figures 3D–3F).
Histone modifications are also predictive of replication timing. In particular, H3K56ac and H3K9ac—both marks associated with new nucleosomes—have opposite weights in this prediction. Higher H3K56ac levels are predictive of early replication times, while higher H3K9ac is predictive of later replication time. The connection between H3K56ac and early replication reflects both the length of time between a locus’ replication time and M phase H3K56 deacetylation (Celic et al., 2006; Maas et al., 2006), as well as the high turnover characteristic of early origins (Kaplan et al., 2008). The connection between H3K9ac and late replication is less clear—newly synthesized histone H3 is enriched for H3K9ac during S phase (Adkins et al., 2007), but whether this mark is generated preferentially later during replication or is otherwise targeted to late-replicating domains is presently unknown.
Taken together, these analyses provide an expanded list of marks to be used for annotation of genomic features and processes.
Dynamics of Individual Histone Modifications during Transcriptional Reprogramming
We next asked how individual histone modifications change during genome-wide transcriptional reprogramming (Gasch et al., 2000). We evaluated the nucleosome-specific change in each modification in terms of both the change relative to the t = 0 level and the extent to which the six time points show a consistent trajectory (Experimental Procedures). At a 10% FDR, we find that many nucleosomes change in at least one modification (∼60% of all nucleosomes), but substantially fewer show changes in several modifications, with ∼7% changed in five or more marks (Table S4; Figures S4A and S5). As expected, reprogrammed genes are significantly enriched with changed nucleosomes. Although these numbers reflect changes across a large fraction of the genome, the gross chromatin landscape features changed little during the stress response—see correlations for each modification across all six time points in Figure 2A.
Next, we asked whether the relationship between histone modifications and transcription rate was altered by transcriptional reprograming. Steady-state correlations observed between modifications and transcription might be universal to Pol2 passage itself, or alternatively could be linked to the specifics of the mid-log transcriptional program. Supporting the former model, we find that stress-induced transcriptional reprogramming generally maintains the mid-log relations between histone modifications and transcription rate. For example, levels of H3K18ac, a 5′ mark correlated with transcription rate in mid-log (Figure 2E), increase at the 5′ ends of activated genes, and decrease over repressed genes (Figures 4A and 4B). Most other transcription-correlated marks have similar patterns. Similarly, the anticorrelation between H2AS129ph and transcription rate is also dynamic (Figures 4C and 4D), consistent with a previous study showing H2AS129ph being gained at GAL genes upon repression (Szilard et al., 2010). In both cases, the peak of histone modification change coincided at t = 30 with the peak change in mRNA and Pol2 levels (Gasch et al., 2000; Kim et al., 2010), before levels of all three fall at t = 60 as yeast acclimate to the stressful environment (Figures 4E and 4F).
Figure 4.

Dynamics of Histone Modifications during the Stress Response
(A and B) Metagenes showing levels of the transcription-correlated H3K18ac mark, averaged for upregulated (A) or downregulated (B) genes in response to diamide stress.
(C and D) As in (A) and (B), for the repression-correlated H2AS129ph modification.
(E and F) Dynamics of H3K18ac (E) or H2AS129ph (F) changes over time are shown averaged for various nucleosome positions along a gene body—the −1, +1, +2, etc. nucleosomes—as indicated. For each nucleosome, time course data for the modification in question are averaged for genes upregulated, or downregulated, relatively rapidly or slowly (Experimental Procedures).
(G) Schematic of approach to correlations between histone modification dynamics and transcriptional dynamics.
(H) Correlations calculated as shown in (G), with red dots showing mid-log correlations, and gray bars showing correlations between diamide-induced change in modification and change in transcription.
(I and J) The correspondence between modification changes during diamide stress and transcription changes. In each case, a specific nucleosome location (+1, +5) is indicated. (Top panel) Histogram of the maximal change in the listed modification in response to diamide. (Bottom panel) Violin plots of changes in mRNA abundance for the genes carrying the nucleosomes in the bins above.
To visually compress the relationship between transcriptional dynamics and chromatin dynamics, for each histone modification and at each nucleosome position (+1, +2, etc.) we calculated the correlation between stress-induced changes in modification level and changes in transcription (Figures 4G, 4H, and S4C). This analysis reveals the expected positive correlations between H3 acetylation states and transcription, and anticorrelation between H2AS129ph and transcription. Globally, we find strong concordance between the correlations of modifications with transcription rate at steady state, and the correlation of the changes in modification levels with the diamide transcriptional response (Figures 4H–4J).
Notable exceptions to this general trend are two dimethylation states (H3K4me2 and H3K36me2), the histone variant Htz1 (H2A.Z), and H4K16ac, all of which are mostly uncorrelated with expression in steady-state measurements but exhibit anticorrelation with transcriptional changes. These observations highlight the power of our approach to identify transient chromatin states—dimethylation states occur transiently during the accumulation of trimethylation as gene expression increases, and thus exhibit changes during reprogramming but are not captured at steady state. The transient changes in H4K16ac and Htz1, both of which have well-established links to histone turnover, likely reflect a transient phase of turnover during gene induction/repression.
A Modest Increase in Combinatorial Complexity during the Stress Response
A key goal of this study was to determine whether tracing the time evolution of the histone modification network following a perturbation could uncover regulatory mechanisms (Figure 5A). We therefore sought to determine to what extent new combinatorial histone modification patterns appear during the stress response. We used Principal Component Analysis (PCA) to represent our 26-dimensional t = 0 (steady-state) data set, finding that three principal components could account for 76% of the variance in this data set (Figure 5B). Interestingly, the variance in the data set explained by these components decreased somewhat to ∼67% during the early (8–15 min) response to diamide, before recovering nearly to baseline at the final time point of this response (Figure 5B). This increase in signal which is not explained by these three principal components indicates a transient increase in combinatorial complexity. Moreover, visualizing nucleosomes with the same two principal components for each time point revealed that nucleosomes transiently populate previously sparse regions of this two-dimensional space early in the stress response (Figure 5C, black arrows).
Figure 5.

Changes in Histone Modification Space during Stress
(A) Schematic showing one potential mechanism leading to increased combinatorial complexity during a transient response. Briefly, if two histone marks are correlated but exhibit different relative response kinetics, then early during a change in transcription the nucleosomes will carry the rapid mark but lack the lagging mark.
(B) Principal Component Analysis of all 26 histone modifications. Percent variance explained for different time points.
(C) Transient population of low-density modification space during stress. Density of nucleosomes across the first two Principal Components at the indicated diamide time points. Arrows show regions that are more highly populated from t = 8 to 30 than during mid-log growth.
(D) Visualization of histone modification trajectories. Contour map shows the predominant locations of nucleosomes in the indicated two-dimensional modification space at t = 0. Arrows indicate the paths of four specific nucleosomes during the diamide time course.
(E) Transient population of new regions of histone modification space. (Left panel) Two-dimensional contour map for nucleosomes at t = 0 for H3K4me3 and H3K18ac. Nucleosomes that will fall significantly (Experimental Procedures) outside this contour during stress are color coded according to their location at t = 0. (Right panel) The t = 30 locations of nucleosomes that move to rare regions, with the t = 0 contour.
(F) As in (E), but for Htz1 and H3K56ac.
(G and H) Coherent groups of nucleosomes account for the unusual nucleosomes during stress. Trajectories for specific sets of nucleosomes as indicated, with the t = 0 domain marked by an empty oval, and the stress domain marked by points and a filled oval.
To better understand such chromatin state transitions and how they are related to regulatory mechanisms, we further analyze (1) the shape of histone modification space, (2) the trajectories of nucleosomes through modification space (Figure 5D), and (3) kinetic distinctions between different histone marks.
A Small Number of Unusual Histone Mark Pairwise Combinations
To identify changes in histone modification space in response to stress, we asked what histone modification combinations are unique to, or at least enriched during, the early stages of the stress response. We estimated the density of the 26-dimensional space defined by nucleosome states at t = 0, then sought nucleosomes that relocalize during stress to regions of this space that are sparsely populated at t = 0. Based on this 26-dimensional space, we identified ∼2,000 (3%) nucleosomes that moved to these low-density regions during the stress response (Experimental Procedures).
What novel histone modifications occur during the stress response? We considered two-dimensional “slices” of this histone modification space for pairs of histone modifications (Figure 5D). In such space, we can distinguish between nucleosomes that move about inside the high-density region (e.g., a and b in Figure 5D) and ones that start inside the region and move outside during the response (e.g., c and d in Figure 5D). For example, 459 nucleosomes in the H3K4me3/H3K18ac space leave the high-density region out of 14,926 nucleosomes that change in this space (Figure 5E). Color coding of a nucleosome’s location at t = 0 allows the rough trajectory of the unusual nucleosomes at t = 30 to be understood.
Analysis of all pairwise combinations (Table S5) identifies dramatic changes occurring for pairs of (1) H3K4me3 with various acetylation marks such as H3K18ac or H3K14ac, (2) Htz1 with acetylation marks and gene body trimethylation marks, and (3) H3K56ac with a range of marks. Although an average of 47 nucleosomes occupy rare regions of two-dimensional space for each of the 325 pairwise modification combinations (Table S5), the same nucleosomes are outliers in many separate two-dimensional comparisons. Clustering of all rare nucleosomes in 26-dimensional space reveals a handful of behaviors that result in unusual modification combinations (Figure S6), the most prevalent of which is the disconnect between H3K4me3 and histone acetylation marks.
While H3K4me3 and H3K18ac are normally extremely well-correlated (Figures 2A and 5E), during diamide stress we find scores of nucleosomes carrying high levels of H3K4me3 but lacking H3K18ac, as well as the converse situation with highly acetylated nucleosomes lacking H3K4me3 (Figure 5E). These nucleosomes are enriched at stress-repressed and -induced genes, respectively.
A qualitatively distinct behavior from the H3K4me3/H3K18ac disconnect is seen for Htz1 and H3K56ac (Figure 5F). Although at t = 0 these modifications are correlated, during the stress response we see two groups of nucleosomes that move into either the H3K56ac-enriched/Htz1-depleted region (top left) or the opposite region (bottom right). Both groups of nucleosomes start with mild enrichment of both marks, meaning that during stress they gain one modification at the expense of the other. This behavior may result from a delay between H3/H4 replacement and Htz1 incorporation—Htz1 levels are low at promoters with the highest H3/H4 turnover (Dion et al., 2007; Guillemette et al., 2005)—as here an increase (for example) in H3K56ac indicates increased H3/H4 turnover that would also displace Htz1. In contrast, reduction in H3K56ac could speed up Htz1 accumulation by decreasing the ability of the SWR complex to carry out futile Htz1/H2A replacement cycles (Watanabe et al., 2013). We thus speculate that the transient disconnect between these marks results from a delay between stress-induced turnover and SWR recruitment, or vice versa.
These results reveal, first, that ∼97% of nucleosomes do not explore novel areas of histone modification space (for the 26 modifications profiled here, at our time resolution) even in response to a dramatic transcriptional perturbation in which 60% of all nucleosomes change levels of at least one modification. The remaining 3% of nucleosomes do transiently gain novel combinations of histone marks during the stress response, with three to four possible ways of achieving this behavior. Below, we explore the mechanistic basis for the generation of one such noncanonical histone modification pattern.
Noncanonical Histone Modification Patterns Represent Coherent Responses
Do nucleosomes that move to underrepresented regions of modification space reflect a biologically coherent response, or are these nucleosomes “aberrantly modified” based on accidental genomic juxtapositions between overlapping gene control programs? More specifically, do unusual modification patterns occur specifically in association with genes sharing a common regulatory strategy? Searching a compendium of gene set annotations (Table S6) against the set of nucleosomes that explore noncanonical modification patterns revealed enrichment in multiple gene sets. For example, both ribosomal biogenesis genes (RiBi) and ribosomal protein genes (RPGs) are highly expressed during mid-log growth and strongly repressed by diamide, and both are enriched with noncanonical modification patterns during stress, although they exhibit distinct trajectories (Figures 5G, 5H, S6D, and S6E). +1 nucleosomes of RiBi genes begin with high levels of K4me3 and K18ac, and in response to stress show rapid and dramatic loss of K18ac but much slower changes in H3K4me3, leading a large number of them to the normally rare K4me3 high/K18ac low state. In contrast, +1 nucleosomes of RPGs start in an extreme region of this two-dimensional space as nucleosomes with the strongest signal for H3K18ac. They then show a transient increase in H3K4me3, followed by mild H3K18 deacetylation. This difference is consistent with the fact that repression of these two groups of genes involves different pathways (Weiner et al., 2012).
These and other examples (Figures 5G, 5H, and S6E; Table S7) suggest that our approach identifies rare, but biologically meaningful, cases where regulatory features of specific groups of genes lead their chromatin transactions to differ from the standard pathways for gene induction/repression used by most genes.
Dynamics of Chromatin Responses Reveal Subtle Distinctions between Histone Marks
How do rare histone modification states become populated in response to stress signals? In the case of H3K4me3/H3K18ac, the transient uncoupling of H3K4me3 status and H3K18ac levels appears to result from a difference in the kinetics of each modification’s response to transcriptional reprogramming—H3K18 deacetylation is rapid and occurs over genes subject to both short and longer-term repression, while H3K4 demethylation significantly lags deacetylation and is specific to longer-term gene repression.
To interrogate the dynamic behavior of individual histone modifications, we modeled the time course of histone modification changes at each nucleosome and extracted the time to half-maximal response (t1/2) and the amplitude of maximal response (h) (Figure 6A; Table S4). Our model interpolation enables continuous assignment of t1/2 times across our time course (Figure 6B), allowing us to compare differences in kinetic behavior between similar modifications. We also estimated kinetic parameters for mRNA abundance changes (Gasch et al., 2000) —similar results are obtained with analyses based on Pol2 ChIP-chip data (Kim et al., 2010).
Figure 6.

Analysis of Histone Modification Dynamics
(A) Extraction of kinetic parameters from time course data. RNA abundance and the indicated modification levels for the GLK1 +1 nucleosome. For each time course we extracted the maximal response (h) and the time to half-maximal response (t1/2).
(B) Comparison of measurements with extracted kinetic data, with rows showing individual genes. (Left panel) Time course data for H3K23ac levels at the +1 nucleosome sorted by t1/2; (middle panel) interpolated data; (right panel) mRNA abundance changes.
(C) Genome-wide kinetic offsets for up- and downregulated genes. For each modification, boxplot of the t1/2 is shown for up- or downregulated genes, as indicated.
Comparison of average timings of different modifications revealed a range of behaviors (Figure S7A). For example, acetylation marks tend to change more rapidly than methylation, with gene body marks H3K36me3 and H3K79me3 changing later than the majority of other modifications. As the dynamics of changes can depend on the location of the nucleosome on a gene and the transcriptional response of the gene, we focused on kinetics of those modifications whose change is correlated/anticorrelated with transcription (Figure 4H), and analyzed modification dynamics associated with the relevant gene region (Figure 6C). Interestingly, modification dynamics differ significantly between induced and repressed genes. For example, loss of H3K4me3 at the 5′ end of repressed genes is more rapid than establishment of the same mark over induced genes, presumably reflecting the time required for successive addition of up to three methyl marks. In contrast, establishment of H3 tail acetylations (with the exception of H3K27ac) at promoters of induced genes is more rapid than corresponding deacetylation at repressed genes. Modifications that are anticorrelated with transcription tend to occur later than acetylation marks, with more widely distributed t1/2 values. Among these, we notice a significant difference between the timing of H2AS129ph increase at repressed genes and its decrease at induced genes.
These results show clear differences in the timing of events based on their location and function. Changes at the 5′ end of genes, which are associated with either promoting or inhibiting initiation, tend to occur early in the response, while changes at the gene body, which are associated with elongating transcription, tend to appear later.
Modification Cascades in Transcriptional Reprogramming
Finally, we turn to single gene analysis of dynamics to gain a more biologically relevant picture of chromatin events in transcriptional reprogramming. To systematically analyze the ordering of 26 histone marks and transcription events, we calculated timing differences (Δt) between all pairs of marks for every gene in the yeast genome, revealing behaviors not apparent in individual plots of timing distributions. For example, analysis of the 5′ nucleosomes of Msn2-dependent induced genes revealed a subtle difference in the timing of H3K14ac and H2AS129ph across all genes as a group (Figure 7A). However, examining the t1/2 difference between these marks on a gene-by-gene basis revealed a striking and significantly consistent timing difference (Figure 7B). In this example, H3K14 acetylation precedes a change in H2AS129ph at the majority of Msn2 target genes (74%). These timing differences may suggest ordered recruitment of chromatin regulators in response to stress.
Figure 7.

Cascades of Chromatin Events Differ between Gene Sets
(A) Distribution of t1/2 values for the four indicated marks for all MSN2-induced genes.
(B) Gene-by-gene analysis for differences in modification onset times. The distribution of the difference in t1/2 is calculated for all individual genes in the MSN2-dependent gene set for the indicated modification pair.
(C) Four “epochs” in the MSN2 induction cascade. Groups of histone modification changes: modifications in each group roughly co-occur, but differ significantly in timing in pairwise comparisons from the other groups. For each box, the mean and 25th and 75th percentile values are shown for the distribution of differences in t1/2 between modifications in adjacent boxes.
(D) Heatmap showing all pairwise comparisons for MSN2-dependent upregulated genes. Each row/column represents a modification and a genic location (5′ end, or gene body) that changes coherently for MSN2-upregulated genes. Heavy lines show demarcation for the boxes summarized in (C).
(E and F) Summary diagrams, as in (C), for RiBi genes and RPGs, as indicated.
(G) Interpolated time course data for RiBi genes and RPGs for 30 min of stress response. The shown modification levels are averages, for genes in each group, of the log2 ratio to genome-wide mean at t = 0.
Gene-by-gene analysis of repressed and induced genes (Figures S7B and S7C) recovers cascades of events occurring during changes in transcription, which mainly recapitulates the order of events we observed above (Figure 6C). The dominant pattern in both analyses reflects 5′ acetylation marks changing prior to changes in mRNA abundance, with gene body methylation following. By assessing significant kinetic differences between pairs of events (Experimental Procedures), we can identify at least four clearly distinct temporal stages in the chromatin response to transcriptional activation (Figures 7C and 7D).
Beyond aggregating our gene-by-gene kinetic offsets into gross gene sets consisting of all up- or downregulated genes, these data can identify gene sets that have significantly coherent temporal event cascades. For example, the analysis above (Figures 5E–5G) suggested that histone modifications might exhibit distinct kinetic behaviors at the Ribosomal Biogenesis genes and Ribosomal Protein genes. Indeed, although both groups are repressed, they show rather different histone modification cascades (Figures 7E–7G and S7D). Several substantial differences can be appreciated between these highly repressed gene sets, including modifications that change over different timescales (e.g., H3K9ac and other H3 acetylation marks), and modifications exhibiting different magnitudes of change (e.g., H3S10ph and H2AK5ac). More interestingly, several modifications exhibit opposite behaviors: for example, H4 N-terminal lysines are deacetylated at RiBi, but not RPG, 5′ ends, and conversely are strongly acetylated only over RPG gene bodies. Finally, we confirm our previous finding (Weiner et al., 2012) that H3K4me3 is transiently induced at the 5′ ends of RPGs prior to being lost later during RPG repression. Curiously, most of these differences in modification profiles during stress reflect initial differences between RiBi and RPGs at t = 0, as for most modifications the two groups are more similar in the “off” state (at t = 30) than in the “on” state (t = 0) (Figure 7G). This suggests that some of the observed differences are due to different mechanisms involved in their mid-log transcription.
Discussion
This study represents the deepest characterization to date of the primary structure of the yeast chromatin landscape, with nucleosome positioning and 26 histone modifications mapped at nucleosome resolution genome-wide under standard conditions (growth in YPD), and during five time points of a well-characterized stress response. The data reproduce essentially all known characteristics of yeast histone modification localization and provide further insights into histone modification biology.
Steady-State Patterns of Histone Modifications
Analysis of histone modifications in actively growing “mid-log” yeast confirms and extends a great deal of prior knowledge. In general, histone modification patterns exhibit little combinatorial complexity, as repeatedly observed in many organisms (Rando, 2012). Essentially, we identify three major features that explain nucleosomal modification patterns. First, chromosome context impacts histone phosphorylation states—H3S10ph marks broad pericentric domains, while H2AS129ph marks subtelomeric domains. Second, the process of transcription leaves a massive footprint on chromatin, with enzymes carried by the initiation or the elongation form of RNA Pol2 being responsible for the majority of the variation in histone modifications across the genome. Finally, replication-independent histone replacement—which is modestly correlated with, and affected by, transcription—is responsible for deposition of histones carrying marks such as H3K56ac and lacking H3K79me3 and other marks. The roles of these factors in chromatin structure are all conserved to varying extents in other organisms, with many other organisms exhibiting additional elaborations such as the H3K9 and H3K27 methylation-dependent repressive mechanisms.
Rules of Chromatin Marks Are Broadly Maintained during Transcriptional Reprogramming
Our analysis of a stress response reveals that the relationships observed between modifications and transcription levels in mid-log growth are generally maintained during transcriptional reprograming—modifications that are correlated with transcription rate in steady-state conditions also increase during gene activation and decrease during gene repression. These observations imply that, broadly, the mechanisms that maintain the chromatin modification landscape in mid-log growth are the same or similar to the ones involved in changes during stress-induced transcriptional reprogramming. Thus, we argue that while the shift in cellular context from mid-log growth to stress response changes the transcription program (e.g., from TFIID-dominated to SAGA-dominated gene regulation), it does not change the rules governing the deposition and/or maintenance of chromatin marks. This suggests that the mechanisms that deposit most transcription-related marks are generic to transcriptional machinery rather than to the context in which it is activated or repressed.
Combinatorial Complexity during Transcriptional Reprogramming
The extensive crosstalk between transcription and histone modifications results in limited histone modification complexity. Despite the potential for widespread network motifs such as incoherent feedforward loops to generate transient combinatorial complexity in the histone modification network, we only observed a modest increase in combinatorial complexity during the peak of the stress response. Overall, we found that 3% of nucleosomes move into normally sparse regions of the histone modification space in response to diamide stress, despite ∼60% of all nucleosomes moving within this space during the stress response (Figure 5).
A number of mechanistically distinct processes could transiently violate steady-state histone modification correlations, including complex crosstalk loops, kinetic offsets between correlated marks, or population heterogeneity in gene induction. In the case of H3K4me3/H3K18ac, these traces reveal two major behaviors of nucleosomes that are rapidly deacetylated at H3K18 but still H3K4 methylated: a subset recover to the original modification status as yeast adapt to stress and reactivate transiently repressed genes, while another group of these nucleosomes instead lose H3K4me3 due to ongoing repression of the associated gene. In other words, transient uncoupling of H3K4me3 status and H3K18ac levels results from a difference in the kinetics of each modification’s response to transcriptional reprogramming—H3K18 deacetylation is rapid and occurs over genes subject to both short and longer-term repression, while H3K4 demethylation significantly lags deacetylation and is specific to longer-term gene repression.
Ordered Waves of Histone Modifications during Transcriptional Reprogramming
Although transcription-related modifications increase and decrease in expected ways upon changes in transcription, we see marked differences in the timing of these changes. In general, acetylation changes at the 5′ of genes appear early in the transcriptional response, while gene body methylation occurs more slowly. Similar timing differences were recently observed during yeast exit from starvation state (Mews et al., 2014). Here, the timing of changes depends on the transcriptional program, as different coregulated gene sets exhibit distinct cascades of modification changes. Understanding whether these cascades reflect independent events with different temporal delays or linear chains of dependent events will require further experiments with denser temporal samples and genetic or drug interventions. Our analysis provides an inventory of the relevant timescales and the representative modifications to follow in such detailed experiments.
Furthermore, although in general modification changes are generic, there are subtle differences in the timing and intensity of changes during repression/induction of differently regulated gene sets. This observation suggests that regulatory mechanisms do alter the footprints made on the chromatin modification landscape. Most notably, ribosomal protein genes and ribosomal biogenesis genes, both of which are strongly growth-related in expression, exhibit significant differences in chromatin dynamics during repression.
Toward a Comprehensive View of Chromatin Dynamics
The data set and analysis presented here provide a detailed and comprehensive view of chromatin state in yeast and how it responds to a massive transcriptional reprogramming event. Chromatin changes are intimately connected to transcriptional changes, occurring with clearly defined ordering relative to transcription. Although such observational data do not provide evidence of causality, they provide a rich resource for evaluating potential pathways and suggesting interventional experiments to further resolve the myriad interactions between chromatin marks and transcription.
Experimental Procedures
Cell Culture and MNase-ChIP
Wild-type yeast (BY4741) cells were grown in six flasks of 400 ml YPD to mid-log phase (OD600 = 0.55) shaking (220 rpm) at 30°C. Cells were treated with diamide (1.5 mM) and fixed at 0, 4, 8, 15, 30, and 60 min with 1% formaldehyde for 15 min. Cell pellets were harvested, washed by water, and subjected to bead beating, MNase digestion, and chromatin immunoprecipitation (Liu et al., 2005). For detailed protocol, antibodies and experimental batches see Supplemental Experimental Procedures and Table S1.
Library Preparation and Sequencing
Multiplexed libraries were prepared using HT-ChIP (Blecher-Gonen et al., 2013). Libraries were sequenced on an Illumina HiSeq-1500 (50 bp single-end sequencing) to obtain ∼5–10 million aligned reads per sample. Reads were mapped to the S. cerevisiae sacCer3 assembly using “bowtie2” with default parameters, and only tags that uniquely mapped were used for further analysis.
Data Processing and Normalization
Except for metagene views, all analyses were performed on nucleosome discretized (Table S2) and occupancy-normalized data. Using these values, we estimated the log ratio of ChIP coverage compared to input in each sample. Values within each time series (antibody × time points) were quantile normalized using MATLAB (version R2013a) quantilenorm function (Supplemental Experimental Procedures).
Regression and Sparse Regression
We used multiple linear regression analysis to reconstruct histone modifications levels from a collection of features: nucleosome position, mid-log occupancy (input), NET-seq (Churchman and Weissman, 2011) coverage both in sense and antisense directions, turnover rate (Dion et al., 2007), replication time (Raghuraman et al., 2001), and log of distance to nearest telomere or centromere. Since position is a discrete feature, we estimated a different regression model for each nucleosome position.
To use histone modifications to predict genomic features, we applied sparse linear regression (MATLAB’s lasso procedure) with 5-fold crossvalidation to estimate mean squared error (MSE). We fitted the lambda parameter value (nonnegative regularization parameter) with the minimum MSE using the default lambda scan method.
Detecting Nucleosomes at Low-Density Regions
To investigate the 26-dimensional modification space, we used kernel density estimation, with bandwidth determined by crossvalidation (Supplemental Experimental Procedures). To mark nucleosomes that arrive at low-density regions, we take the 0.1% quantile of the density at mid-log as our threshold for the definition of “low” density at all other time points. We used the same approach to detect low-density regions in pairwise dimensional projections of the data.
Fit and t1/2 Estimation
We use a nonparametric approach using multiple leave-one-out estimates to interpolate modification changes at each nucleosome and evaluate the accuracy of the interpolation (Supplemental Experimental Procedures). Given the estimate, the peak change, h, is defined as the point in time which has the maximal absolute change, relative to t = 0. We define t1/2 as the time at which the estimated response reaches half the peak change. For each nucleosome and each modification, we use a permutation test to evaluate whether the observed time trajectory is nonrandom (Supplemental Experimental Procedures).
Timing of Events in a Gene Set
To identify coherent events at the level of genes and gene sets, we partition nucleosomes in each gene to 5′ (−2, −1, +1, +2) and gene body (> = +3). For each gene, we average only the timing statistics of coherent nucleosomal changes (as defined above, 25% FDR) across these nucleosome sets to obtain events per gene and position (5′/gene body) for each modification, and for occupancy, and RNA levels. Each of these events has its peak change and t1/2. Next, for a given set of genes, each of the above events is considered coherent in the gene set, if (1) at least 40% of genes show a coherent response, (2) 75% of those responses changed in the same direction (“up”/”down”), and (3) the distribution of changes was significantly non 0 centered (t test with 5% FDR).
Ordering Events
We define the precedence of one event, A, over the other, B, with respect to a gene set, G, as the fraction of genes in which event A is preceded by event B by at least 1 min. For each such coherent event pair we performed one-sided t tests (with 5% FDR). Pairs that pass the test are defined as significant precedence relations. The set of these pairs define the Timing of Events (TOE) graph with regard to the gene set G. We cluster events to “comparable” clusters (Supplemental Experimental Procedures).
Author Contributions
A.W., T.-H.S.H., H.V.C., O.J.R., and N.F. conceived and designed this study. T.-H.S.H. and H.V.C. conducted the ChIP experiments. A.W., with support from A.R., A.A., and I.A., performed library construction and sequencing. A.W., A.A., and N.F. designed the computational methods. A.A. and A.W. developed and implemented these methods. A.W., A.A., O.J.R., and N.F. performed data analysis. O.J.R., N.F., A.W., and A.A. wrote the manuscript with contributions from all authors.
Acknowledgments
We thank T. Fazzio, M. Garber, P. Kaufman, T. Kaplan, R. Sadeh, A. Tresch, and members of the Rando and Friedman labs for comments on this manuscript. We thank A. Hughes for help with TSS mapping measurements. Work was supported in part by the NIGMS grant GM079205 to O.J.R. and N.F., NHGRI Center for Excellence in Genome Science (1P50HG006193) to I.A., ERC grants 340712 to N.F. and 309788 to I.A., ISF Center Grant 1796/12 to N.F., ISF Grant 1782/11 to I.A., and ISF I-CORE grant on “Chromatin and RNA in Gene Regulation” to N.F. and I.A.
Footnotes
This is an open access article under the CC BY-NC-ND license (http://creativecommons.org/licenses/by-nc-nd/4.0/).
Contributor Information
Oliver J. Rando, Email: oliver.rando@umassmed.edu.
Nir Friedman, Email: nir@cs.huji.ac.il.
Accession Numbers
The data in this paper are deposited at Gene Expression Omnibus (GEO) under accession number GSE61888.
Supplemental Information
Contains information for each time series: antibody details (supplier, clone, lot number), experimental batch, sequencing batch, and number of sequenced reads. Related to Figure 1.
Contains information for each nucleosome in the annotated atlas: genomic location of nucleosome center, coverage in the reference mid-log input, and annotation to a position in a gene (if one exists). Related to Figure 2.
Table of nucleosome (rows) versus samples (columns). Each entry is the log2 modification level relative to input. Samples have been normalized as described below. Related to Figure 2.
Table of nucleosomes (rows) versus samples (column). For each nucleosome X sample, listed are the t1/2, maximum change, interpolation error, and significance analysis for coherent change (see below). Related to Figures 4 and 5.
Number of moving/leaving nucleosomes in each pairwise comparison. Related to Figure 5.
List of genes within each gene set in our nonredundant set. Related to Figure 5.
Gene sets (rows) versus enrichment p value at different gene positions (see below). Related to Figure 5.
References
- Adkins M.W., Carson J.J., English C.M., Ramey C.J., Tyler J.K. The histone chaperone anti-silencing function 1 stimulates the acetylation of newly synthesized histone H3 in S-phase. J. Biol. Chem. 2007;282:1334–1340. doi: 10.1074/jbc.M608025200. [DOI] [PubMed] [Google Scholar]
- Blecher-Gonen R., Barnett-Itzhaki Z., Jaitin D., Amann-Zalcenstein D., Lara-Astiaso D., Amit I. High-throughput chromatin immunoprecipitation for genome-wide mapping of in vivo protein-DNA interactions and epigenomic states. Nat. Protoc. 2013;8:539–554. doi: 10.1038/nprot.2013.023. [DOI] [PubMed] [Google Scholar]
- Buratowski S. Progression through the RNA polymerase II CTD cycle. Mol. Cell. 2009;36:541–546. doi: 10.1016/j.molcel.2009.10.019. [DOI] [PMC free article] [PubMed] [Google Scholar]
- Celic I., Masumoto H., Griffith W.P., Meluh P., Cotter R.J., Boeke J.D., Verreault A. The sirtuins hst3 and Hst4p preserve genome integrity by controlling histone h3 lysine 56 deacetylation. Curr. Biol. 2006;16:1280–1289. doi: 10.1016/j.cub.2006.06.023. [DOI] [PubMed] [Google Scholar]
- Churchman L.S., Weissman J.S. Nascent transcript sequencing visualizes transcription at nucleotide resolution. Nature. 2011;469:368–373. doi: 10.1038/nature09652. [DOI] [PMC free article] [PubMed] [Google Scholar]
- Crosio C., Fimia G.M., Loury R., Kimura M., Okano Y., Zhou H., Sen S., Allis C.D., Sassone-Corsi P. Mitotic phosphorylation of histone H3: spatio-temporal regulation by mammalian Aurora kinases. Mol. Cell. Biol. 2002;22:874–885. doi: 10.1128/MCB.22.3.874-885.2002. [DOI] [PMC free article] [PubMed] [Google Scholar]
- De Vos D., Frederiks F., Terweij M., van Welsem T., Verzijlbergen K.F., Iachina E., de Graaf E.L., Altelaar A.F., Oudgenoeg G., Heck A.J. Progressive methylation of ageing histones by Dot1 functions as a timer. EMBO Rep. 2011;12:956–962. doi: 10.1038/embor.2011.131. [DOI] [PMC free article] [PubMed] [Google Scholar]
- Deal R.B., Henikoff S. Capturing the dynamic epigenome. Genome Biol. 2010;11:218. doi: 10.1186/gb-2010-11-10-218. [DOI] [PMC free article] [PubMed] [Google Scholar]
- Dion M.F., Kaplan T., Kim M., Buratowski S., Friedman N., Rando O.J. Dynamics of replication-independent histone turnover in budding yeast. Science. 2007;315:1405–1408. doi: 10.1126/science.1134053. [DOI] [PubMed] [Google Scholar]
- Ernst J., Kheradpour P., Mikkelsen T.S., Shoresh N., Ward L.D., Epstein C.B., Zhang X., Wang L., Issner R., Coyne M. Mapping and analysis of chromatin state dynamics in nine human cell types. Nature. 2011;473:43–49. doi: 10.1038/nature09906. [DOI] [PMC free article] [PubMed] [Google Scholar]
- Filion G.J., van Bemmel J.G., Braunschweig U., Talhout W., Kind J., Ward L.D., Brugman W., de Castro I.J., Kerkhoven R.M., Bussemaker H.J., van Steensel B. Systematic protein location mapping reveals five principal chromatin types in Drosophila cells. Cell. 2010;143:212–224. doi: 10.1016/j.cell.2010.09.009. [DOI] [PMC free article] [PubMed] [Google Scholar]
- Garber M., Yosef N., Goren A., Raychowdhury R., Thielke A., Guttman M., Robinson J., Minie B., Chevrier N., Itzhaki Z. A high-throughput chromatin immunoprecipitation approach reveals principles of dynamic gene regulation in mammals. Mol. Cell. 2012;47:810–822. doi: 10.1016/j.molcel.2012.07.030. [DOI] [PMC free article] [PubMed] [Google Scholar]
- Gasch A.P., Spellman P.T., Kao C.M., Carmel-Harel O., Eisen M.B., Storz G., Botstein D., Brown P.O. Genomic expression programs in the response of yeast cells to environmental changes. Mol. Biol. Cell. 2000;11:4241–4257. doi: 10.1091/mbc.11.12.4241. [DOI] [PMC free article] [PubMed] [Google Scholar]
- Gruss C., Wu J., Koller T., Sogo J.M. Disruption of the nucleosomes at the replication fork. EMBO J. 1993;12:4533–4545. doi: 10.1002/j.1460-2075.1993.tb06142.x. [DOI] [PMC free article] [PubMed] [Google Scholar]
- Guillemette B., Bataille A.R., Gévry N., Adam M., Blanchette M., Robert F., Gaudreau L. Variant histone H2A.Z is globally localized to the promoters of inactive yeast genes and regulates nucleosome positioning. PLoS Biol. 2005;3:e384. doi: 10.1371/journal.pbio.0030384. [DOI] [PMC free article] [PubMed] [Google Scholar]
- Guillemette B., Drogaris P., Lin H.H., Armstrong H., Hiragami-Hamada K., Imhof A., Bonneil E., Thibault P., Verreault A., Festenstein R.J. H3 lysine 4 is acetylated at active gene promoters and is regulated by H3 lysine 4 methylation. PLoS Genet. 2011;7:e1001354. doi: 10.1371/journal.pgen.1001354. [DOI] [PMC free article] [PubMed] [Google Scholar]
- Guttman M., Amit I., Garber M., French C., Lin M.F., Feldser D., Huarte M., Zuk O., Carey B.W., Cassady J.P. Chromatin signature reveals over a thousand highly conserved large non-coding RNAs in mammals. Nature. 2009;458:223–227. doi: 10.1038/nature07672. [DOI] [PMC free article] [PubMed] [Google Scholar]
- Henikoff S., Ahmad K. Assembly of variant histones into chromatin. Annu. Rev. Cell Dev. Biol. 2005;21:133–153. doi: 10.1146/annurev.cellbio.21.012704.133518. [DOI] [PubMed] [Google Scholar]
- Hon G., Wang W., Ren B. Discovery and annotation of functional chromatin signatures in the human genome. PLoS Comput. Biol. 2009;5:e1000566. doi: 10.1371/journal.pcbi.1000566. [DOI] [PMC free article] [PubMed] [Google Scholar]
- Hughes A.L., Rando O.J. Mechanisms underlying nucleosome positioning in vivo. Annu. Rev. Biophys. 2014;43:41–63. doi: 10.1146/annurev-biophys-051013-023114. [DOI] [PubMed] [Google Scholar]
- Jiang C., Pugh B.F. Nucleosome positioning and gene regulation: advances through genomics. Nat. Rev. Genet. 2009;10:161–172. doi: 10.1038/nrg2522. [DOI] [PMC free article] [PubMed] [Google Scholar]
- Kaplan T., Liu C.L., Erkmann J.A., Holik J., Grunstein M., Kaufman P.D., Friedman N., Rando O.J. Cell cycle- and chaperone-mediated regulation of H3K56ac incorporation in yeast. PLoS Genet. 2008;4:e1000270. doi: 10.1371/journal.pgen.1000270. [DOI] [PMC free article] [PubMed] [Google Scholar]
- Kim T.S., Liu C.L., Yassour M., Holik J., Friedman N., Buratowski S., Rando O.J. RNA polymerase mapping during stress responses reveals widespread nonproductive transcription in yeast. Genome Biol. 2010;11:R75. doi: 10.1186/gb-2010-11-7-r75. [DOI] [PMC free article] [PubMed] [Google Scholar]
- Korber P., Barbaric S., Luckenbach T., Schmid A., Schermer U.J., Blaschke D., Hörz W. The histone chaperone Asf1 increases the rate of histone eviction at the yeast PHO5 and PHO8 promoters. J. Biol. Chem. 2006;281:5539–5545. doi: 10.1074/jbc.M513340200. [DOI] [PubMed] [Google Scholar]
- Kornberg R.D., Lorch Y. Twenty-five years of the nucleosome, fundamental particle of the eukaryote chromosome. Cell. 1999;98:285–294. doi: 10.1016/s0092-8674(00)81958-3. [DOI] [PubMed] [Google Scholar]
- Lenstra T.L., Benschop J.J., Kim T., Schulze J.M., Brabers N.A., Margaritis T., van de Pasch L.A., van Heesch S.A., Brok M.O., Groot Koerkamp M.J. The specificity and topology of chromatin interaction pathways in yeast. Mol. Cell. 2011;42:536–549. doi: 10.1016/j.molcel.2011.03.026. [DOI] [PMC free article] [PubMed] [Google Scholar]
- Liu C.L., Kaplan T., Kim M., Buratowski S., Schreiber S.L., Friedman N., Rando O.J. Single-nucleosome mapping of histone modifications in S. cerevisiae. PLoS Biol. 2005;3:e328. doi: 10.1371/journal.pbio.0030328. [DOI] [PMC free article] [PubMed] [Google Scholar]
- Maas N.L., Miller K.M., DeFazio L.G., Toczyski D.P. Cell cycle and checkpoint regulation of histone H3 K56 acetylation by Hst3 and Hst4. Mol. Cell. 2006;23:109–119. doi: 10.1016/j.molcel.2006.06.006. [DOI] [PubMed] [Google Scholar]
- Mews P., Zee B.M., Liu S., Donahue G., Garcia B.A., Berger S.L. Histone methylation has dynamics distinct from those of histone acetylation in cell cycle reentry from quiescence. Mol. Cell. Biol. 2014;34:3968–3980. doi: 10.1128/MCB.00763-14. [DOI] [PMC free article] [PubMed] [Google Scholar]
- Radman-Livaja M., Ruben G., Weiner A., Friedman N., Kamakaka R., Rando O.J. Dynamics of Sir3 spreading in budding yeast: secondary recruitment sites and euchromatic localization. EMBO J. 2011;30:1012–1026. doi: 10.1038/emboj.2011.30. [DOI] [PMC free article] [PubMed] [Google Scholar]
- Radman-Livaja M., Verzijlbergen K.F., Weiner A., van Welsem T., Friedman N., Rando O.J., van Leeuwen F. Patterns and mechanisms of ancestral histone protein inheritance in budding yeast. PLoS Biol. 2011;9:e1001075. doi: 10.1371/journal.pbio.1001075. [DOI] [PMC free article] [PubMed] [Google Scholar]
- Raghuraman M.K., Winzeler E.A., Collingwood D., Hunt S., Wodicka L., Conway A., Lockhart D.J., Davis R.W., Brewer B.J., Fangman W.L. Replication dynamics of the yeast genome. Science. 2001;294:115–121. doi: 10.1126/science.294.5540.115. [DOI] [PubMed] [Google Scholar]
- Rando O.J. Combinatorial complexity in chromatin structure and function: revisiting the histone code. Curr. Opin. Genet. Dev. 2012;22:148–155. doi: 10.1016/j.gde.2012.02.013. [DOI] [PMC free article] [PubMed] [Google Scholar]
- Rufiange A., Jacques P.E., Bhat W., Robert F., Nourani A. Genome-wide replication-independent histone H3 exchange occurs predominantly at promoters and implicates H3 K56 acetylation and Asf1. Mol. Cell. 2007;27:393–405. doi: 10.1016/j.molcel.2007.07.011. [DOI] [PubMed] [Google Scholar]
- Suganuma T., Workman J.L. Crosstalk among histone modifications. Cell. 2008;135:604–607. doi: 10.1016/j.cell.2008.10.036. [DOI] [PubMed] [Google Scholar]
- Szilard R.K., Jacques P.E., Laramée L., Cheng B., Galicia S., Bataille A.R., Yeung M., Mendez M., Bergeron M., Robert F., Durocher D. Systematic identification of fragile sites via genome-wide location analysis of gamma-H2AX. Nat. Struct. Mol. Biol. 2010;17:299–305. doi: 10.1038/nsmb.1754. [DOI] [PMC free article] [PubMed] [Google Scholar]
- Tsubota T., Berndsen C.E., Erkmann J.A., Smith C.L., Yang L., Freitas M.A., Denu J.M., Kaufman P.D. Histone H3-K56 acetylation is catalyzed by histone chaperone-dependent complexes. Mol. Cell. 2007;25:703–712. doi: 10.1016/j.molcel.2007.02.006. [DOI] [PMC free article] [PubMed] [Google Scholar]
- Watanabe S., Radman-Livaja M., Rando O.J., Peterson C.L. A histone acetylation switch regulates H2A.Z deposition by the SWR-C remodeling enzyme. Science. 2013;340:195–199. doi: 10.1126/science.1229758. [DOI] [PMC free article] [PubMed] [Google Scholar]
- Weiner A., Chen H.V., Liu C.L., Rahat A., Klien A., Soares L., Gudipati M., Pfeffner J., Regev A., Buratowski S. Systematic dissection of roles for chromatin regulators in a yeast stress response. PLoS Biol. 2012;10:e1001369. doi: 10.1371/journal.pbio.1001369. [DOI] [PMC free article] [PubMed] [Google Scholar]
- Xu Z., Wei W., Gagneur J., Perocchi F., Clauder-Münster S., Camblong J., Guffanti E., Stutz F., Huber W., Steinmetz L.M. Bidirectional promoters generate pervasive transcription in yeast. Nature. 2009;457:1033–1037. doi: 10.1038/nature07728. [DOI] [PMC free article] [PubMed] [Google Scholar]
Associated Data
This section collects any data citations, data availability statements, or supplementary materials included in this article.
Supplementary Materials
Contains information for each time series: antibody details (supplier, clone, lot number), experimental batch, sequencing batch, and number of sequenced reads. Related to Figure 1.
Contains information for each nucleosome in the annotated atlas: genomic location of nucleosome center, coverage in the reference mid-log input, and annotation to a position in a gene (if one exists). Related to Figure 2.
Table of nucleosome (rows) versus samples (columns). Each entry is the log2 modification level relative to input. Samples have been normalized as described below. Related to Figure 2.
Table of nucleosomes (rows) versus samples (column). For each nucleosome X sample, listed are the t1/2, maximum change, interpolation error, and significance analysis for coherent change (see below). Related to Figures 4 and 5.
Number of moving/leaving nucleosomes in each pairwise comparison. Related to Figure 5.
List of genes within each gene set in our nonredundant set. Related to Figure 5.
Gene sets (rows) versus enrichment p value at different gene positions (see below). Related to Figure 5.