

Abstract
Sinusitis is a cause of significant morbidity, substantial healthcare costs, and negative effects on quality of life. The primary objective of this study is to characterize the previously unknown lipid profile of sinonasal mucosa from patients with chronic rhinosinusitis (CRS) and from controls. Sinus mucosa samples were analyzed from 9 CRS patients with concomitant nasal polyps, 11 CRS patients without polyps, and 12 controls. Ten lone polyp samples were also analyzed. Samples were subjected to a modified Bligh/Dyer lipid extraction, then high performance thin layer chromatography (HPTLC), combined gas chromatography/electron impact‐mass spectrometry (GC/EI‐MS), and flow‐injection/electrospray ionization‐tandem mass spectrometry (FI/ESI‐MS/MS). Data was analyzed for identification and profiling of major components. HPTLC revealed an array of species reflecting the lipid complexity of the samples. GC/EI‐MS revealed cholesterol and several fatty acids. FI/ESI‐MSMS revealed numerous lipid species, namely a host of phosphatidylcholines, phosphatidylethanolamines, ceramides and cholesteryl esters, but no detectable amounts of phosphatidyinositols or sulfated lipids. These results are a first step to uncover unique molecular biomarkers in CRS.
Keywords: metabolism, lipids, fatty acids, polyps, tissue
Introduction
Sinusitis refers to the mucosal inflammation of the paranasal sinuses. The inflammation can be caused by a number of factors, including microbial infection, anatomic obstruction, immune dysfunction, genetic causes, and environmental exposures. Sinusitis affects over 31 million Americans each year, or one in seven adults.1 Direct annual health‐care costs including office visits, emergency room visits, and prescriptions filled, is over $5.8 billion.1 From a molecular, histological, and clinical perspective, CRS is a heterogeneous disease2 that is poorly understood.
The medical management of patients with CRS includes nasal saline irrigation, nasal steroid sprays to reduce mucosal inflammation, and antibiotics to treat bacterial infections.2 Some patients respond rapidly to treatment and recover completely; however, responses to the same treatment vary widely, even among patients with similar symptoms and clinical findings. The unpredictable response to medical therapy and the potential side effects of long‐term antibiotic and steroid use demand a better strategy for selecting the appropriate therapy for each patient. Identifying unique molecular biomarkers for CRS might lead to more targeted and effective treatments for patients. Biomarkers can be used to identify compounds that change in concentration over time and reflect clinical status, disease progression and/or response to treatment. Biomarkers can also be used to identify a profile that predicts clinical outcome; and perhaps more importantly, to develop profiles that aid patient categorization that can be used to select specific treatments, thus evolving personalized medicine for the treatment of CRS.
Lipids play crucial roles in cell, tissue, and organ physiology as, including energy stores, structural components of membranes, signaling molecules, and hormone precursors, and thus their steady‐state concentrations are under tight homeostatic control.3, 4 Disease and injury result in disruption of control mechanisms, which is reflected in perturbation of the normal lipid concentrations within cells and tissue. For example, some cardiac disorders such as atherosclerosis have been linked to dys‐regulated lipid metabolism.5, 6, 7 Little is known about the role of lipids in sinus health and disease.
In this report, we use high performance thin layer chromatography (HPTLC) to gauge the lipid complexity of the samples, and combined gas chromatography/electron impact‐mass spectrometry (GC/EI‐MS) and flow‐injection/electrospray ionization‐tandem mass spectrometry (FI/ESI‐MS/MS) to qualitatively identify the major lipid classes in sinonasal mucosa from CRS patients with (CRSwNP) and without (CRSsNP) concomitant nasal polyp growth. This is the necessary first step toward elucidating differentiating characteristics that characterize CRSsNP and CRS with polyps that will be accomplished by untargeted lipidomics experiments on the classes of lipids identified here.
Methods
Solvents
Chloroform, methanol, and formic acid (FA) were purchased from Fisher Scientific (San Jose, CA 95134, USA). Triethylamine (TEA), butylated hydroxytoluene (BHT), and ammonium acetate (AA) were purchased from Sigma Aldrich (St. Louis, MO 63103, USA).
Patients recruitment and biological sample collection
With approval from, and strict adherence to, the UCLA Medical Institutional Review Board guidelines and regulations, samples were collected after written consent was obtained, at the time of surgery from patients with and without CRS. Control samples were obtained from patients undergoing endoscopic surgery for nonsinus related disease, such as for brain or orbital tumors. Sinus mucosa was analyzed in 9 CRSwNP patients, 11 CRSsNP patients, and 12 controls without sinus disease. Ten lone polyp samples (without mucosa) were also analyzed. Exclusion criteria include: (1) antibiotic or steroid use within 3 months of surgery, (2) patients younger than 18 years of age, and (3) inability or unwillingness to provide consent.
Sample collection
Samples were excised into sterile plastic specimen cups on ice in the operating room, and were transferred to 1.5‐mL microcentrifuge tubes, to which 500 μL of ice‐cold deionized water was added in the laboratory. Samples were mixed briefly, then centrifuged (2,000 × g). The supernatant was discarded and the process was repeated twice. Samples were then stored at −80°C.
Sample extraction
Samples were thawed at room temperature and then placed on ice. A small amount of tissue from each patient was placed on a watch glass, also on ice, and diced (roughly 500 μm2 pieces) to aid homogenization. In an effort to prevent oxidation of lipid molecules, butylated hydroxytoluene (BHT, final concentration 300 μM) was added to each solvent used throughout the extraction procedures. In glass test tubes, tissue aliquots from each patient category (roughly 20 mg from each patient) were pooled in 1 mL of deionized water containing BHT (dH2O+BHT), resulting in one test tube with CRSsNP mucosa,8 one tube with CRSwNP mucosa (CRSwNPT), one tube with control mucosa, and a fourth tube with polyp tissue (CRSwNPP). The pooled samples were then homogenized while on ice, either with an ultrasonic cell disrupter (Branson, three separate 15S bursts separated by 5 minutes) or a Brinkman Polytron Homogenizer (30S).
After settling, 10 μL aliquots of the supernatants were diluted 1:100 in dH2O+BHT and the optical density determined at 417 nm (empirically determined absorption max of the sample) against a water blank (Beckman DU 640B spectrophotomer).8 A 60 μL aliquot of freshly drawn human blood was diluted in 1 mL dH2O+BHT, sonicated as described above, and the OD417nm determined. From a comparison of the absorption intensities, human blood samples were prepared at an appropriate dilution in dH2O+BHT to match the hemoglobin content of each tissue sample.
The remainder of each homogenate and the matched human blood samples (990 uL each) were then subjected to a modified Bligh–Dyer lipid extraction.9, 10, 11, 12 To each, 1237.5 μL of chloroform containing 300 μM BHT (CHCl3+BHT) and 2475 μL methanol containing 300 μM BHT (MeOH+BHT; chloroform:methanol:water ratio of 1:2:0.8, v/v/v) was added. Samples were mixed thoroughly, and after 30 minutes at 27°C, additional CHCl3+BHT (1237.5 uL) and dH2O+BHT (1237.5 uL) were added (final chloroform:methanol:water ratio of 1:1:0.9, v/v/v). The samples were mixed thoroughly again and centrifuged (2,000 × g for 3 minutes) and the chloroform (bottom) phase was transferred with a glass syringe to 15‐mL glass capped test tubes. The extraction was repeated using a volume of CHCl3+BHT identical to that removed in the previous step. The pooled chloroform phases were dried under a gentle stream of dry nitrogen gas, capped, and stored at −20°C.
High performance thin layer chromatography
HPTLC was performed to elucidate the complexity of the tissue samples, broadly identify major lipid classes, and determine the contribution of blood to the sample lipid profiles. 12 Each sample was redissolved in chloroform (100 μL), and aliquots of each (5 μL) were loaded as 0.8 cm bands onto HPTLC plates (HPK silica gel 60 Å, 200 μm thickness, 10 cm × 10 cm, Whatman, Kent, UK, prewashed in chloroform–methanol 1:1 (v/v), dried and immediately prior to use heat‐activated at 100°C for 1 hour),12 along with lipid standards as a separate band (lactosylceramide [LacCer, 2 μg], triacylglycerol [TAG, 5 μg], phosphatidylcholine [PC, 5 μg], cholesterol [C, 5μg], and sphingomyelin [SM, 5μg]). After developing in chloroform/methanol/water (65:25:4, v/v/v), the plate was sprayed with orcinol (0.02% in 50% H2SO4) and heated (120°C, 2–3 minutes). An image of the stained plate was recorded. The plate was then further stained with Coomassie Brillliant Blue G‐250 (0.03% in 30% methanol/100 mM NaCl) and destained with methanol (30% in 100 mM NaCl).13, 14 Another image of the plate was recorded.
The remaining 90 μL of each sample was loaded as an 8 cm band onto a longitudinally prescored HPTLC plate and developed as described above. A narrow strip of this plate (5%) was detached (along the score) and stained with orcinol as described above. Based on the orcinol staining pattern, the unstained part was divided into four zones (zone 1, Rf 0.0–0.24; zone 2 Rf 0.24–0.47; zone 3 Rf 0.47–0.71; zone 4 Rf 0.71–1.0) and the silica from each was scraped into a clean glass tube (one zone/tube). The scrapings were treated with chloroform/methanol (1 mL, 1:1, v/v) and after centrifugation (2,000 × g, 5 minutes) the supernatants were collected into a new glass tube and the silica pellet was reextracted. The pooled supernatants were subjected to a Bligh–Dyer extraction by the addition of water (0.9 mL), the phases separated by centrifugation (2,000 × g, 5 minutes) and the chloroform phases were removed to clean glass vials. The Bligh–Dyer extraction was repeated once and the pooled chloroform phases were dried under a stream of nitrogen gas, resulting in four HPTLC fractions per sample stored at −20°C.
Gas chromatography/electron impact‐mass spectrometry of the HPTLC zones
Each HPTLC fraction was redissolved in chloroform:methanol (500 μL, 1:1). Fifty microliters of each sample were transferred to glass conical GC injector vials and dried under a gentle stream of dry nitrogen gas. Each sample was then treated with N,O‐bis(trimethylsilyl)trifluoroacetamide containing 10% trimethylchlorosilane (50 μL, v/v) and incubated (60°C, 60 minutes) to convert all carboxyl, amino, and hydroxyl functional groups to their corresponding trimethylsilyl derivatives.15, 16 The derivatized samples were then placed in an autosampler (Agilent 7683 series) from which an aliquot of each (1 μL, equivalent of 0.2% of the contents of the HPTLC fraction) was injected onto a bonded‐phase nonpolar fused silica capillary column (Phenomenex ZB‐5, phenyl/dimethylpolysiloxane 5/95, 60 m × 0.25 mm, 0.10 μm film thickness; injector port 250°C) and eluted (constant flow, 1 mL/min) with ultrahigh purity helium (Agilent 6890A GC system) over a 63‐minute temperature ramp (minutes/°C; 0'/50, 3'/50, 53'/300, 63'/300). The end of the column (GC/EI‐MS transfer line at 250°C) was directly inserted into the EI source (180°C, 70 eV) of a time‐of‐flight mass spectrometer (Waters GCT, calibrated with perfluorotributylamine immediately prior to the analysis of each batch of samples) scanning from m/z 40–650 (0.9 seconds/scan at a resolution [FWHM] of 7,000, lock‐mass from column bleed at m/z 207.0329—C5H15Si3O3) with a 15‐minute solvent delay. Data were collected with instrument manufacturer‐supplied software (MassLynx version 4.1). Each sample was individually prepared and run in duplicate.
Identifications were based on comparison of spectra averaged over the width of the GC peaks within the total ion chromatogram (TIC), with background subtraction, to the NIST 2008 Mass Spectral Library (version 2.0f). In order to be considered a tentative compound identification, the library assignment needed a NIST match factor of at least 750, which indicates strong concordance between the unknown and the library spectra, and must have passed visual inspection of the comparison of unknown and library spectra.
Electrospray ionization/tandem mass spectrometry
To screen for the major lipid classes on the basis of tandem mass spectra, new lipid extracts were prepared identically as described above. Extracts were redissolved in chloroform:methanol (500 μL, 1:1, v/v). To provide the appropriate ion‐pair reagents, an aliquot of each stock solution (50 μL) was diluted 1:5 in chloroform:methanol:formic acid (200 μL, 50:50:0.1, v/v/v). Another aliquot (50 μL) of each stock was diluted similarly in chloroform:methanol:triethylamine (200 μL, 50:50:0.1, v/v/v), and a third aliquot (50 μL) was diluted similarly in chloroform:methanol:ammonium acetate (200 μL, 50:50:10 mM, v/v/c). Ten microliters of each of these dilutions were analyzed on an Agilent 6460 triple quadrupole mass spectrometer by flow injection into an Agilent Jet Stream ion source (gas temperature 300°C, gas flow 6 L/minute, nebulizer pressure 45 psi, sheath gas temperature 50°C, sheath gas flow rate 10 L/minute, capillary voltage 4,500 V, nozzle voltage 2,000 V) with chloroform:methanol (50:50) as the running solvent (100%, 50 μL/min). Data were collected with instrument manufacturer‐supplied software (Agilent Mass Hunter version B.05.00). To validate these results, the solutions were concentrated 10‐fold and run identically on the same instrument.
Optimal conditions for precursor, product and neutral loss ion scans for the PC/SM, cholesteryl esters (CE), and sulfated lipids (S) were developed in‐house, and for the others were based on previous experience (Table 1).17, 18, 19, 20, 21, 22, 23, 24, 25, 26 Optimization for each compound class was performed with solutions prepared in chloroform:methanol (50:50, v/v), 1 pmol/μL using 10 μL injections, containing either 10 mM AA (CE), 0.1% TEA (phosphatidylserine [PS], phosphatidylinositol [PI] and S), or 0.1% FA (PC/SM, ceramide [Cer] and phosphatidylethanolamine [PE]).17 The standards utilized for this purpose were: PC, diheptanoyl phosphatidylcholine and 1‐heptadecanoyl‐1‐lyso‐phosphatidylcholine (Sigma Aldrich); PI, L‐α‐phosphatidylinositol sodium salt from Glycine max (soybean) (Sigma Aldrich); PS, 3‐sn‐phosphatidyl‐L‐serine sodium salt from bovine brain (Sigma Aldrich); Cer, ceramide from bovine spinal cord (Sigma Aldrich); PE, 3‐sn‐phosphatidylethanolamine from bovine brain (Sigma Aldrich). Instrument parameters (collision energy, fragmentor, and cell accelerator voltage) were manually tuned with repeat injections until maximal signal intensity for precursors ions were obtained in each scan modality. Limits of detection for these compounds were then determined by preparing serial dilutions of the standard solutions and running them at the aforementioned optimized conditions until the dilution at which a signal three times as intense as background was determined. Optimized instrument parameters and limits of detection for CE and S were previously determined on this instrument via similar means.27, 28, 29
Table 1.
Scan modalities for tandem mass spectrometric screens of major lipid classes
| Lipid class | Dilution used | Ions or neutral mass | Polarity | Type of scan | Fragmentor | Collision energy | LOD (injected in 10 μL) |
|---|---|---|---|---|---|---|---|
| PC/SM | FA | m/z 184 | Positive | Precursor | 100 | 20 | 450 fmol |
| PS | TEA | 88 | Negative | Neutral Loss | 45 | 21 | 40 pmol |
| PE | FA | 141 | Positive | Neutral Loss | 141 | 10 | 5 pmol |
| PI | TEA | m/z 241 | Negative | Precursor | 200 | 50 | 50 pmol |
| C | FA | m/z 264.1 and 265.3 | Positive | Precursor | 150 | 30 | 100 pmol |
| CE | AA | m/z 369.4 | Positive | Precursor | 80 | 7 | – |
| S | TEA | m/z 97 | Negative | Precursor | 190 | 85 | 200 fmol |
PC, phosphatidyl choline; SM, sphingomyelin; PS, phosphatidyl serine; PE, phosphatidyl ethanolamine; PI, phosphatidyl inositol; C, ceramide; CE, cholesteryl esters; S, sulfated lipids; FA, formic acid; TEA, triethyl ammonia; AA, ammonium acetate; LOD, limit of detection. LOD for CE not found due to high background at low concentrations. The LOD was determined from serial dilutions of standards prepared in‐house, and the assigned value was the amount injected that gave a signal about three times more intense than background.
Results
HPTLC profiles
HPTLC was used to check on the possible confound of variable blood contamination in the tissue extracts. The OD417nm absorption of the extracts provided a convenient metric for hemoglobin and therefore blood content. From the results it is clear the contribution of blood to the lipid profiles of the tissue samples was insignificant. Cospotted matched blood control samples for each tissue sample revealed relatively minor bands with the exception of C and possibly TAG, although the tissue samples were vastly stronger for these bands as well. So despite a slightly pink appearance after washing, the lipid profiles from the tissue samples were not confounded by the inevitable slight blood contamination.
HPTLC was also used to gauge the lipid complexity of the samples, and to screen for possible major differences. Visual inspection of the HPTLC plates reveals a complex array of lipids, with multiple bands in the region of PC and SM, another series in the region of LacCer, a series of relatively minor bands between LacCer and C, and strong bands at the Rf of C and TAG (Figure 1).
Figure 1.
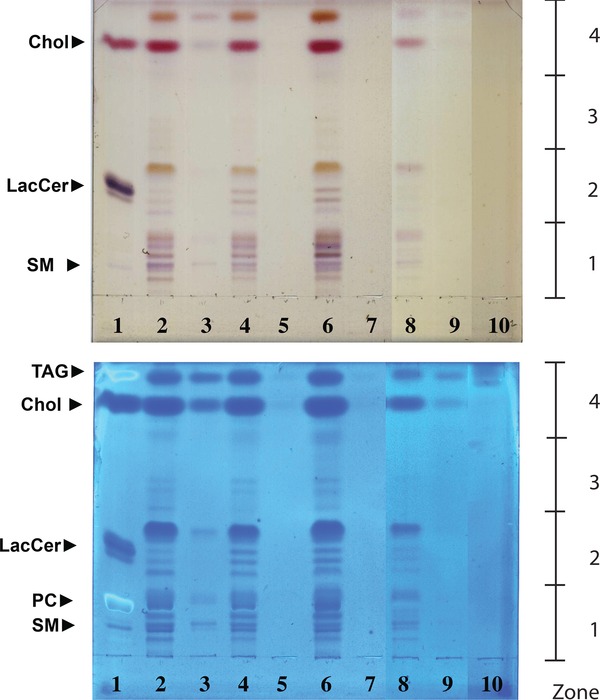
HPTLC profiles of the four tissue types and blood controls. Orcinol stained (top panel) and Coomassie blue stained (lower panel) HPTLC displays of (left to right): (1) standards (5 ug/compound except LacCer 2 ug); (2) control sinonasal mucosa; (4) sinonasal mucosa from patients with concomitant nasal polyp growth (CRSwNPT); (6) polyp tissue from patients with chronic rhinosinusitis with concomitant nasal polyp growth (CRSwNPP); (8) sinonasal mucosa from patients with chronic rhinosinusitis without concomitant nasal polyp growth (CRSsNP) patients; (10) blank. Matched blood controls for each sample are in the adjoining lanes (for example, for lane 2 the matched blood control is in lane 3). The display is derived from two HPTLC plates from which the relevant lanes have been adjoined electronically to simplify the presentation. The plates were run and first stained with orciniol and then Coomassie as described in the “Methods” section. The HPTLC‐purified samples that were separately prepared for mass spectrometric analysis were: zone1, Rf 0.0–0.24; zone 2, Rf 0.24–0.47; zone 3, Rf 0.47–0.71; zone 4, Rf 0.71–1.0.
GC/EI‐MS profiles of HPTLC zones
Although all the HPTLC zones were screened by GC/EI‐MS, only zone 4 revealed measurable peaks. Visual inspection of the total ion current (TIC) chromatograms from the zone 4 extracts revealed cholesterol as a major component in all four tissues (Figure 2), and the identification of cholesterol was unequivocal. In addition, less intense peaks were identified as glycerol, glucose, palmitic, oleic, stearic and lauric acids (Figure 2). With the exception of cholesterol, all identified compounds were on average 10‐fold more abundant in CRSwNPT, which possibly stands as evidence of altered lipid metabolism in this tissue type. Peak intensities for cholesterol in CRSwNPT, CRSwNPP, and control were overloaded, and thus an accurate measurement of its intensity was not possible. The cholesterol peak in CRSsNP was, however, on scale and less intense. Based on an estimated limit of detection of 1 ng injected, the inferred content of any free fatty acids in the samples must be less than approximately 5.5 ng per mg of tissue.
Figure 2.
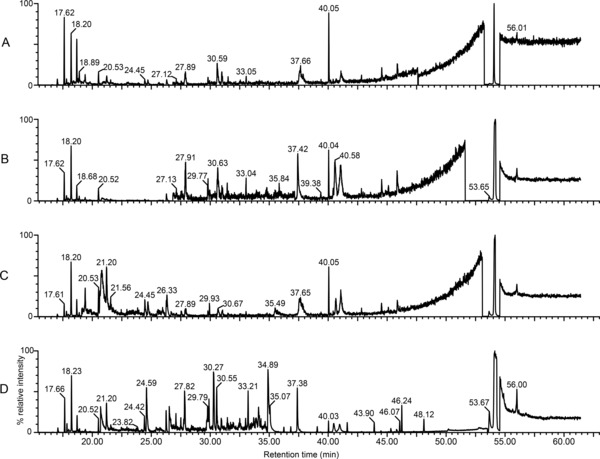
GC/EI‐MS total ion current chromatograms from HPTLC zone 4 extracts. Total ion current chromatograms of HPTLC zone 4 oxime/TMS‐derivatized eluates from tissue from patients with chronic rhinosinusitis without concomitant nasal polyp growth (CRSsNP) (panel A), control (panel B), polyp tissue from patients with chronic rhinosinusitis with concomitant nasal polyp growth (CRSwNPP) (panel C), and mucosa tissue from patients with chronic rhinosinusitis with concomitant nasal polyp growth (CRSwNPT) (panel D). The dominant peak in each chromatogram (retention time 54.07 minutes) was identified as cholesterol (Figure 3). Other tentative identifications include:glycerol (20.52 minutes), glucose (36.82 minutes), palmitic acid (37.41 minutes), oleic acid (40.51 minutes), stearic acid (40.98 minutes), and lauric acid (44.48 minutes). The region from 15.00 to 20.00 minutes is populated by byproducts of the derivatization reactions and excess derivatizing agents, and the large peak at 26.26 minutes was identified as BHT. To aid in visualizing smaller peaks, the ordinate of each chromatogram was regionally expanded as follows: (A ) 17.73–18.32 (×16), 18.35–26.07 (×54), 26.83–47.60 (×124), 47.65–53.24 (×82), 54.56–63.00 (×50); (B) 17.74–26.04 (×36), 26.83–37.16 (×630), 37.16–38.01 (×114), 38.01–51.62 (×280), 54.56–63.00 (×50); (C) 17.77–19.10 (×36), 19.10–26.14 (×280), 26.17–26.63 (×16), 26.67–53.08 (×186), 54.56–63.00 (×50); (D) 17.82–20.42 (×24), 20.70–26.10 (×124), 26.52–34.80 (×280), 34.81–53.51 (×10), 54.56–63.00 (×32). As compared to control, CRSsNP extracts appear less complex in fatty acid content. Both CRSwNPP and CRSwNPT are more complex as compared to control, and CRSwNPT appears more complex with more highly abundant fatty acids as compared to the CRSwNPP, which stand as evidence of altered lipid metabolism in these tissue types.
FI/ESI‐MSMS profiles
The MS/MS approach to identify the components of the major lipid classes using flow injection with appropriately selected scan modalities (Table 1), proved to be a fast and efficient screen. Using the redissolved Bligh/Dyer extracts, there was no evidence of ion suppression as learnt from repeat injections of 10‐fold concentrated samples from which there was the expected increase in signal intensity. The criteria for selection of ions from these spectra were such that the ions must be present in repeat injections from a given sample and peak intensity must be at least 10% larger than the local baseline. Such stringent criteria were used to restrict this report to the most abundant species and keep the number of assigned peaks to a manageable level. The estimated limits of detection (LOD) for the different lipid classes varied from 200 and 450 fmol, to 5, 40, 50, and 100 pmol injected from S, PC/SM, PE, PS, PI and C, respectively (Table 1). These injected LOD's were determined by injection of serial dilutions of the authentic standards as discussed above, and equate to tissue LODs between 125 fmol/mg (S) and 62.5 pmol/mg (Cer).
The complexity of the spectra varied for the different classes, and representative MS/MS spectra for the majorly present lipid classes (Figure 3) show the most abundant species in each. Tables 2, 3, 4, 5 show precursor ions for four major lipid classes identified (PC, PE, Cer, and CE, respectively) and the identity of the most intense ion from each sample. Signals for PI, PS, and S were not detected in any sample.
Figure 3.
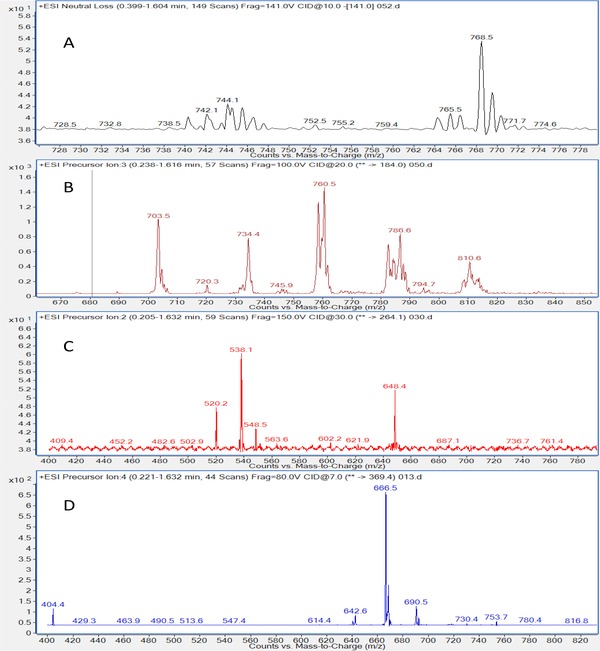
Representative MS/MS spectra of the majorly present lipid classes in tissue from patients with chronic rhinosinusitis without concomitant nasal polyp growth (CRSsNP tissue). (A) Neutral loss scan of m/z 141 of samples shows phosphatidylethanolamines and similar compounds. (B) Precursor ion scan of m/z 184 of samples shows phosphatidylcholines, sphingomyelins, and similar compounds. (C) Precursor ion scan of m/z 264.1 shows ceramides and similar compounds. (D) Precursor ion scan of m/z 369.4 shows cholesteryl esters and similar compounds. Compounds not shown here were present below the limit of detection.
Table 2.
Tabulation of the major ions evident in the precursor of m/z 184 scan modality, characteristic of phosphatidylcholine‐containing species. This listing includes only the signals that were more intense than 10% above baseline. Close inspection of the spectra reveals many less intense signals. The LOD for this scan modality is listed in Table 1
| Tissue type | Ion‐pair reagent | Ions (most intense in bold font) | Identification of most intense species |
|---|---|---|---|
| CRSsNP | FA | 703.5, 732.7, 734.8, 736, 746.4, 758.4, 760.4, 781.6, 782.5, 784.4, 786.5, 808.7, 810.7, 813.5 | 34a:1 Diacyl phosphatidylcholine |
| AA | 496.2, 522.2, 524, 689.1, 703.6, 720.5, 734.5, 746.4, 748, 758.5, 760.5, 768.5, 772.7, 774.2, 782.7, 784.6, 786.5, 794.5, 808.6, 810.7, 813.6, 834.8, 838.7 | 34e:2 Alkyl ether phosphatidylcholine | |
| CRSwNPT | FA | 675.6, 689.8, 703.4, 720.3, 731.3, 734.2, 735.7, 744.8, 746.3, 748.5, 758.5, 760.5, 766.2, 768.1, 770.7, 772.6, 782.5, 784.6, 786.6, 794.4, 796.3, 798.5, 806.6, 808.6, 810.5, 813.6, 824.3, 832.5, 834.7, 836.7 | 34a:2 Diacyl phosphatidylcholine |
| AA | 496.3, 544.2, 675.2, 689.0, 703.6, 718.5, 720.3, 730.3, 732.4, 734.5, 735.7, 742.3, 744.3, 746.6, 748.4, 758.6, 760.6, 768.6, 770.6, 772.3, 772.9, 774.5, 782.5, 784.6, 786.5, 788.4, 790.4, 806.4, 808.6, 810.6, 813.6, 834.6 | 34e:2 Alkyl ether phosphatidylcholine | |
| CRSwNPP | FA | 701.4, 703.4, 705.3, 706.4, 718.5, 719.5, 720.7, 734.5, 744.4, 746.7, 748.9, 758.5, 760.7, 768.3, 772.6, 782.6, 784.4, 786.5, 794.7, 796.5, 801.1, 808.4, 810.6 | 34a:2 Diacyl phosphatidylcholine |
| AA | 703.5, 720.6, 734.5, 744.7, 746.2, 748.5, 758.5, 760.5, 782.6, 784.6, 786.6, 788.6, 808.6, 810.6 | 34e:2 Alkyl ether phosphatidylcholine | |
| Control | FA | 674.7, 689.6, 703.6, 720, 731.7, 733.6, 734.4, 744.9, 746.5, 758.4, 760.6, 768.2, 782.5, 784.7, 786.6, 793.4, 794.7, 795.7, 796.4, 798.4, 801.3, 810.6, 834.7, 836.6, 839.6, 994.8 | 34a:2 Diacyl phosphatidylcholine |
| AA | 496, 522.7, 524.5, 544.5, 675.4, 689.6, 691.6, 703.5, 717.7, 720.4, 732.7, 734.5, 746.3, 748.5, 758.6, 760.6, 772.7, 782.5, 784.5, 786.6, 794.4, 806.6, 808.6, 810.7, 813.4, 822.6, 832.8, 834.4, 838.5, 844.7 | 34e:2 Alkyl ether phosphatidylcholine |
Table 3.
Tabulation of the major ions evident in the neutral loss of 141 Da scan modality, characteristic of phosphatidylethanolamine‐containing species. This listing includes only the signals that were more intense than 10% above baseline. Close inspection of the spectra reveals many less intense signals. The LOD for this scan modality is listed in Table 1
| Tissue type | Ion‐pair reagent | Ions (most intense in bold font) | Identification of most intense species |
|---|---|---|---|
| CRSsNP | FA | 746.4, 768.5 | 36a:1 Diacyl phosphatidylethanolamine |
| AA | 718.5, 740.5, 742.4, 744.5, 746.6, 766.2, 768.6 | Not identified | |
| CRSwNPT | FA | 716.4, 718.5, 740.5, 742.5, 744.5, 745.5, 746.5, 764.4, 766.3, 768.5, 769.5, 770.5, 790.5, 792.3, 794.5, 796.6 | 38a:4 Diacyl phosphatidylethanolamine |
| AA | 716.5, 718.5, 740.5, 742.5, 744.5, 746.5, 764.4, 766.4, 768.5, 770.5, 792.4, 793.4, 794.6, 796.3 | Not identified | |
| CRSwNPP | FA | 740.1, 742.5, 744.7, 746.5, 768.5 | 38a:4 Diacyl phosphatidylethanolamine |
| AA | 716.5, 718.5, 724.5, 740.3, 742.1, 744.5, 746.5, 766.5, 768.5, 770.5, | Not identified | |
| Control | FA | 716.5, 718.5, 742.5, 740.3, 744.5, 746.6, 752.4, 764.6, 766.5, 768.5, 780.7, 790.4, 792.5, 796.6 | 38a:4 Diacyl phosphatidylethanolamine |
| AA | 716.4, 718.6, 740.5, 742.6, 744.5, 746.5, 764.5, 766.5, 768.5, 770.5, 790.6, 792.5, 794.5, 796.5 | Not identified |
Table 4.
Tabulation of the major ions evident in the precursor of m/z 264 and 265 scan modality, characteristic of ceramides. This listing includes only the signals that were more intense than 10% above baseline. Close inspection of the spectra reveals many less intense signals. The LOD for this scan modality is listed in Table 1
| Tissue type | Ion‐pair reagent | Ions (most intense in bold font) | Name of most intense species |
|---|---|---|---|
| CRSsNP | AA | 538.1, 648.7 | C24:1 Ceramide |
| CRSwNPT | AA | 538.7, 648.1 | C16:0 Ceramide |
| CRSwNPP | AA | – | – |
| Control | AA | 538.4, 648.4 | C16:0 Ceramide |
Table 5.
Tabulation of the major ions evident in the precursor of m/z 369 scan modality, characteristic of cholesteryl esters. This listing includes only the signals that were more intense than 10% above baseline. Close inspection of the spectra reveals many less intense signals. The LOD for this scan modality is listed in Table 1
| Tissue type | Ion‐pair reagent | Ions (most intense in bold font) | Name of most intense species |
|---|---|---|---|
| CRSsNP | AA | 404.2, 666.5, 668.7, 690.3 | Cholesteryl linoleate |
| CRSwNPT | AA | 404.4, 640.5, 642.6, 666.5, 668.6, 690.5 | Cholesteryl linoleate |
| CRSwNPP | AA | 404.2, 642.4, 666.5, 668.3 | Cholesteryl linoleate |
| Control | AA | 404.4, 640.4, 642.5, 664.1, 666.5, 668.5, 688.6, 690.4 | Cholesteryl linoleate |
The parents of m/z 184 positive ion scan modality, used to screen for choline‐containing lipids, relies on the facile production of the C5H15PO4N+ fragment ion produced during collisionally activated dissociation (CAD) from all PCs by cleavage of the moiety attached to the sn3 position of the glycerol backbone.30 Even with stringent selection criteria, in FA, this scan modality revealed a complex array of signals in all samples with more than 11 species present in CRSsNP, 24 in CRSwNPT, 18 in CRSwNPP, and 17 in control (Table 2, even‐numbered m/z values). The pair of ions at m/z 758 and 760, presumably differing by a single double bond, dominated both profiles and are assigned as 34a:2 and 34a:1 diacylphosphatidylcholine, respectively. When identical samples were diluted in AA, profiles of all tissue types were more complex. CRSsNP had more than 20 species present, CRSwNPT had more than 27, CRSwNPP had more than 13, and 24 were present in control. Sprinkled among the even m/z signals are a small number of odd mass assignments.
The neutral loss of 141 Da positive ion scan mode was used to profile PEs. 26 This selection was based on the common facile loss of the C2H8O4NP molecule from the protonated PE molecular ions during CAD. CRSsNP, CRSwNPT, CRSwNPP, and controls revealed 2, 14, 5, and 14 species, respectively in FA‐containing solvent (Table 3). Once again, AA‐containing revealed more diversity of species as 7 species in CRSsNP, 13 in CRSwNPT, 10 in CRSwNPP, and 14 in controls. The most abundant species in nearly all samples was the ion at m/z 768, corresponding to 38a:4 diacylphosphatidylethanolamine. These profiles also revealed a few odd mass assignments.
The parents of m/z 264 and 265 positive ion scan modality in AA‐containing solvent was used to profile Cers.22, 31 This modality relies of the facile production and dehydration of the C18H34O2 + ion, resulting in a C18H32O+ fragment produced during CAD. In CRSsNP, CRSwNPT, and control tissues, two species were identified. The most abundant species in CRSwNPT and control was the C16:0 (palmitoyl) and in CRSsNP was the C24:1 (lignoceryl fatty acid with a double bond, possibly nervonic acid) varieties. None were detected in the CRSwNPP sample (Table 4).
The parents of m/z 369 positive ion scan modality in AA‐containing solvent was used to profile CEs.29 This scan modality was based on the facile fragmentation of the all CE (M+NH4)+ parents yielding an intense ion for the cholesterol‐containing fragment (C27H49) during CAD. CRSsNP, CRSwNPT, CRSwNPP, and controls revealed 4, 6, 4, and 8 species, respectively, in AA‐containing solvent, of which the signal at m/z 666 corresponding to the linoleate ester was most intense in both (Table 5).
The scan modality for PS, the neutral loss of 87 Da in the negative ion mode in TEA solvent, was based on the loss of the serine functionality (C3H5NO2) from the (M–H)− parent ion common to these compounds.26 The scan modality for PI was based on the parents of the common fragment ion at m/z 241 (C6H10O8P) in the negative ion mode in TEA solvent formed in abundance under CAD conditions with these compounds.32 The scan modality for S was based on extensive in‐house experience with these lipids33, 34 in which the common negative fragment ion at m/z 97 (HSO4 −) forms the basis of the scan in the negative ion mode in TEA solvent. Despite careful optimization of scan parameters for each of these modalities, using authentic standards, signals for PI, PS, and S from all samples were below their respective limits of detection (Table 1).
Discussion
As with all metabolomics experiments, displaying all the components in a given sample requires a multifaceted approach. This is particularly true in lipidomics. Here we have used pooled tissue from chronic rhinosinusitis with and without concomitant nasal polyp growth to probe for any major differences in lipid composition, and to define the major species of lipids in these samples. This will provide a background for interrogation of individual patient samples in future work. We have used a combination of HPTLC, GC/EI‐MS, and FI/ESI‐MS/MS to provide as complete a paradigm as possible. To our knowledge this is the first study of its kind to evaluate the lipid characteristics of sinonasal tissue, and is a vital first step toward elucidation of putative biomarkers for CRS. An advantage of HPTLC profiling of Bligh–Dyer extracts is that it provides a convenient method to screen for lipid complexity in unknown samples, and a visualization of all the major components in a single display. A shortcoming is an LOD of approximately 0.5 μg/compound (1 nmol with a molecular weight of 500). In contrast, mass spectrometry has excellent sensitivity and specificity with the major limitation being the lack of a scan modality that is appropriate for all compounds. Because this work was not sample limited, we have used a combination of HPTLC and mass spectrometry to provide a global qualitative analysis of the lipid components of sinonasal tissue from the three patient classes.
Inclusion of a blood control for each tissue type on the HPTLC chromatogram showed a relatively sparse banding pattern, indicating an insignificant contribution of blood to the tissue extracts. A variable blood contamination is unavoidable in this work due to the vascular nature of mucosa, and is adequately reduced by rinsing the unhomogenized tissues in water. Visual comparison of lanes for the four tissue types reveals a comparatively less complex and less abundant lipidome in CRSsNP than in control. CRSwNPT, on the other hand, appears to have a much more complex array of lipids and much denser banding. Of note is the fact that CRSwNPP has a simpler lipidome, roughly matching that of controls, than the mucosa from which it grows. The comparison suggests a widespread elevation in mucosal lipid metabolism accompanies polyp growth.
The untargeted GC/MS lipidomic profiling of the trimethylsilyl‐oxime derivatives of Bligh–Dyer extracts of HPTLC zones revealed that CRSsNP, CRSwNPP, CRSwNPT, and control samples were similar in lipid species content; however, CRSwNPT was comparatively richer in glucose and all identified fatty acids. The biggest difference revealed is in the fatty acid region of the chromatograms (Figure 2, 37–44 minutes). The signals for the fatty acids (palmitic, oleic, stearic, and lauric) were approximately 10‐fold more concentrated in the CRSwNPT than in the other tissue types. This is consistent with the observations made with HPTLC.
The most abundant lipids revealed by FI/ESI‐MS/MS were members of the PE, PC, Cer, and CE classes. PCs are the principal phospholipids in human cell membranes and are a pulmonary surfactant.35 These lipids are typically found on the exoplasmic side of the cell membrane and play a role in membrane‐mediated signaling. While PCs are mainly structural components of cellular membranes, they also serve roles in signaling, differentiation, proliferation, and programmed cell death. In this work, the PCs are the most diverse and most abundant of the classes studied, this being likely due to the relatively uibiquitous nature of choline‐containing lipids. There were more signals and they were more intense when samples were redissolved in AA‐containing solvent. This observation is of methodological significance relevant to future lipidomic screening experiments.
PEs are found in all living cells and account for nearly a quarter of all phospholipids.36, 37, 38 In human physiology, they are typically found in nervous tissue serving roles in membrane fusion and cytokinesis, lipoprotein release in the liver, and, pathologically, prion propagation without the involvement of other proteins or nucleic acids. In bacteria, however, PEs are the principal phospholipids; therefore, the relative abundance of these lipids in these samples may be indicative of a bacterial presence. In samples injected with the formic acid ion‐pair reagent, the precursor ions of the neutral loss scan are [M+H]+, therefore the measured molecular weights would be odd, and, according the nitrogen rule, the molecules must contain one or a larger odd number of nitrogen atoms. This lends confidence to the identification of these molecules as PEs; however, the precursor ions identified via injection with the ammonium acetate ion‐pair reagent results in [M+NH4]+, and thus the measured molecular weights would be even. The neutral loss of 141 Da of ammoniated compounds results in identification of ions of either PEs with three or more nitrogen atoms, or a different class of molecules altogether. As such, while the neutral loss of mass 141 Da scan, in a narrow scan window, worked well for identifying PE standards, in principal, it is insufficiently specific, nor is it sufficiently sensitive to be used on complex samples. A PE‐specific targeted assay will be needed for future work.
Ceramides are one of the components of sphingomyelin—a key structural element of the lipid bilayer. Contrary to previous assumptions, it is now clear that they also participate in cellular signaling. The differential presence of ceramides in mucosa samples is another finding that has emerged from this work. The presence of primarily palmitoyl‐containing species in CRSwNPT and CRSwNPP could be a consequence of the altered metabolism that supports polyp growth. These compounds are therefore potential biomarkers for distinguishing between patients with CRSsNP from those who are going to develop polyps and will ultimately require specialty care and possibly surgery.
Interestingly, CEs are among the major contributors to local lipidome in sinonasal mucosa and nasal polyps. The linoleate and oleate esters are present in all tissue types (Table 5). Cholesteryl palmitoleate is not present in CRSsNP tissue, but is present in CRSwNPT samples, while cholesteryl palmitate is present in CRSwNPP samples. Cholesteryl arachidonate is present in all mucosa samples, but not in nasal polyps. These findings could be potentially significant. According to Porter et al., cholesteryl arachidonate and cholesteryl linoleate show microbicidal effects in vitro, including against Pseudomonas aeruginosa,29 a common pathogen in humans and infection by which causes generalized inflammation. The differential presence of these antimicrobial lipids across the different tissue types will be a topic of future study.
PS, PI, and S were present below the limit of detection in these samples (40 pmol, 50 pmol, 200 fmol, respectively injected, Table 1). This is an unexpected result as PI and PS are relatively common cellular membrane structural phospholipids and sulfated lipids play roles in cell‐surface signaling.39, 40 The significance of this finding is also obscure at the moment. This is not to say that these lipid classes do not exist in sinonasal mucosa and/or nasal polyps, but rather either their respective concentrations in these tissues are low.
The presence of odd m/z assignments in the PC and PE scan modalities presumably indicates the presence of impurities. This is an unavoidable confound in the modified Bligh/Dyer extraction process when applied to whole tissue samples, as anything sufficiently nonpolar will partition into the organic phase. Overall, the extracts were relatively free of ions that did not match the expected odd/even assignment.
Conclusion
These results represent a first step to characterize the lipid profile of patients with CRS and to identify potential biomarkers. There is a dearth of literature on lipidomic profiling in sinonasal mucosa. Given the large and diverse role of lipids in tissue structure and the regulation of local homeostasis, the lipidome of the sinonasal flora is a logical place to begin looking for candidate biomarkers. Tissue lipidomics holds promise in the healthcare field. With the goal of eventually improving patient categorization and personalized treatment modalities, time and energy dedicated to these endeavors is worthwhile.
Conflict of Interest
The authors have declared that no conflicting interests exist.
Acknowledgments
The authors wish to thank Alexander Yoon for his help in setting up lipid extractions and cholesteryl ester tandem mass spectrometric methods, Steven G. Clarke and Jonathan Lowenson for the use of their spectrophotometer, Nigel Maidment for the use of his ultrasonic cell disruptor, Robert Murphy, Alex Brown, F.F. Hsu, and John Turk for help with MS/MS methods, Marilene Wang and Marvin Bergsneider for contributing to our tissue pool. NIH SIG grant 1S10RR023718–01A2 for the purchase of the Agilent 6460 triple quadrupole mass spectrometer. UCLA Faculty Research Grant entitled, “Expression of Novel Therapeutic Targets in Chronic Sinusitis.”
References
- 1. Halawi AM, Smith SS, Chandra RK. Chronic rhinosinusitis: epidemiology and cost. Allergy Asthma Proc 2013; 34: 328–34. [DOI] [PubMed] [Google Scholar]
- 2. Leo G, Triulzi F. Incorvaia: diagnosis of chronic rhinosinusitis. Pediatr Allergy Immunol 2012; 23: 20–26. [DOI] [PubMed] [Google Scholar]
- 3. Ameer F, Scandiuzzi L, Hasnain S, Kalbacher H, Zaidi N. De novo lipogenesis in health and disease. Metabolism 2014; 63: 895–902. [DOI] [PubMed] [Google Scholar]
- 4. de Kroon AI, Rijken PJ, De Smet CH. Checks and balances in membrane phospholipid class and acyl chain homeostasis, the yeast perspective. Prog Lipid Res 2013; 52: 374–394. [DOI] [PubMed] [Google Scholar]
- 5. Mukhopadhyay R. Mouse models of atherosclerosis: explaining critical roles of lipid metabolism and inflammation. J Appl Genet 2013; 54: 185–192. [DOI] [PubMed] [Google Scholar]
- 6. Yu XH, Jiang N, Zheng XL, Cayabyab FS, Tang ZB, Tang CK. Interleukin‐17A in lipid metabolism and atherosclerosis. Clin Chim Acta 2014; 431: 33–39. [DOI] [PubMed] [Google Scholar]
- 7. Umetani M, Ghosh P, Ishikawa T, Umetani J, Ahmed M, Mineo C, Shaul PW. The cholesterol metabolite 27‐hydroxycholesterol promotes atherosclerosis via proinflammatory processes mediated by estrogen receptor alpha. Cell Metab 2014; 20: 172–182. [DOI] [PMC free article] [PubMed] [Google Scholar]
- 8. Luthra A, Denisov IG, Sligar SG. Spectroscopic features of cytochrome P450 reaction intermediates. Arch Biochem Biophys 2011; 507: 26–35. [DOI] [PMC free article] [PubMed] [Google Scholar]
- 9. Tanphaichitr N, Zheng YS, Kates M, Abdullah N, Chan A. Cholesterol and phospholipid levels of washed and percoll gradient centrifuged mouse sperm: presence of lipidspossessing inhibitory effects on sperm motility. Mol Reprod Dev 1996; 43: 187–195. [DOI] [PubMed] [Google Scholar]
- 10. Wolf DE, Lipscomb AC, Maynard VM. Causes of nondiffusing lipid in the plasma membrane of mammalian spermatozoa. Biochemistry 1988; 27: 860–865. [DOI] [PubMed] [Google Scholar]
- 11. Bligh EG, Dyer WJ. A rapid method of total lipid extraction and purification. Can J Biochem Physiol 1959; 37: 911–917. [DOI] [PubMed] [Google Scholar]
- 12. Kates M: Technique of lipidology: isolation, analysis and identification of lipids In: Burdon RH. and Knippenberg PH. eds. Laboratory Techniques in Biochemistry and Molecular Biology. Volume 3 2nd Edition New York, NY: Elsevier; 1986: 100–278. [Google Scholar]
- 13. Furimsky A, Vuong N, Xu H, Kumarathasan P, Xu M, Weerachatyanukul W, Bou Khalil M, Kates M, Tanphaichitr N. Percoll gradient‐centrifuged capacitated mouse sperm have increased fertilizing ability and higher contents of sulfogalactosylglycerolipid and docosahexaenoic acid‐containing phosphatidylcholine compared to washed capacitated mouse sperm. Biol Reprod 2005; 72: 574–583. [DOI] [PubMed] [Google Scholar]
- 14. Iida N, Toida T, Kushi Y, Handa S, Fredman P, Svennerholm L, Ishizuka I: A sulfated glucosylceramide from rat kidney. J Biol Chem 1989; 264: 5974–5980. [PubMed] [Google Scholar]
- 15. Fiehn O, Wohlgemuth G, Scholz M, Kind T, Lee do Y, Lu Y, Moon S, Nikolau B. Quality control for plant metabolomics: reporting MSI‐compliant studies. Plant J 2008; 53: 691–704. [DOI] [PubMed] [Google Scholar]
- 16. Faull KF, Anderson PJ, Barchas JD, Berger PA. Selected ion monitoring assay for biogenic amine metabolites and probenecid in human lumbar cerebrospinal fluid. J Chromatogr Biomed Appl 1979; 163: 337–349. [DOI] [PubMed] [Google Scholar]
- 17. Pulfer M, Murphy RC. Electrospray mass spectrometry of phospholipids. Mass Spectrom Rev 2003; 22: 332–364. [DOI] [PubMed] [Google Scholar]
- 18. Hutchins PM, Moore EE, Murphy RC. Electrospray MS/MS reveals extensive and nonspecific oxidation of cholesterol esters in human peripheral vascular lesions. J Lipid Res 2011; 52: 2070–2083. [DOI] [PMC free article] [PubMed] [Google Scholar]
- 19. Leiker TJ, Barkley RM, Murphy RC. Analysis of diacylglycerol molecular species in cellular lipid extracts by normal‐phase LC‐electrospray mass spectrometry. Int J Mass Spectrom 2011; 305: 103–109. [DOI] [PMC free article] [PubMed] [Google Scholar]
- 20. Murphy RC, Leiker TJ, Barkley RM. Glycerolipid and cholesterol ester analyses in biological samples by mass spectrometry. Biochim Biophys Acta 2011; 1811: 776–783. [DOI] [PMC free article] [PubMed] [Google Scholar]
- 21. Hsu FF, Turk J. Characterization of phosphatidylinositol, phosphatidylinositol‐4‐phosphate, and phosphatidylinositol‐4,5‐bisphosphate by electrospray ionization tandem mass spectrometry: a mechanistic study. J Am Soc Mass Spectrom 2000; 11: 986–999. [DOI] [PubMed] [Google Scholar]
- 22. Gu M, Kerwin JL, Watts JD, Aebersold R. Ceramide profiling of complex lipid mixtures by electrospray ionization mass spectrometry. Anal Biochem 1997; 244: 347–356. [DOI] [PubMed] [Google Scholar]
- 23. Hsu FF, Turk J. Studies on phosphatidylserine by tandem quadrupole and multiple stage quadrupole ion‐trap mass spectrometry with electrospray ionization: structural characterization and the fragmentation processes. J Am Soc Mass Spectrom 2005; 16: 1510–1522. [DOI] [PubMed] [Google Scholar]
- 24. Murphy RC, Axelsen PH. Mass spectrometric analysis of long‐chain lipids. Mass Spectrom Rev 2011; 30: 579–599. [DOI] [PMC free article] [PubMed] [Google Scholar]
- 25. Hsu FF, Turk J. Electrospray ionization/tandem quadrupole mass spectrometric studies on phosphatidylcholines: the fragmentation processes. J Am Soc Mass Spectrom 2003; 14: 352–363. [DOI] [PubMed] [Google Scholar]
- 26. Brügger B, Erben G, Sandhoff R, Wieland FT, Lehmann WD. Quantitative analysis of biological membrane lipids at the low picomole level by nano‐electrospray ionization tandem mass spectrometry. Proc Natl Acad Sci 1997; 94: 2339–2344. [DOI] [PMC free article] [PubMed] [Google Scholar]
- 27. Hsu FF, Bohrer A, Turk J. Electrospray ionization tandem mass spectrometric analysis of sulfatide. Determination of fragmentation patterns and characterization of molecular species expressed in brain and in pancreatic islets. Biochimica et Biophysica Acta 1998; 1392: 202–216. [DOI] [PubMed] [Google Scholar]
- 28. Duffin K, Obukowicz M, Raz A, Shieh JJ. Electrospray/tandem mass spectrometry for quantitative analysis of lipid remodeling in essential fatty aciddeficient mice. Anal Biochem 2000; 279: 179–188. [DOI] [PubMed] [Google Scholar]
- 29. Do TQ, Moshkani S, Castillo P, Anunta S, Pogosyan A, Cheung A, Marbois B, Faull KF, Ernst W, Chiang SM, et al. Lipids including cholesteryl linoleate and cholesteryl arachidonate contribute to the inherent antibacterial activity of human nasal fluid. J Immunol 2008; 181: 4177–4187. [DOI] [PMC free article] [PubMed] [Google Scholar]
- 30. Hunt AN, Postle AD. Mass spectrometry determination of endonuclear phospholipid composition and dynamics. Methods 2006; 39: 104–111. [DOI] [PubMed] [Google Scholar]
- 31. Liebisch G, Drobnik W, Reil M, Trümbach B, Arnecke R, Olgemöller B, Roscher A, Schmitz G. Quantitative measurement of different ceramide species from crude cellular extracts by electrospray ionization tandem mass spectrometry (ESI‐MS/MS). J Lipid Res 1999; 40: 1539–1546. [PubMed] [Google Scholar]
- 32. Sherman WR, Ackermann KE, Bateman RH, Green BN, Lewis I. Mass‐analysed ion kinetic energy spectra and B1E‐B2 triple sector mass spectrometric analysis of phosphoinositides by fast atom bombardment. Biomed Mass Spectrom 1985; 8: 409–413. [DOI] [PubMed] [Google Scholar]
- 33. Marbois BM, Faull KF, Fluharty AL, Raval‐Fernandes S, Rome L. Analysis of sulfatide from rat cerebellum and multiple sclerosis white matter by negative ion electrospray mass spectrometry. Biochemica et Biophysica Acta 2000; 1484: 59–70. [DOI] [PubMed] [Google Scholar]
- 34. Kongmanas K, Xu H, Yaghoubian A, Franchini L, Panza L, Ronchetti F, Faull K, Tanphaichitr N. Seminolipid quantification by colorimetric assay and ESI‐LC‐MS/MS‐multiple reaction monitoring: compensation of seminolipid expression in Cgt+ /− mice. J Lipid Res 2010; 51: 3548–3558. [DOI] [PMC free article] [PubMed] [Google Scholar]
- 35. Bernhard W, Hoffmann S, Dombrowsky H, Rau GA, Kamlage A, Kappler M, Haitsma JJ, Freihorst J, von der Hardt H, Poets CF. Phosphatidylcholine Molecular Species in Lung Surfactant. Am J Resp Cell Mol Biol 2001; 25: 725–731. [DOI] [PubMed] [Google Scholar]
- 36. Vance JE, Tasseva G. Formation and function of phosphatidylserine and phosphatidylethanolamine in mammalian cells. Biochim Biophys Acta 2013; 1831: 543–554. [DOI] [PubMed] [Google Scholar]
- 37. Zemski Berry KA, Turner WW, VanNieuwenhze MS, Murphy RC. Characterization of oxidized phosphatidylethanolamine derived from RAW 264.7 cells using 4‐(Dimethylamino)benzoic acid derivatives. Eur J Mass Spectrom 2010; 16: 463–470. [DOI] [PMC free article] [PubMed] [Google Scholar]
- 38. Zemski Berry KA, Murphy RC J. Electrospray ionization tandem mass spectrometry of glycerophosphoethanolamine plasmalogen phospholipids. Am Soc Mass Spectrom 2004; 15: 1499–1508. [DOI] [PubMed] [Google Scholar]
- 39. Gardocki ME, Jani N, Lopes JM. Phosphatidylinositol biosynthesis: Biochemistry and regulation. Biochimica et Biophysica Acta 2005; 1735: 89–100. [DOI] [PubMed] [Google Scholar]
- 40. Takahashi T, Suzuki T. Role of sulfatide in normal and pathological cells and tissues. J Lipid Res 2012; 53: 1437–1450. [DOI] [PMC free article] [PubMed] [Google Scholar]