Abstract
♦ Background: The ability of urinary biomarkers to predict residual renal function (RRF) decline in peritoneal dialysis (PD) patients has not been defined. The present study aimed to explore the utility of established biomarkers from kidney injury models for predicting loss of RRF in incident PD patients, and to evaluate the impact on RRF of using neutral-pH PD solution low in glucose degradation products.
♦ Methods: The study included 50 randomly selected participants from the balANZ trial who had completed 24 months of follow-up. A change in glomerular filtration rate (GFR) was used as the primary clinical outcome measure. In a mixed-effects general linear model, baseline measurements of 18 novel urinary biomarkers and albumin were used to predict GFR change. The model was further used to evaluate the impact of biocompatible PD solution on RRF, adjusted for each biomarker.
♦ Results: Baseline albuminuria was not a useful predictor of change in RRF in PD patients (p = 0.84). Only clusterin was a significant predictor of GFR decline in the whole population (p = 0.04, adjusted for baseline GFR and albuminuria). However, the relationship was no longer apparent when albuminuria was removed from the model (p = 0.31). When the effect of the administered PD solutions was examined using a model adjusted for PD solution type, baseline albuminuria, and GFR, higher baseline urinary concentrations of trefoil factor 3 (TFF3, p = 0.02), kidney injury molecule 1 (KIM-1, p = 0.04), and interferon γ-induced protein 10 (IP-10, p = 0.03) were associated with more rapid decline of RRF in patients receiving conventional PD solution compared with biocompatible PD solution.
♦ Conclusions: Higher urinary levels of kidney injury biomarkers (TFF3, KIM-1, IP-10) at baseline predicted significantly slower RRF decline in patients receiving biocompatible PD solutions. Findings from the present investigation should help to guide future studies to validate the utility of urinary biomarkers as tools to predict RRF decline in PD patients.
Keywords: Biocompatibility, biomarkers, glucose degradation products, kidney injury, residual renal function
Residual renal function (RRF) is a powerful prognostic indicator in patients with end-stage kidney disease (1). Preservation of RRF, especially in the setting of peritoneal injury, is vital in peritoneal dialysis (PD) patients with higher peritoneal membrane transport characteristics, in whom reductions in ultrafiltration capacity and small-solute clearance can lead to volume overload and inadequate clearance. In spite of the paramount significance of RRF, reliable tools to predict RRF loss or preservation in PD patients are lacking.
Of numerous causes that can potentially lead to a loss of RRF, glucose degradation products (GDPs) in PD solutions have been shown to promote nephrotoxicity through enhanced renal tubular epithelial cell apoptosis (2). It is therefore biologically plausible that the use of “biocompatible” PD solutions low in GDP content might improve preservation of RRF, as suggested in a recent systematic review (3,4). However, a number of the studies analyzed were limited by a single-center setting (5–8), cross-over design (7,9–12), or large (>20%) drop-out rate (5,6,10,13–18) and by inclusion of prevalent patients, thus introducing Neyman bias (5,7,9–11,16,19–21). Using biomarkers of kidney injury to better understand the underlying mechanistic pathways might help to identify predictors of a direct benefit of biocompatible solutions in the preservation of RRF. Further, biomarkers might serve as a tool to identify patients at higher risk of RRF loss and thereby assist in stratifying patients according to risk.
The aims of the present study were to explore the utility of using defined biomarkers from kidney injury models to predict loss of RRF in incident PD patients, and to evaluate the effect of using neutral-pH PD solutions low in GDPs by measuring baseline biomarker concentrations for participants in the balANZ trial (22).
Methods
Study Design
A detailed description of the study design and methodology has previously been published (23), as have the results of the main primary and secondary analyses (22,24,25). The trial was registered with the Australian New Zealand Clinical Trials Registry (ACTRN12606000044527). The study protocol was approved by the ethics committees at all participating centers. All patients provided written informed consent before trial participation, including consent to biomarker studies using stored samples. Adult incident PD patients who had both a measured residual glomerular filtration rate (GFR) of 5 mL/min/1.73 m2 or more and a measured daily urine volume of 400 mL or more at enrolment were included in the study. Pregnant or breastfeeding patients, individuals expected to die within 12 months, patients participating in trials targeting RRF in PD, or those with a significant cancer history in the preceding 5 years, acute infection at enrolment, contraindications to PD, any physical or mental disorder that appreciably hampered study protocol compliance, or known or suspected allergy to the trial products or related products were excluded. Of the 79 participants of the balANZ trial who had completed 24 months of follow-up, 50 participants [25 using Balance (Fresenius Medical Care Australia, Milsons Point, NSW, Australia) and 25 using Stay•Safe (Fresenius Medical Care Australia)] were randomly selected using a computer-generated randomization technique prepared by Statistical Revelations Pty Ltd. (http://www.statisticalrevelations.com.au/).
Study Outcomes
Clinical Outcomes: The primary outcome measure was change in GFR from baseline to month 12 and to month 24, calculated as a 12-month value-baseline GFR or a 24-month value-baseline GFR respectively. The GFR measurement used the arithmetic mean of 24-hour urinary urea and creatinine clearances at 0, 12, and 24 months.
Biomarker Assays: Urine samples were collected at the baseline visit. Urine was immediately stored at -80°C and thawed once only during the aliquoting process before analysis. Urinary markers of kidney injury were measured using an electrochemiluminescence immunoassay technique according to the manufacturer’s protocols after samples had been centrifuged at 500g for 5 minutes. The 96-well plates measuring alpha-glutathione S-transferase, calbindin, clusterin, cystatin, epidermal growth factor, interferon γ-induced protein 10 (IP-10), kidney injury molecule 1 (KIM-1), macrophage migration inhibitory factor, monokine-induced gamma interferon, neutrophil gelatinase lipocalin, osteoactivin, osteopontin, π-glutathione S-transferase, retinol binding protein 4, tissue inhibitor of metalloproteinase 1, trefoil factor 3 (TFF3), vascular endothelial growth factor, and uromodulin (Meso Scale Discovery, Gaithersburg, MD, USA) were analyzed on a Sector Imager 6000 (Meso Scale Discovery). Samples and standards were analyzed in duplicate with a maximum tolerated coefficient of variation of 20%. No inter-assay coefficient of variation was determined, because all samples from an individual were run at the same time to minimize inter-assay variability. Urinary albumin and isotope dilution mass spectrometry-traceable creatinine were measured using the turbidimetric and Jaffe methods respectively (Beckman Coulter, Brea, CA, USA).
Statistical Analyses
Results are expressed as frequencies and percentages for categorical variables, mean ± standard deviation for continuous normally distributed variables, and median with interquartile range for continuous non-normally distributed variables. Differences between groups were analyzed using the chi-square test for categorical data, the t-test for continuous normally distributed data, and the Mann-Whitney U-test for continuous non-normally distributed data. To compare this selected cohort with the main balANZ trial participants (22), the slope of RRF decline over time was initially fitted using identical mixed-effects general linear models including treatment group, time, center, presence or absence of diabetic nephropathy, and PD modality (automated vs continuous ambulatory) as fixed-effects terms (model 1).
The kidney injury biomarkers were normalized to urinary creatinine concentration (in millimoles per liter) for all analyses other than the baseline descriptive analysis. The data were log-transformed because of non-normal distribution. As a consequence of transformation, relative differences and changes were considered in the present investigation. The relationships of each biomarker with age, sex, and diabetic nephropathy status were explored using a linear regression model. If a p value was less than 0.2 during univariate analysis, the relevant covariate was included in the multivariable model. To evaluate the relationship between each biomarker and change in RRF, a mixed-effects general linear model was fitted, including baseline biomarker, baseline GFR, time (that is, 12 or 24 months) as fixed-effects terms and then all the two-way interactions (model 2).
To examine the effect of treatment, PD solution (biocompatible or standard) was added in the model as a fixed-effect term and as three-way interactions (model 3). The three-way interaction was used to capture any differences in outcome between the PD solution types with respect to the relationship between the baseline biomarker and the change from baseline GFR for each time point. The repeated measures nature of the data was taken into account by fitting the patient identification number as a “random” term and allowing the intercept and time coefficient to vary by subject.
All analyses were performed with adjustment for albuminuria, defined as albumin:creatinine. Because of a small number of observations, the number of covariates in models 2 and 3 had to be restricted to avoid imbalance and could not incorporate center, diabetic nephropathy status, or PD modality.
To explore the relationship between peritonitis and change in GFR, model 2 was applied, and peritonitis events were included as a time-varying covariate with the fixed effects instead of as a baseline biomarker. Data were analyzed by Statistical Revelations and using Stata/SE 12.1 (StataCorp LP, College Station, TX, USA). A value of p < 0.05 was considered significant.
Results
Patient Characteristics
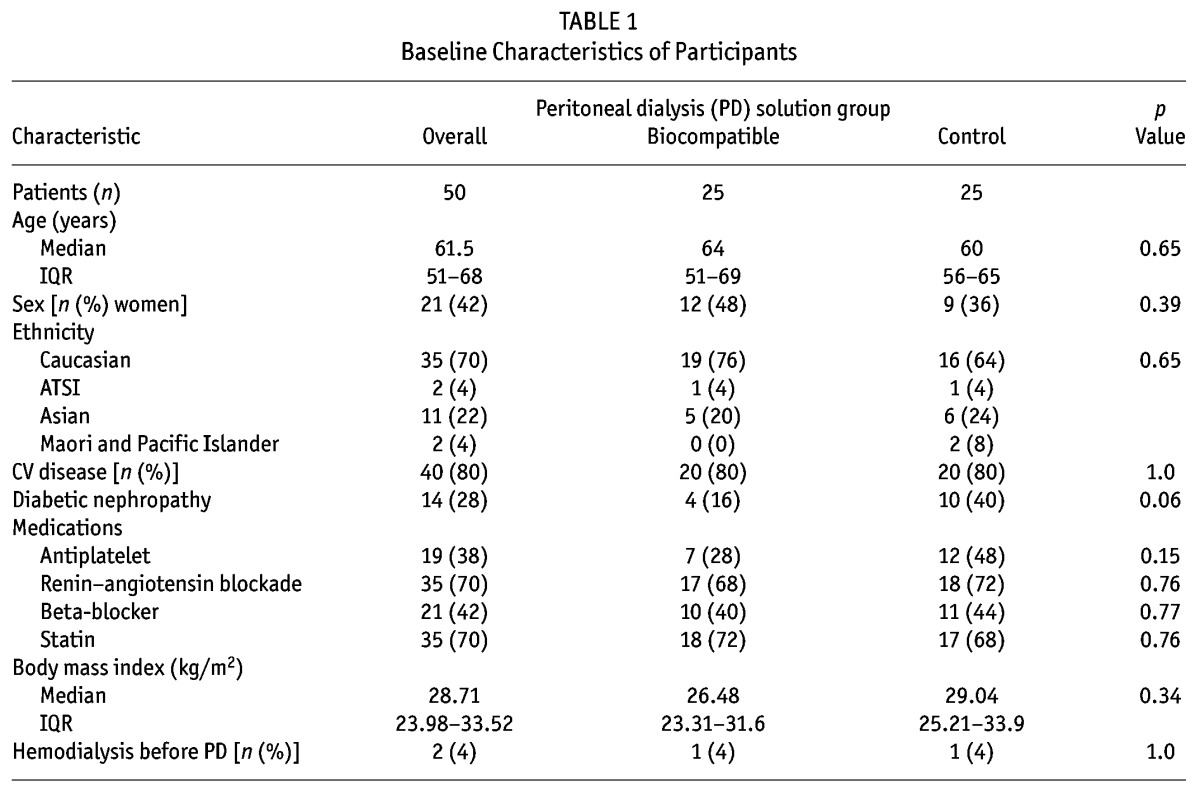
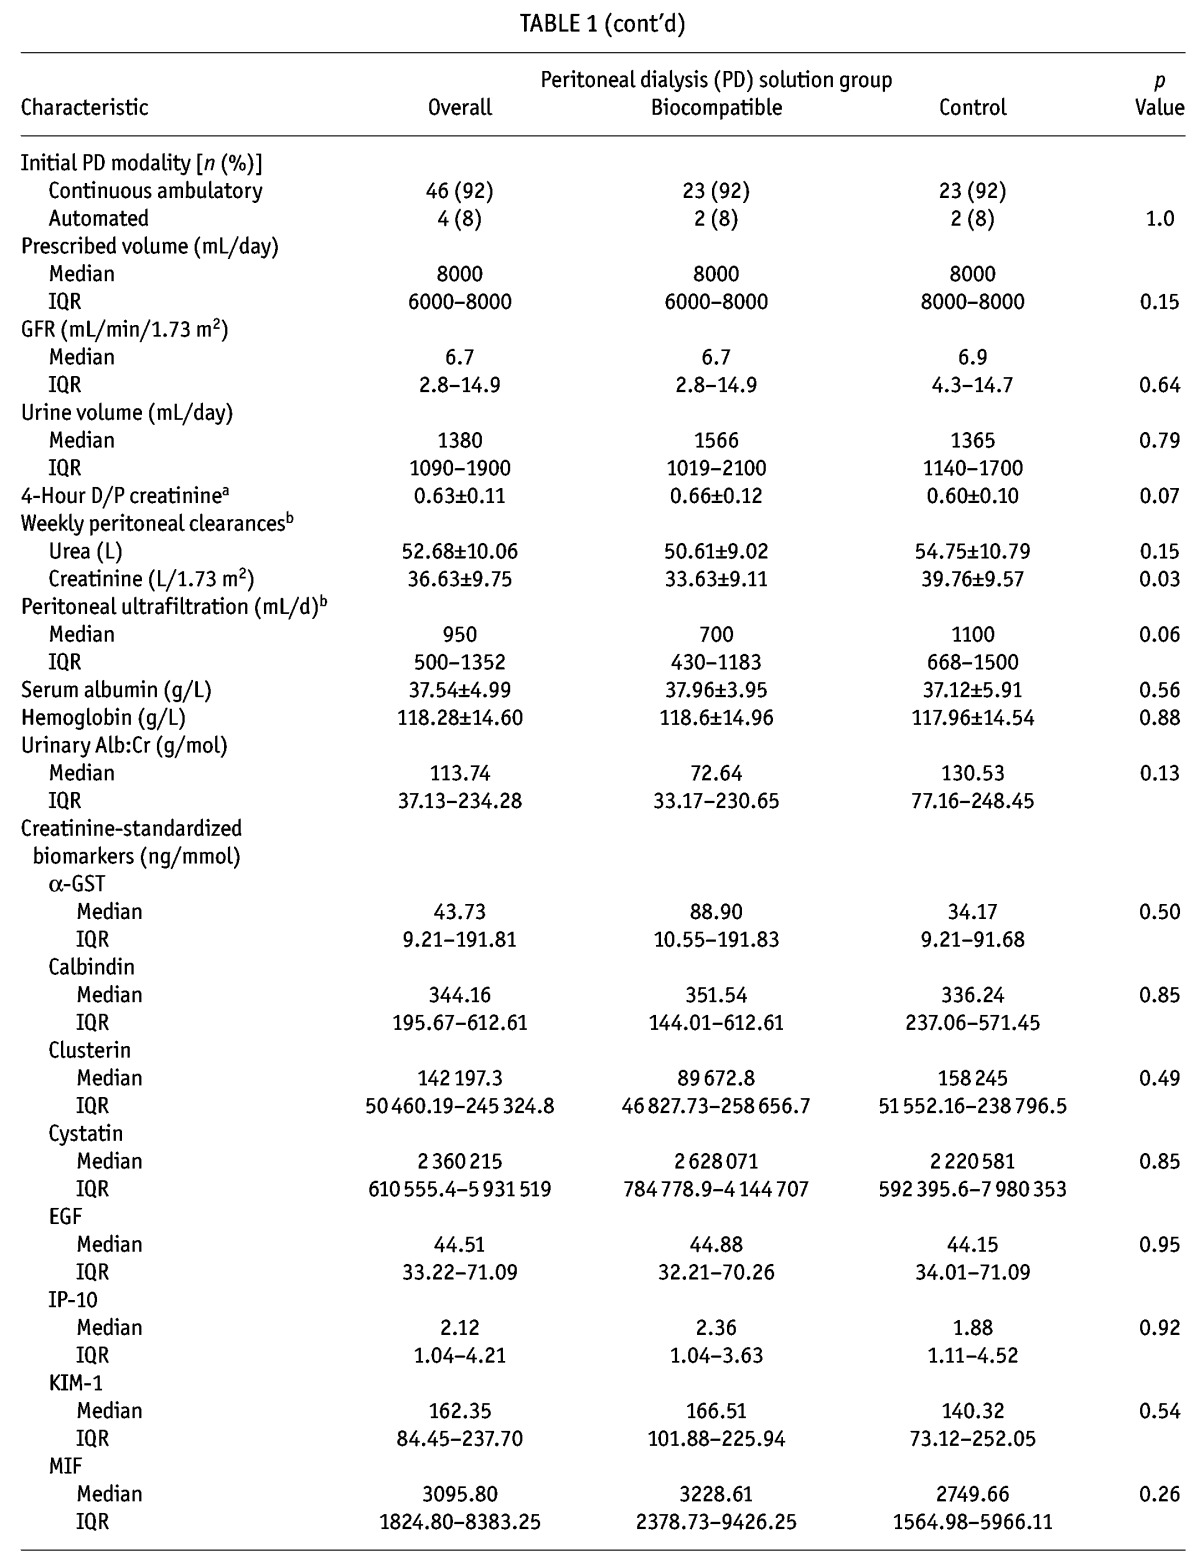
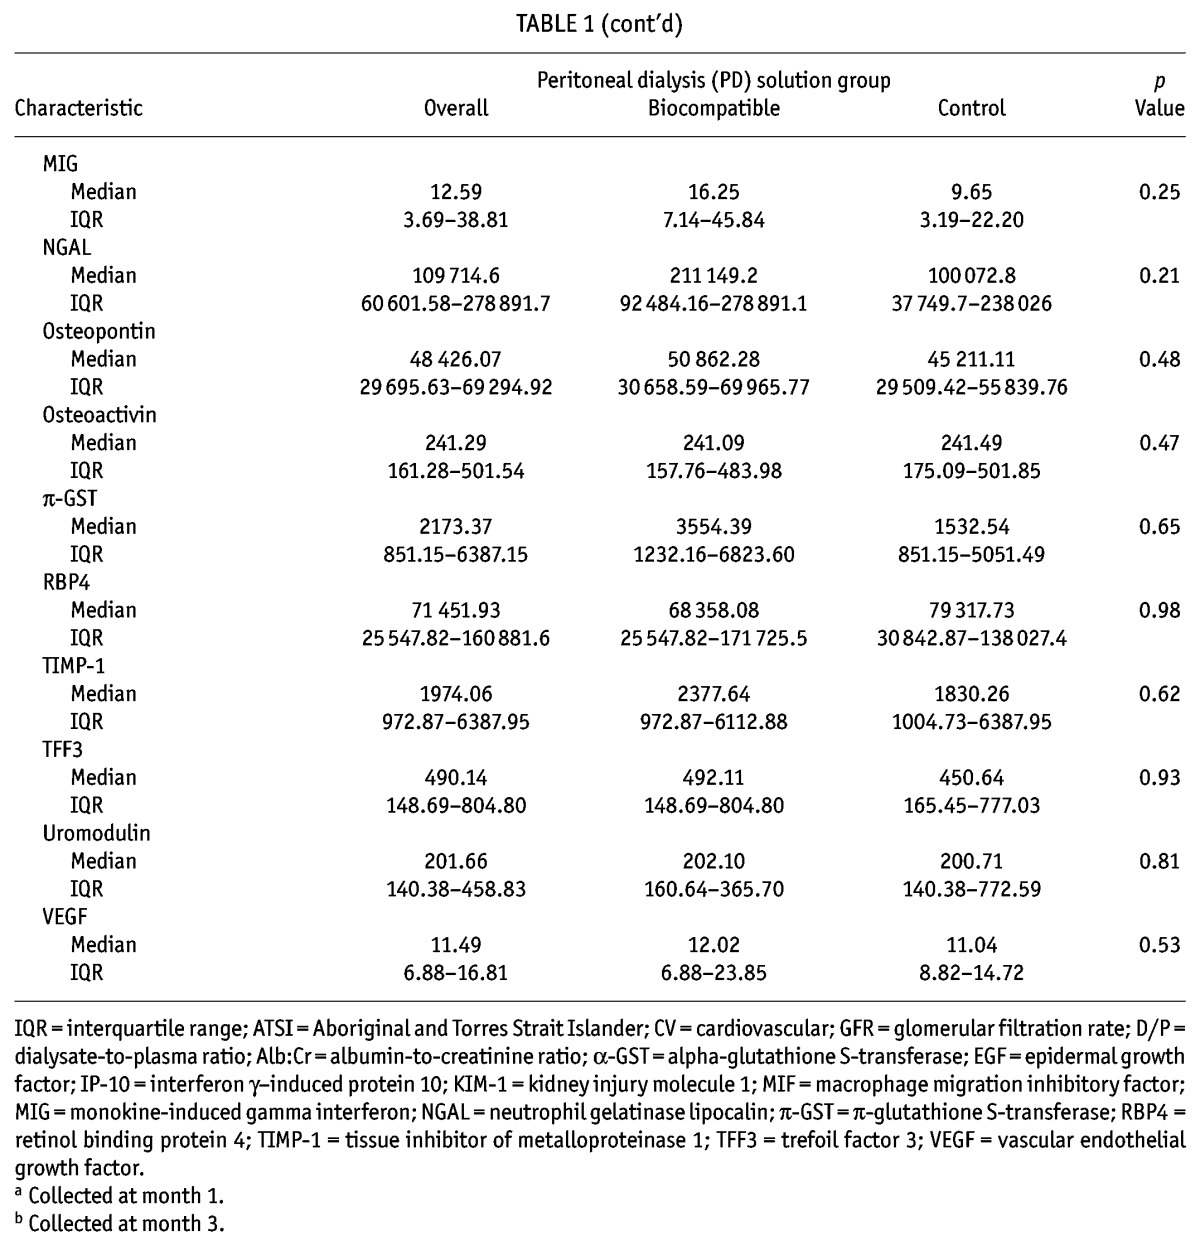
The patients were well matched for all baseline characteristics except peritoneal creatinine clearance at 3 months, which was significantly higher in the control patients (Table 1). No consistent relationships were observed for each biomarker with patient-level clinical data (age, sex, diabetic nephropathy; supplementary Table 1). However, the number of peritonitis episodes were discrepant between the biocompatible group patients (5 episodes in 3 patients) and the control group patients (20 episodes in 12 patients, p = 0.005).
TABLE 1.
Baseline Characteristics of Participants
RRF Decline
The monthly rates of GFR change (model 1) in the treatment and control groups were -0.18 mL/min/1.73 m2 and -0.30 mL/min/1.73 m2 respectively in the first year (0.12 mL/min/1.73 m2 difference; 95% confidence interval: -0.02 to 0.26 mL/min/1.73 m2; p = 0.08) and -0.12 mL/min/1.73 m2 and -0.07 mL/min/1.73 m2 respectively in the second year (-0.05 mL/min/1.73 m2 difference; 95% confidence interval: -0.13 to 0.03 mL/min/1.73 m2; p = 0.19). The differences in RRF decline between the solution groups during the 24-month period were not statistically significant (p = 0.37), and rates of change within each year were similar for both treatments. Patients with a higher baseline GFR were more likely to experience larger changes in GFR (p < 0.001), such that for every 1 mL/min/1.73 m2 increase in baseline GFR, patients could expect a decline in GFR of 0.55 mL/min/1.73 m2 at 2 years (for example, patients with a baseline GFR of 10 mL/min/1.73 m2 might reach a GFR of 4.5 mL/min/1.73 m2 at 2 years). Although the two-way interaction term between peritonitis episodes and PD solution was not statistically significant (p = 0.07), the foregoing results suggest the possible presence of a differing relationship between peritonitis episodes and change in GFR according to the type of PD solution received over time. The nature of the interaction was further explored, but showed no strong evidence of an association between peritonitis episodes and change in GFR for the biocompatible (p = 0.47) and standard (p = 0.10) solution groups.
Kidney Injury Biomarkers as Predictors of Overall RRF Decline
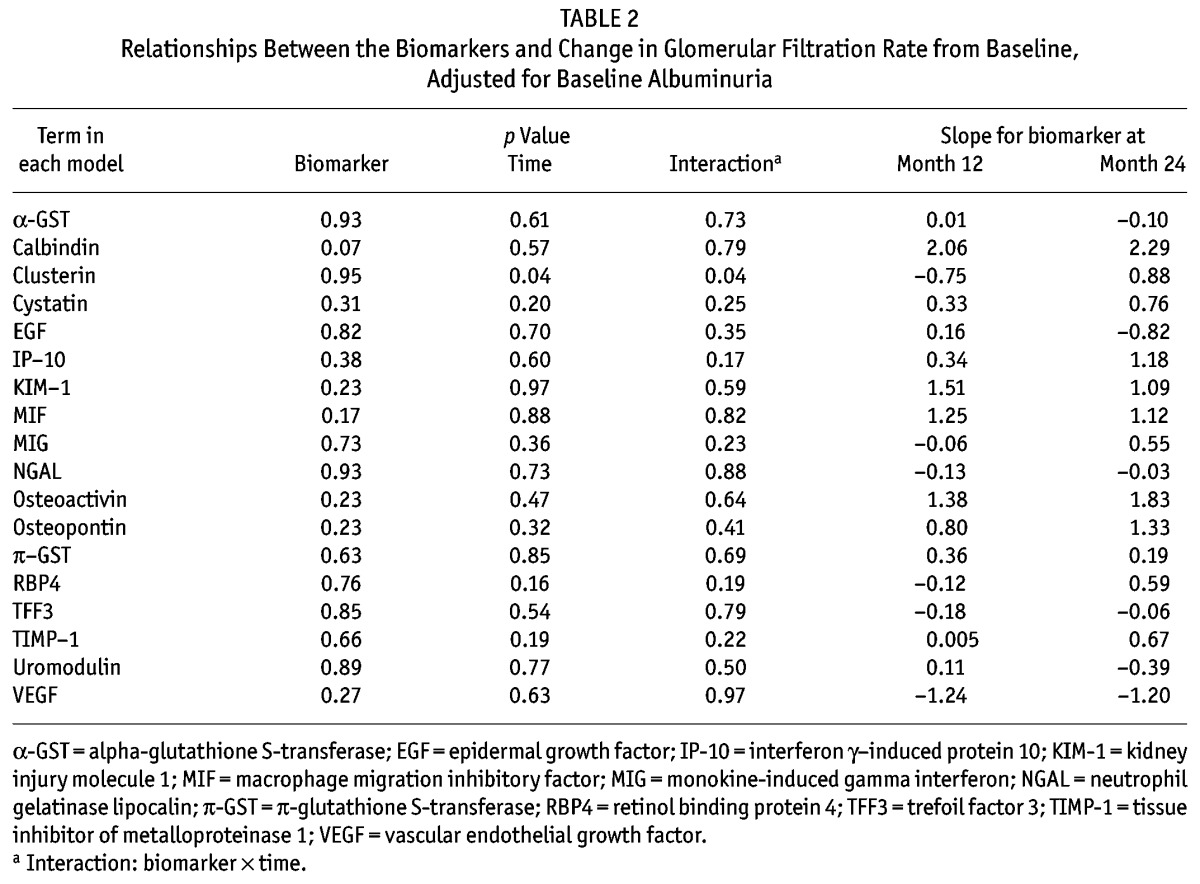
Concentrations of kidney injury biomarkers were comparable between the treatment and control groups at baseline (Table 1 and supplementary Table 2). On its own, baseline albuminuria did not predict change in GFR (p = 0.84, Figure 1). Of eighteen “novel” biomarkers examined, only clusterin was a significant predictor of GFR decline (p = 0.04, model 2; Table 2), independent of PD solution. However, the nature of the relationship between clusterin and RRF differed at month 12 and month 24 (p = 0.04, supplemental Figure 1), which might have been influenced by a differential effect of baseline albuminuria (p = 0.08). The relationship was no longer present if albuminuria was removed from the model (p = 0.31, supplemental Figure 2).
Figure 1 —
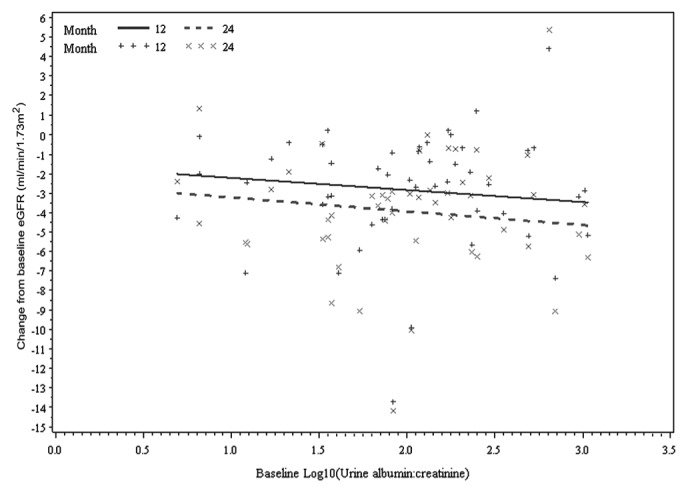
Relationship between change from baseline estimated glomerular filtration rate (eGFR) and baseline albuminuria by time, adjusted for baseline eGFR at months 12 and 24 (p = 0.84).
TABLE 2.
Relationships Between the Biomarkers and Change in Glomerular Filtration Rate from Baseline, Adjusted for Baseline Albuminuria
Kidney Injury Biomarkers as Predictors of RRF Decline in Response to Biocompatible Compared with Conventional PD Solutions
As in the findings from the model 2 analysis, baseline albuminuria was not predictive of GFR change after adjustment for treatment effect (p = 0.28). When the effect of PD solution type on GFR change was examined separately for each biomarker (model 3), three biomarkers (TFF3, IP-10, KIM-1) were identified to be significant predictors of GFR change. However, there were some differences in the nature of the relationship between each biomarker and GFR change over time. First, the three-way interaction of TFF3 was significant, which suggests the presence of a differing relationship between baseline TFF3 and change in GFR according to the type of PD solution received over time (p = 0.02, Table 3). The slopes of the change from baseline GFR at 12 months and 24 months for baseline TFF3 were +0.51 mL/min/1.73 m2 and +1.37 mL/min/1.73 m2 for the treatment group, and -1.58 mL/min/1.73 m2 and -2.51 mL/min/1.73 m2 for the control group (Figure 2). In contrast, IP-10 and KIM-1 were associated with GFR change for type of treatment received (p = 0.03 and p = 0.04 respectively); however, their relationship did not change over time (p = 0.88 and p = 0.22 respectively). For example, the slopes of the change from baseline GFR at 12 and 24 months for IP-10 were +3.71 mL/min/1.73 m2 and +4.52 mL/min/1.73 m2 for the treatment group and -0.88 mL/min/1.73 m2 and +0.11 mL/min/1.73 m2 for the control group (Figure 3). Findings were similar for KIM-1 (Figure 4). Furthermore, even after accounting for interaction terms, there was still a significant difference in GFR change for KIM-1 between the treatment and control groups, possibly suggesting a residual effect of PD solution received even after accounting for the interactions (p = 0.03). None of the other biomarkers demonstrated any association with change in GFR for the treatment received over time.
TABLE 3.
Relationship Between the Biomarkers and Change in Glomerular Filtration Rate from Baseline and Peritoneal Dialysis (PD) Solution Type, Adjusted for Baseline Albuminuria
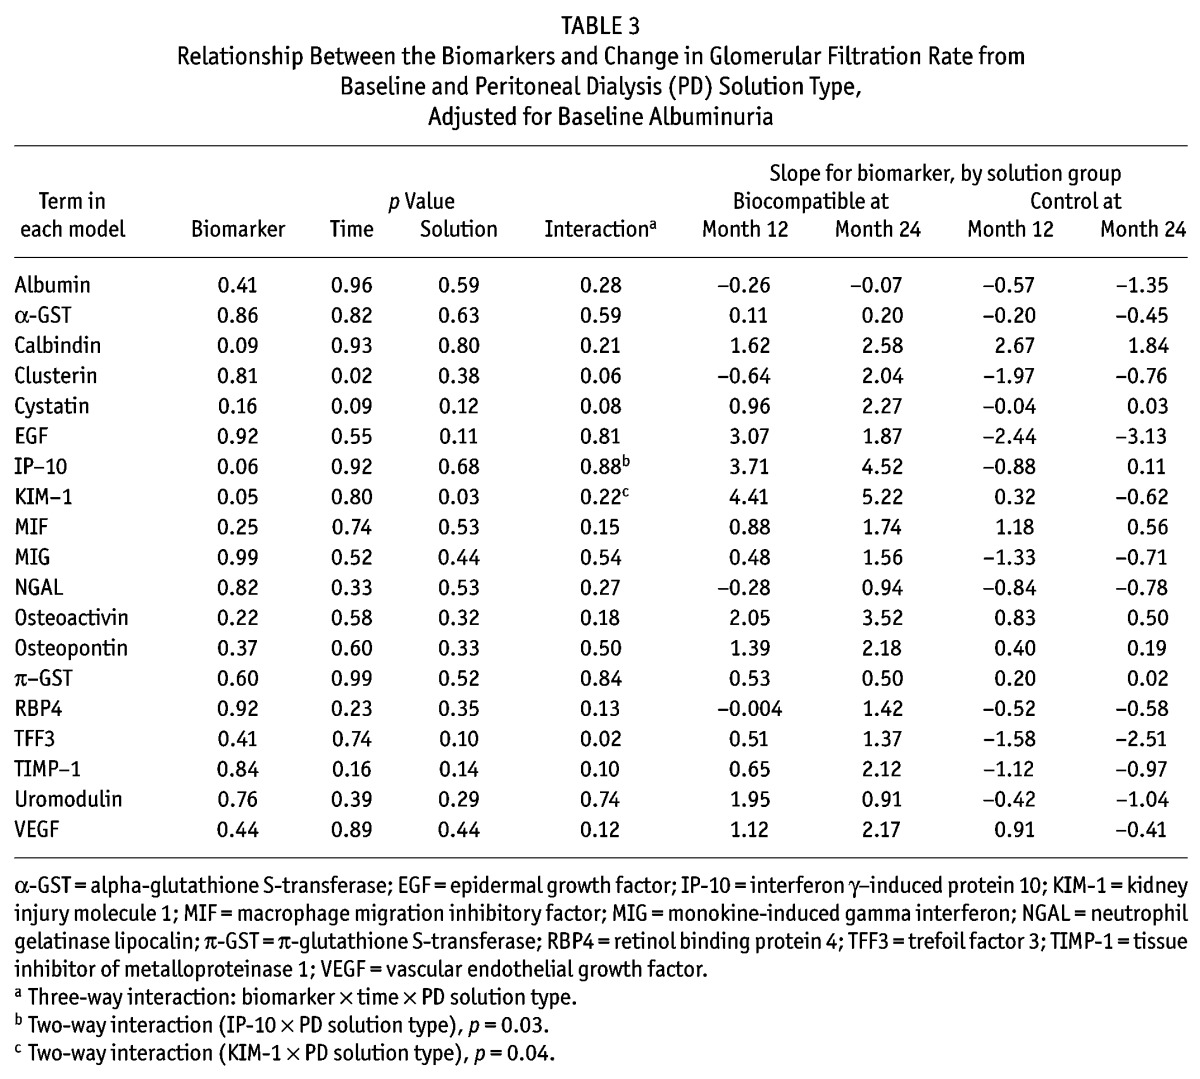
Figure 2 —
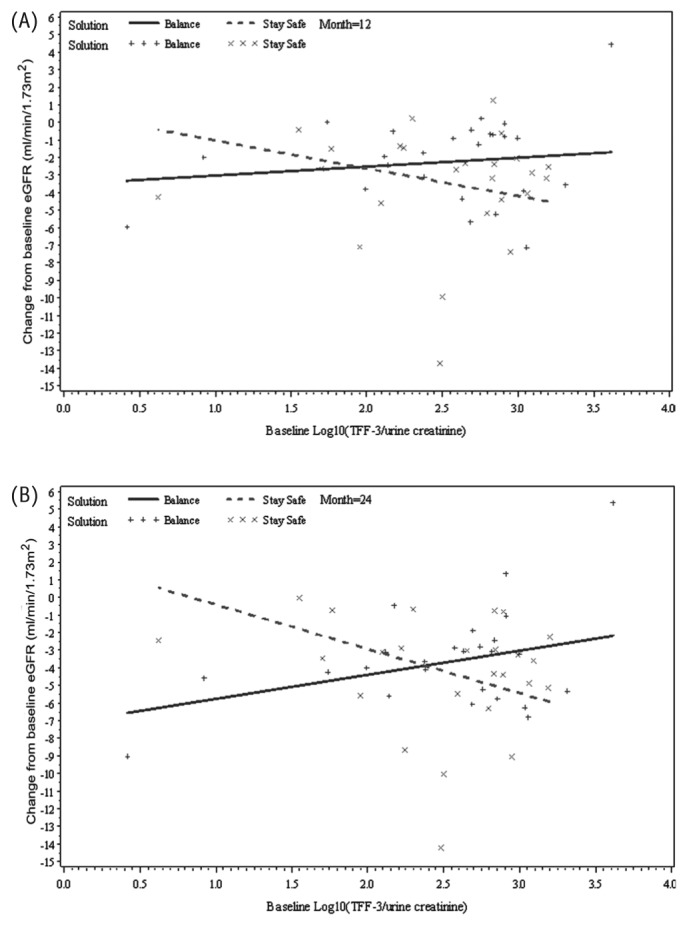
Relationship between change from baseline estimated glomerular filtration rate (eGFR) and baseline trefoil factor 3 (TFF3) by time and peritoneal dialysis solution type (Balance, Stay•Safe: Fresenius Medical Care, Sydney, Australia), adjusted for baseline eGFR and baseline albuminuria at (A) month 12 and (B) month 24 (p = 0.02).
Figure 3 —
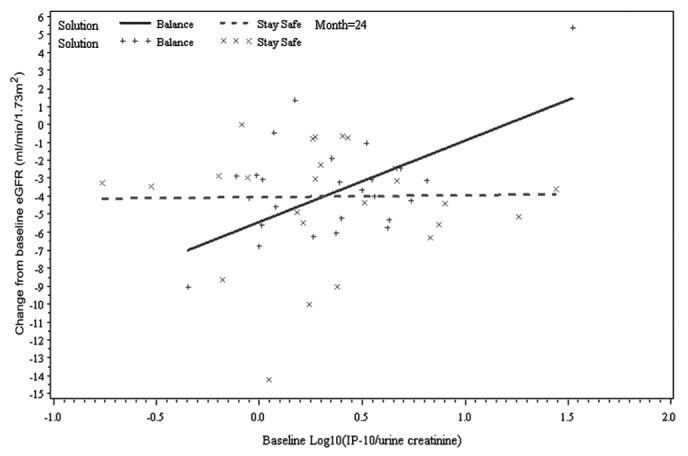
Relationship between change from baseline estimated glomerular filtration rate (eGFR) and baseline interferon γ-induced protein 10 (IP-10) by time and peritoneal dialysis solution type (Balance, Stay•Safe: Fresenius Medical Care, Sydney, Australia), adjusted for baseline eGFR and baseline albuminuria at month 24 (two-way interaction: IP-10 × solution type; p = 0.03).
Figure 4 —
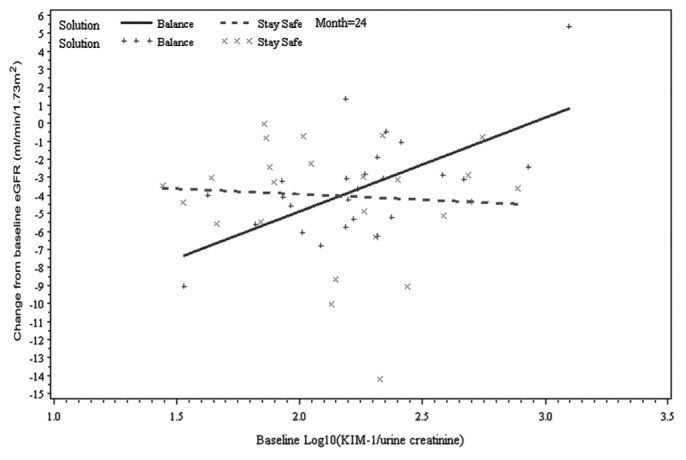
Relationship between change from baseline estimated glomerular filtration rate (eGFR) and baseline kidney injury molecule 1 (KIM-1) by time and peritoneal dialysis solution type (Balance, Stay•Safe: Fresenius Medical Care, Sydney, Australia), adjusted for baseline eGFR and baseline albuminuria at month 24 (two-way interaction: KIM-1 × solution type; p = 0.04).
A sensitivity analysis was performed for the urinary biomarkers that showed significant differences between the biocompatible and standard solution types (IP-10, KIM-1, TFF3). In that analysis, an outlier patient from the biocompatible group who appeared to experience improved RRF over time (gain of 5.4 mL/min/1.73 m2 by month 24) was excluded. Although the direction of the slopes remained unchanged for all three biomarkers (supplementary Table 3), the results pertaining to IP-10 (p = 0.32; supplementary Figure 3) and KIM-1 (p = 0.21; supplementary Figure 4) no longer reached the level of statistical significance. The marker TFF3 remained a significant predictor of slower RRF decline in patients receiving biocompatible solutions (p = 0.047; supplementary Figure 5).
Discussion
The present investigation is the first to explore the ability of a large number of kidney injury biomarkers to predict RRF loss and the first to evaluate the effect of biocompatible solutions on those markers in incident PD patients. In contrast to its utility in patients with chronic kidney disease (CKD), albuminuria was not a useful predictor of RRF change in PD patients. Only baseline clusterin concentration demonstrated a significant relationship with change in RRF independent of the type of PD solution received. When the effect of the PD solutions was examined (conventional vs biocompatible), higher urinary concentrations of TFF3, KIM-1, and IP-10 at baseline were associated with more rapid RRF decline in patients receiving conventional PD solutions. After exclusion of an outlier, sensitivity analysis yielded significant results only for urinary TFF3.
A number of studies have consistently reported that albuminuria and proteinuria strongly and independently predict progression of CKD (26–28). However, their impact on RRF in PD patients remain elusive. Kang and colleagues (29) reported an adverse impact of heavy proteinuria on RRF decline in incident PD patients. However, theirs was a single-center retrospective observational study, with significant disparity in baseline characteristics of the patients, who were stratified according to baseline 24-hour proteinuria (group A: <500 mg; group B: 500 – 3500 mg; group C: >3500 mg), leading to a higher proportion of patients with diabetic nephropathy being allocated to group C compared with group A (76.5% vs 28.6%, p < 0.001). Although the multivariate linear regression analysis identified proteinuria as a significant predictor of RRF decline (p < 0.001), the model did not appear to be adjusted for diabetic nephropathy. Moreover, a prospective cohort study of 242 incident PD patients did not identify 24-hour proteinuria as an independent predictor of RRF decline in a multivariate analysis (30). Similarly, the present study did not observe baseline albuminuria to be a useful predictor of RRF decline. Discrepant findings in PD patients compared with CKD patients might stem from the presence of additional diverse potential causes of RRF decline in dialysis patients (for example, GDP-related tubular epithelial cell apoptosis), with the contribution from tubular injury possibly being of greater importance than that from glomerular pathology (represented by albuminuria).
In contrast, urinary clusterin was able to predict RRF decline independent of the PD solution received. Clusterin is a 75 – 80 kDa disulfide-linked heterodimeric protein involved in cell adhesion, tissue remodeling, cell-cycle regulation, apoptosis, and DNA repair. Its molecular size prevents its filtration in the kidney (that is, urinary levels are specific to kidney injury), and increased urinary levels have been reported after renal ischemia or exposure to various nephrotoxins (cisplatin, for instance), presumed to represent damage to the proximal and distal tubules (31–33). However, it is difficult to ascertain the cause of the opposing relationship between clusterin and GFR change at 12 and 24 months. Apart from appearing biologically implausible, the association was no longer present when albuminuria was removed from the model, thereby raising the strong possibility of a type I statistical error rather than a true association. In addition, when an attempt was made to examine the effect of PD solution type, no difference according to the type of PD solution received was identified.
Nonetheless, three other biomarkers demonstrated differing relationships with change in RRF over time depending on the type of PD solution received. One of those markers was TFF3, and in contrast to KIM-1 and IP-10, its effect on change in GFR by PD solution type increased with longer duration of follow-up, as evidenced by differences in the slopes of the treatment and control groups at months 12 and 24 (2.09 mL/min/1.73 m2 vs 3.88 mL/min/1.73 m2 by baseline TFF3). Greater decline in GFR for a given baseline level of TFF3 was evident in the control group, but was not observed in the treatment group. Trefoil factors are produced throughout the renal tract, with TFF3 predominating in cells of the proximal and distal tubules and collecting duct (34). These factors are thought to be responsible for renal regeneration after an injury. In a rat model of drug toxicity, urinary TFF3 levels were significantly depressed after an exposure to toxic drugs (for example, cisplatin, gentamicin) for 2 weeks (35). Knowledge about TFF3 in humans is very limited, and reported findings differ from the results of preclinical studies. For example, the post hoc matched case-control study of the Atherosclerosis Risk in Communities study reported an association between higher urinary TFF3 and incident CKD (defined as development of an estimated GFR < 60 mL/min/1.73 m2 and a decrease of ≥25% in estimated GFR from baseline to follow-up) over a median follow-up of 8.6 years (36). That association persisted even after adjusting for CKD risk factors (adjusted odds ratio: 1.35; 95% confidence interval: 1.11 to 1.64). Similarly, the present study observed a higher risk of RRF decline with greater baseline urinary TFF3, which was lessened in patients treated with biocompatible PD solution. The apparent disparity in findings compared with the rat model studies might relate to species heterogeneity or to differences in the nature of the injury state (acute vs chronic). In the absence of data from a well-designed clinical trial primarily examining the effect of urinary TFF3 on renal outcomes in humans, the findings of the present study should be considered hypothesis-generating.
Like TFF3, KIM-1 is a biomarker that represents renal tubular damage. In the normal kidney, KIM-1 is not expressed; it undergoes marked upregulation and insertion into the apical membrane of the proximal tubule in response to renal injury to confer phagocytic capacity to clear cell debris (37). Although most of the experience concerning the role of KIM-1 in predicting renal injury comes from an acute kidney injury model, elevated urinary levels have been associated with graft loss after renal transplantation (38). In contrast, Bhavsar and colleagues (39), in their matched case-control post hoc analysis of the Atherosclerosis Risk in Communities and the Atherosclerosis Risk in Communities carotid magnetic resonance imaging studies did not identify baseline urinary KIM-1 as a useful predictor of incident CKD in patients who had normal renal function at study commencement. To date, no other study has examined the utility of KIM-1 in predicting renal outcome in dialysis patients. In the context of these diverse findings in various patient populations, additional studies to better examine the utility of KIM-1 for predicting RRF should be performed.
Lastly, IP-10, unlike KIM-1, has a predominantly immunomodulatory function. It is a potent chemotactic factor for T lymphocytes and has been shown to promote endothelial microvascular injury in a rat model (40). Although its utility has not been examined in dialysis patients, higher levels of urinary IP-10 have been associated with greater decline in renal function in patients with diabetic nephropathy (41). Moreover, higher early post-transplant IP-10 concentrations in urine have been associated with worse short- and long-term graft function after renal transplantation (42).
Nonetheless, after exclusion of an outlier, sensitivity analyses found that results for IP-10 and KIM-1 no longer reached the level of statistical significance. Although the consistent direction of the slopes in the outcomes of the sensitivity analyses are reassuring, the results obtained should be interpreted with caution given the significant influence that one subject had on the results.
The findings from this study are unique, because the utility of biomarkers of kidney injury in PD patients has not been previously explored. The reported outcomes are strengthened by measurement of the largest number of “novel” and traditional biomarkers from comprehensively described, truly incident PD patients from a multicenter multinational randomized controlled trial.
However, the conclusions that can be drawn from this study are challenged by several limitations. First, to examine the effect of biomarkers on RRF, a subgroup of patients who had completed 24 months of follow-up, including all measurements of GFR, were selected. That approach might inadvertently have introduced selection bias, thereby decreasing the sensitivity of the biomarkers examined by excluding patients who experienced faster loss of RRF and who became anuric before 24 months. The findings are further compromised by the resultant smaller sample size, which also constrained the ability to adjust for covariates as in the main balANZ trial (22). The adjustment for center effect might have been particularly relevant, because the samples might have been handled differently depending on the treating center, introducing the risk of pre-analytical variation. Although the analysis did not observe significant association between peritonitis and change in GFR, that result might have been limited by the small sample of the full cohort, given that it is biologically plausible that more frequent episodes of peritonitis might have negatively influenced RRF. Second, the biomarkers were measured only in urine, without correlation with serum concentrations. However, as mentioned earlier, some biomarkers—for example, clusterin—are not normally filtered by the glomerulus; urinary levels are therefore specific to kidney injury. Third, when adjusted for albuminuria, the opposing relationship between baseline clusterin and GFR change at months 12 and 24 raises concern about the possibility of a type I statistical error potentially resulting from the examination of a large number of biomarkers.
Nonetheless, the aim of the present study was to explore the utility of a large number of biomarkers and thus to provide information that could guide future studies of more “ideal” biomarkers to examine in detail in incident PD patients. The prospective utility of biomarkers in PD patients is attractive, especially because traditional markers of renal injury such as albuminuria have been inconsistently reported as useful predictors of RRF loss. Moreover, the potential benefit of biocompatible PD solutions compared with conventional PD solutions at the given baseline levels of the biomarkers (that is, KIM-1, TFF3, IP-10) indicate their possible use for targeted implementation of treatment using biocompatible PD solutions.
Conclusions
The traditional urinary biomarker albuminuria was not a useful predictor of RRF loss in incident PD patients. In contrast, higher urinary levels of the kidney injury biomarkers TFF3, KIM-1, and IP-10 at baseline predicted significantly slower RRF decline in patients receiving biocompatible PD solution than in those receiving standard PD solution. The present study is the first to examine the utility of both traditional and “novel” urinary biomarkers of kidney injury in predicting RRF loss in incident PD patients and the first to demonstrate differences in clinical outcome according to baseline biomarker levels in groups of patients using different PD solutions. Although definitive evidence was not provided, the findings of this study should help to guide future studies.
Disclosures
DWJ is a consultant for Baxter Healthcare Pty Ltd. and has previously received research funds from that company. He has also received speakers’ honoraria and research grants from Fresenius Medical Care. He has previously been a consultant to Gambro Pty Ltd. He is an International Society of Peritoneal Dialysis Councilor and a current recipient of a Queensland Government Health Research Fellowship. YC is a current recipient of an Australian Postgraduate Award and is a recipient of 2012 Jacquot Research Entry Scholarship. CMH has received research grants from Baxter Healthcare Pty Ltd. and Gambro Pty Ltd., and has been a consultant to Fresenius Medical Care. MC is an employee of Fresenius Medical Care.
Acknowledgments
The invaluable assistance provided by Caro Badcock from Statistical Revelations Pty Ltd. with respect to all statistical analyses and the advice and assistance of Drs. Sabine Lange and Goce Dimeski are gratefully acknowledged. This biomarker sub-study of the balANZ trial was funded by Fresenius Medical Care Australia. The study was conceived, designed, and supervised by authors YC, DWJ, NT, and DAV (non-Fresenius employees). YC wrote the first draft of the manuscript; subsequent drafts were reviewed by YC, DWJ, DAV, CMH, MC, and NT.
The balANZ investigators were (Australian centers) G. Rangan, L. Liew, Blacktown Hospital, Sydney, NSW; H. Kulkarni, U. Steinwandel, Fremantle Hospital, Fremantle, WA; B. Jones, L. Garvey, John Hunter Hospital, Newcastle, NSW; M.G. Suranyi, M. Gilbert, Liverpool Hospital, Sydney, NSW; F.G. Brown, I. Abraham, J. Nandkumar, Monash Medical Centre, Melbourne, VIC; A. Coburn, V. Bali, Princess Alexandra Hospital, Brisbane, QLD; S. McDonald, S. Frasca, M. Hockley, C. Russ, The Queen Elizabeth Hospital, Adelaide, SA; T.J. Elias, K. Bannister, M. Hockley, K. Pirone, Royal Adelaide Hospital, SA; D. Ranganathan, L. Williams, Royal Brisbane Hospital, Brisbane, QLD; K. Warr, G. Smith, Perth, WA; N. Boudville, S. Pellicano, Sir Charles Gairdner Hospital, Perth, WA; R. Langham, E. O’Flaherty, St. Vincents Hospital, Melbourne, VIC; (New Zealand centers) J. Schollum, L. Reed, L. Anderson, Dunedin Hospital, Dunedin; D. Voss, B. Jagannathan, P. Nicholls, Middlemore Hospital, Auckland; and (Singapore centers) M.W.Y. Foo, C.K. Tam, Singapore General Hospital; R. Lee, Tang Tock Seng Hospital, Changi General Hospital; S.H. Tan, Kidney and Medical Clinic, Gleneagles Medical Centre.
REFERENCES
- 1. Bargman JM, Thorpe KE, Churchill DN on behalf of the CANUSA Peritoneal Dialysis Study Group. Relative contribution of residual renal function and peritoneal clearance to adequacy of dialysis: a reanalysis of the CANUSA study. J Am Soc Nephrol 2001; 12:2158–62. [DOI] [PubMed] [Google Scholar]
- 2. Justo P, Sanz AB, Egido J, Ortiz A. 3,4-Dideoxyglucosone-3-ene induces apoptosis in renal tubular epithelial cells. Diabetes 2005; 54:2424–9. [DOI] [PubMed] [Google Scholar]
- 3. Cho Y, Johnson DW, Badve SV, Craig JC, Strippoli GF, Wiggins K. The impact of neutral-pH peritoneal dialysates with reduced glucose degradation products on clinical outcomes in peritoneal dialysis patients. Kidney Int 2013; 84:969–79. [DOI] [PubMed] [Google Scholar]
- 4. Cho Y, Badve SV, Hawley CM, Wiggins K, Johnson DW. Biocompatible peritoneal dialysis fluids: clinical outcomes. Int J Nephrol 2012; 2012:812609. [DOI] [PMC free article] [PubMed] [Google Scholar]
- 5. Choi HY, Kim DK, Lee TH, Moon SJ, Han SH, Lee JE, et al. The clinical usefulness of peritoneal dialysis fluids with neutral pH and low glucose degradation product concentration: an open randomized prospective trial. Perit Dial Int 2008; 28:174–82. [PubMed] [Google Scholar]
- 6. Fan SL, Pile T, Punzalan S, Raftery MJ, Yaqoob MM. Randomized controlled study of biocompatible peritoneal dialysis solutions: effect on residual renal function. Kidney Int 2008; 73:200–6. [DOI] [PubMed] [Google Scholar]
- 7. Pajek J, Kveder R, Bren A, Gucek A, Bucar M, Skoberne A, et al. Short-term effects of bicarbonate/lactate-buffered and conventional lactate-buffered dialysis solutions on peritoneal ultrafiltration: a comparative crossover study. Nephrol Dial Transplant 2009; 24:1617–25. [DOI] [PubMed] [Google Scholar]
- 8. Szeto CC, Chow KM, Lam CW, Leung CB, Kwan BC, Chung KY, et al. Clinical biocompatibility of a neutral peritoneal dialysis solution with minimal glucose-degradation products—a 1-year randomized control trial. Nephrol Dial Transplant 2007; 22:552–9. [DOI] [PubMed] [Google Scholar]
- 9. Haas S, Schmitt CP, Arbeiter K, Bonzel KE, Fischbach M, John U, et al. Improved acidosis correction and recovery of mesothelial cell mass with neutral-pH bicarbonate dialysis solution among children undergoing automated peritoneal dialysis. J Am Soc Nephrol 2003; 14:2632–8. [DOI] [PubMed] [Google Scholar]
- 10. Weiss L, Stegmayr B, Malmsten G, Tejde M, Hadimeri H, Siegert CE, et al. Biocompatibility and tolerability of a purely bicarbonate-buffered peritoneal dialysis solution. Perit Dial Int 2009; 29:647–55. [PubMed] [Google Scholar]
- 11. Williams JD, Topley N, Craig KJ, Mackenzie RK, Pischetsrieder M, Lage C, et al. The Euro-Balance Trial: the effect of a new biocompatible peritoneal dialysis fluid (Balance) on the peritoneal membrane. Kidney Int 2004; 66:408–18. [DOI] [PubMed] [Google Scholar]
- 12. Parikova A, Struijk DG, Zweers MM, Langedijk M, Schouten N, van den Berg N, et al. Does the biocompatibility of the peritoneal dialysis solution matter in assessment of peritoneal function? Perit Dial Int 2007; 27:691–6. [PubMed] [Google Scholar]
- 13. Bajo MA, Perez-Lozano ML, Albar-Vizcaino P, del Peso G, Castro MJ, Gonzalez-Mateo G, et al. Low-GDP peritoneal dialysis fluid (“Balance”) has less impact in vitro and ex vivo on epithelial-to-mesenchymal transition (EMT) of mesothelial cells than a standard fluid. Nephrol Dial Transplant 2011; 26:282–91. [DOI] [PubMed] [Google Scholar]
- 14. Fernandez-Perpen A, Perez-Lozano ML, Bajo MA, Albar-Vizcaino P, Correa PS, Del Peso G, et al. Influence of bicarbonate/low-GDP peritoneal dialysis fluid (Bica-Vera) on in vitro and ex vivo epithelial-to-mesenchymal transition of mesothelial cells. Perit Dial Int 2012; 32:292–304. [DOI] [PMC free article] [PubMed] [Google Scholar]
- 15. Kim S, Oh J, Chung W, Ahn C, Kim SG, Oh KH. Benefits of biocompatible PD fluid for preservation of residual renal function in incident CAPD patients: a 1-year study. Nephrol Dial Transplant 2009; 24:2899–908. [DOI] [PubMed] [Google Scholar]
- 16. Rippe B, Simonsen O, Heimbürger O, Christensson A, Haraldsson B, Stelin G, et al. Long-term clinical effects of a peritoneal dialysis fluid with less glucose degradation products. Kidney Int 2001; 59:348–57. [DOI] [PubMed] [Google Scholar]
- 17. Kim YL, Do J, Park SH, Cho K, Park J, Yoon K, et al. Low glucose degradation products dialysis solution modulates the levels of surrogate markers of peritoneal inflammation, integrity, and angiogenesis: preliminary report. Nephrology (Carlton) 2003; 8(Suppl):S28–32. [DOI] [PubMed] [Google Scholar]
- 18. Kim SG, Kim S, Hwang YH, Kim K, Oh JE, Chung W, et al. Could solutions low in glucose degradation products preserve residual renal function in incident peritoneal dialysis patients? A 1-year multicenter prospective randomized controlled trial (Balnet Study). Perit Dial Int 2008; 28(Suppl 3):S117–22. [PubMed] [Google Scholar]
- 19. Haag-Weber M, Kramer R, Haake R, Islam MS, Prischl F, Haug U, et al. Low-GDP fluid (Gambrosol Trio) attenuates decline of residual renal function in PD patients: a prospective randomized study. Nephrol Dial Transplant 2010; 25:2288–96. [DOI] [PubMed] [Google Scholar]
- 20. Tranæus A. A long-term study of a bicarbonate/lactate–based peritoneal dialysis solution—clinical benefits. The Bicarbonate/Lactate Study Group. Perit Dial Int 2000; 20:516–23. [PubMed] [Google Scholar]
- 21. Feriani M, Kirchgessner J, La Greca G, Passlick-Deetjen J. Randomized long-term evaluation of bicarbonate-buffered CAPD solution. Kidney Int 1998; 54:1731–8. [DOI] [PubMed] [Google Scholar]
- 22. Johnson DW, Brown FG, Clarke M, Boudville N, Elias TJ, Foo MW, et al. Effects of biocompatible versus standard fluid on peritoneal dialysis outcomes. J Am Soc Nephrol 2012; 23:1097–107. [DOI] [PMC free article] [PubMed] [Google Scholar]
- 23. Johnson DW, Clarke M, Wilson V, Woods F, Brown FG. Rationale and design of the balANZ trial: a randomised controlled trial of low GDP, neutral pH versus standard peritoneal dialysis solution for the preservation of residual renal function. BMC Nephrol 2010; 11:25. [DOI] [PMC free article] [PubMed] [Google Scholar]
- 24. Johnson DW, Brown FG, Clarke M, Boudville N, Elias TJ, Foo MW, et al. The effect of low glucose degradation product, neutral pH versus standard peritoneal dialysis solutions on peritoneal membrane function: the balANZ trial. Nephrol Dial Transplant 2012; 27:4445–53. [DOI] [PMC free article] [PubMed] [Google Scholar]
- 25. Johnson DW, Brown FG, Clarke M, Boudville N, Elias TJ, Foo MW, et al. The effects of biocompatible compared with standard peritoneal dialysis solutions on peritonitis microbiology, treatment, and outcomes: the balANZ trial. Perit Dial Int 2012; 32:497–506. [DOI] [PMC free article] [PubMed] [Google Scholar]
- 26. Hoy WE, Wang Z, VanBuynder P, Baker PR, McDonald SM, Mathews JD. The natural history of renal disease in Australian Aborigines. Part 2. Albuminuria predicts natural death and renal failure. Kidney Int 2001; 60:249–56. [DOI] [PubMed] [Google Scholar]
- 27. Hallan SI, Ritz E, Lydersen S, Romundstad S, Kvenild K, Orth SR. Combining GFR and albuminuria to classify CKD improves prediction of ESRD. J Am Soc Nephrol 2009; 20:1069–77. [DOI] [PMC free article] [PubMed] [Google Scholar]
- 28. Iseki K, Ikemiya Y, Iseki C, Takishita S. Proteinuria and the risk of developing end-stage renal disease. Kidney Int 2003; 63:1468–74. [DOI] [PubMed] [Google Scholar]
- 29. Kang SH, Cho KH, Park JW, Yoon KW, Do JY. Impact of heavy proteinuria on clinical outcomes in patients on incident peritoneal dialysis. BMC Nephrol 2012; 13:171. [DOI] [PMC free article] [PubMed] [Google Scholar]
- 30. Singhal MK, Bhaskaran S, Vidgen E, Bargman JM, Vas SI, Oreopoulos DG. Rate of decline of residual renal function in patients on continuous peritoneal dialysis and factors affecting it. Perit Dial Int 2000; 20:429–38. [PubMed] [Google Scholar]
- 31. Dieterle F, Perentes E, Cordier A, Roth DR, Verdes P, Grenet O, et al. Urinary clusterin, cystatin C, beta2-microglobulin and total protein as markers to detect drug-induced kidney injury. Nat Biotechnol 2010; 28:463–9. [DOI] [PubMed] [Google Scholar]
- 32. Dvergsten J, Manivel JC, Correa-Rotter R, Rosenberg ME. Expression of clusterin in human renal diseases. Kidney Int 1994; 45:828–35. [DOI] [PubMed] [Google Scholar]
- 33. Hidaka S, Kranzlin B, Gretz N, Witzgall R. Urinary clusterin levels in the rat correlate with the severity of tubular damage and may help to differentiate between glomerular and tubular injuries. Cell Tissue Res 2002; 310:289–96. [DOI] [PubMed] [Google Scholar]
- 34. Rinnert M, Hinz M, Buhtz P, Reiher F, Lessel W, Hoffmann W. Synthesis and localization of trefoil factor family (TFF) peptides in the human urinary tract and TFF2 excretion into the urine. Cell Tissue Res 2010; 339:639–47. [DOI] [PubMed] [Google Scholar]
- 35. Yu Y, Jin H, Holder D, Ozer JS, Villarreal S, Shughrue P, et al. Urinary biomarkers trefoil factor 3 and albumin enable early detection of kidney tubular injury. Nat Biotechnol 2010; 28:470–7. [DOI] [PubMed] [Google Scholar]
- 36. Astor BC, Kottgen A, Hwang SJ, Bhavsar N, Fox CS, Coresh J. Trefoil factor 3 predicts incident chronic kidney disease: a case-control study nested within the Atherosclerosis Risk in Communities (ARIC) study. Am J Nephrol 2011; 34:291–7. [DOI] [PMC free article] [PubMed] [Google Scholar]
- 37. Bonventre JV. Kidney injury molecule-1 (KIM-1): a urinary biomarker and much more. Nephrol Dial Transplant 2009; 24:3265–8. [DOI] [PubMed] [Google Scholar]
- 38. van Timmeren MM, Vaidya VS, van Ree RM, Oterdoom LH, de Vries AP, Gans RO, et al. High urinary excretion of kidney injury molecule-1 is an independent predictor of graft loss in renal transplant recipients. Transplantation 2007; 84:1625–30. [DOI] [PMC free article] [PubMed] [Google Scholar]
- 39. Bhavsar NA, Kottgen A, Coresh J, Astor BC. Neutrophil gelatinase-associated lipocalin (NGAL) and kidney injury molecule 1 (KIM-1) as predictors of incident CKD stage 3: the Atherosclerosis Risk in Communities (ARIC) Study. Am J Kidney Dis 2012; 60:233–40. [DOI] [PMC free article] [PubMed] [Google Scholar]
- 40. Panzer U, Steinmetz OM, Reinking RR, Meyer TN, Fehr S, Schneider A, et al. Compartment-specific expression and function of the chemokine IP-10/CXCL10 in a model of renal endothelial microvascular injury. J Am Soc Nephrol 2006; 17:454–64. [DOI] [PubMed] [Google Scholar]
- 41. Wolkow PP, Niewczas MA, Perkins B, Ficociello LH, Lipinski B, Warram JH, et al. Association of urinary inflammatory markers and renal decline in microalbuminuric type 1 diabetics. J Am Soc Nephrol 2008; 19:789–97. [DOI] [PMC free article] [PubMed] [Google Scholar]
- 42. Matz M, Beyer J, Wunsch D, Mashreghi MF, Seiler M, Pratschke J, et al. Early post-transplant urinary IP-10 expression after kidney transplantation is predictive of short- and long-term graft function. Kidney Int 2006; 69:1683–90. [DOI] [PubMed] [Google Scholar]


