Abstract
Focused ultrasound with microbubbles is an emerging technique for blood brain barrier (BBB) opening. Here, a comprehensive theoretical model of a bubble-fluid-vessel system has been developed which accounts for the bubble’s non-spherical oscillations inside a microvessel, and its resulting acoustic emissions. Numerical simulations of unbound and confined encapsulated bubbles were performed to evaluate the effect of the vessel wall on acoustic emissions and vessel wall stresses. Using a Marmottant shell model, the normalized second harmonic to fundamental emissions first decreased as a function of pressure (>50 kPa) until reaching a minima ("transition point") at which point they increased. The transition point of unbound compared to confined bubble populations occurred at different pressures and was associated with an accompanying increase in shear and circumferential wall stresses. As the wall stresses depend on the bubble to vessel wall distance, the stresses were evaluated for bubbles with their wall at a constant distance to a flat wall. As a result, the wall stresses were bubble size and frequency dependent and the peak stress values induced by bubbles larger than resonance remained constant versus frequency at a constant mechanical index.
Index Terms: Acoustic emissions, Blood–brain barrier (BBB), finite element analysis, focused ultrasound (FUS), microbubbles, vessel wall stresses
I. INTRODUCTION
Focused ultrasound exposure with microbubbles is an emerging technique to open the blood brain barrier (BBB) for targeted drug delivery [1]. Its advantages over other techniques are that it is non-invasive, transient, image-guided and localized. The BBB is a selective barrier separating the blood from the parenchyma of the central nervous system [2]. The BBB restricts more than 98% of the therapeutic agents from traveling into the brain tissue [3]. Many successful experiments using low power ultrasound and microbubbles to mediate BBB opening have been reported. Comprehensive reviews on this field are given in [4]–[6]. A bubble model confined within the vasculature could provide useful information to guide BBB opening experiments.
Previously, acoustic emissions from bubbles were shown to be correlated with BBB opening. During BBB opening, a significant increase in second and third harmonics of the ultrasound transmit frequency (2f0 and 3f0) due to Optison™ microbubbles were observed [7]. In that study, BBB opening occurred without observation of erythrocyte extravasations or wideband emissions, which are indicators of inertial cavitation. Arvanitis et al. [8] recently demonstrated the use of harmonic emissions from Definity® microbubbles to direct BBB opening without broadband emissions. From their BBB opening experiments, Tung et al. [9] proposed the fourth and fifth harmonics, which in their BBB opening experiments only appeared in the presence of microbubbles, could be used as indicators of BBB opening. The objective of the present study is to assess the harmonic emissions from various bubbles in microvessels, using a confined bubble model.
We have hypothesized that the mechanical stresses generated by microbubbles could play an important role in the BBB opening. Therefore, this study investigates the mechanical stresses generated by oscillating bubbles in order to shed light on the relationship between the induced mechanical stresses and BBB opening. McDannold et al. [10] reported that the BBB opening threshold was constant when described by the mechanical index (MI, ratio of acoustic pressure in MPa to square room of acoustic frequency in MHz). The stresses generated by various bubble sizes at a flat wall were calculated as a function of frequency, for a constant MI as well.
The overall purpose of this study is to utilize a numerical model of a fully coupled bubble-fluid-vessel system to examine the effect of the vessel wall on acoustic emissions and vessel wall stresses, in order to guide future experiments for treatment monitoring and control.
II. METHODS
In this study, unbound bubbles (situated unconfined within fluid) and bubbles confined within microvasculature were simulated. The coupled bubble-fluid-vessel system was solved numerically. The numerical part was solved using the finite element method (FEM) in Comsol Multiphysics 4.2 (COMSOL AB. Burlington, MA). The acoustic frequency was set to 0.551 MHz based on its use in prior experimental studies [11] and its suitability for transmission through human skull [12]. This frequency was used throughout this study unless otherwise mentioned. The acoustic pressure amplitude was varied from 50 to 275 kPa in increments of 25 kPa. Notations for all variables used are shown in Table I.
TABLE I.
Notations
| Symbol | Definition of symbol |
|---|---|
| r | Radial direction in cylindrical coordinate system (m) |
| z | Axial direction in cylindrical coordinate system (m) |
| vf | Fluid velocity (m/s) |
| ρL | Fluid density (kg/m3) |
| µ | Dynamic viscosity of the fluid (Pa.s) |
| P | Pressure in the fluid (Pa) |
| Pac | Acoustic pressure wave (Pa) |
| Psum | Acoustic pressure from a bubble distribution (Pa) |
| Pf−b | The pressure applied on the fluid-bubble interface (Pa) |
| Pg | Gas pressure (Pa) |
| Pg0 | Gas pressure at resting state (Pa) |
| P0 | Ambient pressure in microvessels (Pa) |
| Ps | Scattered pressure from bubbles (Pa) |
| R0 | Initial bubble radius (m) |
| R | Bubble radius (m) |
| κ | Total curvature (m−1) |
| γ(A) | Surface tension as a function of bubble area (N/m) |
| Pγ | Laplace pressure (Pa) |
| κ | Polytropic index |
| Pi | Intravascular pressure (Pa) |
| Pµ | Fluid viscosity pressure term (Pa) |
| Psv | Shell viscosity pressure term (Pa) |
| P(t) | Ultrasound pressure pulse at the bubble wall (Pa) |
| Pout | Pressure on the outer diameter of vessel wall (Pa) |
| ri | Inner vessel diameter (m) |
| ro | Outer vessel diameter (m) |
| χ | Shell elastic modulus (N/m) |
| κs | Shell viscosity (kg/s) |
| γwater | Surface tension of water (N/m) |
| A | Bubble area (m2) |
| Abuckling | Bubble area at shell buckling regime (m2) |
| Rbreak-up | Bubble radius at break-up regime (m) |
| Abreak-up | Bubble area at break-up regime (m2) |
| Req | Spherical bubble's equivalent radius (m) |
| a0 | Bubble wall acceleration (m/s2) |
| σij | The ijth components of the stress tensors |
| εij | The ijth components of the strain tensors |
| δij | Kronecker delta |
| E | Young’s modulus (Pa) |
| v | Poisson’s ratio |
| wi | Weighting factor |
| τrz | Shear Stress (Pa) |
| n | The outward unit normal |
The shell properties used for Definity® microbubbles (Lantheus Medical Imaging, North Billerica, Massachusetts) are indicated in Table II, and were within the range that has been previously reported [13], [14]. Definity bubbles are poly-disperse [15] and were simulated for various radii. In this work bubbles were either in an infinite fluid, or confined within vessels of various size (radius ranging from 3–10 µm).
TABLE II.
Parameters and Values
| Parameters | Value | Reference |
|---|---|---|
| Polytropic index, k | 1.07 | |
| Shell viscosity, κs | 1.2×10⁻⁸ kg s−1 | Tu et al. [13], Helfield and Goertz [14] |
| Fluid viscosity, µ | 0.002 Pa s | |
| Shell elasticity, χ | 0.7 Nm−1 | Tu et al. [13], Helfield and Goertz [14] |
| Surface tension of water, γwater | 0.072 N/m | Gilányi et al. [18] |
| Vessel elastic modulus, Ev | 1 MPa | Duck [19], Smaje et al. [20] |
| Tissue elastic modulus, Et | 0.5 MPa | Duck [19] |
| Ambient capillary pressure, P0 | 104.6 kPa | Burton [21] |
| Poisson's ratio, v | 0.49 | Melbin and Noordergraaf [22] |
A. FEM Simulations
A fully coupled model of a confined bubble within a microvessel was developed and previously validated [16]. This model accounts for non-spherical bubble oscillations as well as the effects of confinement.
A shell model proposed by Marmottant et al. [17] was adopted and the bubble surface tension, γ(A) was defined as follows:
| (1) |
The three conditions above represent buckling, elastic and ruptured states of the encapsulating shell. It was assumed that Abreak-up = 4πRbreak-up2 and Rbreak-up, the radius at which the bubble shell breaks, was set to according to Marmottant et al. [17]. The bubble's initial surface tension, γ(A0), was assumed to be 0, meaning that it was at the buckling point.
At the bubble-fluid interface the normal stresses should satisfy the following equation:
| (2) |
where P, Pg, Pγ, Pµ and Psv are the pressure in the fluid, gas pressure, Laplace pressure, fluid viscosity and shell viscosity pressure terms respectively. As for the fluid-bubble boundary condition, the following normal pressure was applied to the bubble wall:
| (3) |
where Pf-b is the pressure on the fluid just outside the bubble wall minus the Laplace pressure. This pressure accounts for fluid and shell viscosities, and assumes that a uniform acoustic pressure is acting on the bubble wall. The Laplace pressure was Pγ = κγ(A) (where γ(A) is the surface tension described above and κ is the total curvature). Pγ was evaluated using a weak form of the fluid-bubble boundary condition and it accounts for non-spherical bubble oscillations (for more information on the details of the FEM modeling, refer to [16]). Pg in (3) is the gas pressure. From the polytropic gas law, , where V is the bubble volume, Pg0 is the gas pressure at the resting state (Note that Pg0 = P0 + 2 γ(A0)/R0 reduces to the ambient pressure P0 as the initial surface tension was assumed to be zero, γ(A0) = 0), and V0 is the initial bubble volume. The bubble volume was calculated at each time step and was then updated in (3). The fluid viscosity and shell viscosity pressures in (3) were defined as and respectively, and Req is the bubble equivalent radius. These viscous terms were derived for spherical bubbles. Here, they were assumed to be uniform on the bubble wall and independent of the bubble wall curvature. Req was calculated by equating the bubble surface area with the surface area of a sphere of radius Req.
The elastic vasculature and the fluid were coupled in a two way manner with a boundary condition of equal fluid-structure velocities at the wall. The Navier-Stokes equations for a viscid incompressible Newtonian liquid and equations for an elastic vessel were solved simultaneously:
| (4) |
where σ was the stress tensor. The linear elastic constitutive equation is given as
| (5) |
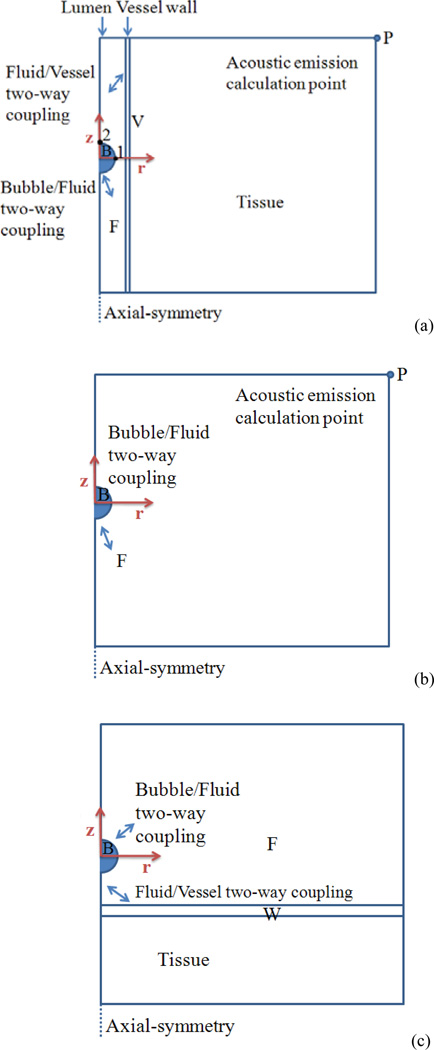
where δij is the Kronecker delta (if i = j, δij= 1, and if i ≠ j, δij = 0) and σij and εij are the ijth components of the stress and strain tensors, respectively. The vessel wall was chosen to be 1 µm in thickness. The microvessel was surrounded with a 114 µm layer of tissue structure. Fig. 1 presents the schematic illustration of the simulated domain. Figs. 1a, 1b and 1c represent the simulations performed on confined bubbles in the middle of microvessels, unbound bubbles and bubbles at a flat vessel wall, respectively. The parameters and values used in this work are presented in Table II.
Fig. 1.
Schematic diagram of the FEM domain. Bubble, fluid, vessel and flat wall are labeled as B, F, V and W (a) A confined bubble in the middle of the vessel, (b) An unbound bubble inside free fluid, and (c) A microbubble placed close to a flat vessel wall (Color online).
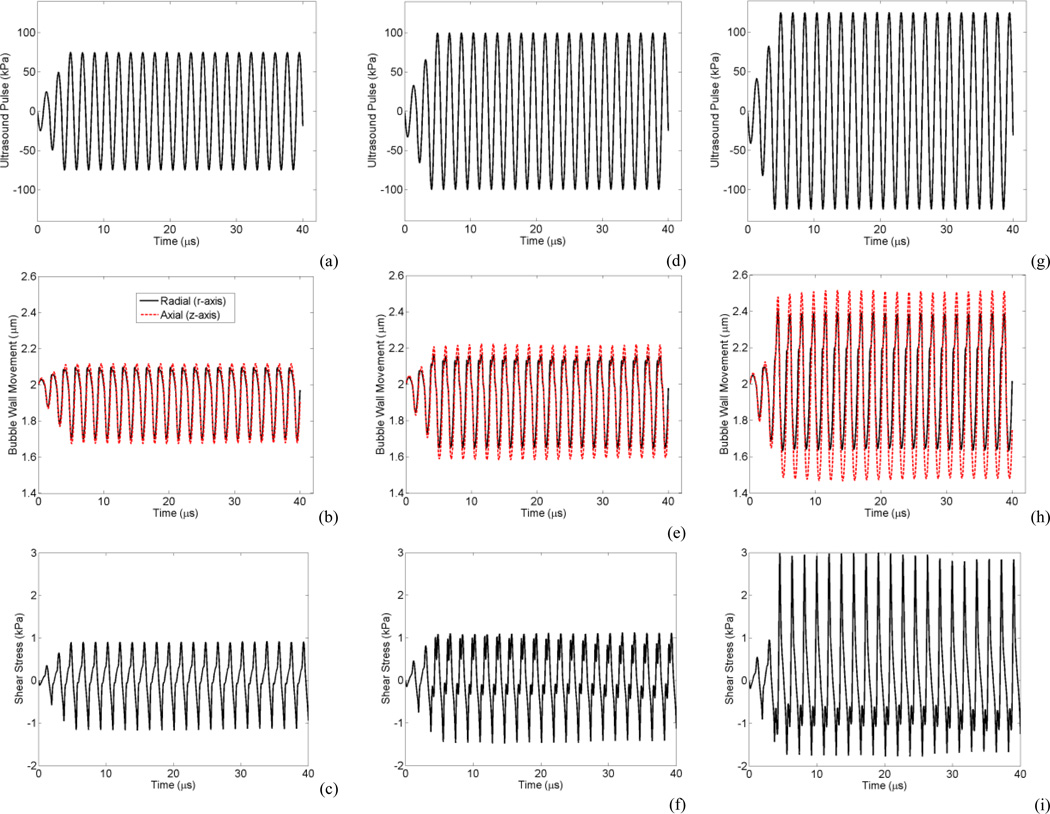
The ultrasound waveform was tapered at the start of the burst to avoid any subtle numerical instabilities and represent a realistic burst from an ultrasound transducer. An example of corresponding ultrasound waveforms, non-spherical bubble oscillations and wall shear stress is shown in Fig. 2 for a bubble with 2 µm radius within a 5 µm radius vessel sonicated at 0.551 MHz and 75, 100 and 125 kPa. The changes in the bubble oscillation between the compression dominated oscillations (at 75 kPa, Fig. 2b) to near expansion dominated oscillations (at 125 kPa, Fig. 2h) related to the transition from buckling to elastic and rupture states in the shell model, respectively. In Fig. 2i it is apparent that the transition to greater expansions is directly linked to greater shear stresses. Most of the results in the following section were generated from confined bubbles within 5 µm vessels. This vessel size was chosen because the BBB opening experiments with two-photon microscopy revealed that smallest vessels (2.5–12.5 µm in radius) are most susceptible to permeabilization [23], [24].
Fig. 2.
A 2 µm radius bubble within a 5 µm radius vessel with the corresponding applied ultrasound pulse (top), bubble wall radial (black solid line) and axial (red dashed line) oscillation (middle), and shear stress (bottom). (a, b and c) at 75 kPa, (d, e and f) at 100 kPa, and (g, h and i) at 125 kPa. At 75 kPa bubble is within the elastic regime of Marmottant shell model and exhibits compression dominated oscillation (b), At 100 kPa bubble enters the rupture state (e), and at 125 kPa bubble shows expansion dominated as it is mainly in rupture state (h) (Color online).
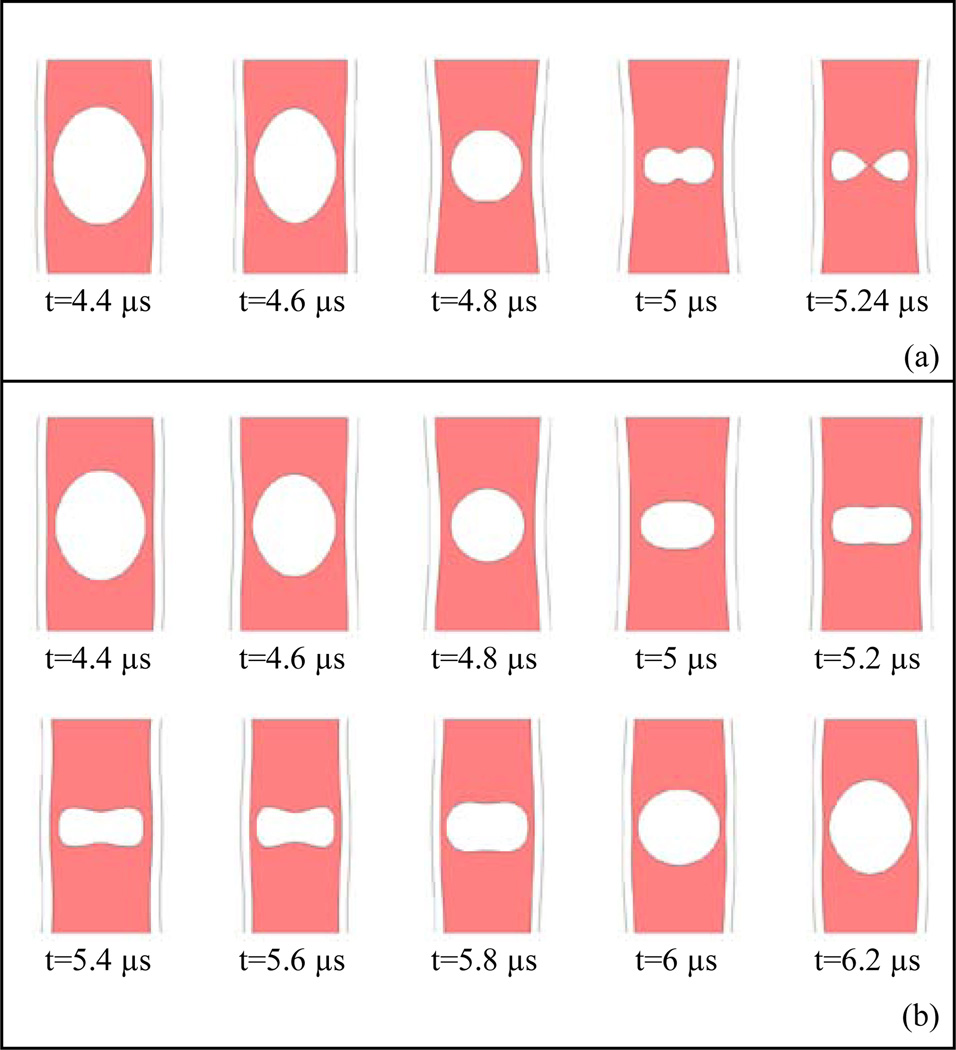
At certain threshold pressures bubbles in these vessels underwent collapse along the z axis. Here the collapse is defined when opposing bubble wall sides along the vessel axis rapidly came into contact. The simulations stopped following this point. Figs. 3a presents an example of bubble collapse from a 4 µm bubble at 125 kPa within a 5 µm vessel during its contraction phase. At the final stage the two axial bubble walls came into contact.
Fig. 3.
Examples of bubble collapse and non-collapse during the bubble contraction phase, (a) A 4 µm bubble within a 5 µm vessel at 125 kPa with collapse, (b) A 4 µm bubble within a 5 µm vessel at 100 kPa without collapse which continuous with a stable oscillation shown at one cycle. The periodicity of non-spherical bubble oscillation is at the transmit frequency (e.g. 0.551 MHz).
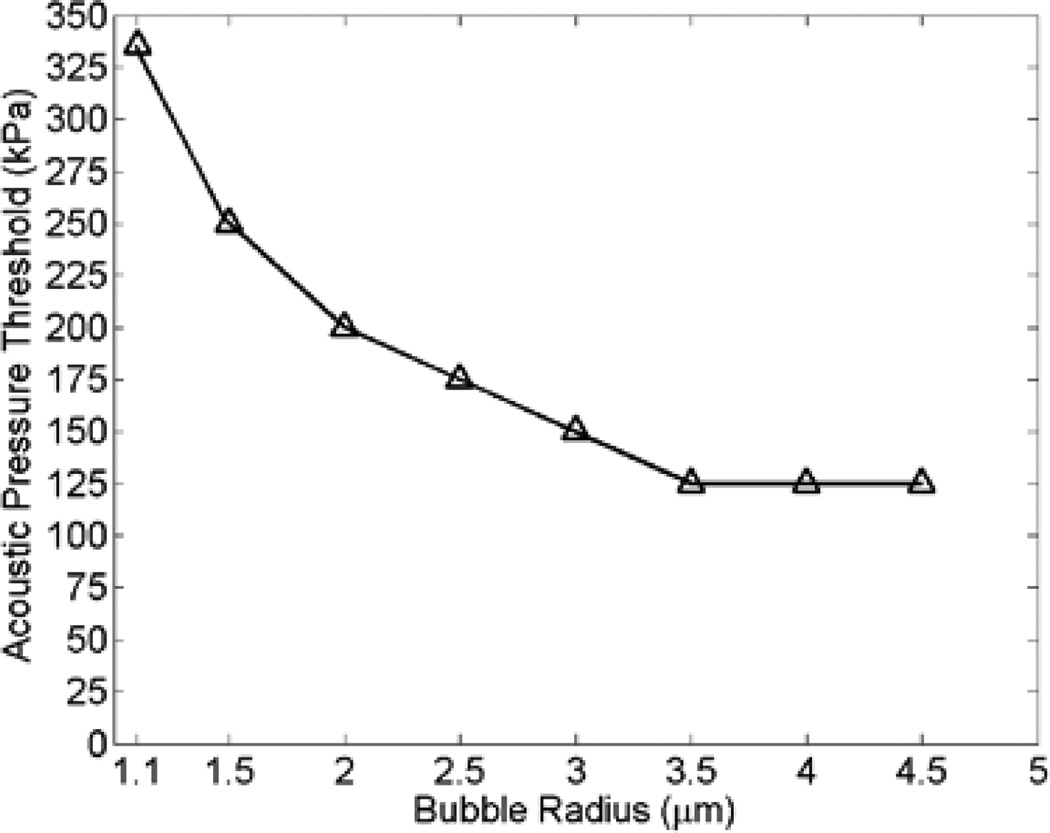
At lower pressures, Fig. 3b shows the stable oscillation of the same bubble at 100 kPa during one cycle. The periodicity of non-spherical bubble oscillation is at the transmit frequency, 0.551 MHz. Fig. 4 depicts the pressure threshold at which bubbles within 5 µm vessels underwent collapse. The results in the following sections are necessarily generated for pressures that were below the collapse threshold.
Fig. 4.
Bubble collapse threshold of different size bubbles driven at 0.551 MHz within 5 µm vessels.
B. Acoustic Emissions
The acoustic emissions radiated from a spherical oscillating bubble at a distance r can be calculated using the following equation [25]:
| (6) |
where r is the radial distance to the bubble in spherical coordinates. However, since a confined bubble within a vessel is oscillating non-spherically, the assumptions leading to (6) do not hold. Therefore, in this study the Helmholtz equation was solved to calculate the scattered acoustic emissions from confined bubbles:
| (7) |
where Pac is the acoustic pressure wave. The acoustic waves propagated in a 30×30 µm domain. Fig. 1a and 1b show a schematic of this model. The non-spherical bubble wall acceleration was coupled to the acoustic model and acted as a source of wave generation. The acoustic emissions from the bubble was calculated at a fixed point (i.e. at point P on Fig. 1a and 1b). A normal acceleration boundary condition was applied on the bubble wall with the following equation:
| (8) |
where a0 is the bubble wall acceleration which was taken from the solution in the previous section. It is important to note that point P on Figs. 1a and 1b might have been angel dependent, however it was not the focus here and this fixed point was used for all of the simulations. At the edge of the numerical domain, a spherical wave radiation boundary condition was used where an outgoing wave leaves the modeling domain with minimal reflections.
| (9) |
r is the radial axis in the spherical coordinate. Acoustic emissions were assessed for 1.1–3 µm bubbles within 3–10 µm vessels.
C. Bubble Population
As Definity bubbles are polydisperse, acoustic emissions from a bubble population was also calculated (Psum). A Definity bubble distribution in number density was taken from the measurement performed on fresh bubble population by Faez et al. [15]. Psum was calculated using a summation of scattered pressures from different bubbles, weighted to their distribution, Psum = ΣiPaciwi Bubbles with radii ranging from 0.5 to 3 µm were used here, in increments of 0.5 µm.
D. Signal Processing
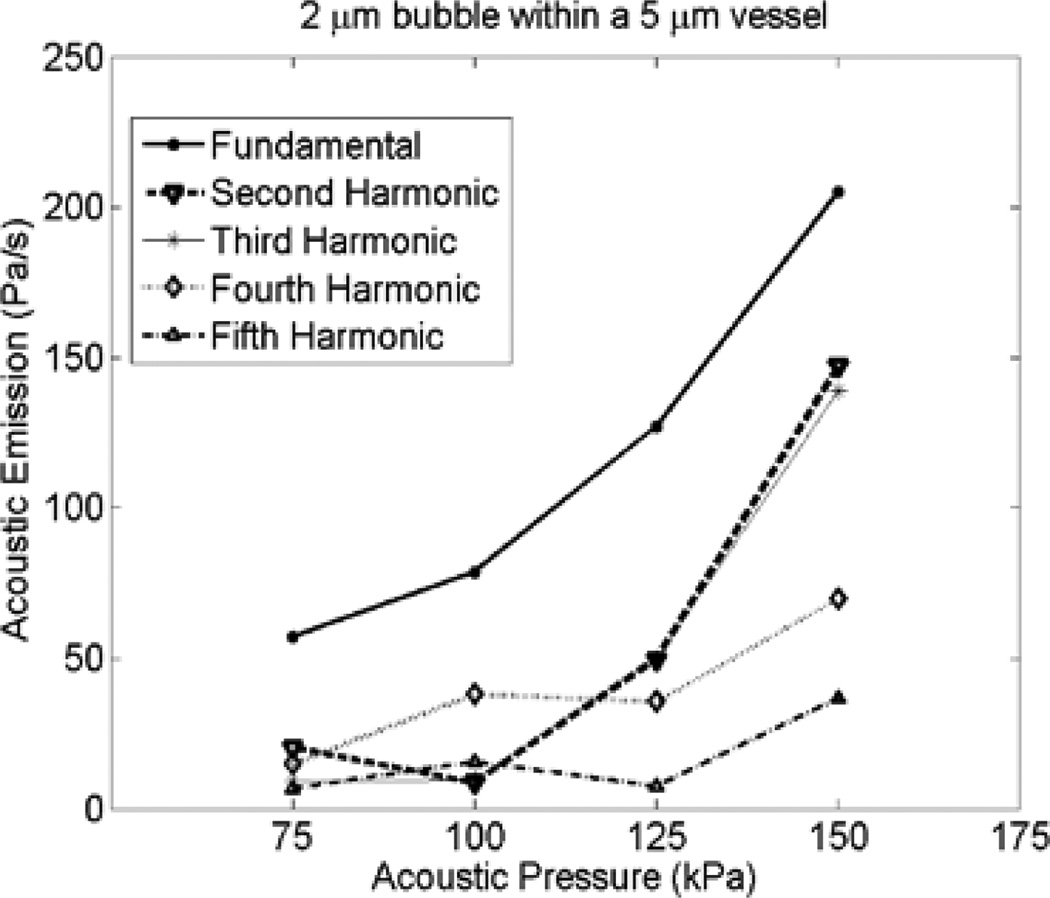
The acoustic pressure emitted from a non-spherical bubble was calculated at point P during (Figs. 1a and 1b). The time domain signal was 40 µs long (about 22 cycles of oscillation at 0.551 MHz). Frequency spectra of the calculated pressure waveforms were produced using a Fourier transform of the unmodified time domain signal. This Fourier transform was done on Pac from a single bubble and Psum from bubble populations. The area under the peaks at the fundamental, second, third, fourth and fifth harmonics +/−27 kHz (approximately ±3 dB) were calculated. Acoustic emissions plots represent the area under the curve for each acoustic signal. This method was in line with the signal processing performed by McDannold et al. [7]. The acoustic emissions assessment in this study was performed at pressures below the bubble collapse. In Fig. 5, the acoustic emissions versus acoustic pressure for a 2 µm bubble within a 5 µm vessel is shown (corresponding to the example given in Fig. 2).
Fig. 5.
Effects of acoustic pressure on acoustic emission from a 2 µm within 5 µm vessels at 0.551 MHz.
E. Stress Calculation
On the vessel wall, circumferential stress (along the vessel circumference), shear stress (along the vessel axis) and transmural pressure (pressure in the radial direction) induced by bubbles within 5 µm vessels were calculated. The circumferential stress for a thick wall cylinder was calculated using the following equation [26]:
| (10) |
The vessel wall shear stress was calculated as below:
| (11) |
where u and w are fluid velocity components in the r and z directions, respectively. Transmural pressure was calculated as the difference between the inside and outside pressures on the vessel wall. The maximum values of the above stresses are reported in the results section.
In a realistic situation, bubbles of different radii are located within different vessel sizes. Wall stresses depend on the bubble wall to the vessel wall distance which requires a range of simulations comprised of different bubble and vessel size combinations. In order to reduce computational time to feasible levels, and decouple the bubble-vessel distance dependency, bubbles ranging from 1.1 to 9 µm in radius were placed in proximity to a flat wall (Fig. 1c). Transmural pressure and shear stresses were calculated for bubbles at a flat, elastic wall with the same elastic properties used in the previous sections. All bubbles were initially placed at a distance of 2 µm from the wall. Note that the effect of acoustic radiation force was not taken into account here. Bubbles during their oscillations translated towards the vessel wall and simulations were terminated when bubbles reached a distance of 1 µm away from the wall. At a constant mechanical index, three frequencies of 0.551, 1 and 1.5 MHz were used. The corresponding acoustic pressures were 100, 134 and 164 kPa (constant MI=0.134).
F. Model Validation
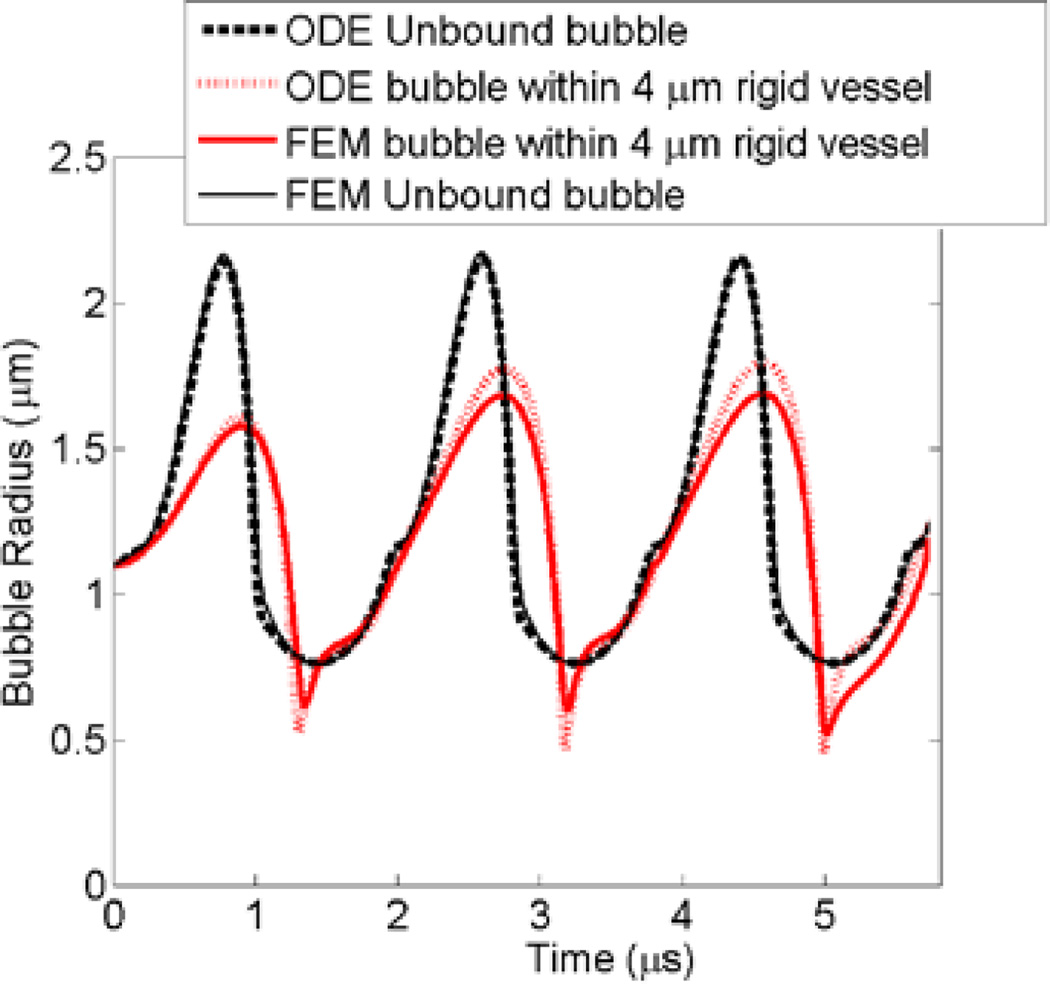
The finite element model (FEM) has been previously validated against experimental observations [16]. The FEM was further validated against ordinary differential equation (ODE) bubble models of two extreme scenarios; 1) when the bubble was within an unbound fluid and 2) when the bubble was within a completely rigid vessel. The ordinary differential equation (ODE) of a modified Rayleigh–Plesset equation for an unbound 1.1 µm bubble was solved using MATLAB (version 7.11, The MathWorks, Natick, MA). Leighton [27] derived an ODE equation of motion for a bubble wall within a finite rigid tube while accounting for the fluid inertia (Equation 12 in [27]). The rigid tube ODE of a 1.1 µm bubble inside a 4 µm rigid tube was solved with the addition of Marmottant shell terms using MATLAB. Both ODE solutions of bubble wall as a function of time are plotted in Fig. 6. FEM simulations were performed for the same parameters while adopting unbound bubble and rigid vessel cases (similar to Figs. 1b and 1a respectively). For the unbound bubble, the plots from the ODE and FEM were identical. In the rigid vessel case, the FEM bubble expansion was 5% lower than the ODE solution.
Fig. 6.
ODE and FEM comparison for an unbound bubble (black) and a bubble within a rigid vessel (red). ODE solution for unbound and confined bubbles are shown in bold dashed line and dotted line respectively. FEM solution for unbound and confined bubbles are in solid line and bold line respectively. The bubble radius, acoustic frequency and pressure were 1.1 µm, 0.551 MHz and 250 kPa, respectively (Color online).
III. RESULTS
A. Acoustic Emissions
1) Effects of Vessel Radius
Fig. 7 illustrates the acoustic emissions from confined bubbles within 3, 5 and 10 µm vessels, as well as unbound bubbles. Figs. 7a and 7b represent a 1.1 µm bubble at 250 kPa and a 2 µm bubble at 150 kPa, respectively. These acoustic pressures were below the bubble collapse threshold (shown in Fig 4). Fundamental, second, third, fourth and fifth harmonics are plotted for comparison. Bubble oscillations and consequently acoustic emissions were mitigated when bubbles were confined compared to the unbound case.
Fig. 7.
Effect of vessel radius on acoustic emissions from a (a) 1.1 µm radius bubble at 250 kPa, and (b) 2 µm radius bubble at 150 kPa.
2) Effects of Acoustic Pressure
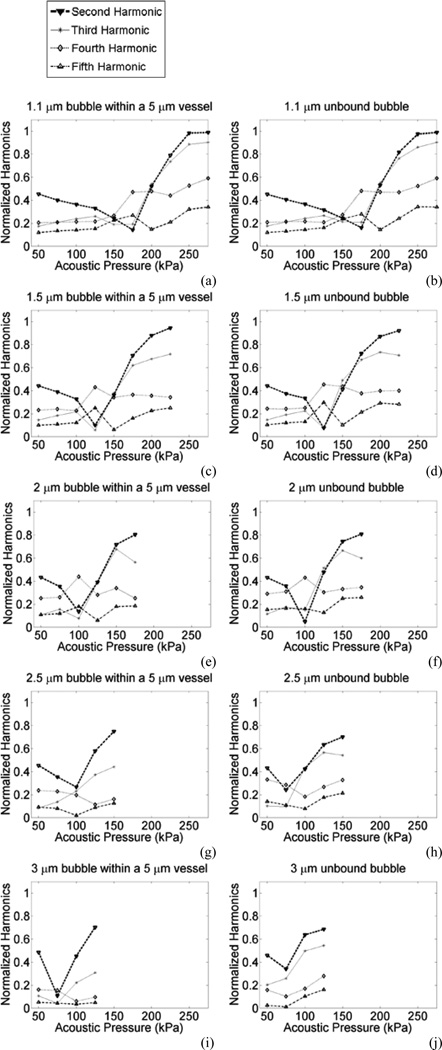
In this section, the acoustic emissions were assessed for bubble radii of 1.1, 1.5, 2, 2.5 and 3 µm within 5 µm capillaries. In order to enhance the effects of acoustic emissions, the results of harmonic emissions are normalized to the fundamental at each corresponding pressure. Normalized harmonic emissions are plotted in Fig. 8 for unbound and confined bubbles. The normalized second harmonic had a consistent trend in all bubbles where it reached a minima ("transition point") followed by an increase. This transition point was associated with the transition from “compression dominated” oscillations in the shell buckling regime (Marmottant et al.) occurring at lower pressures, to the “rupture state” for higher amplitude oscillations. An example of this behavior is shown in Fig. 2. For larger bubbles, their normalized second harmonic had its minima at lower pressures. This transition point occurred at 175, 125, 100, 100 and 75 kPa for 1.1, 1.5, 2, 2.5 and 3 µm bubbles respectively. For larger bubbles, where the bubble to vessel radius ratio is closer to 1, the differences in the normalized emissions of confined and unbound bubbles is more evident.
Fig. 8.
Acoustic emissions normalized to fundamental versus the incident acoustic pressure for (a and b) 1.1 µm, (c and d) 1.5 µm, (e and f) 2 µm, (g and h) 2.5 µm, (i and j) 3 µm bubbles within 5 µm vessels (a, c, e, g and i) or unbound bubbles (b, d, f, h and j) at 0.551 MHz.
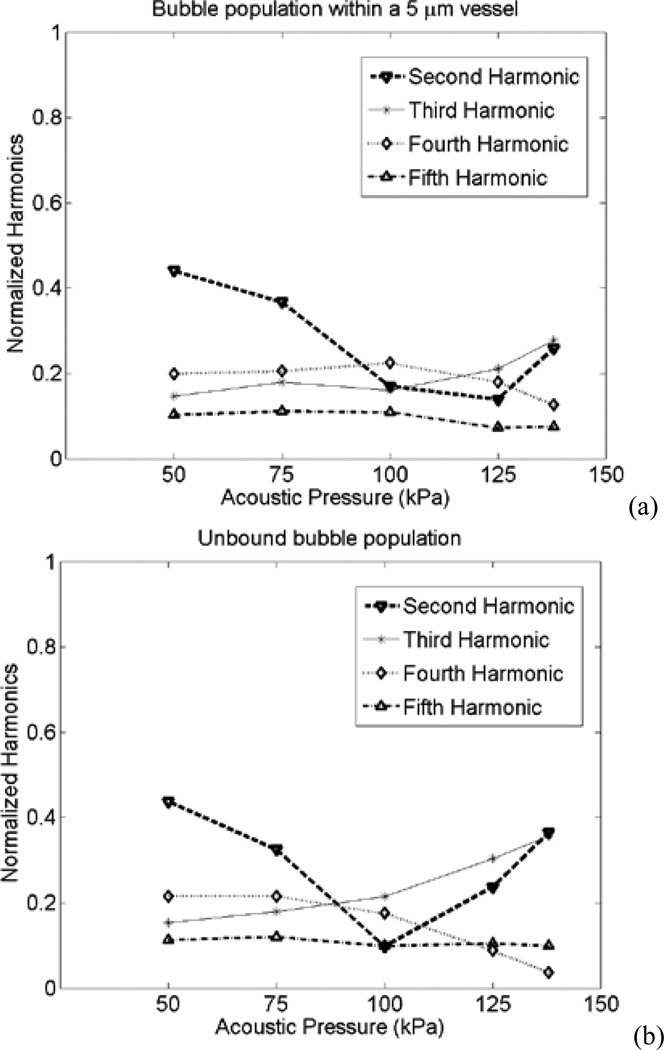
For a more clinically relevant case, the acoustic emissions from populations of confined and unbound bubbles were calculated. The normalized harmonics are shown in Fig. 9. Here, the transition point for the normalized second harmonic occurred at 100 kPa for the unbound case and 125 kPa for the confined case. The acoustic emissions for some harmonics in confined bubbles were larger than those in the unbound case. The second harmonics of the confined bubble population within 5 µm vessels at 100 kPa was 60% larger than that of unbound bubbles (the normalized second harmonics was 73% larger). Also, at 125 kPa the fourth harmonics was 80% larger than the unbound case (the normalized fourth harmonics was 105% larger).
Fig. 9.
Acoustic emissions normalized to the fundamental from a bubble population versus the incident acoustic pressure for (a) bubbles within 5 µm vessels, and (b) unbound bubbles.
B. Vessel Wall Stresses
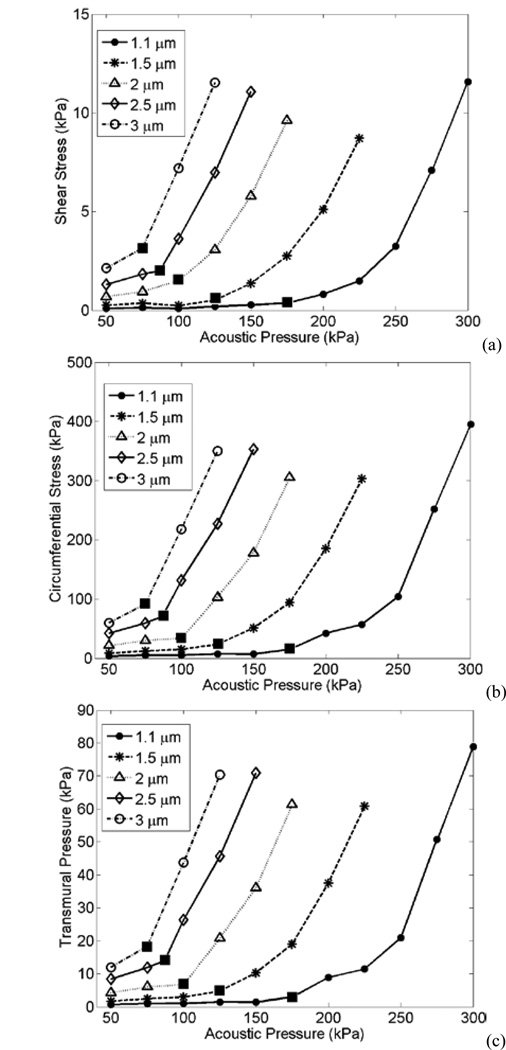
Fig. 10 presents stresses induced by confined bubbles within a 5 µm vessel, according to the geometry in Fig. 1a. The shear stress, circumferential stress, and transmural pressure versus acoustic pressure induced by 1.1, 1.5, 2, 2,5 and 3 µm bubbles are plotted. Above the transition point, the stresses increase with a steeper slope.
Fig. 10.
(a) Shear stress, (b) Circumferential stress and (c) Transmural pressure exerted by 1.1, 1.5, 2, 2.5 and 3 µm bubbles on 5 µm vessels at different acoustic pressures. Filled squares indicate the pressure at which the transition point occurs.
Fig. 11 shows the stress values induced by bubbles on a flat wall, according to the geometry in Fig. 1c. While varying bubble size and acoustic frequency, the maximum shear stress and transmural pressure are shown for a mechanical index of 0.134. The stresses in Fig. 11 reach a peak at bubble sizes of 3, 4 and 7 µm which are larger than the resonance size at each frequency. Among the three frequencies chosen here, the shear stress and the transmural pressure peaks reached about 12 kPa and 400 kPa respectively.
Fig. 11.
Stresses induced by different bubbles at a flat wall, sonicated at 0.551 MHz (Dash-dotted line with inverted triangles), 1 MHz (Dashed line with diamonds) and 1.5 MHz (Solid line with circles) at a constant MI = 0.134, (a) Shear stress, and (b) Transmural pressure.
IV. DISCUSSION
A. Acoustic Emissions
A bubble oscillating within a compliant small elastic vessel will experience increased damping and a resonant frequency shift upwards. For the majority of conditions examined here the bubbles are well below the resonant size (6 µm in the unbound case; 6.5 within a 10 um vessel) at 0.551 MHz. As such the effects of damping and resonant frequency shift will act to reduce the oscillation amplitudes and therefore acoustic emission levels (Fig. 7).
A shift in the harmonic energy was observed and normalized second harmonics had a "transition point" which was bubble size dependent (Fig. 8). Simulations of unencapsulated bubbles did not exhibit the transition point (data not shown), meaning that the appearance of this feature is attributed to the bubble shell. As shown in Fig. 2, this appears to be associated with a transition from compression dominated oscillations, which occur within a regime where shell buckling dominates, to expansion dominated oscillations. The second harmonics in our simulations had a dramatic rise with pressure above the transition point (the absolute values of acoustic emissions presented a dramatic rise as well as shown in Fig. 5). This was generally in line with the observations by McDannold et al. [7], where the second harmonic had a dramatic rise at pressure amplitudes that correlated with BBB opening. The transition point could potentially serve as an in vivo pressure calibration and should be experimentally tested for its value to guide and control BBB opening.
The emissions from a bubble population were investigated, taking into account the expected bubble size distribution. The transition point for confined bubbles within 5 µm vessels occurred at a higher pressure in comparison to that of unbound bubbles (Fig. 10). This was due to larger damping of the vasculature and an upward shift in the resonant frequency. Furthermore, the second and fourth harmonics of confined bubble population (at 100 kPa and 125 kPa respectively) were larger than that of unbound bubbles. In the future, the transition point pressures and acoustic emissions (particularly second and fourth harmonics) from a confined versus an unbound bubble population should be tested experimentally. This would provide a mean for the confined versus unbound bubble separation.
Although the transition point for confined and unbound bubble populations were different, the pressure dependency of transition point can be more distinct when mono-disperse bubble distributions are used. Thus, using mono-disperse bubbles in the future (such as those developed in [28] for therapeutic purposes) could provide a more accurate mean to monitor and control the BBB opening experiments.
B. Vessel Wall Stresses
In Fig. 10, a steeper slope in the stresses above the transition point is observed. From a physical perspective, this transition is associated with entry into a regime where the expansion phase of the bubble oscillations is more prominent which is in term associated with inducing a proportionally higher level of fluid flow (and therefore shear stress) at the vessel wall. At 0.551 MHz, the experimental threshold for BBB opening occurred from 0.18 MPa (with a mean at 0.28 MPa) [11]. The wall stresses at pressures above the transition point could be correlated to pressures that cause BBB opening. It is important to note that the shear stress, circumferential stress and transmural pressure have similar trends with the acoustic pressure. Therefore, at the current stage it is not clear that which one is responsible for the BBB opening. The experimental measurements revealed a safe BBB opening at the pressure levels used here, and only a few cases of red blood cell extravasations were observed [11].
The stresses reported here were from numerical calculations. To the best of our knowledge, currently there are no experimental techniques to measure the vessel wall stresses directly at a few micrometer scale and megahertz frequencies. The shear stress is typically calculated using the Micro Particle Image Velocimetry (µPIV) or temperature anemometer; however, these techniques are limited to larger bubbles (a few hundred microns) [29], [30]. Previously circumferential stress was measured by varying the intravascular pressures of frog microvascular endothelium [31]. In their study, exceeding the vascular strength of 0.8 MPa caused vascular ruptures leading to red blood cell extravasations. However, this experiment was performed in static conditions without bubbles. The stresses calculated from other numerical simulations [32] are in the same order of magnitude as those reported in the current study. Furthermore, our bubble model was validated previously with experimental data, in which vessel wall movements were measures and resultant vascular wall stresses were calculated [16].
The results in Fig. 11 show that wall stresses are bubble size and frequency dependent. If large bubbles are considered to be present (specially at 0.551 MHz), then the stress peaks induced from bubbles above resonance (i.e. 3, 4 and 7 µm bubbles) are approximately constant at each frequency. McDannold et al. [10] found that BBB opening was constant at a constant MI. This could indicate that bubble induced stresses are related to the BBB opening.
It was previously shown that the extent of BBB opening varied with the bubble size [33]. They reported thresholds for BBB opening of 0.30–0.46 MPa when 1–2 µm in diameter was used at 1.525 MHz transmit frequency. This threshold was 0.15–0.30 in case of 4–5 µm bubbles in diameter. In Fig. 10, the stress calculations from larger bubbles inside 5 µm vessels was higher. In addition, our results in Fig. 11 shows that at 1.5 MHz, 4–5 µm bubbles in diameter exert larger wall stresses compared to 1–2 µm bubbles in diameter. In the future, BBB opening experiments with high resolution imaging techniques (e.g. two-photon fluorescence microscopy), preferentially using mono-disperse bubbles, together with simulations are needed to bring further insights into the stress values related to the BBB opening and vessel wall damage.
C. General Discussion and Model Limitations
In this study, some of the acoustic pressures used in the simulations might be smaller than the required pressure for BBB opening. First, the maximum pressures that are reported correspond to the point at which a collapse occurs, with collapse defined as being when the two opposite side of the bubble come into contact. After that point, the simulations cannot continue, but it is reasonable to expect that in reality bubbles may continue to oscillate after this point and this is simply a limitation of our simulations. Second, it is notable that the maximum pressures employed decrease with bubble size, in other words the collapse threshold increases with decreasing bubble size. For a 1.1 micron bubble, this occurs at 330 kPa and therefore we are able to examine stresses for this bubble size up until 300 kPa. For this size, a transition point occurred in the vicinity of 175 kPa and stresses increase rapidly until 300 kPa. This is close to the experimentally measured threshold of 280 kPa reported in [11], which itself was subject to uncertainty related to path length attenuation. Given that 93.5% of Definity bubbles measured experimentally have a radii smaller than 1.1 µm [15], it is not unreasonable to suggest that these values are within a range that is consistent with previous experiments. It should also be noted that in vitro measurements of bubble sizes may differ from in vivo sizes due to changes while circulating.
In experiments performed by O’Reilly and Hynynen [11], ultraharmonics (harmonics of the subharmonic, i.e. 3/2 or 5/2 of the transmit frequency of 0.551 MHz) were detected and used as a control parameter for the BBB opening. In their experiments, ultraharmonics appeared in the second half of the 10 ms pulse. However, our numerical simulations were limited to 40 µs, and subharmonics or ultraharmonics were not detected. It should also be noted that modeling of the subharmonic oscillations for the purposes of quantitative interpretation is a challenge (arguable much more so than for harmonics) in that the results are highly sensitive to the form and initial state of the elasticity and viscosity values as a function of radial strain. In addition, lipid encapsulated microbubbles with a size between the resonance and twice the resonance have lowest thresholds for subharmonic emissions (e.g. Katiyar and Sarkar [34]). At 0.551 MHz, an unbound 6 µm bubble in radius is at resonance. Therefore, subharmonic emissions are expected to arise from 6 µm bubbles or larger, and most of the bubble sizes in our simulations were below 6 µm.
The presence of such large bubbles in the microvasculature is debatable as majority of Definity bubbles are below 3 µm in radius [15]. However, the long acoustic bursts which are used for therapeutic ultrasound could cause microbubbles to coalesce [35]–[37] or undergo rectified diffusion [38], leading to the formation of larger bubbles. In our numerical model, coalescence or rectified diffusion were not taken into account. The model used here was 2-dimensional and axis-symmetric, and bubbles were assumed to be in the middle of the vessel to reduce computational complexity. In reality, bubbles may be pushed towards one side of the microvessel wall due to the primary radiation force. However our simulations still accounts for the general effects of confinement on the bubble oscillation.
As shown in Figs. 2 and 3, bubbles underwent non-spherical oscillations. Note the periodicity of these oscillations, under conditions that produce stable oscillations, is at the transmit frequency. This differs from surface mode oscillations which have oscillation periods that are twice that of the insonation frequencies. Surface modes were also observed in the simulations (data not shown), but for higher transmit frequencies as the surface mode resonant frequencies are for bubble sizes that are larger than the microvessel sizes examined in this study (e.g. Versluis et al. [39]).
It was also observed that bubbles collapsed within 5 µm vessels (Fig. 4), where the collapse pressure threshold was lower for larger bubbles. The same unbound bubbles at the corresponding threshold pressures did not collapse, but rather underwent stable oscillations. This implies that confined bubbles are more likely to undergo inertial cavitation. Fragmentation, shell rupture and shedding, and gas release could be the potential mechanisms following the bubble collapse. However, our numerical model is limited and does not take these mechanisms into account. In previous studies, the appearance of inertial cavitation was associated with the bubble fragmentation [40], [41]. Postema et al. [42] reported that in most of the fragmentation cases other bubbles were present near the fragmenting bubble which may induce surface instabilities. The same analogy can be used where the presence of an elastic nearby vessel wall could have the same effect on oscillating bubbles and thus lowering the inertial cavitation threshold. However, the focus of the current study was rather on acoustic emissions and vessel wall stresses evaluated at pressures below the collapse threshold.
The results reported here were necessarily constrained to specific parameters for the vessel properties and microbubble shell properties. The selected values were within a reasonable range of what is expected to be realistic, but the results are influenced by these values. For example, bubble oscillations would be more damped within more rigid vasculature, which may represent a tumorous tissue with high interstitial fluid pressure levels. Definity bubbles are widely approved and used clinically for diagnostic purposes and has been widely investigated in pre-clinical BBB opening experiments. In this study, the properties of Definity bubbles were chosen to correlate with the former experimental study [11]. It is speculated that the bubble behaviour observed here could be extended to other phospholipid agents (e.g. SonoVue) as well. In order to investigate the sensitivity of the results to the shell elasticity and viscosity parameters, a test simulations was performed on an unbound 1.1 µm bubble at 150 kPa using the Marmottant model (at 0.551 MHz). SonoVue bubbles (another agent used for the BBB opening experiments) were chosen that have lower shell elasticity and viscosity values than Definity [43]. When the shell viscosity was reduced six-fold (from 1.2×10⁻⁸ kg s−1 to 2×10⁻⁹ kg s−1), the maximum bubble expansion increased by 3% at 150 kPa. A decrease in the shell elasticity by 50% (from 0.7 N/m to 0.35 N/m) resulted in a 3% (for both 150kPa) increase in the maximum bubble expansion. Therefore, the results were not sensitive to changes in the shell elasticity and shell viscosity at 150 kPa. In this study, we used the Marmottant shell model which is a widely employed model that accounts for strain dependant shell elasticity based on heuristic assumptions (i.e. the presence of buckling, elastic and rupture regimes). It was assumed that the bubble is initially at the bucking state (γ(A0) = 0), while in reality initial effective surface tension, γ(A0), is an unknown parameter and there can be variation in this value in practice. In order to investigate the influence of the initial surface tension on the transition point, a test simulation on a 1.1 µm bubble close to the buckling state in an unbound fluid was performed. The initial surface tension was set to γ(A0) = 0.005 and Pg0 = P0 + 2 γ(A0)/R0 was replaced with Pg0 = P0 in (3). This was performed at 0.551 MHz and at 100– 200 kPa. As the result, for γ(A0) = 0.005 the pressure corresponding to the transition point was unchanged compared to the case of zero initial surface tension. Future experimental interrogations on individual phospholipid bubbles as well as bubble populations could validate the occurrence of transition point and calibrate the pressures at which it happens.
V. CONCLUSION
A comprehensive model of a coupled bubble-fluid-vessel system has been developed and numerical simulations were performed. In the context of blood-brain barrier opening, this study aims to assess the effects of the vessel wall on acoustic emissions and vessel wall stresses. Bubbles confined within small vessels presented with non-spherical oscillations. The acoustic emissions from bubbles excited at pressures below the collapse threshold were assessed. At 0.551 MHz, a bubble oscillating within a small vessel experienced increased damping and a resonant frequency shift upwards. This led to lower acoustic emissions in confined bubbles. The normalized second harmonic to the fundamental increased with acoustic pressure followed by a minima, called a transition point, which was bubble size dependent. This harmonic could potentially be used in treatment monitoring. The transition point of an unbound compared to confined bubble populations occurred at different pressures providing a means for confined and unbound bubbles separation. The stresses induced by different bubbles on 5 µm vessels were calculated. Following the transition point these stresses rose with a steeper slope which could be correlated to BBB opening. Bubbles of different sizes were placed close to an elastic wall and driven at various acoustic frequencies (constant mechanical index) to assess the mechanical stresses. The wall stresses were bubble size and frequency dependent. The stress peaks induced by bubbles above the resonance (i.e. 3, 4 and 7 µm bubbles at 1.5, 1 and 0.551 MHz respectively) were constant at each frequency. Numerical simulations of a coupled bubble-fluid-vessel system could provide insight into BBB opening for control, pressure calibration and bubble manufacturing.
Acknowledgment
The authors would like to thank Drs Peter Burns, David Steinman and Meaghan O’Reilly for helpful discussions.
Support for this work was provided by the National Institutes of Health under grant no EB003268, and the Canada Research Chair Program.
Contributor Information
Nazanin Hosseinkhah, Sunnybrook Research Institute and Department of Medical Biophysics, University of Toronto, Toronto, on M4N3M5, Canada (nazanin@sri.utoronto.ca).
David E. Goertz, Sunnybrook Research Institute and Department of Medical Biophysics, University of Toronto, Toronto, on M4N3M5, Canada (goertz@sri.utoronto.ca)
Kullervo Hynynen, Sunnybrook Research Institute and Department of Medical Biophysics, University of Toronto, Toronto, on M4N3M5, Canada (khynynen@sri.utoronto.ca).
References
- 1.Hynynen K, Mcdannold N, Vykhodtseva N, Jolesz FA. Noninvasive mr imaging-guided focal opening of the blood-brain barrier in rabbits. Radiology. 2001;220(3):640–646. doi: 10.1148/radiol.2202001804. [DOI] [PubMed] [Google Scholar]
- 2.Abbott NJ, Romero IA. Transporting therapeutics across the blood-brain barrier. Mol. Med. Today. 1996;2(3):106–113. doi: 10.1016/1357-4310(96)88720-x. [DOI] [PubMed] [Google Scholar]
- 3.Pardridge WM. The blood-brain barrier: bottleneck in brain drug development. NeuroRx. 2005;2(1):3–14. doi: 10.1602/neurorx.2.1.3. [DOI] [PMC free article] [PubMed] [Google Scholar]
- 4.O’Reilly MA, Hynynen K. Ultrasound enhanced drug delivery to the brain and central nervous system. Int. J. Hyperthermia. 2012;28(4):386–96. doi: 10.3109/02656736.2012.666709. [DOI] [PMC free article] [PubMed] [Google Scholar]
- 5.Aryal M, Arvanitis CD, Alexander PM, Mcdannold N. Ultrasound-mediated blood-brain barrier disruption for targeted drug delivery in the central nervous system. Adv. Drug Deliv. Rev. 2014;72:94–109. doi: 10.1016/j.addr.2014.01.008. [DOI] [PMC free article] [PubMed] [Google Scholar]
- 6.Vykhodtseva N, Mcdannold N, Hynynen K. Progress and problems in the application of focused ultrasound for blood-brain barrier disruption. Ultrasonics. 2008;48(4):279–96. doi: 10.1016/j.ultras.2008.04.004. [DOI] [PMC free article] [PubMed] [Google Scholar]
- 7.Mcdannold N, Vykhodtseva N, Hynynen K. Targeted disruption of the blood-brain barrier with focused ultrasound: association with cavitation activity. Phys. Med. Biol. 2006;51(4):793–807. doi: 10.1088/0031-9155/51/4/003. [DOI] [PubMed] [Google Scholar]
- 8.Arvanitis CD, Livingstone MS, Vykhodtseva N, Mcdannold N. Controlled ultrasound-induced blood-brain barrier disruption using passive acoustic emissions monitoring. PLoS One. 2012;7(9):e45783. doi: 10.1371/journal.pone.0045783. [DOI] [PMC free article] [PubMed] [Google Scholar]
- 9.Tung YS, Vlachos F, Choi JJ, Deffieux T, Selert K, Konofagou EE. In vivo transcranial cavitation threshold detection during ultrasound-induced blood-brain barrier opening in mice. Phys. Med. Biol. 2010;55(20):6141–55. doi: 10.1088/0031-9155/55/20/007. [DOI] [PMC free article] [PubMed] [Google Scholar]
- 10.Mcdannold N, Vykhodtseva N, Hynynen K. Blood-brain barrier disruption induced by focused ultrasound and circulating preformed microbubbles appears to be characterized by the mechanical index. Ultrasound Med. Biol. 2008;34(5):834–840. doi: 10.1016/j.ultrasmedbio.2007.10.016. [DOI] [PMC free article] [PubMed] [Google Scholar]
- 11.O’Reilly MA, Hynynen K. Blood-brain barrier: real-time feedback-controlled focused ultrasound disruption by using an acoustic emissions-based controller. Radiology. 2012;263(1):96–106. doi: 10.1148/radiol.11111417. [DOI] [PMC free article] [PubMed] [Google Scholar]
- 12.Clement GT, Hynynen K. a non-invasive method for focusing ultrasound through the human skull. Phys. Med. Biol. 2002;47(8):1219–1236. doi: 10.1088/0031-9155/47/8/301. [DOI] [PubMed] [Google Scholar]
- 13.Tu J, Swalwell JE, Giraud D, Cui W, Chen W, Matula TJ. Microbubble sizing and shell characterization using flow cytometry. IEEE Trans. Ultrason. Ferroelectr. Freq. Control. 2011;58(5):955–963. doi: 10.1109/TUFFC.2011.1896. [DOI] [PMC free article] [PubMed] [Google Scholar]
- 14.Helfield BL, Goertz DE. Nonlinear resonance behavior and linear shell estimates for Definity™ and MicroMarker™ assessed with acoustic microbubble spectroscopy. J. Acoust. Soc. Am. 2013;133(2):1158–1168. doi: 10.1121/1.4774379. [DOI] [PubMed] [Google Scholar]
- 15.Faez T, Goertz D, De Jong N. Characterization of Definity™ ultrasound contrast agent at frequency range of 5–15 MHz. Ultrasound Med. Biol. 2011;37(2):338–342. doi: 10.1016/j.ultrasmedbio.2010.11.014. [DOI] [PubMed] [Google Scholar]
- 16.Hosseinkhah N, Chen H, Matula TJ, Burns PN, Hynynen K. Mechanisms of microbubble-vessel interactions and induced stresses: A numerical study. J. Acoust. Soc. Am. 2013;134(3):1875–1885. doi: 10.1121/1.4817843. [DOI] [PMC free article] [PubMed] [Google Scholar]
- 17.Marmottant P, van der Meer S, Emmer M, Versluis M, de Jong N, Hilgenfeldt S, Lohse D. A model for large amplitude oscillations of coated bubbles accounting for buckling and rupture. J. Acoust. Soc. Am. 2005;118(6):3499–3505. [Google Scholar]
- 18.Gilányi T, Varga I, Gilányi M, Mészáros R. Adsorption of poly(ethylene oxide) at the air/water interface: a dynamic and static surface tension study. J. Colloid Interface Sci. 2006;301(2):428–435. doi: 10.1016/j.jcis.2006.05.034. [DOI] [PubMed] [Google Scholar]
- 19.Duck FA. Physical properties of tissue: a comprehensive reference book. London: Academic; 1990. pp. 1–336. [Google Scholar]
- 20.Smaje LH, Fraser PA, Clough G. The distensibility of single capillaries and venules in the cat mesentery. Microvasc. Res. 1980;20(3):358–370. doi: 10.1016/0026-2862(80)90064-3. [DOI] [PubMed] [Google Scholar]
- 21.Burton AC. Role of geometry, of size and shape, in the microcirculation. Fed. Proc. 1965;25(6):1753–1760. [PubMed] [Google Scholar]
- 22.Melbin J, Noordergraaf A. Elastic deformation in orthotropic vessels: theoretical and experimental results. Circ. Res. 1971;28(6):680–692. doi: 10.1161/01.res.28.6.680. [DOI] [PubMed] [Google Scholar]
- 23.Nhan T, Burgess A, Cho EE, Stefanovic B, Lilge L, Hynynen K. Drug delivery to the brain by focused ultrasound induced blood-brain barrier disruption: quantitative evaluation of enhanced permeability of cerebral vasculature using two-photon microscopy. J. Control. Release. 2013;172(1):274–280. doi: 10.1016/j.jconrel.2013.08.029. [DOI] [PMC free article] [PubMed] [Google Scholar]
- 24.Burgess A, Nhan T, Moffatt C, Klibanov AL, Hynynen K. Analysis of focused ultrasound-induced blood-brain barrier permeability in a mouse model of Alzheimer’s disease using two-photon microscopy. J. Control. Release. 2014;192C:243–248. doi: 10.1016/j.jconrel.2014.07.051. [DOI] [PubMed] [Google Scholar]
- 25.Hilgenfeldt S, Lohse D, Zomack M. Response of bubbles to diagnostic ultrasound: a unifying theoretical approach. Eur. Phys. J. B. 1998;4(2):247–255. [Google Scholar]
- 26.Srivastava AK, Gope PC. Strength of Materials. New Delhi: Prentice-Hall of India Private Limited; 2007. pp. 127–148. [Google Scholar]
- 27.Leighton TG. The inertial terms in equations of motion for bubbles in tubular vessels or between plates. J. Acoust. Soc. Am. 2011;130(5):3333–3338. doi: 10.1121/1.3638132. [DOI] [PubMed] [Google Scholar]
- 28.Castro-Hernández E, van Hoeve W, Lohse D, Gordillo JM. Microbubble generation in a co-flow device operated in a new regime. Lab Chip. 2011;11(12):2023–2029. doi: 10.1039/c0lc00731e. [DOI] [PubMed] [Google Scholar]
- 29.Collis J, Manasseh R, Liovic P, Tho P, Ooi A, Petkovic-Duran K, Zhu Y. Cavitation microstreaming and stress fields created by microbubbles. Ultrasonics. 2010;50(2):273–279. doi: 10.1016/j.ultras.2009.10.002. [DOI] [PubMed] [Google Scholar]
- 30.Dijkink R, Ohl C, Wave N. Measurement of cavitation induced wall shear stress. Appl. Phys. Lett. 2008;93(25):254107–224103. [Google Scholar]
- 31.Neal CR, Michel CC. Openings in frog microvascular endothelium induced by high intravascular pressures. J. Physiol. 1996;492(1):39–52. doi: 10.1113/jphysiol.1996.sp021287. [DOI] [PMC free article] [PubMed] [Google Scholar]
- 32.Wiedemair W, Tukovic Z, Jasak H, Poulikakos D, Kurtcuoglu V, Tuković Z. On ultrasound-induced microbubble oscillation in a capillary blood vessel and its implications for the blood-brain barrier. Phys. Med. Biol. 2012;57(4):1019–1045. doi: 10.1088/0031-9155/57/4/1019. [DOI] [PubMed] [Google Scholar]
- 33.Choi JJ, Feshitan JA, Baseri B, Wang S, Tung Y-S, Borden MA, Konofagou EE. Microbubble-size dependence of focused ultrasound-induced blood-brain barrier opening in mice in vivo. IEEE Trans. Biomed. Eng. 2010;57(1):145–154. doi: 10.1109/TBME.2009.2034533. [DOI] [PMC free article] [PubMed] [Google Scholar]
- 34.Katiyar A, Sarkar K. Excitation threshold for subharmonic generation from contrast microbubbles. J. Acoust. Soc. Am. 2011;130(5):3137–3147. doi: 10.1121/1.3641455. [DOI] [PMC free article] [PubMed] [Google Scholar]
- 35.Postema M, Marmottant P, Lancee CT, Versluis M, Hilgenfeldt S, de Jong N. Ultrasound-induced coalescence of free gas microbubbles,” in. IEEE Ultrasonics Symposium. 2004;1:1–4. [Google Scholar]
- 36.Postema M, Bouakaz A, Versluis M, de Jong N. Ultrasound-induced gas release from contrast agent microbubbles. IEEE Trans. Ultrason. Ferroelectr. Freq. Control. 2005;52(6):1035–1041. doi: 10.1109/tuffc.2005.1504026. [DOI] [PubMed] [Google Scholar]
- 37.Chen H, a Brayman A, Evan AP, Matula TJ. Preliminary observations on the spatial correlation between short-burst microbubble oscillations and vascular bioeffects. Ultrasound Med. Biol. 2012;38(12):2151–2162. doi: 10.1016/j.ultrasmedbio.2012.08.014. [DOI] [PMC free article] [PubMed] [Google Scholar]
- 38.Flynn HG. A mechanism for the generation of cavitation maxima by pulsed ultrasound. J. Acoust. Soc. Am. 1984;76(2):505–512. doi: 10.1121/1.391592. [DOI] [PubMed] [Google Scholar]
- 39.Versluis M, Goertz DE, Palanchon P, Heitman IL, van der Meer SM, Dollet B, de Jong N, Lohse D. Microbubble shape oscillations excited through ultrasonic parametric driving. Phys. Rev. E. 2010;82(2):026321. doi: 10.1103/PhysRevE.82.026321. [DOI] [PubMed] [Google Scholar]
- 40.Chomas JE, Dayton P, May D, Ferrara K. Threshold of fragmentation for ultrasonic contrast agents. J. Biomed. Opt. 2001;6(2):141–150. doi: 10.1117/1.1352752. [DOI] [PubMed] [Google Scholar]
- 41.Ammi AY, Cleveland RO, Mamou J, Wang GI, Bridal SL, WDO Ultrasonic contrast agent shell rupture detected by inertial cavitation and rebound signals. IEEE Trans. Ultrason. Ferroelect. Freq. Control. 2006;53:126–136. doi: 10.1109/tuffc.2006.1588398. [DOI] [PMC free article] [PubMed] [Google Scholar]
- 42.Postema M, de Jong N, Schmitz G. Shell rupture threshold, fragmentation threshold, blake threshold. IEEE Ultrason. Symp. 2005;3(1):1708–1711. [Google Scholar]
- 43.Tu J, Guan J, Qiu Y, Matula TJ. Estimating the shell parameters of SonoVue microbubbles using light scattering. J. Acoust. Soc. Am. 2009;126(6):2954–2962. doi: 10.1121/1.3242346. [DOI] [PMC free article] [PubMed] [Google Scholar]


