

Abstract
Oscillatory behavior of mitochondrial inner membrane potential (ΔΨm) is commonly observed in cells subjected to oxidative or metabolic stress. In cardiac myocytes, the activation of inner membrane pores by reactive oxygen species (ROS) is a major factor mediating intermitochondrial coupling, and ROS-induced ROS release has been shown to underlie propagated waves of ΔΨm depolarization as well as synchronized limit cycle oscillations of ΔΨm in the network. The functional impact of ΔΨm instability on cardiac electrophysiology, Ca2+ handling, and even cell survival, is strongly affected by the extent of such intermitochondrial coupling. Here, we employ a recently developed wavelet-based analytical approach to examine how different substrates affect mitochondrial coupling in cardiac cells, and we also determine the oscillatory coupling properties of mitochondria in ventricular cells in intact perfused hearts. The results show that the frequency of ΔΨm oscillations varies inversely with the size of the oscillating mitochondrial cluster, and depends on the strength of local intermitochondrial coupling. Time-varying coupling constants could be quantitatively determined by applying a stochastic phase model based on extension of the well-known Kuramoto model for networks of coupled oscillators. Cluster size-frequency relationships varied with different substrates, as did mitochondrial coupling constants, which were significantly larger for glucose (7.78 × 10⁻² ± 0.98 × 10⁻² s−1) and pyruvate (7.49 × 10⁻² ± 1.65 × 10⁻² s−1) than lactate (4.83 × 10⁻² ± 1.25 × 10⁻² s−1) or β-hydroxybutyrate (4.11 × 10⁻² ± 0.62 × 10⁻² s−1). The findings indicate that mitochondrial spatiotemporal coupling and oscillatory behavior is influenced by substrate selection, perhaps through differing effects on ROS/redox balance. In particular, glucose-perfusion generates strong intermitochondrial coupling and temporal oscillatory stability. Pathological changes in specific catabolic pathways, which are known to occur during the progression of cardiovascular disease, could therefore contribute to altered sensitivity of the mitochondrial network to oxidative stress and emergent ΔΨm instability, ultimately scaling to produce organ level dysfunction.
Introduction
Oscillatory behavior in mitochondria was reported more than 40 years ago and ΔΨm instability, ranging from localized flickers to synchronized mitochondrial network oscillations, has been observed in intact cells subjected to oxidative, ischemic, or metabolic stress by numerous investigators (for review, see Aon et al. (1)). In cardiac myocytes, the latticelike morphological organization of the mitochondrial network lends itself to complex spatiotemporal phenomena, including ΔΨm oscillations and waves (2), oscillations of individual (3,4) or clusters of mitochondria (5), and network-wide limit-cycle oscillations in cells (6–8) and tissues (9). Reactive oxygen species (ROS)-induced ROS release (10) among neighboring mitochondria, leading to self-organized synchronization of oscillators, is the leading mechanistic explanation for this type of intermitochondrial communication (5,11), although Ca2+-dependent coupling might also occur during cellular Ca2+ overload (12). Pathophysiological conditions can render the mitochondrial network hypersensitive to widespread ΔΨm collapse or self-organized oscillation, a state referred to as “mitochondrial criticality” (13,14). When such a threshold is crossed, mitochondrial oscillators organize into clusters that can span a subregion of the cell or the whole volume of the myocyte (15,16). Understanding how ΔΨm oscillations are organized in time and space is important because the magnitude of the effects of ΔΨm loss on cardiac electrophysiology (17,18), excitation-contraction coupling (16), and cell survival (19) increases as more and more of the network becomes depolarized, potentially scaling to whole organ dysfunction, for example, causing lethal arrhythmias or myocardial injury during ischemia reperfusion (17).
Mitochondrial synchronization phenomena (i.e., ΔΨm waves or oscillations) have been demonstrated previously for mitochondria in myocytes of intact perfused hearts (20), where the cells are physically and electrically connected through gap junctions; however, it is not known whether the same spatiotemporal mitochondrial network properties apply. Additionally, little is known about the effects of different metabolic substrates on mitochondrial cluster frequency dynamics. The latter might be relevant to the known changes in energy substrate utilization in heart failure (21) and diabetic cardiomyopathy (22).
To address these questions, we have developed wavelet-based analyses of ΔΨm (TMRE fluorescence) oscillations of individual mitochondria in cardiac myocytes under pathophysiological conditions, which can provide a dynamic frequency for each oscillating mitochondrion (23). This allows for detailed classification and analysis of the cluster organization of mitochondria with similar frequencies (7). For mitochondria belonging to the major frequency cluster, the overall cluster size was found to be inversely correlated with the cluster’s mean frequency, suggesting that cluster synchronization to a common oscillatory mode takes longer for larger clusters due to diffusion-mediated processes within the coupling medium (7,24).
To quantify how coupling strength contributes to synchronization among mitochondrial oscillators, we take the analysis further by applying an extended Kuramoto-type model for weakly coupled oscillators to determine coupling constants of the network under different metabolic conditions. Recent studies have used this approach to explain how circadian networks are synchronized through intrinsic frequencies that drift in time (25,26). Most of these models describe phase dynamics through a sinusoidal phase coupling term with a time-independent coupling constant; however, for cardiac myocytes, the observed dynamic transitions in the organization of mitochondrial oscillations suggest that there is time-varying mitochondrial coupling as well, which we take into consideration in this study.
These methods are applied to determine whether mitochondrial oscillations in the intact heart are similar to those in isolated myocytes, and whether substrate selection differentially modulates the dynamics of mitochondrial oscillations.
Materials and Methods
Experimental methods
All experiments have been conducted on intact guinea pig hearts or freshly isolated adult guinea pig ventricular myocytes according to previously described protocols (15,16,27) and in accordance with the Guide for the Care and Use of Laboratory Animals (No. 85-23, 1996, National Institutes of Health, Bethesda, MD) and The Johns Hopkins Animal Care and Use Committee (for more information, we refer to the Supporting Material).
Intact heart experiments
ΔΨm imaging data (Fig. 1 A) corresponds to a retrogradely-perfused heart imaged using a laser scanning two-photon microscope, as described in detail in Slodzinski et al. (20). In brief, the cationic potentiometric fluorescent dye TMRE (tetramethylrhodamine ethyl ester) was used to monitor ΔΨm and images were recorded with a two-photon laser-scanning microscope (MRC-1024MP; Bio-Rad, Hercules, CA) with an excitation at 740 nm (Tsunami Ti:Sa laser; Spectra-Physics, Santa Clara, CA) and an emission band at 605 ± 45 nm. Contractile motion was arrested by perfusion with Tyrode solution containing 20 mM BDM (butanedione monoxime) to suppress contraction (see Whole Heart Preparation in the Supporting Material), and single laser flashes were applied to the region marked by the yellow boxes in Figs. 1 A and S1 A in the Supporting Material.
Figure 1.
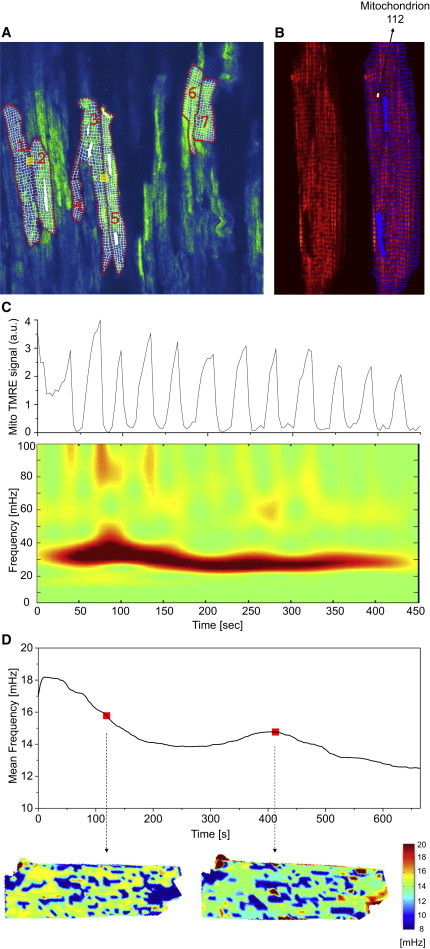
Oscillating mitochondria in two-photon images of TMRE-fluorescent intact guinea-pig heart tissue and isolated cardiomyocytes. (A) Within the optical slice of the perfused heart, cardiac myocytes were selected according to observed depolarizations. Myocyte borders along the sarcolemma and intercalated disks as well as mitochondrial grids were manually applied on a pixel-by-pixel basis. (Yellow boxes) Laser-flashed regions of the myocytes. (B) Isolated cardiac myocyte (left side of panel) and the same myocyte with an overlaid grid to consider single mitochondria (right side of panel), e.g., mitochondrion 112 (mitochondrion 112 denotes the numerical identifier of the selected mitochondrion). (C) TMRE intensity time plot of mitochondrion 112 from (B) and the corresponding absolute squared wavelet transform (lower panel). Visibly, the mitochondrion oscillates between 20 and 40 mHz during the recording. (D) Frequency distribution maps obtained from a different cardiac myocyte. (Upper panel) Time evolution of the averaged frequency of all mitochondria. For two time-points (red dots), the mitochondrial frequency distribution is shown (lower panels): mitochondrial frequency values are put in the respective mitochondrial position and missing pixels are interpolated (see main text for details). The majority of mitochondria oscillate between 14 and 16 mHz. Some of them also have a highly correlated signal at the same time t, thus constituting the major mitochondrial cluster at time t as used in the text.
Isolated cardiomyocyte experiments
Freshly isolated myocytes (Fig. 1 B) were loaded with 100 nM TMRE at 37°C in a thermostatically controlled flow chamber mounted on the stage of an upright epifluorescence microscope (BX61WI; Olympus, Waltham, MA). Their oscillatory behavior was assayed in the presence of different metabolic substrates. Myocytes were visualized with an objective 25×/1.05 W MP and images were acquired using a multiphoton-excited fluorescence Fluoview FV1000 MPE (Olympus) and a Deep Sea ultrafast system scanning laser (Mai Tai, Waltham, MA). Images were recorded with excitation at 740 nm and the red emission of TMRE collected at 605 nm using a 578–630 nm band-pass filter.
For imaging, myocytes were perfused with Tyrode solution (pH 7.5) containing 1 mM Ca2+ in the presence of 10 mM: glucose or pyruvate or lactate or β-hydroxybutyrate, as indicated. Oscillations were triggered with a localized (5 × 5 μm) laser flash, as previously described in Aon et al. (15).
Selection and processing of individual mitochondrial TMRE signals
Epicardial images of the perfused heart were examined and cells showing mitochondrial ΔΨm oscillations, defined by a decrease of >10% in the whole cell TMRE fluorescence, were analyzed (Fig. 1 A). Myocyte borders along sarcolemma and intercalated disks were manually applied on a pixel-by-pixel basis and grid templates representing the minimal mitochondrial cluster size (typical 1–2 mitochondria per sarcomere), excluding the nuclear region, were constructed for each selected myocyte (Fig. 1 A).
Individual mitochondrial TMRE signals were extracted from stacks of recorded frames of an isolated myocyte by manually applying a grid template to heart myocytes on time-averaged stack images. Further spatiotemporal processing was done using wavelet analysis (7,23) (Fig. 1 C), as previously described in Kurz et al. (7,23). Selection of wavelet parameters, cutoff frequencies, normalization of mitochondrial TMRE signals, and determination of maximal wavelet power frequencies were carried out as described previously in Kurz et al. (7,23). (A more detailed description can be found in Selection and Processing of TMRE Fluorescence from Individual Mitochondria in Isolated Cardiac Myocytes in the Supporting Material.)
Computational model
To study mitochondrion-to-mitochondrion coupling within clustered and nonclustered mitochondria, we sought to develop a minimum-order model that employs two parameters to characterize coupling: a mitochondrion-to-mitochondrion coupling constant, and the intrinsic oscillatory frequency.
Identification of mitochondrial nearest neighbors was used as in Kurz et al. (7) to determine the mitochondrial network’s structural morphology. To examine the network’s connectivity properties, intermitochondrial coupling was only considered for local nearest-neighbor environments.
Wavelet phases were extracted from each individual mitochondrial TMRE (for more details, see Selection and Processing of TMRE Fluorescence from Individual Mitochondria in Isolated Cardiac Myocytes in the Supporting Material.) Wavelet frequencies are nondifferentiable in time at points of frequency change (phase singularity), therefore, wavelet frequencies were taken as dynamical wavelet phase updates with the value of the actual wavelet frequency as the starting point. The resulting updated wavelet frequency was median-filtered to correct for frequency changes at phase singularities.
Within the stochastic coupling model of the mitochondrial network, mitochondrial intrinsic frequencies are modeled as Ornstein-Uhlenbeck frequencies that drift in time towards the respective measured mitochondrial frequency (26,28),
| (1) |
where μm represents the mean frequency towards which the intrinsic mitochondrial frequency is drifting, ηm is a Gaussian white noise source with variance = 2γ, γ represents the decay rate, and is the amplitude of mitochondrial frequency fluctuations (25,26). The mean frequency μm was chosen as the time-dependent wavelet frequency of the m-th mitochondrion, whereas the free constant γ was assumed to be identical for each mitochondrion in the network. The frequency fluctuation amplitude measure, σm, for each mitochondrion, was taken as the standard deviation of the measured mitochondrial wavelet frequency. Discrete dynamical updates were performed to calculate the mitochondrial intrinsic frequencies (29).
Local mitochondrial coupling was considered to be of local mean field type, and local mean field parameters Rm(t) and ψm(t), corresponding to mitochondrion m, are defined as
| (2) |
where Lm is the set of nearest neighbors of a mitochondrion (compare to Rougemont and Naef (25,26)) and |Lm| is the number of nearest neighbors. This corresponds to phase differential equations of the form
| (3) |
for each mitochondrion m.
Maximum likelihood estimation was applied to optimize the model parameter γ within the interval [0,1]. With the optimal decay rate parameter, the coupling constants Km(t) were evaluated for 10 different starting points ωm(0) and 100 different dynamically evolving Ornstein-Uhlenbeck frequencies ωm, respectively, as above.
Stochastic phase model
Because mitochondrial ΔΨm oscillations exhibit dynamically changing frequencies, we extended the Kuramoto model to include frequencies that can drift in time. This can be done by introducing a second timescale 1/γ, γ being a measure of the stability of the phase oscillator (26), to model frequency dynamics as Ornstein-Uhlenbeck processes (25,26).
In Ornstein-Uhlenbeck processes, the frequency dispersion σm is a measure of frequency noise whereas γ is a measure of the intrinsic frequency to adhere to a fixed frequency μm, thus revealing the stability of the oscillator (compare to Lemons (29)). Variation of γ follows exponential dynamics: large γ-values yield intrinsic frequencies that are more dependent on the Gaussian white-noise term, and thus show a stronger drift than those with small γ (26,30).
In addition to dynamically changing intrinsic frequencies, phase coupling was assumed to underlie dynamical changes as well, to be unique for each mitochondrion and, for each mitochondrion and its nearest neighbors, to be of local mean field type (Fig. 2). Each mitochondrion’s wavelet frequency was determined according to protocols established in 2010 (7,23) and each mitochondrion’s frequency fluctuation amplitude σm was taken as the standard deviation of the measured mitochondrial wavelet frequency. Moreover, the mean frequency toward which the intrinsic frequencies drift in time was taken as the time-dependent mitochondrial wavelet frequency, thus leaving only the decay rate parameter γ fixed for all mitochondria in a cardiac myocyte.
Figure 2.
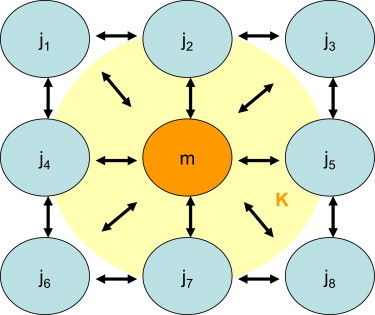
Schematic of local intermitochondrial coupling. In the stochastic phase model, intermitochondrial coupling was only considered for the local nearest-neighbor environment, thus providing an average coupling constant K for each mitochondrion (symbolized by the light-colored cloud). To see this figure in color, go online.
Statistics
The wavelet analysis fitting routines were obtained using the software MATLAB (Ver. 7.1.0.246, R14, The MathWorks, Natick, MA). Further statistics were performed using the software ORIGINPRO 8 (SR0 Ver. 8.0724, B724, OriginLab, Northampton, MA).
Results
Frequency and cluster-size relationship in whole heart
To examine whether the individual mitochondrial TMRE signals in the intact heart exhibit dynamic properties similar to those of isolated cardiac myocyte, the time course of mitochondrial fluorescence was extracted from a hand-drawn grid of recorded stack images averaged over time. Because the mitochondrial signal is nonstationary in time, wavelet transforms are an adequate time-frequency representation for temporal processing (31). This approach allowed us to filter all mitochondria with similar dynamical frequency behavior in order to identify mitochondrial frequency clusters and examine their spatial correlates (7). In brief, frequency histograms were obtained for each myocyte at every time-point t and the maximum peak of mitochondria with similar frequencies, i.e., mitochondria belonging to a (major) frequency cluster, was determined as the major cluster peak.
Subsequently, mitochondria belonging to peaks neighboring the major cluster peak were incorporated into the cluster if their signal at t was highly correlated to the cluster signal. More details can be found in Kurz et al. (7) and in Selection and Processing of TMRE Fluorescence from Individual Mitochondria in Isolated Cardiac Myocytes in the Supporting Material. In Fig. 1 D, the distribution of frequencies for a glucose-perfused isolated myocyte is exemplarily shown in a two-dimensional image at two specific time-points (lower panel; the lower cutoff frequency is 8.2 mHz). To achieve this, the values of mitochondrial frequencies were placed at the pixel-positions of the respective mitochondrion and missing intermitochondrial pixels were interpolated using the GRIDDATA function in the software MATLAB (Ver. 7.6.0.324, R2008a). For the first time-point, it can be seen that many mitochondria that are distributed all over the cell show similar frequencies between 14 and 16 mHz. They belong to the major cluster. Yet, the second image at a later time-point shows a slightly different frequency distribution with most frequencies being located at ∼14 mHz. There is also a newly formed smaller pocket or cluster of mitochondria with frequencies >16 mHz on the right-hand side of the myocyte, that does not necessarily belong to the major frequency cluster.
As in the case of isolated cardiac myocytes, major cluster mitochondria were found for each cardiac myocyte with signs of depolarization during TMRE recording of glucose-perfused hearts (N = 2), close to the left anterior descending coronary artery. We observed that the inverse relationship between relative cluster area and number, as observed in isolated cardiac myocytes, could be confirmed (Fig. 3). Therefore, this indicates that large clusters have a longer oscillation period than small clusters, not only in the case of isolated myocytes, but also for connected cardiac myocytes in the intact heart. However, an inverse relationship between mean cluster radius and frequency could only be verified for one of the two whole heart preparations. The mean cluster radius is found to be in a range approximately one-half the size of that of isolated glucose-treated cardiac myocytes.
Figure 3.
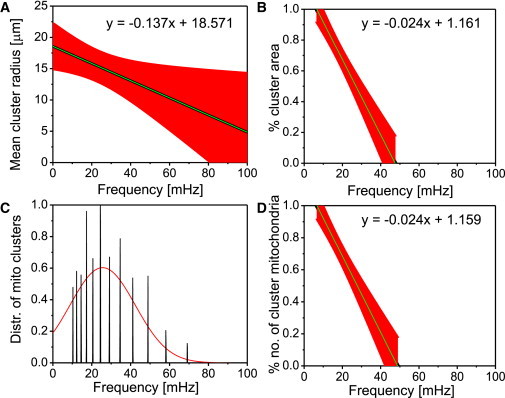
Mitochondrial major cluster properties of cardiac tissue of a guinea pig heart. Depicted are the results obtained from the analysis of seven myocytes for (A) mean cluster radius versus frequency; (B) cluster area normalized by the full myocyte area versus frequency; (C) distribution of mitochondrial frequencies for all cluster mitochondria across all myocytes; and (D) cluster mitochondria count normalized by the total number of mitochondria for the major cluster versus frequency. In the plots, we have (black) mean curve; (red) standard error bars. The apparent discrepancy between the frequency range in (A) and in (B)–(D) is due to interpolation errors in (A). A similar figure for another optical slice of perfused heart tissue can be found in Fig. S1. To see this figure in color, go online.
The rate of change of mean cluster radius with respect to the cluster frequency for glucose-treated myocytes in the intact heart preparation was −0.14 ± 0.01 μm/mHz (Fig. 3 A, and see also Fig. S1 B). Summary statistics of mitochondrial frequency distributions of major cluster mitochondria for all cardiac myocytes of the respective whole heart yields frequency ranges of 10.30–58.1 mHz (Fig. 3 C). Evidently, the range of mitochondrial frequencies in intact heart myocytes is significantly broader than in isolated myocytes, i.e., mitochondria generally oscillate at higher frequencies in the intact heart (see also Fig. S1 B). In Fig. 3 A, this leads to a mean cluster radius of ∼11–17 μm for this preparation.
The rate of change of % area versus frequency for cardiac myocytes was determined as −2.44 ± 0.10 %/mHz (Fig. 3 B). Likewise, the % number of cluster mitochondria versus frequency gave a rate of change of −2.37 ± 0.10 %/mHz (Fig. 3 D). Therefore, for recordings with glucose-perfusion, the respective rate of change of % area and number versus frequency in intact heart cardiac myocytes is ∼18–19% smaller than in isolated cardiac myocytes. Also, the results point out that clusters at whole myocyte level in whole heart preparations have higher frequencies than those in isolated cardiac myocytes. Similar results have been achieved with another optical slice of the intact perfused heart (see Fig. S1, A and B).
Frequency and cluster-size relationship in isolated myocytes
Having demonstrated that mitochondria in the isolated myocyte exhibit properties similar to those in the intact heart, we sought to examine the mitochondrial properties in cardiomyocytes challenged with different substrates.
Major cluster mitochondria were determined for myocytes treated with pyruvate, β-hydroxybutyrate, lactate, or glucose, respectively. Subsequently, the relative area of cluster mitochondria (quotient of total cluster pixel-count and myocyte pixel-count) was plotted against the mean frequency of the cluster (Fig. 4). Similarly, the relative number of cluster mitochondria (quotient of the number of cluster mitochondria versus the total number of mitochondria) was plotted against the mean frequency (see Fig. S3). Also, measures for cluster size were compared with the mean frequency of the cluster mitochondria by relating the mean cluster radius (the distance of the geometrical center of the cluster to each single cluster mitochondrion’s geometrical center averaged over all cluster mitochondria) and the mean frequency of the cluster (see Fig. S2). The inverse relationship among mean mitochondrial mean cluster radius, relative cluster area, and number is obvious and has already been shown for glucose-treated cardiac myocytes (7). This suggests that, throughout all sets of myocytes that are treated with respective substrates, large clusters have a longer oscillation period than small clusters.
Figure 4.
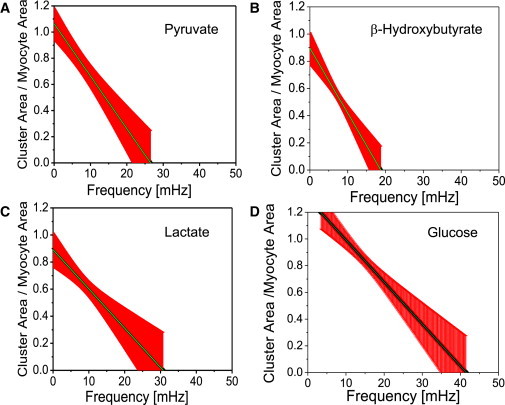
Mitochondrial cluster area normalized by the full myocyte area as a function of frequency. Results obtained for isolated cardiac myocytes perfused with Tyrode solution pH 7.5 containing 1 mM Ca2+ and 10 mM of pyruvate (A, n = 10), β-hydroxybutyrate (B, n = 14), lactate (C, n = 7), or glucose (D, n = 9). To see this figure in color, go online.
Frequency distributions of mitochondria for each specific substrate group were determined as previously described in Kurz et al. (7) (see also Fig. S4). For glucose-treated myocytes, this gives a frequency bandwidth of 8.73–22.3 mHz. In comparison, pyruvate-treated myocytes show a more dispersed frequency distribution that ranges from 3.7 to 54.83 mHz, whereas myocytes from the lactate group are more narrowly distributed with frequencies in the range 3.9–15.0 mHz. Finally, myocytes that were treated with β-hydroxybutyrate mostly displayed major cluster oscillations in the low frequency range of 4.0–10.1 mHz.
The cluster size can be estimated more precisely by the % area of the cluster (quotient of the area of cluster mitochondria and whole myocyte area, Fig. 4). The rate of change of % area versus frequency for glucose-, pyruvate-, lactate-, and β-hydroxybutyrate-treated cardiac myocytes was given as −2.96 ± 1.11 %/mHz, −4.01 ± 0.07 %/mHz, −2.90 ± 0.07 %/mHz, and −4.86 ± 0.07 %/mHz, respectively. Similar results were obtained for the % number of cluster mitochondria (see Frequency and Cluster-Size Relationship in Isolated Myocytes in the Supporting Material). It appears that cardiac myocytes from the β-hydroxybutyrate group show the strongest change of % area versus frequency, i.e., ∼64% more than glucose-treated myocytes. Pyruvate-treated myocytes show a rate of change of % area versus frequency that is ∼35% higher than myocytes from the glucose group. Cardiac myocytes from either the lactate or the glucose group exhibit similar rates of change of % area versus frequency. In addition, myocytes from the β-hydroxybutyrate group show % area versus frequency changes at moderately low frequencies of <20 mHz unlike the other substrates that exhibit % area changes at slightly higher frequencies, especially in glucose-treated cardiomyocytes. Interestingly, the two substrates leading to the most reduced redox potential, pyruvate and β-hydroxybutyrate, have a higher % area of the cluster. Generally, a more rapid drop in % cluster area in nonglucose substrates indicates smaller clusters and lower frequencies as compared with glucose. This is the picture of a more fragmented population of oscillators in smaller clusters, a conclusion reinforced by the higher frequency dispersion exhibited by the oscillators (Fig. S4).
Cluster oscillation coherence
There is no significant change in the coherence of the cluster mitochondria during the recording across substrate groups, thus indicating high temporal stability of the respective oscillating cluster mitochondria (see Fig. S5). However, coherence of cluster mitochondria averaged in time were highest in glucose-treated cardiac myocytes at 0.66 ± 0.04, whereas coherence values in the pyruvate-, lactate-, and β-hydroxybutyrate-treated substrate groups were 0.40 ± 0.03, 0.49 ± 0.04, and 0.49 ± 0.03, respectively. The coherence values between mitochondria that do not belong to the major cluster were determined to be 0.44 ± 0.04, 0.39 ± 0.04, 0.46 ± 0.04, and 0.39 ± 0.03 for glucose-, pyruvate-, lactate-, and β-hydroxybutyrate-treated cardiac myocytes, respectively. Thus, noncluster mitochondria coherence properties were similar for different substrates, exhibiting a relatively high degree of coherence. As suggested in Kurz et al. (7), this may be due to stable oscillations of noncluster mitochondria at frequencies that are different from the frequencies at which major cluster mitochondria oscillate.
The difference in coherence between cluster and noncluster mitochondria for glucose-treated myocytes (7) remains valid for all substrate groups, although it is less pronounced in lactate and pyruvate. This might be due to a decreased level of mitochondrial nearest-neighbor coupling during each depolarization/repolarization. Specifically, in pyruvate-treated cardiomyocytes, smaller and more topologically dispersed ensembles of major cluster mitochondria were observed. This increases the number of mitochondria within the major cluster that have at least one noncluster nearest-neighbor mitochondrion. Also, the number of noncluster nearest neighbors for the majority of individual cluster mitochondria is increased, thus, taken together, providing a lower averaged temporal coherence between a cluster mitochondrion and its nearest neighbors.
Forward model and model validation
To study mitochondrion-to-mitochondrion coupling between cluster and noncluster mitochondria, we sought to develop a minimum-order model that employs two parameters to characterize the coupling: a mitochondrion-to-mitochondrion coupling constant and the intrinsic mitochondrial oscillatory frequency. Such a quantification of intermitochondrial coupling may serve to identify hubs of highly connected mitochondria within ventricular myocytes and thus may contribute to further examine synchronization properties of the mitochondrial network. In addition, individual mitochondrial coupling constants can be used to stochastically simulate large mitochondrial networks and identify possible threshold parameters that may characterize the cell’s descent towards death.
Forward modeling for whole-cell intensity signals with myocyte-specific optimal decay parameter γ and mitochondrial coupling constants was performed by cross-correlating the cosine of the whole-cell TMRE signal wavelet phase with the sum of cosines of the forward-modeled phases of the stochastic model (Figs. S8 and S9).
High correlation coefficients indicate the similarity of predicted signals and the recorded signals, providing validity for the acquired coupling constants. Correlation coefficients for each cardiac myocyte were determined to be 0.88 ± 0.02, 0.64 ± 0.05, 0.85 ± 0.03, and 0.75 ± 0.03 for glucose-, pyruvate-, lactate-, and β-hydroxybutyrate-treated myocytes, respectively (Fig. S9).
Spatiotemporal properties of local coupling in mitochondrial frequency clusters
Time-dependent coupling constants for each mitochondrion in all cardiac myocytes across different substrate groups were determined using the respective optimal decay rate parameters. For each of the substrate-treated myocyte groups, mean decay rate parameters were determined to be 7.13 × 10⁻² ± 1.55 × 10⁻² s−1 and 6.46 × 10⁻² ± 1.14 × 10⁻² s−1 for glucose and β-hydroxybutyrate, respectively, whereas pyruvate and lactate showed slightly smaller decay rate parameters (6.10 × 10⁻² ± 1.26 × 10⁻² s−1 and 6.29 × 10⁻² ± 1.17 × 10⁻² s−1, respectively (Fig. S7)).
Cluster and noncluster mitochondria for each myocyte were determined as detailed above and, for each recorded point in time, coupling constants were averaged for cluster and noncluster mitochondria, to evaluate the time evolution of their respective coupling constants (Fig. 5).
Figure 5.
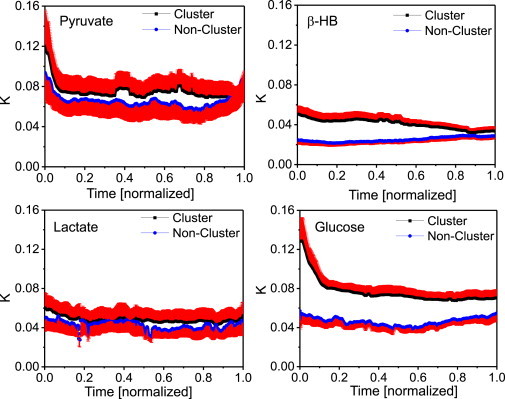
Mean mitochondrial cluster coupling constants (in units [s−1]) versus mean noncluster coupling constants for each point in time for cardiac myocytes perfused with pyruvate, β-hydroxybutyrate, lactate, or glucose. To allow statistical comparison among myocytes with unequal recording time, the duration of the oscillations of each recording was normalized. For pyruvate and lactate, lower ratios of averaged coupling constants for cluster to noncluster mitochondria suggest similar spatiotemporal contiguity properties of the mitochondrial clusters. This contiguity might underlie different metabolic control mechanisms as compared to glucose or β-hydroxybutyrate (compare to Fig. S5). Also, the higher values of cluster coupling constants obtained with pyruvate or glucose might be attributed to larger cluster areas as suggested by Fig. 4.
To compare myocytes with unequal recording time, we set each myocyte’s duration of oscillations to 1. One observes higher coupling strengths for cluster mitochondria in cardiac myocytes perfused with glucose or β-hydroxybutyrate, whereas differences in averaged coupling constants for cluster and noncluster mitochondria in pyruvate or lactate are less pronounced. One can also notice a distinct decrease of cluster coupling constants at the beginning of the recordings for pyruvate- and glucose-perfused myocytes. This might be due to a strong drift from cluster frequencies towards the common cluster frequency for those cluster mitochondria whose frequencies are the farthest away from the common cluster frequency according to Eq. 3 (or Eq. S3 in the Supporting Material).
Averaging in time yields a mean coupling constant of 7.78 × 10⁻² ± 0.98 × 10⁻² s−1 for cluster and 4.40 × 10⁻² ± 0.64 × 10⁻² s−1 for noncluster mitochondria, respectively, in glucose-perfused isolated cardiac myocytes. Pyruvate perfusion gave a similar time-averaged mean coupling constant for cluster mitochondria (7.49 × 10⁻² ± 1.65 × 10⁻² s−1) whereas lactate and β-hydroxybutyrate were found to have lower time-averaged cluster coupling constants (4.83 × 10⁻² ± 1.25 × 10⁻² s−1 and 4.11 × 10⁻² ± 0.62 × 10⁻² s−1, respectively). However, averaged coupling constants for noncluster mitochondria gave 6.56 × 10⁻² ± 1.60 × 10⁻² s−1, 4.24 × 10⁻² ± 1.10 × 10⁻² s−1, and 2.49 × 10⁻² ± 0.34 × 10⁻² s−1 for pyruvate, lactate, and β-hydroxybutyrate, respectively. Distributions of coupling constants were compared across substrates for cluster and noncluster mitochondria, respectively, and found to be significantly different from each other (p < 0.006). In accordance with Fig. 4, lower mitochondrial cluster coupling can be attributed to smaller cluster areas for cell perfusion with β-hydroxybutyrate and lactate. For pyruvate and lactate, lower coupling constants for cluster compared to noncluster mitochondria suggest similar spatiotemporal contiguity properties of the mitochondrial clusters. This contiguity might underlie other metabolic control mechanisms, as in glucose or β-hydroxybutyrate.
However, cluster coherence in β-hydroxybutyrate-perfused cells is higher than for pyruvate (see Fig. S5). In Fig. 6, the mean cluster coupling constant for each myocyte was plotted against its corresponding mean cluster coherence value, across all substrates. One observes that glucose-perfused clusters exhibit an increase in cluster coupling for higher cluster coherence, the rate of change being 0.32 ± 0.03 s−1. The same relation, but to a lesser degree and in line with decreasing cluster size (see Fig. 4), can be observed for β-hydroxybutyrate and pyruvate perfusion. Here, rates of change of cluster coupling versus cluster coherence are 0.09 ± 0.01 s−1 and 0.08 ± 0.03 s−1 for β-hydroxybutyrate and pyruvate, respectively. However, for pyruvate-perfused myocytes, some outliers are noticeable that can be attributed to the early decrease of coupling strength (Fig. 5). For pyruvate perfusion, coherence levels at this point are low, i.e., mitochondria might rapidly drop in and out of the cluster whereas glucose perfusion features the same distinct decrease of early coupling strength for high coherence levels. Generally, larger cluster areas show stronger cluster coupling constants, resulting in more coherent cluster oscillations. Yet for small cluster areas, as in the case of lactate-perfusion, cluster coupling does not increase with cluster coherence: the rate of change is in this case −0.01 ± 0.01 s−1. Therefore, even though a smaller amount of cluster mitochondria might be more coherent, cluster coupling does not necessarily increase as well, indicating a greater influence of spatial than temporal coupling on mitochondrial networks.
Figure 6.
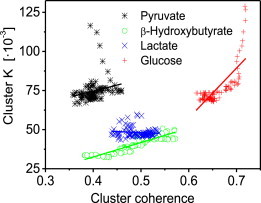
Mean mitochondrial cluster coupling constant K versus mean cluster coherence. For pyruvate-, β-hydroxybutyrate-, and glucose-perfused myocytes, higher cluster coupling values increase with higher cluster coherence values. However, the rate of increase lessens with the size of cluster area (see Fig. 4). For small cluster areas as in the case of lactate-perfused myocytes, cluster coupling does not increase with cluster coherence. Linear fit curves are displayed in their corresponding substrate colors. To see this figure in color, go online.
Discussion
To our knowledge, this study is the first to quantitatively characterize the effects of different substrates on spatiotemporal organization of stress-induced mitochondrial oscillations in the pathophysiological regime. To our knowledge, we have made several novel advances by this study. First, the wavelet-based method demonstrates that mitochondria in the intact heart exhibit properties similar to those in isolated myocytes, thus establishing the isolated myocyte as a reliable model for studying time-dependent frequency modulation of oscillating mitochondria, as well as mitochondrion-to-mitochondrion coupling. Second, different cluster organization properties in response to metabolic status are uncovered, therefore indicating different spatiotemporal properties of the mitochondrial network. Third, a stochastic phase model was introduced that provides a measure of the stability of mitochondrial phase oscillators by quantifying intermitochondrial coupling through a locally defined coupling constant for each individual mitochondrion. Fourth, the phase model reveals significant correlations among intermitochondrial coupling, mitochondrial cluster area, and cluster coherence.
Stress-induced mitochondrial ΔΨm oscillations have previously been shown to occur not only in isolated cardiac myocytes but also for intact hearts (20). These findings extend prior results obtained in single cardiac myocytes (13,15) and computational models (5,32) to the whole heart. Here, we show that mitochondrial collective behavior for clusters of mitochondria with similar frequencies seems to be analogous to that in isolated cardiomyocytes. This could be an indication that metabolic, molecular, and electrical communication via gap junctions between cardiac myocytes does not significantly modify mitochondrial network dynamics under stress. Interestingly, we observed depolarizations within myocytes of the intact heart to be partly spontaneous in some cardiac myocytes after laser-flashing of neighboring myocytes, thus indicating relay properties for mitochondrial coupling agents at intercellular junctions, similar to earlier findings in isolated myocyte pairs (2).
Substrate dependence of mitochondrial network dynamics
Animal models of heart failure show increased myocardial glucose dependence and utilization, compared to fatty acids in the normal heart (21,33). However, the role of glucose in either aiding the myocyte to adapt to increased ATP demand or as a metabolic maladaptive response (while flexibility in substrate utilization remains limited), is still unclear (34,35). Furthermore, the data concerning the energetic substrate switch in human heart failure remain inconsistent (21). The main question behind possible substrate dependence of the mitochondrial network is whether glucose keeps higher synchronicity across the network as compared with other substrates. As shown, glucose-perfused cardiac myocytes demonstrate larger percentiles of cluster area versus myocyte area than other energy suppliers (compare to Fig. 4) whereas cardiac myocytes perfused with β-hydroxybutyrate demonstrated the strongest change in % cluster size versus mean cluster frequency. Also, mitochondrial frequencies were found to be within a narrower low-frequency range in glucose than in the other substrates (Fig. S4). Dispersion in cluster size and frequencies may indicate heterogeneity and less synchrony. Dynamic mitochondrial clusters would form more rapidly during ROS-induced ROS release by recruiting other mitochondrial oscillators, which in turn would leave fewer clusters with different frequencies, thus narrowing the mitochondrial frequency distribution. This finding relates to the problem of synchronization: higher slope and larger frequency distribution represent a signature of desynchronization due to dynamic heterogeneity.
The model presented herein attributes this fundamental feature to time-dependent drifting frequencies of the oscillators. Mechanistically, time-dependent drifting frequencies can be explained by local dynamics of ROS production and ROS scavenging systems involving mitochondrial matrix and the extramitochondrial compartment (36). Interestingly, the two substrates leading to the most reduced redox potential, pyruvate and β-hydroxybutyrate, have higher % area of the cluster than lactate. β-hydroxybutyrate-perfused cardiac myocytes still show lower cluster coupling than cells with pyruvate or glucose perfusion. Metabolically, the major difference between pyruvate and lactate is that cytosolic redox status is bestowed with less (pyruvate) or more (lactate) reducing equivalents available, although both would likely lead to more reduced matrix NADH than in glucose, feeding NADH oxidase. This would concur with an increase in ROS levels and hence higher intermitochondrial coupling rates. Mean coupling for lactate and pyruvate is lower than for glucose, thus indicating more complex redox relations or spatiotemporal coupling properties, as discussed below. However, additional studies will be required to determine the exact role of ROS in substrate-dependent redox processes.
Modeling of large-scale synchronization in mitochondrial dynamics
The concept of scale-free mitochondrial networks has been introduced over the last decade to describe intermitochondrial coupling across different spatiotemporal domains in cardiac myocytes (6,27,37). Recent work extends these findings to mitochondrial networks from other organs such as salivary glands in live animals (9). Using intravital two-photon microscopy, these authors showed ROS-dependent cell- and tissue-wide synchronized mitochondrial oscillations under basal conditions. Weak temporal organization under physiological conditions is strengthened in the pathophysiological regime where the mitochondrial oscillators mostly lock-in low frequency and large amplitude oscillations (17,27). In this regard, cardiac mitochondria, like yeast, have been proposed to possess inherent characteristics of a biological clock (37,38). Mathematical descriptions of the transition of such multiple oscillator networks to synchrony have been addressed by several authors (39,40). These studies show that coupling starts in a synchronized nucleus of excited oscillators that can then recruit new oscillators until a critical mass of oscillators induces spontaneous self-synchronization across the network (27,40).
The introduction of time-drifting frequencies to model circadian network behavior as an extended Kuramoto model with intrinsic Ornstein-Uhlenbeck frequencies (25,26) closely applies to mitochondrial frequency dynamics. This is because, in cardiac myocytes, mitochondrial phase dynamics are subject to time-dependent diffusion-mediated intermitochondrial coupling processes involving ROS production and consumption of antioxidant reserves (6,27). Because ROS scavenging in the cytoplasm restricts the long-range diffusion of the primary coupling agent, signaling of the oscillatory behavior is locally restricted, hence, there is an inherent frequency stiffness towards the actual mitochondrial frequency for each individual mitochondrial oscillator. The proposed model, however, does not consider randomly excitable mitochondria that might suddenly start oscillating or flickering during the course of recording (see, for example, Nivala et al. (11)). This will have an effect on myocytes where the major cluster only constitutes a minority of the network mitochondria as in the case of cardiac myocytes perfused with pyruvate or lactate (see below). However, we show that varying coupling strength has a similar effect on the cluster frequency behavior for all considered myocytes (see Fig. S11), an effect that is in agreement with Chiang et al. (41), where it is shown that a control of the common frequency of a network can be achieved by changing the strength of coupling between its constituents.
Frequency drifts are governed by the value of the decay rate parameter γ at a fixed frequency dispersion of the mitochondrial network; the collective response groups are locked into distinct and incoherent clusters whose formation depends on the proximity of individual frequencies to each other (25). On the other hand, large decay rate parameters decrease the frequency distribution and contribute to equalization of dynamic cluster properties (25,26). Therefore, our results for the decay rate parameter γ indicate that cardiac myocytes perfused with substrates like pyruvate and lactate, which possess slightly smaller γ than glucose or β-hydroxybutyrate, show a greater variety of frequency-locked clusters to some extent. Even though the differences are not significant, this would be consistent with the notion of similar temporal coherence properties of the major frequency cluster and noncluster mitochondria for pyruvate and lactate, and also with spatiotemporal cluster properties that are derived from the relation of % cluster area and mean cluster frequency (see also the Supporting Material).
Mitochondrial ROS-induced ROS release adds to basal ROS concentrations and significantly increases local ROS density for small areas of highly contiguous phase-locked mitochondrial oscillators (42). Because growing clusters lose contiguity and their mean frequency decreases (Figs. 3 and 4), the frequency of local ROS release declines along with ROS levels in nearest-neighbor environments, thus decreasing intermitochondrial coupling (Fig. S10). However, formation of cell-wide spanning clusters (13,27) slightly increases the overall basal ROS concentration, therefore increasing local intermitochondrial coupling as well.
Our results suggest that the correlation between local mitochondrial coupling and mitochondrial cluster frequency is mainly driven by early cluster formation where the averaged coupling constant is mildly (β-hydroxybutyrate and lactate) to strongly (glucose and pyruvate) higher (compare to Fig. 5) than for the rest of the recording. On the other hand, local coupling and % cluster area are mostly determined through low coupling constants at the end of the recordings where most mitochondria have been integrated into the spanning cluster, and cytoplasmic ROS levels increase with % cluster area. Generally, larger cluster areas show stronger intermitochondrial coupling, even though cluster coherence might be low (as in the case of pyruvate). The cluster area is largest when myocytes are perfused with glucose and therefore shows the largest averaged cluster coupling and largest increase in coupling strength for increasing cluster coherence. In addition, because an increase in mitochondrial cluster frequency leads to stronger cluster coupling for all substrates (see Fig. S11), and cluster areas in lactate-perfused cells are smaller than for all other examined substrates, these findings indicate that spatial coupling has a greater effect on synchronized mitochondrial networks than temporal coupling.
Coupling agent ROS in the normal heart is involved in the regulation of homoeostatic and stress response pathways (43) and it has been shown that ROS levels and activity are increased under pathological conditions such as ischemia-reperfusion injury (44) and diabetic cardiomyopathy (22,45). The above results suggest that there is a decrease in intermitochondrial coupling under certain metabolic conditions such as preferred supply of substrates like lactate as opposed to glucose. Such reduced redox-based coupling in mitochondrial networks might impair cardiac energy utilization and may therefore exacerbate heart failure (compare to Ventura-Clapier et al. (46)).
Conclusions
In conclusion, for ventricular cardiac myocytes within the pathophysiological regime of stress-induced synchronized ΔΨm oscillations, this study shows that % cluster area is inversely correlated with cluster mean frequency not only for isolated myocytes perfused with different energy suppliers but also for connected myocytes in the intact heart. The results therefore underline the universality of this correlation that reflects the importance of spatial and temporal organization on network functionality. Also, the study quantifies intermitochondrial coupling by introducing a stochastic phase model that accurately describes mitochondrial network dynamics, and provides insights into changes in mitochondrial network functional topology under different metabolic conditions. Specifically, it is shown that glucose perfusion, in particular, has strong effects on the mitochondrial oscillatory network, generating high intermitochondrial coupling and coherence, and that spatial intermitochondrial coupling is preferred over temporal coupling.
Author Contributions
F.T.K. and A.A.A. designed research; F.T.K., M.A.A., and B.O’R. performed research; F.T.K. contributed analytic tools; F.T.K. and T.D. analyzed data; and F.T.K., M.A.A., B.O’R., and A.A.A. wrote the article.
Acknowledgments
The work was supported by a Boehringer Ingelheim Fonds fellowship given to F.T.K.
Supporting Material
Supporting Citations
References (47–53) appear in the Supporting Material.
References
- 1.Aon M.A., Cortassa S., O’Rourke B. Mitochondrial oscillations in physiology and pathophysiology. Adv. Exp. Med. Biol. 2008;641:98–117. doi: 10.1007/978-0-387-09794-7_8. [DOI] [PMC free article] [PubMed] [Google Scholar]
- 2.Romashko D.N., Marban E., O’Rourke B. Subcellular metabolic transients and mitochondrial redox waves in heart cells. Proc. Natl. Acad. Sci. USA. 1998;95:1618–1623. doi: 10.1073/pnas.95.4.1618. [DOI] [PMC free article] [PubMed] [Google Scholar]
- 3.Loew L.M., Tuft R.A., Fay F.S. Imaging in five dimensions: time-dependent membrane potentials in individual mitochondria. Biophys. J. 1993;65:2396–2407. doi: 10.1016/S0006-3495(93)81318-3. [DOI] [PMC free article] [PubMed] [Google Scholar]
- 4.Siemens A., Walter R., Berns M.W. Laser-stimulated fluorescence of submicrometer regions within single mitochondria of rhodamine-treated myocardial cells in culture. Proc. Natl. Acad. Sci. USA. 1982;79:466–470. doi: 10.1073/pnas.79.2.466. [DOI] [PMC free article] [PubMed] [Google Scholar]
- 5.Zhou L., Aon M.A., O’Rourke B. A reaction-diffusion model of ROS-induced ROS release in a mitochondrial network. PLoS Comput. Biol. 2010;6:e1000657. doi: 10.1371/journal.pcbi.1000657. [DOI] [PMC free article] [PubMed] [Google Scholar]
- 6.Aon M.A., Cortassa S., Lloyd D. Wiley; Weinheim, Germany: 2011. Encyclopedia of Molecular Cell Biology and Molecular Medicine. [Google Scholar]
- 7.Kurz F.T., Aon M.A., Armoundas A.A. Spatio-temporal oscillations of individual mitochondria in cardiac myocytes reveal modulation of synchronized mitochondrial clusters. Proc. Natl. Acad. Sci. USA. 2010;107:14315–14320. doi: 10.1073/pnas.1007562107. [DOI] [PMC free article] [PubMed] [Google Scholar]
- 8.Barabási A.L., Oltvai Z.N. Network biology: understanding the cell’s functional organization. Nat. Rev. Genet. 2004;5:101–113. doi: 10.1038/nrg1272. [DOI] [PubMed] [Google Scholar]
- 9.Porat-Shliom N., Chen Y., Weigert R. In vivo tissue-wide synchronization of mitochondrial metabolic oscillations. Cell Rep. 2014;9:514–521. doi: 10.1016/j.celrep.2014.09.022. [DOI] [PMC free article] [PubMed] [Google Scholar]
- 10.Zorov D.B., Juhaszova M., Sollott S.J. Mitochondrial ROS-induced ROS release: an update and review. Biochim. Biophys. Acta. 2006;1757:509–517. doi: 10.1016/j.bbabio.2006.04.029. [DOI] [PubMed] [Google Scholar]
- 11.Nivala M., Korge P., Qu Z. Linking flickering to waves and whole-cell oscillations in a mitochondrial network model. Biophys. J. 2011;101:2102–2111. doi: 10.1016/j.bpj.2011.09.038. [DOI] [PMC free article] [PubMed] [Google Scholar]
- 12.Ichas F., Jouaville L.S., Mazat J.P. Mitochondria are excitable organelles capable of generating and conveying electrical and calcium signals. Cell. 1997;89:1145–1153. doi: 10.1016/s0092-8674(00)80301-3. [DOI] [PubMed] [Google Scholar]
- 13.Aon M.A., Cortassa S., O’Rourke B. Percolation and criticality in a mitochondrial network. Proc. Natl. Acad. Sci. USA. 2004;101:4447–4452. doi: 10.1073/pnas.0307156101. [DOI] [PMC free article] [PubMed] [Google Scholar]
- 14.Aon M.A., Cortassa S., O’Rourke B. Mitochondrial criticality: a new concept at the turning point of life or death. Biochim. Biophys. Acta. 2006;1762:232–240. doi: 10.1016/j.bbadis.2005.06.008. [DOI] [PMC free article] [PubMed] [Google Scholar]
- 15.Aon M.A., Cortassa S., O’Rourke B. Synchronized whole cell oscillations in mitochondrial metabolism triggered by a local release of reactive oxygen species in cardiac myocytes. J. Biol. Chem. 2003;278:44735–44744. doi: 10.1074/jbc.M302673200. [DOI] [PubMed] [Google Scholar]
- 16.O’Rourke B., Ramza B.M., Marban E. Oscillations of membrane current and excitability driven by metabolic oscillations in heart cells. Science. 1994;265:962–966. doi: 10.1126/science.8052856. [DOI] [PubMed] [Google Scholar]
- 17.Akar F.G., Aon M.A., O’Rourke B. The mitochondrial origin of postischemic arrhythmias. J. Clin. Invest. 2005;115:3527–3535. doi: 10.1172/JCI25371. [DOI] [PMC free article] [PubMed] [Google Scholar]
- 18.Aon M.A., Cortassa S., O’Rourke B. From mitochondrial dynamics to arrhythmias. Int. J. Biochem. Cell Biol. 2009;41:1940–1948. doi: 10.1016/j.biocel.2009.02.016. [DOI] [PMC free article] [PubMed] [Google Scholar]
- 19.Lloyd D., Cortassa S., Aon M.A. What yeast and cardiomyocytes share: ultradian oscillatory redox mechanisms of cellular coherence and survival. Integr. Biol. (Camb). 2012;4:65–74. doi: 10.1039/c1ib00124h. [DOI] [PMC free article] [PubMed] [Google Scholar]
- 20.Slodzinski M.K., Aon M.A., O’Rourke B. Glutathione oxidation as a trigger of mitochondrial depolarization and oscillation in intact hearts. J. Mol. Cell. Cardiol. 2008;45:650–660. doi: 10.1016/j.yjmcc.2008.07.017. [DOI] [PMC free article] [PubMed] [Google Scholar]
- 21.Stanley W.C., Recchia F.A., Lopaschuk G.D. Myocardial substrate metabolism in the normal and failing heart. Physiol. Rev. 2005;85:1093–1129. doi: 10.1152/physrev.00006.2004. [DOI] [PubMed] [Google Scholar]
- 22.Tocchetti C.G., Caceres V., Aon M.A. GSH or palmitate preserves mitochondrial energetic/redox balance, preventing mechanical dysfunction in metabolically challenged myocytes/hearts from type 2 diabetic mice. Diabetes. 2012;61:3094–3105. doi: 10.2337/db12-0072. [DOI] [PMC free article] [PubMed] [Google Scholar]
- 23.Kurz F.T., Aon M.A., Armoundas A.A. Wavelet analysis reveals heterogeneous time-dependent oscillations of individual mitochondria. Am. J. Physiol. Heart Circ. Physiol. 2010;299:H1736–H1740. doi: 10.1152/ajpheart.00640.2010. [DOI] [PMC free article] [PubMed] [Google Scholar]
- 24.Li P., Yi Z. Synchronization of Kuramoto oscillators in random complex networks. Phys. A. 2008;387:1669–1674. [Google Scholar]
- 25.Rougemont J., Naef F. Collective synchronization in populations of globally coupled phase oscillators with drifting frequencies. Phys. Rev. E Stat. Nonlin. Soft Matter Phys. 2006;73:011104. doi: 10.1103/PhysRevE.73.011104. [DOI] [PubMed] [Google Scholar]
- 26.Rougemont J., Naef F. Dynamical signatures of cellular fluctuations and oscillator stability in peripheral circadian clocks. Mol. Syst. Biol. 2007;3:93. doi: 10.1038/msb4100130. [DOI] [PMC free article] [PubMed] [Google Scholar]
- 27.Aon M.A., Cortassa S., O’Rourke B. The fundamental organization of cardiac mitochondria as a network of coupled oscillators. Biophys. J. 2006;91:4317–4327. doi: 10.1529/biophysj.106.087817. [DOI] [PMC free article] [PubMed] [Google Scholar]
- 28.Garcia-Ojalvo J., Elowitz M.B., Strogatz S.H. Modeling a synthetic multicellular clock: repressilators coupled by quorum sensing. Proc. Natl. Acad. Sci. USA. 2004;101:10955–10960. doi: 10.1073/pnas.0307095101. [DOI] [PMC free article] [PubMed] [Google Scholar]
- 29.Lemons D. The Johns Hopkins University Press; Baltimore, MD: 2002. An Introduction to Stochastic Processes in Physics. [Google Scholar]
- 30.Mihalcescu I., Hsing W., Leibler S. Resilient circadian oscillator revealed in individual cyanobacteria. Nature. 2004;430:81–85. doi: 10.1038/nature02533. [DOI] [PubMed] [Google Scholar]
- 31.Grossmann A., Morlet J., Paul T. Transforms associated to square integrable group representations. I. General results. J. Math. Phys. 1985;26:2473–2479. [Google Scholar]
- 32.Cortassa S., Aon M.A., O’Rourke B. A mitochondrial oscillator dependent on reactive oxygen species. Biophys. J. 2004;87:2060–2073. doi: 10.1529/biophysj.104.041749. [DOI] [PMC free article] [PubMed] [Google Scholar]
- 33.Sack M.N., Kelly D.P. The energy substrate switch during development of heart failure: gene regulatory mechanisms (Review) Int. J. Mol. Med. 1998;1:17–24. doi: 10.3892/ijmm.1.1.17. [DOI] [PubMed] [Google Scholar]
- 34.Funada J., Betts T.R., Karpe F. Substrate utilization by the failing human heart by direct quantification using arterio-venous blood sampling. PLoS ONE. 2009;4:e7533. doi: 10.1371/journal.pone.0007533. [DOI] [PMC free article] [PubMed] [Google Scholar]
- 35.Taegtmeyer H., Golfman L., van Arsdall M. Linking gene expression to function: metabolic flexibility in the normal and diseased heart. Ann. NY Acad. Sci. 2004;1015:202–213. doi: 10.1196/annals.1302.017. [DOI] [PubMed] [Google Scholar]
- 36.Kembro J.M., Aon M.A., Cortassa S. Integrating mitochondrial energetics, redox and ROS metabolic networks: a two-compartment model. Biophys. J. 2013;104:332–343. doi: 10.1016/j.bpj.2012.11.3808. [DOI] [PMC free article] [PubMed] [Google Scholar]
- 37.Aon M.A., Roussel M.R., Lloyd D. The scale-free dynamics of eukaryotic cells. PLoS ONE. 2008;3:e3624. doi: 10.1371/journal.pone.0003624. [DOI] [PMC free article] [PubMed] [Google Scholar]
- 38.Aon M.A., Cortassa S., O’Rourke B. Springer; New York: 2008. Is There a Mitochondrial Clock? [Google Scholar]
- 39.Strogatz S. From Kuramoto to Crawford: exploring the onset of synchronization in population of coupled oscillators. Phys. D. 2000;143:1–20. [Google Scholar]
- 40.Strogatz S. Springer; New York: 2003. The Emerging Science of Spontaneous Order. [Google Scholar]
- 41.Chiang W.Y., Lai P.Y., Chan C.K. Frequency enhancement in coupled noisy excitable elements. Phys. Rev. Lett. 2011;106:254102. doi: 10.1103/PhysRevLett.106.254102. [DOI] [PubMed] [Google Scholar]
- 42.Murphy M.P. How mitochondria produce reactive oxygen species. Biochem. J. 2009;417:1–13. doi: 10.1042/BJ20081386. [DOI] [PMC free article] [PubMed] [Google Scholar]
- 43.Burgoyne J.R., Mongue-Din H., Shah A.M. Redox signaling in cardiac physiology and pathology. Circ. Res. 2012;111:1091–1106. doi: 10.1161/CIRCRESAHA.111.255216. [DOI] [PubMed] [Google Scholar]
- 44.Heymes C., Bendall J.K., Shah A.M. Increased myocardial NADPH oxidase activity in human heart failure. J. Am. Coll. Cardiol. 2003;41:2164–2171. doi: 10.1016/s0735-1097(03)00471-6. [DOI] [PubMed] [Google Scholar]
- 45.Bhatt N.M., Aon M.A., Cortassa S. Restoring redox balance enhances contractility in heart trabeculae from type 2 diabetic rats exposed to high glucose. Am. J. Physiol. Heart Circ. Physiol. 2014;308:H291–H302. doi: 10.1152/ajpheart.00378.2014. [DOI] [PMC free article] [PubMed] [Google Scholar]
- 46.Ventura-Clapier R., Garnier A., Veksler V. Energy metabolism in heart failure. J. Physiol. 2004;555:1–13. doi: 10.1113/jphysiol.2003.055095. [DOI] [PMC free article] [PubMed] [Google Scholar]
- 47.Backx P.H., Gao W.D., Marban E. Mechanism of force inhibition by 2,3-butanedione monoxime in rat cardiac muscle: roles of [Ca2+]i and cross-bridge kinetics. J. Physiol. 1994;476:487–500. doi: 10.1113/jphysiol.1994.sp020149. [DOI] [PMC free article] [PubMed] [Google Scholar]
- 48.Süel G.M., Garcia-Ojalvo J., Elowitz M.B. An excitable gene regulatory circuit induces transient cellular differentiation. Nature. 2006;440:545–550. doi: 10.1038/nature04588. [DOI] [PubMed] [Google Scholar]
- 49.Hong H., Strogatz S.H. Kuramoto model of coupled oscillators with positive and negative coupling parameters: an example of conformist and contrarian oscillators. Phys. Rev. Lett. 2011;106:054102. doi: 10.1103/PhysRevLett.106.054102. [DOI] [PubMed] [Google Scholar]
- 50.Kuramoto Y. Springer; Berlin, Germany: 1984. Chemical Oscillations, Waves, and Turbulence. [Google Scholar]
- 51.O’Leary D.P. Near-optimal parameters for Tikhonov and other regularization methods. SIAM J. Sci. Comput. 2001;23:1161–1171. [Google Scholar]
- 52.Park H.W., Shin S., Lee H.S. Determination of an optimal regularization factor in system identification with Tikhonov regularization for linear elastic continua. Int. J. Numer. Methods Eng. 2001;51:1211–1230. [Google Scholar]
- 53.Fang H., Chen M., Cheng H. Imaging superoxide flash and metabolism-coupled mitochondrial permeability transition in living animals. Cell Res. 2011;21:1295–1304. doi: 10.1038/cr.2011.81. [DOI] [PMC free article] [PubMed] [Google Scholar]
Associated Data
This section collects any data citations, data availability statements, or supplementary materials included in this article.