Abstract
It is currently thought that life-long blood cell production is driven by the action of a small number of multipotent haematopoietic stem cells. Evidence supporting this view has been largely acquired through the use of functional assays involving transplantation. However, whether these mechanisms also govern native non-transplant haematopoiesis is entirely unclear. Here we have established a novel experimental model in mice where cells can be uniquely and genetically labelled in situ to address this question. Using this approach, we have performed longitudinal analyses of clonal dynamics in adult mice that reveal unprecedented features of native haematopoiesis. In contrast to what occurs following transplantation, steady-state blood production is maintained by the successive recruitment of thousands of clones, each with a minimal contribution to mature progeny. Our results demonstrate that a large number of long-lived progenitors, rather than classically defined haematopoietic stem cells, are the main drivers of steady-state haematopoiesis during most of adulthood. Our results also have implications for understanding the cellular origin of haematopoietic disease.
Current dogma suggests that all haematolymphoid lineages are derived from a common ancestor, the haematopoietic stem cell (HSC)1,2. During adult life, HSCs are thought to be the only bone marrow (BM) cell population capable of long-term self-renewal and multilineage differentiation1,2. As HSCs divide, they produce multipotent and lineage-restricted progenitor populations, which are regarded as transient intermediates before the final production of functional blood cells1,2. Historically, the main experimental approach used to elucidate and define the cellular properties of various BM populations has been the transplantation assay. In this assay, prospectively purified cell populations are transplanted into myeloablated hosts. A general caveat to these approaches, however, is that only cells that are able to circulate, colonize a niche, and proliferate rapidly, will be able to produce detectable progeny. Additionally, given the extraordinary stress that transplanted cells endure during engraftment and the distorted cytokine milieu that they encounter, it is questionable to what extent their functional characteristics are shared with cells driving more physiological non-transplant haematopoiesis.
Recent fate tracking approaches have proven to be fundamental in determining biological properties and clonal dynamics of solid tissue stem cells3,4. Owing to the unique physical organization of the blood system and the lack of HSC- or progenitor-restricted drivers, these approaches have not been successfully applied to the study of native haematopoiesis. Because of this lack of tractable systems, the mechanistic nature of non-transplant haematopoiesis has remained largely unexplored. Fundamental questions such as the number, lifespan and lineage potential of stem or progenitor cells that drive homeostatic blood production remain to be answered5-8. Here, we describe a novel experimental system to enable in situ labelling and clonal tracking of haematopoietic cells, and use it to investigate the cellular origins, lineage relationships and dynamics of native blood production.
Clonal marking by transposon tagging
Our experimental paradigm is based on the temporally restricted expression of a hyperactive Sleeping Beauty (HSB) transposase, an enzyme that mediates genomic mobilization of a cognate DNA transposon (Tn)9. In our model, a doxycycline (Dox)-inducible HSB cassette and a single-copy non-mutagenic Tn are incorporated in the mouse genome through gene targeting (Fig. 1a). HSB expression is controlled by a Dox-dependent transcriptional activator (M2), driven from the Rosa26 locus10. In mice carrying these three alleles (referred to as M2/HSB/Tn), Dox administration results in HSB expression and subsequent Tn mobilization elsewhere in the genome. As Tn integration is quasi-random11, every cell undergoing transposition will carry a single and distinct insertion site, which, upon Dox withdrawal, will serve as a stable genetic tag for the corresponding cell and its progeny (Fig. 1a). To monitor Tn transposition, a DsRed reporter marks Tn mobilization by the concurrent removal of an embedded transcription stop signal (Fig. 1a).
Figure 1. Establishment of inducible transposon tagging approach.
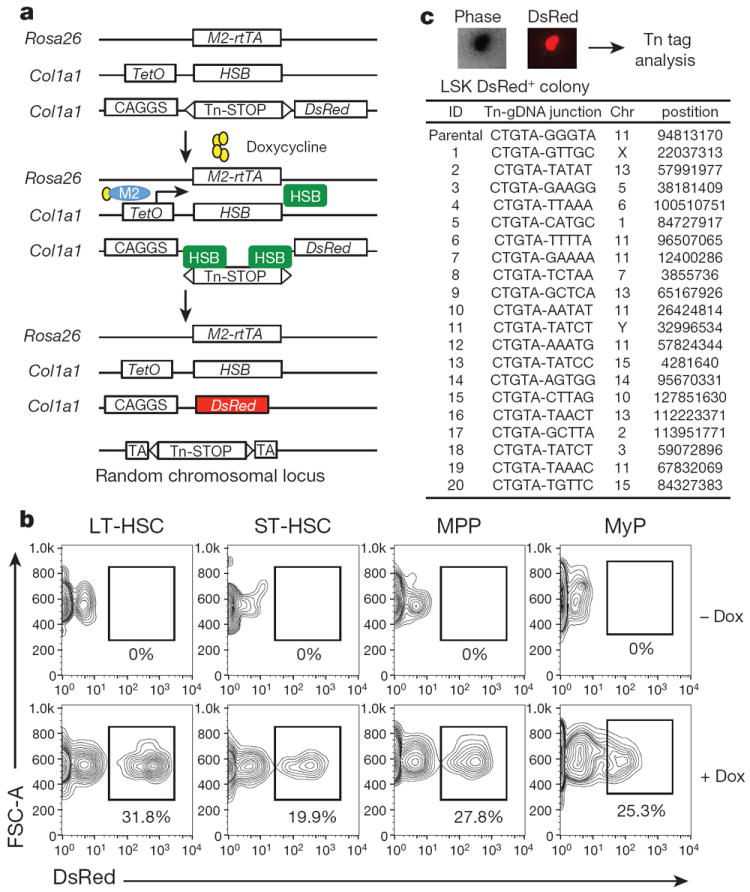
a, Transgenic alleles and strategy used for inducible genetic tagging. M2-rtTA, reverse tetracycline-responsive transcriptional activator; HSB, hyperactive Sleeping Beauty transposase; Tn, HSB transposon; STOP, polyadenylation signal; CAGGS, chicken β-actin promoter; TetO, tetracycline-response element. b, Frequency of DsRed+ cells in long-term HSC (LT-HSC), short-term HSC (ST-HSC), multipotent progenitor (MPP), and myeloid progenitors (MyP) in marrow of M2/HSB/Tn mice exposed to Dox for 3 weeks. Shown are representative FACS plots from three independently analysed mice of similar age and induction period. c, Sequence of Tn tags identified from 20 DsRed+ LSK colonies that emerged following methylcellulose culture. gDNA, genomic DNA.
Tn mobilization could be induced in approximately 30% of the phenotypically defined long-term (LT)-HSCs, short-term (ST)-HSCs, multipotent progenitors (MPPs) and myeloid progenitors (MyP)12-14 following 3–4 weeks of induction, whereas no labelling was found in uninduced mice (Fig. 1b). When transplanted, DsRed+ HSC/progenitors fully reconstituted myeloid and lymphoid lineages for 10 months, indicating labelling of bona fide LT-HSCs (Extended Data Fig. 1a–d). On the other hand, transplantation of DsRed− HSCs/progenitors produced fully DsRed− progeny, confirming extremely low levels of transposition in the absence of Dox (Extended Data Fig. 1e, f). Analysis of uninduced older mice revealed minimal levels of spontaneous Tn mobilization in peripheral blood (PB) granulocytes (0.1%) and B cells (0.5%), two orders of magnitude lower than transposition levels observed in Dox-treated animals (Extended Data Fig. 1g). Peripheral T cells showed a higher degree of background mobilization (4.1 ± 2.3%) (Extended Data Fig. 1g). Thus, the M2/HSB/Tn model allows strict Dox-dependent Tn mobilization in most of the haematopoietic compartment.
As predicted, haematopoietic colonies grown in −Dox semi-solid medium arising from sorted DsRed+ stem/progenitor cells carried single and completely distinct insertion sites (Fig. 1c, Extended Data Fig. 2a, b, d). Secondary colonies from LT-HSC clones inherited identical Tn tags as their corresponding primary colonies, indicating stable propagation of Tn tags among progeny (Extended Data Fig. 2c, d). Evidence of Tn ‘re-mobilization’ in the absence of Dox was only found in one of 24 secondary colonies analysed. Furthermore, no re-mobilized tags were observed in 80 single cells from secondary replatings (Extended Data Fig. 2d).
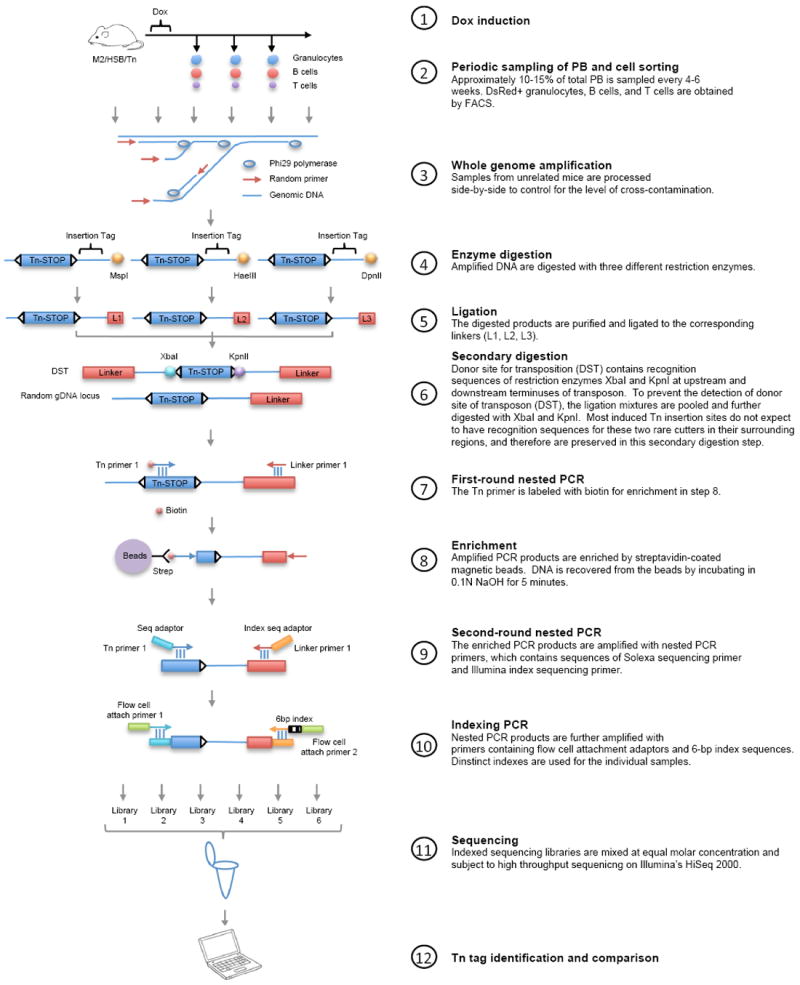
We also established an improved PCR-based method to detect Tn tags in polyclonal samples with minimal cell number requirements. This combined whole-genome amplification (WGA)15 technology, three-arm ligation-mediated PCR (LM-PCR)16 and next generation sequencing (Extended Data Fig. 3, Additional Methods). Our method was sensitive enough to reliably detect clones with a frequency as low as 5–25 out of 10,000 cells in a polyclonal population (Extended Data Fig. 4, Supplementary Information).
Clonal dynamics of native haematopoiesis
Armed with a strategy for clonal and genetic labelling in situ, we began to examine the long-term clonal behaviours of HSC and progenitor clones by Tn tag interrogation in sorted granulocytes, B cells and T cells from PB samples that were periodically collected over a period up to 12 months after Dox withdrawal (Fig. 2a, Extended Data Fig. 5, Supplementary Table 1). Given the ubiquitous expression of the Rosa26-M2 driver (Fig. 1), both primitive and differentiated haematopoietic cells can undergo transposition. Although this provides an unbiased approach to label the stem/progenitor pool, we allowed 3–4 months of ‘chase’ before sample collection so that Tn tags in mature PB populations would be more likely derived from longer-lived HSCs, as predicted from transplantation studies13,17 (Fig. 2a).
Figure 2. Clonal dynamics of native haematopoiesis.
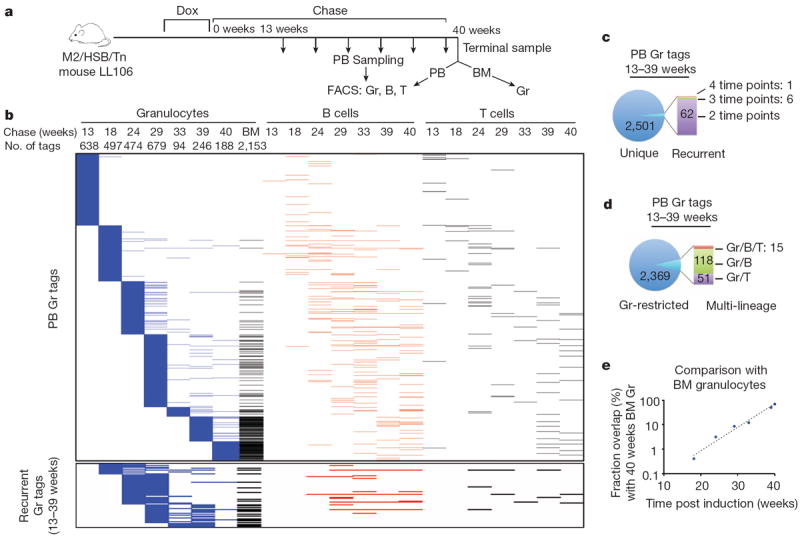
a, Experimental flow chart showing longitudinal clonal analysis on FACS-sorted PB granulocytes (Gr), B cells, T cells, and BM Gr from induced mouse LL106. Tn tags are determined with the analysis pipeline described in Supplementary Methods. b, Distribution of Tn tags identified in PB Gr samples across multiple time points, lineages, and in BM. Each horizontal line represents a unique tag. Clones present exclusively in B cells, T cells or BM Gr are not shown. Bottom panel shows subset of PB Gr tags found in multiple time points. c, Analysis showing the number of Gr tags that are either unique or recurrent in the Gr lineage. d, Analysis of the number of Gr tags that are either Gr-restricted or shared among B/T lineages. e, Extent of clonal overlap between PB Gr tags at different time points post chase and terminal BM Gr sample. Dashed line is an exponential fit to the data.
Our initial analysis focused on the dynamics of granulocyte production given their rapid turnover rate18. Among three independently analysed mice, a range of 65–905 clones per time point was routinely detected in sorted DsRed+ granulocytes (Supplementary Table 2). Surprisingly, when analysed longitudinally, the vast majority of granulocyte tags (90–98%) were detected at single time points (Fig. 2b, c, Extended Data Fig. 6a, b, d, e). Moreover, the recurrent tags (found at more than one time point) clustered in adjacent time points (Fig. 2b, Extended Data Fig. 6a, d). In contrast, highly stable clones were readily detected in B and T cell samples (Extended Data Fig. 7a). Considering the sensitivity of our method (Extended Data Fig. 4c), these data argue against the existence of stable granulocytic clones producing more than 0.05–0.25% of the PB granulocyte pool during the chase period. This predominantly transient and highly polyclonal contribution persisted up to 12 months of chase, suggesting that this pattern does not represent a transitory stage of clonal fluctuation19,20. Clonal instability was also confirmed by tag-specific nested PCR (Extended Data Fig. 7b).
To examine whether limited PB sampling might underlie the observed lack of clonal stability, we asked whether ‘unstable’ PB clones could be detected in a much larger terminal sample comprising approximately 80% of BM21. This analysis revealed a clear inverse correlation between the number of PB clones found in the BM and the time elapsed since PB collection, a pattern highly indicative of limited lifespan (Fig. 2b, e, Extended Data Fig. 6g, h). Indeed, the fraction of persistent clones dropped exponentially with time, from which we could calculate that active granulocytic clones had a detectable half-life of 3.3 weeks in PB (Fig. 2e, Extended Data Fig. 6h). A very minor subset of transient PB clones did reappear in the BM sample (Fig. 2b, Extended Data Fig. 6g). It is unclear whether this represents stochastic detection of minor stable clones or whether this reflects clonal re-activation.
The observed pattern of clonal dynamics did not result from an artificial increase in clonal complexity due to the 3–4-week induction period, as similar clonal dynamics were observed in mice induced for one day (Extended Data Fig. 7c). Additionally, background Tn remobilization does not significantly contribute to our observations, as approximately only seven Tn tags were detected in PB granulocytes of uninduced mice, compared to the several hundred clones found in Dox-treated animals (Extended Data Fig. 7d). Collectively, these data imply that long-term steady-state granulopoiesis is vastly polyclonal and largely driven by the successive recruitment of non-overlapping clones.
Clonal diversity and lifespan
The LM-PCR method currently applied is not quantitative, and is likely to underestimate the full clonal repertoire22 (Extended Data Fig. 4g, Supplementary Information). To obtain a more representative view of clone size distribution and number, we performed single-cell LM-PCR analyses on sorted PB granulocytes (Fig. 3a). Among the total 290 single granulocytes analysed from an induced mouse at three consecutive time points, we detected 270 unique Tn tags. 254 of them were present in single granulocytes, 14 were observed twice and only 2 tags were found in three single cells (Fig. 3b). None of the tags was present in all three time points analysed (Fig. 3b). Single-cell analysis of another induced mouse at later time points revealed similar results (Fig. 3c). These findings confirm the extreme polyclonal nature of steady-state granulopoiesis and provide support for the paucity of dominant or stable clones.
Figure 3. Polyclonal and fluctuating nature of native granulopoiesis.
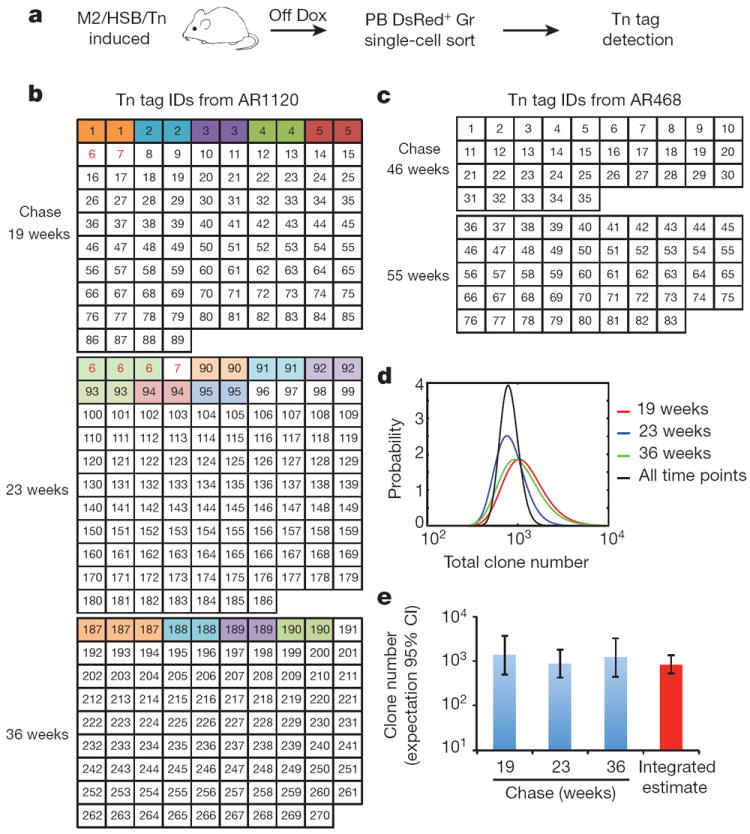
a, Experimental flow chart for the detection of Tn tags in single PB granulocytes. b, c, Single-cell-derived Tn tags from mouse AR1120 (b) and AR468 (c) at multiple time points of chase. Numbers in each box represent unique Tn IDs detected in single cells. Colour-coded boxes depict cells with recurrent tags. Red font depicts tags found at more than one time point. The analysis was performed on two induced mice and results of both are presented here. d, Probability distribution of the total number of clones in PB Gr of AR1120 at different time points (colour curves). Black curve shows the normalized product of the probabilities from all time points. e, Predicted clone number with 95% confidence interval (CI) in PB Gr of mouse AR1120 using the data from b and d (see Methods).
Based on these single-cell data, we re-evaluated the number of clones present in PB granulocytes using statistical models of random sampling (see Methods), with the assumption that granulocyte clones are of uniform size. All time points provided very similar estimates for total clone number: 831 ± 206 (mean ± s.e.m.) (Fig. 3d,e). Considering that this analysis is restricted to only the approximately 30% DsRed+ labelled cellular fraction (Fig. 1b), our estimate represents only a fraction of the clones that maintain granulopoiesis in a mouse at any given time. Additionally, if we take into account that, at least monthly (our sampling interval), new clones are periodically recruited, our findings reveal an extraordinary amount of clonal complexity that is used to sustain long-term granulocyte production.
Lineage output of haematopoietic clones
We next compared Tn tags of granulocytes, B and T lymphocytes to determine lineage potential of the granulocyte-producing clones. Remarkably, very few of the granulocytes tags were shared with either B or T cells in the PB (Fig. 2d, Extended Data Fig. 6c, f). This lack of common clonal origin was also observed when BM granulocytes and nascent pro/pre-B cells were compared at multiple time points of chase (Extended Data Fig. 8a, b, Supplementary Tables 1 and 3), where only around 7% of BM granulocytes had the same clonal origins as nascent pro/pre-B cells (Extended Data Fig. 8c). Therefore, the bulk of granulocyte-producing clones are myeloid-restricted for up to 45 weeks.
We also sought to determine the lineage potential of lymphoid clones. While only ~ 10% of the pro/pre-B tags are found in granulocytes at 9 and 26 weeks, a much larger portion (~47%) is present in myeloid cells at 40–45 weeks post-induction (Extended Data Fig. 8d). These data suggest that B-cell production shifts from a predominantly lymphoid-restricted progenitor to a multipotent progenitor after six months of chase. In contrast, monocytes, a myeloid cell type traditionally thought to share the same clonal origins as granulocytes12, had approximately 60% of their tags shared with granulocytes at all three time points, which confirms the close relationship between these two lineages, and suggest that myeloid-producing clones are at least bi-potent (Extended Data Fig. 8d).
Features of transplant haematopoiesis
Our findings here starkly contrast with the clonal behaviour previously reported using retroviral barcoding techniques. In such experiments, a few dominant LT-HSC clones stably output multiple blood lineages19,20,23,24. These observations could be recapitulated in our model as a handful of stable and multipotent clones were observed in recipients of retrovirus-infected DsRed+ Lin− c-Kit+ Sca1+ cells (Extended Data Fig. 9a, b, Supplementary Tables 4 and 5). Similar observations were obtained with transplantation of freshly isolated DsRed+ Lin− c-Kit+ or LT-HSCs, although the clonal diversity was significantly increased, probably due to higher regenerative potential of less-manipulated cells (Extended Data Fig. 9e–h, k–m). Single-cell analysis of PB granulocytes of recipients confirmed the presence of dominant and stable clones (Extended Data Fig. 9c, d, i, j). Thus, our methodology is reliable enough to reveal stable and multipotent clonal behaviours. Our findings, therefore, demonstrate inherent and fundamental differences in the clonal dynamics of post-transplant and steady-state haematopoiesis.
Cellular origins of haematopoietic clones
Historically, LT-HSCs have been considered the major source of long-term haematopoiesis, although evidence for this in a non-transplant setting is limited1,2. We then directly examined the extent of LT-HSC contribution during native blood production by two different approaches. First, we compared the clonal repertoire of resident BM granulocytes in an M2/HSB/Tn mouse more than a year after Dox-induction with that of granulocytes and B cells derived after transplantation of such BM (Fig. 4a, Supplementary Tables 4 and 5). If classical transplantable HSCs drive steady-state granulopoiesis in the donor mouse, then the same tags would be recovered in the progeny of engrafted recipients. Only 5–8% of donor granulocyte tags were present in granulocytes or B cells in recipient mice, and almost all of these tags displayed transient engraftment (Fig. 4b, c). Two donor clones were detected in BM granulocytes 73 weeks after transplant, but these were not detected in the LT-HSC and progenitor compartments in recipient mice (Fig. 4c). In contrast, many of the stable PB clones arising shortly after transplantation were still actively producing multilineage progeny in BM one year later, and a subset of them clearly originated from LT-HSCs (Fig. 4b, c). This suggests that granulocyte production in situ for at least a year is not predominantly driven by BM cells with the capacity to engraft, but instead by progenitors with limited transplantation capacity.
Figure 4. Non-engraftable progenitors drive native haematopoiesis.
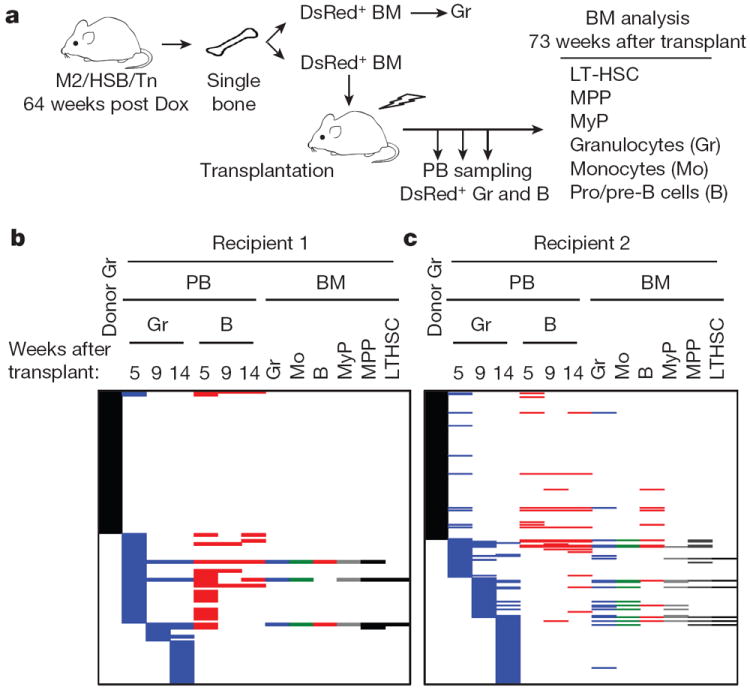
a, Experimental flow chart used to compare clonal origins of native and recipient haematopoiesis. b, c, Tn tag analysis of cell populations from donor BM, recipient PB and recipient BM samples. Only the clones identified in granulocyte populations from donor BM and recipient PB are shown. Note stable, multilineage and HSC-derived haematopoiesis in recipients from clones not present in donor granulocytes. Two recipient mice were analysed: recipient 1 (LL109) received femur BM (b); recipient 2 (LL113) received tibia BM (c).
To further examine the ancestral relationships during native blood production, we determined clonal compositions of fluorescence-activated cell sorting (FACS)-purified LT-HSCs, MPPs and MyPs, and compared them with granulocytes, pro/pre-B cells, and monocytes from the same BM (Fig. 5a, Extended Data Fig. 10a). While approximately half of clones found in MyPs and MPPs were shared with mature populations, surprisingly, less than 5% of LT-HSC tags were also present in these mature cell types (Fig. 5b, c, Extended Data Fig. 10b, c). The extent of LT-HSC output does not increase if tags are compared to longitudinal PB granulocyte and B-cell samples (Fig. 5c, d, Extended Data Fig. 10c). Remarkably, we also found that less than 5% of LT-HSCs shared tags with MPPs and MyPs, traditionally considered their immediate downstream progeny (Fig. 5b, Extended Data Fig. 10b). These observations differ significantly from what occurs following transplantation, where many of the stable and dominant PB clones originated from LT-HSCs (Fig. 4b, c, Extended Data Fig. 9j). Taken together, these observations show that LT-HSCs have limited lineage output under unperturbed conditions for at least 40 weeks, and that progenitors play a central role during native myelo- and lymphopoiesis. (Fig. 5b, e, Extended Data Fig. 10b, d)
Figure 5. LT-HSCs make a limited contribution to native haematopoiesis.
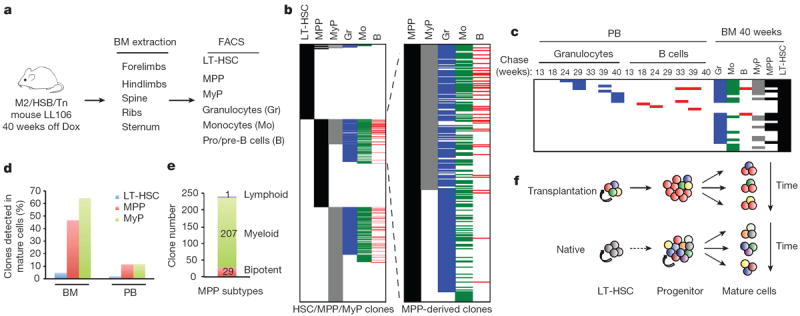
a, Schematic for clonal analysis of BM populations. b, Distribution of identified Tn tags in LT-HSCs, MPPs, MyPs, granulocytes, monocytes, and pro/pre-B cells. Tags present in Gr, Mo, or B but not detected in any of the progenitor populations are not shown. MPP-derived clones are displayed on the right. c, Tn tags of ‘active’ LT-HSCs clones and their presence in downstream progenitors and mature cell types in BM and longitudinal PB samples. Clones are considered active if they share their Tn tags with at least one of the differentiated cell types (BMGr/Mo/B or PB Gr/B). d, Percentage of LT-HSCs, MPPs and MyPs clones that are detected in mature cell populations in BM (Gr/Mo/B) or PB (Gr/B/T). e, Lineage distribution of MPP-derived clones. Bipotent clones have tags present in both myeloid and lymphoid lineages; myeloid-restricted MPPs share tags with at least one of the myeloid cell types, and lymphoid-restricted MPP clones are found in pro/pre-B cells only. f, Graphic representation of cellular mechanisms driving native and transplantation haematopoiesis.
The detection of clonal overlap between MPPs and mature cell types allowed us to preliminarily interrogate lineage potential of MPPs at a clonal level. Our data provide definitive evidence for the existence of multipotent MPP clones (Fig. 5b, e, Extended Data Fig. 10b, d). However, in contrast to the transplantation model24, the majority of MPPs contribute predominantly to the myeloid lineage.
Discussion
We present here multiple lines of evidence demonstrating that, in an unperturbed system, classical LT-HSCs have a limited contribution to blood production during most of adulthood. This is surprising, considering that during the period encompassed by our studies (~1 year) multiple LT-HSC divisions would have occurred14,25,26. While our data cannot fully rule out potential stable contribution by LT-HSCs, this is likely to be lower than our detection limitation and relatively minor in comparison to that of MPPs. The absence of LT-HSC clones in other populations could alternatively be explained by a clonal ‘successive deletion’ model, in which HSCs would undergo symmetric differentiation cell divisions. While we cannot fully rule this out, we consider that this model is not sufficient to explain the source of extreme clonal complexity observed.
Our results argue for a model where successive recruitment of thousands of both lineage-restricted and multipotent clones drives steady-state haematopoiesis for at least a year (Fig. 5f). In this model, a large number of progenitors are specified by early postnatal life (before the time of Dox labelling), after which there is limited contribution to this pool by LT-HSCs. These progenitors are likely to encompass cells traditionally defined as ST-HSCs, MPPs and other populations with transient reconstituting activities, and their abundance (for example, >100,000 MPPs and >500,000 MyPs) could support the breadth of clonal diversity observed. Stochastically, a fraction of these clones can get recruited for blood production, where they undergo commitment and a massive proliferative burst to produce detectable PB progeny. Our findings of successive and polyclonal long-term behaviour are supported by irradiation marking experiments27,28 and by more recent studies involving in vivo lentiviral tagging29. Similarly, variance analyses have predicted that haematopoiesis is maintained by a large number of haematopoietic clones30,31.
One intriguing question that arises from our studies is whether clonal diversity or lifespan of progenitors will eventually exhaust in severely aged mice. Additionally, it will be important to perform follow-up clonal dynamic studies in the context of stress haematopoiesis. These studies will determine under what circumstances classically defined LT-HSCs engage in blood production in situ and which biological contexts determine progenitor lifespan. It will also be important to determine the exact developmental and cellular origins of the observed long-lived progenitor clones. Our model will also be helpful in re-assessing classical haematopoietic lineage hierarchies under more physiological conditions.
Our data provide insight into the potential nature of the cell-of-origin of myeloid malignancies. It is currently thought that HSCs, given their known lifelong persistence, are ideal candidates as the target cells for oncogenic transformation32. In light of our data, the much larger number of long-lived progenitors may provide a more accessible pool of cells where oncogenic mutations may arise. Our transposon tagging approach could similarly be used to evaluate clonal dynamics and evolution in primary tumours. The modular nature of our system should enable cell-type-specific transposition, allowing clonal fate tracking of defined cell populations. Our work paves the way for future systematic and high-resolution analysis of clonal dynamics during development, ageing and multiple other biological processes.
METHODS
Mice
The expression cassette of a hyperactive Sleeping Beauty (HSB) gene, and the HSB-responsive transposon element (Tn) were subcloned in the col1a1 locus using FLP-mediated recombination, as previously described33. A DsRed reporter gene, normally suppressed by the transcription polyadenylation signal between the inverted repeats of the Tn, was cloned downstream of the Tn element. Targeted embryonic stem cell clones were generated in KH2 lines and chimaeric mice were produced following published protocol33. The HSB and Tn mice were intercrossed to create the compound transgenic M2/HSB/Tn mouse model. The resulted mice are of a mixed genetic background (C57BL/6J and 129/SvJ). 8–10-week-old male or female mice with the M2/HSB/Tn genotype were used in this study. To induce Tn mobilization, mice were fed with 1 mg ml−1 Dox together with 5 mg ml−1 sucrose in drinking water until the desired level of labelling was achieved. 3–4 capillaries of PB, which encompassed around 10% of the total blood of adult mice, were collected from the retro-orbital sinus every 4–6 weeks. BM cells were flushed out with 2% fetal bovine serum(FBS) in phosphate buffered saline (PBS) from dissected bones. CD45.1+ mice were used as transplantation recipients (B6.SJL-Ptprca Pep3b/BoyJ, stock #002014, the Jackson Laboratory). All animal procedures were approved by the Boston Children’s Hospital Institutional Animal Care and Use Committee.
Fluorescence-activated cell sorting (FACS)
Cell populations from PB and BM were purified through FACS on FACSAria (BD Biosciences). The following combinations of cell surface markers were used to define these cell populations: PB Gr, Ly6G+ CD4− CD8− CD19−; B cells, CD4− CD8− CD19+; T cells, CD4+ CD8+ CD19−; BM Gr, Ly6G+ 7/4+ B220−; monocytes, Ly6G− 7/4+ B220−; pro/pre-B cells, 7/4− IgM− B220+; LT-HSC, Lin− cKit+ Sca1+ CD48− CD150+; MPP, Lin− cKit+ Sca1+ CD48+ CD150−; myeloid progenitors, Lin− IL7Rα− cKit+ Sca1−. Lineage markers were composed of CD4, CD8, CD19, Mac1, Gr1, and Ter119. For MACS depletion, BM cells were first stained with biotin-conjugated lineage markers CD3e, CD19, Mac1, and Ter119. Lin− and Lin+ cell populations were then separated with autoMACS Pro separator (Miltenyi Biotec) with manufacture’s depletion protocol. Commercially available antibodies were listed in Supplementary Table 6. Flow cytometry data were analysed with FlowJo (Tree Star).
Methylcellulose colony formation assays
Tn-marked HSPCs or LT-HSCs were sorted from BM of induced M2/HSB/Tn mice as DsRed+ Lin− cKit+ Sca1+ or DsRed+ Lin− cKit+ Sca1+ CD48− CD150+ cells, respectively. Cells were cultured at clonal density in methylcellulose (Methylcellulose Base Medium, R&D Technologies) supplemented with 10 ng ml−1 recombinant murine G-CSF, 10 ng ml−1 SCF, and 10 ng Tpo. Single colonies were picked for Tn insertion tag analyses 12 days after plating.
Transplantation assays
Either fractionated or whole BM cells (CD45.2+) from induced M2/HSB/Tn mice were transplanted through retro-orbital injection with or without 1 × 10⁵ whole BM cells (CD45.1+) into lethally irradiated C57BL/6 recipient mice (11.6 Gy of gamma-irradiation in a split dose with 2 h interval). Haematopoietic stem and progenitor cells were transduced with retrovirus (pMIG, Addgene #9044) at multiplicity of infection of 1 in vitro for 24 h before transplantation. The retrovirus was produced by transient transfection of the pMIG vector to the Phoenix-AMPHO packaging cell line (ATCC). Donor cell engraftment was determined at multiple time points following transplantation by PB flow cytometry analysis on LSR II (BD Biosciences).
Whole-genome amplification (WGA)
Cells of interest were sorted into 1.7 ml tubes and concentrated into 5–10 μl of buffer by low-speed centrifugation. For each sample, all the sorted cells were used for whole genome amplification with REPLI-g Mini kit (150025, Qiagen) according to manufacturer’s instruction. Amplified DNA was further purified by QIAamp DNA Micro kit (56304, Qiagen), and half of the elution was used for downstream analysis.
3-Arm LM-PCR and sequencing
To increase the coverage of Tn insertion tags, 300 ng of purified DNA was digested with three restriction enzymes (DpnII, HaeIII, MspI), and then ligated with the corresponding DNA linkers. Ligation mixture were pooled and further digested with XbaI and KpnI to remove detection of Tn localized at donor site. Digested products were cleaned with MinElute Reaction Cleanup kit (28204, Qiagen), and the entire elute was used in primary PCR reactions with primers specific to Tn and linker sequences. The Tn-specific primer was biotinylated at 5′ end, which allowed enrichment of the PCR products by using the Dynabeads kilobaseBINDER kit (601-01, Invitrogen). PCR products were retrieved by incubation in 5 μl of 0.1 M NaOH for 10–20 min and 2 μl of it was further amplified with nested primers in secondary PCR. The nest PCR primers contained adaptor sequences, with which the sequencing library was constructed directly from purified secondary PCR products. Solexa sequencing was carried out on HiSeq 2000 (Illumina) at the Tufts Genomics Core. Sequences of PCR primers were listed in Supplementary Table 7. Raw and processed sequencing data will be available upon request.
Identification and comparison of Tn insertion tags
The analysis script was developed in-house (Supplementary Information). NGS data were first filtered to retain reads containing Tn sequence followed by the characteristic TA dinucleotide sequence present at the Tn-genomic DNA (gDNA) junction. Linker sequence, if present, was trimmed along with the Tn sequence to obtain gDNA sequence for alignment against the mouse genome (NCBI37/mm9) with the BLAT algorithm. A positive alignment required a minimum of 17 nucleotides match with no mismatch allowed. To focus on unique insertion sites, non-mapped Tn tags and tags with multiple mapping sites were excluded from downstream analysis. To uniquely compare Tn insertion tags across multiple samples, we developed software that merges insertions (within 25 base pairs) from multiple experiments, normalizes by total read counts and filters low-frequency tags according to criteria described in Supplementary Information.
Single-cell Tn insertion tag analysis
DsRed+ granulocytes were sorted from blood as described above, from which single cells were sorted into 96-well PCR plates with 2 μl PBS in each well. WGA was carried out directly from these single cells. Amplified DNA was digested, heat-inactivated, and ligated to the corresponding linker. Nested PCR was performed on the ligation product, and PCR products were analysed with conventional cloning and sequencing methods.
Insertion-specific PCR
Nested PCR primers were designed based on genomic DNA sequences surrounding Tn insertion tags as identified in high-throughput sequencing. Singleplex PCR reactions were carried out for the individual clones by using insertion-specific primers along with one of the transposon primers.
Establishment of HEK293 clones with stable Sleeping Beauty transposon insertion sites
HEK293 cells were obtained from R. Gregory (Boston Children’s Hospital). The cells were transfected with the transposon-targeting vector. Stable clones were selected with neomycin for two weeks. The copy numbers of these stable clones was determined based on quantitative PCR of NeoR gene imbedded in the transposon vector. An HEK293 clone with a single copy of stably integrated transposon vector was selected, and further transfected with HSB-expressing vector to induce Tn mobilization. To terminate transposition, we propagated the transfected cells three times while the HSB-expressing vectors were gradually lost. The DsRed+ HEK293 cells that have undergone Tn transposition were enriched by FACS and grew at clonal density. Ten DsRed+ colonies were picked and LM-PCR and Sanger sequencing were used to determine Tn insertion tags. To assemble polyclonal samples, cell sorting was used to mix the same number of cells from each clone. Duplicate admixtures were prepared at six cell dosages: 1, 5, 25, 100, 500 and 2,500 cells. 10,000 PB cells from an induced M2/HSB/Tn mouse were added to the individual sample to further improve the clonal complexity. The resulting polyclonal samples were then processed in the same manner as blood samples for Tn insertion tag analysis.
Extended Data
Extended Data Figure 1. Characterization of M2/HSB/Tn mouse model.
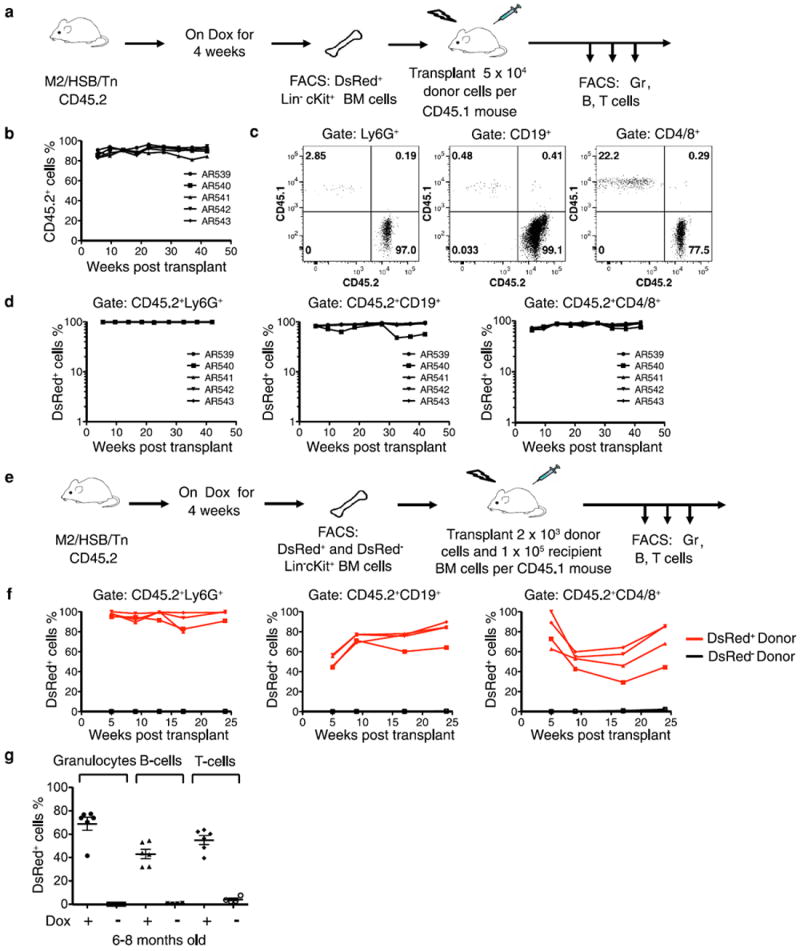
a, Experimental flow chart showing transplantation of DsRed+Lin−cKit+ BM cells from induced M2/HSB/Tn mice (CD45.2+) into lethally-irradiated recipient mouse (CD45.1+). b, Longitudinal follow-up of donor-derived PB cells in 5 recipient mice. c, Representative dot blots showing percentage of donor-derived (CD45.2+) granulocyte, B cells and T cells 42.5 weeks after transplantation. d, Longitudinal follow-ups of DsRed expression in donor-derived PB granulocytes, B cells, and T cells. e, Experimental flow chart showing transplantation of DsRed+Lin−cKit+ or DsRed−Lin−cKit+ BM cells. f, Longitudinal follow-ups of DsRed expression in donor-derived PB cells. 3 and 4 mice received DsRed− and DsRed+ donor cells, respectively. g, Fraction of DsRed+ cells in PB granulocytes, B cells and T cells from 6–8-month-old induced (n = 6) and uninduced (n = 4) M2/HSB/Tn mice. Mean ± s.d. is shown.
Extended Data Figure 2. Stable propagation of Tn tags during in vitro expansion of LT-HSC clones.
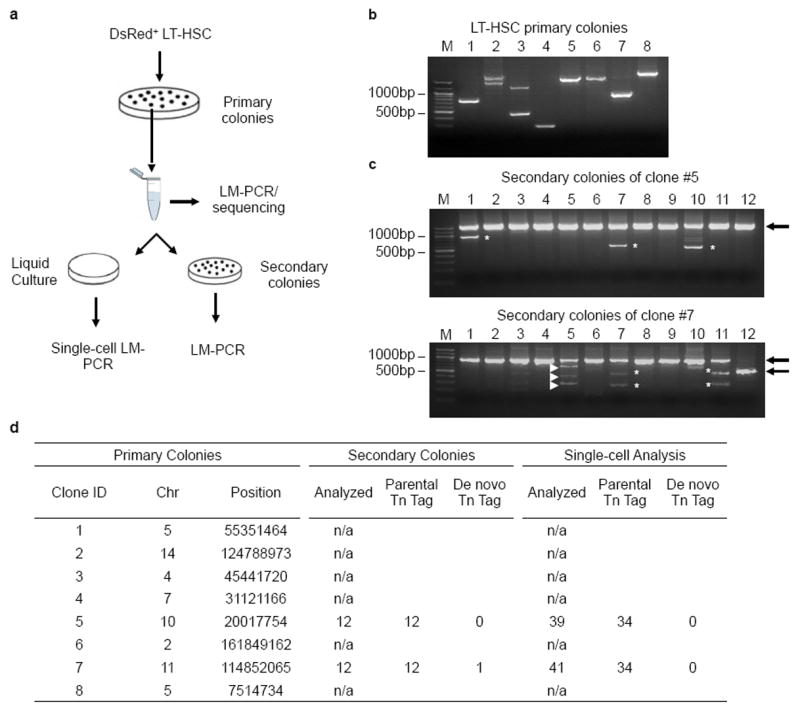
a, Experimental flow chart showing primary and secondary colony-formation assays and Tn tag analyses. b, Results of LMPCR analysis on primary LT-HSC colonies. M, 100-bp DNA ladder. The two PCR products detected from colony no. 2 and 3 resulted from LM-PCR amplification of both ends of single Tn insertion sites. c, Results of LM-PCR analysis on secondary colonies from two of the primary colonies. Identities of the PCR products in b and c were determined by cloning and Sanger sequencing. Arrows indicate PCR products of Tn tags identified in parental colonies. Bands marked by white asterisks are PCR artefacts, which are defined by the absence of transposon element or uniquely aligned genomic DNA sequence. White arrowheads depict de novo Tn tags. d, Summary of Tn tags identified in primary colonies, secondary colonies, and single-cell analysis.
Extended Data Figure 3. Flow chart showing experimental procedures of Tn tag labelling and detection.
Extended Data Figure 4. Characterization of methodology for Tn tag detection.
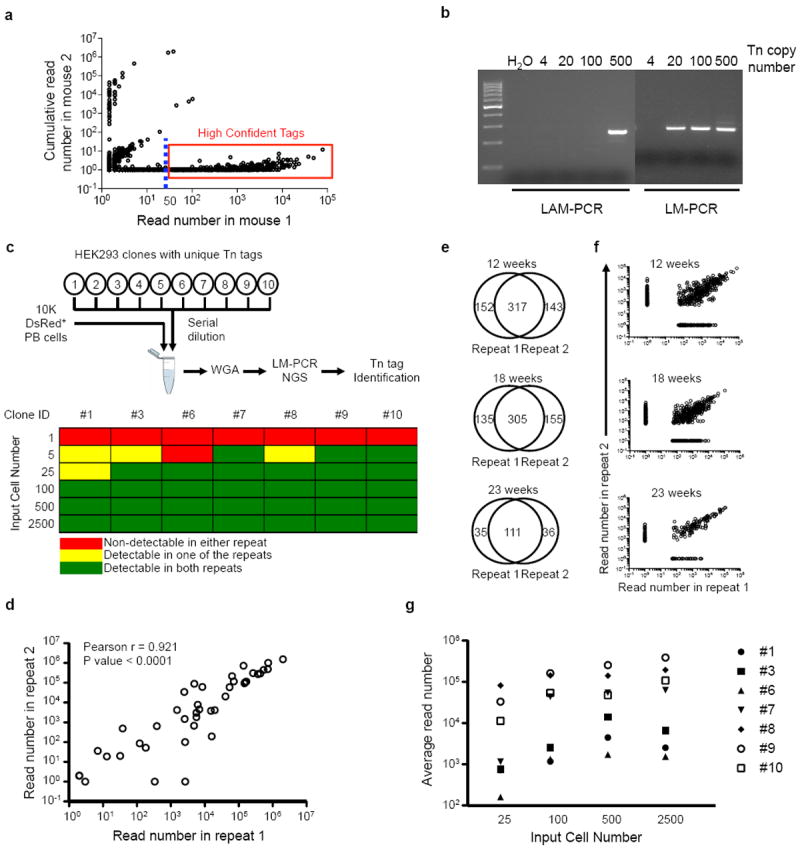
a, A representative plot showing read frequencies of Tn tags detected in a test sample (shown on x axis), and their frequencies observed in control samples from an unrelated mouse (shown on y axis). Each circle represents a unique Tn tag. The dashed line depicts 50-read cutoff. Tags in the red box are high-confidence reads selected for further analysis. b, Detection sensitivity of linear amplification-mediated PCR (LAM-PCR) and ligation-mediated PCR (LM-PCR). Serial dilutions of genomic DNA from a transposon mouse are used as input. c, Sensitivity of Tn tag detection from polyclonal samples using LM-PCR. The polyclonal samples are assembled by mixing 10,000 DsRed+ PB cells and different numbers of each of ten HEK293 clones. The Tn tags in these HEK293 clones were pre-determined. Six cell dosages (1, 5, 25, 100, 500 and 2,500 cells) are tested in duplicates for each clone. A positive call for the detection of the known Tn tags is determined based on criteria defined in Supplementary Information. d, Read frequencies between the duplicate samples in c are positively correlated. Each circle depicts a Tn tag from one of the seven HEK293 clones at a particular cell dosage. e, Venn diagram showing additional technical LM-PCR repeats performed on PB Gr split samples of mouse AR1122 collected at 12, 18 and 23 weeks after Dox withdrawal. Shown in plots are the number of Tn tags that are either commonly or uniquely detected in each of the repeats. f, Plots showing read frequencies of Tn tags described in e. g, Broad distribution of read frequencies among different HEK293 clones with same input cell numbers. Averages of the duplicate samples are shown.
Extended Data Figure 5. Purification of PB granulocytes, B cells, and T cells by FACS.
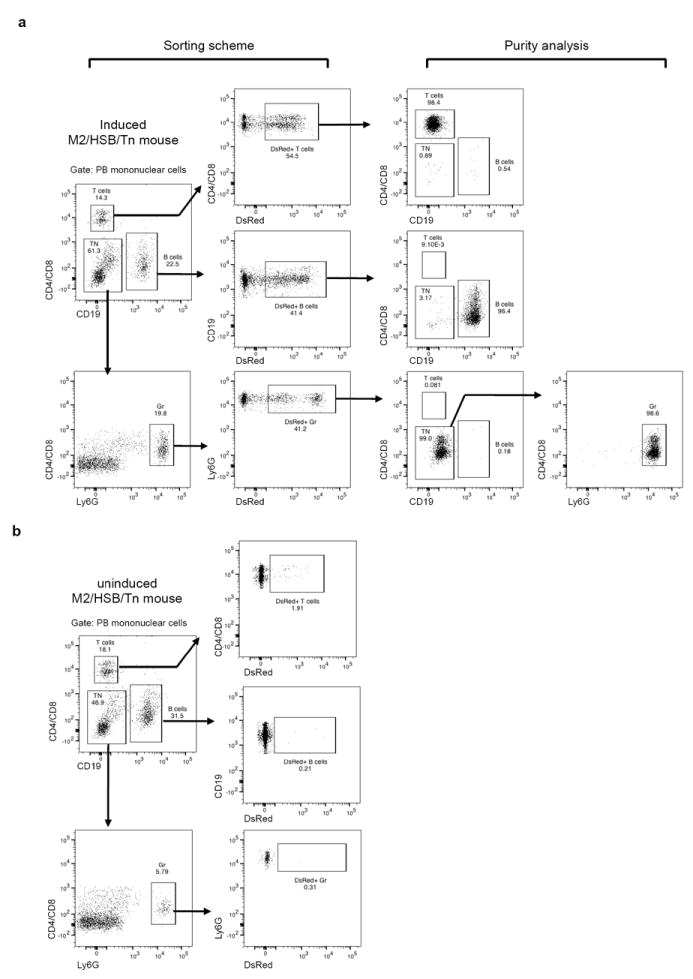
a, Schematic for FACS purification and purity analysis of DsRed+ PB granulocytes, B cells, and T cells from induced M2/HSB/Tn mice. b, DsRed+ gates are established based on PB samples from uninduced M2/HSB/Tn mice.
Extended Data Figure 6. Clonal dynamics in PB samples of additional induced mice.
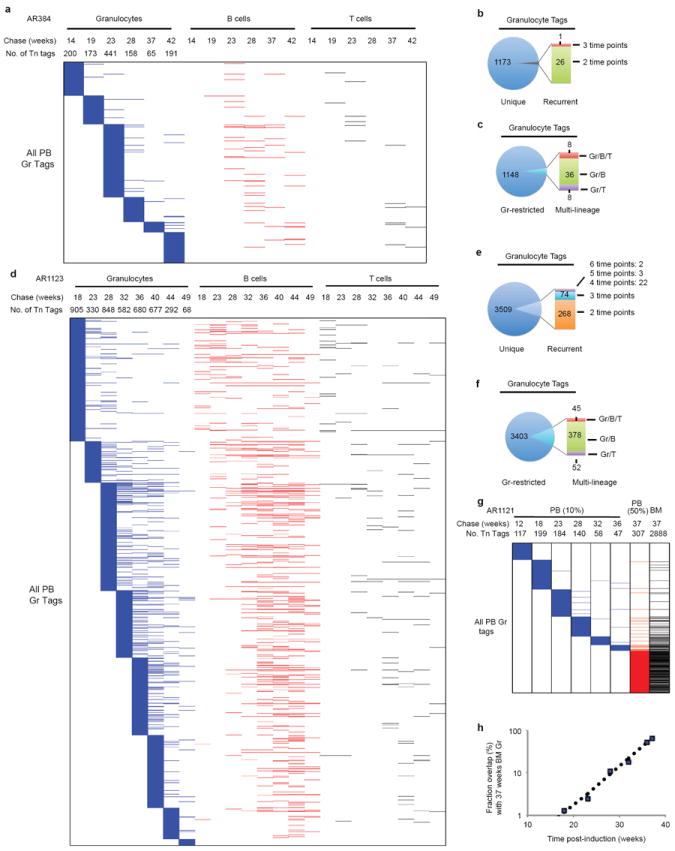
Data are presented in the same manner as Fig. 2. a–c, Tn tags from mouse A384; d–f, Tn tags from mouse AR1123. Tags unique to B or T cells are not shown. g–h, Tn tags from mouse AR1121. The terminal PB sample shown in panel g encompasses approximately 50% of the blood, and the BM sample are from forelimbs, hindlimbs, spine, sternum and ribs. k, The percentage of recurrent Tn tags in prior PB samples when compared with that in the BM granulocyte sample.
Extended Data Figure 7. Validation of results obtained in longitudinal analyses.
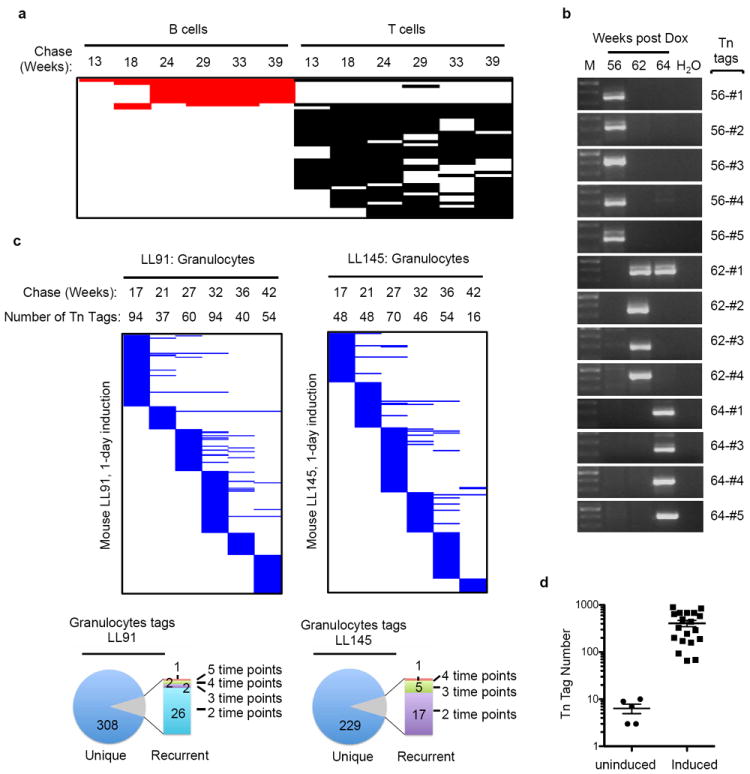
a, B cells and T cells Tn tags that are present in 4 or more PB samples from induced mouse LL106. b, Results of nested-PCR analysis of PB granulocytes collected from induced mouse AR446 at three time points. c, Longitudinal PB analyses of 1-day-induced mice (LL91 and LL145). d, Tn tag numbers in PB granulocytes collected from 10–16-month-old uninduced mice and from all time points shown for induced mice LL106, AR384 and AR1123.
Extended Data Figure 8. Lineage relationships among BM granulocytes, monocytes and pro/pre-B cells.
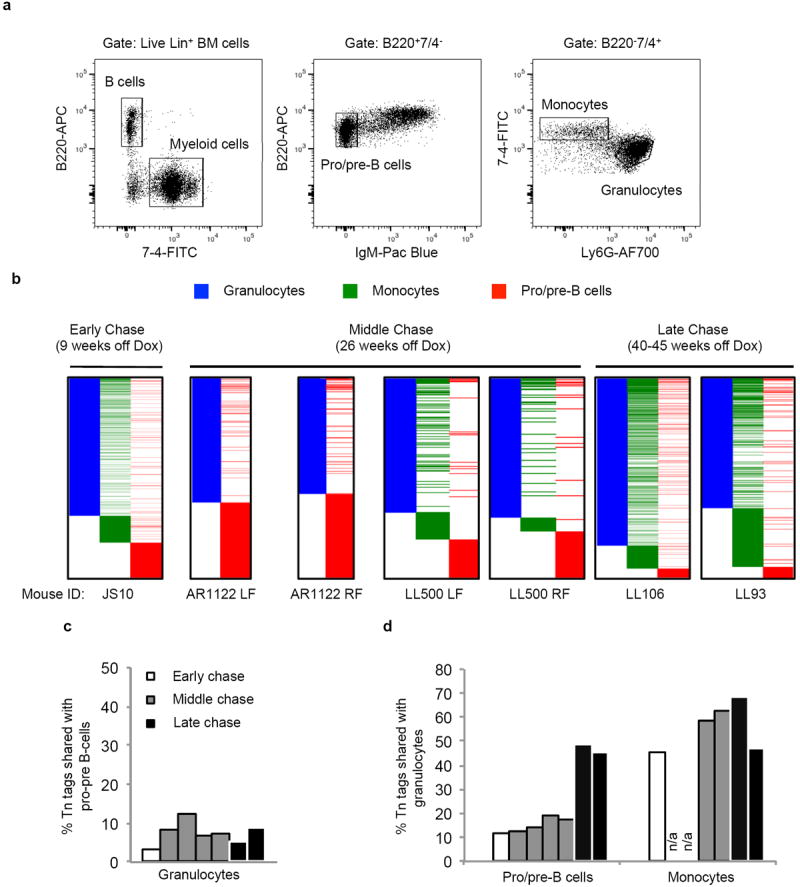
a, FACS plots showing purification scheme of BM granulocytes, monocytes and pro/pre-B cells. Monocytes and pro/pre-B cells are double-sorted to minimize granulocytes contamination. b, Comparison of clonal compositions of BM cell populations at different time points after Dox withdrawal. c, Percentage of granulocyte Tn tags that are shared with pro/pre-B cells. Each column represents data from an individual mouse or a single bone. d, Percentages of pro/pre B cell clones and monocyte clones that share Tn tags with BM granulocytes. Each column represents data from an individual mouse or a single bone. n/a, not available.
Extended Data Figure 9. Clonal analysis of haematopoiesis under transplantation conditions.
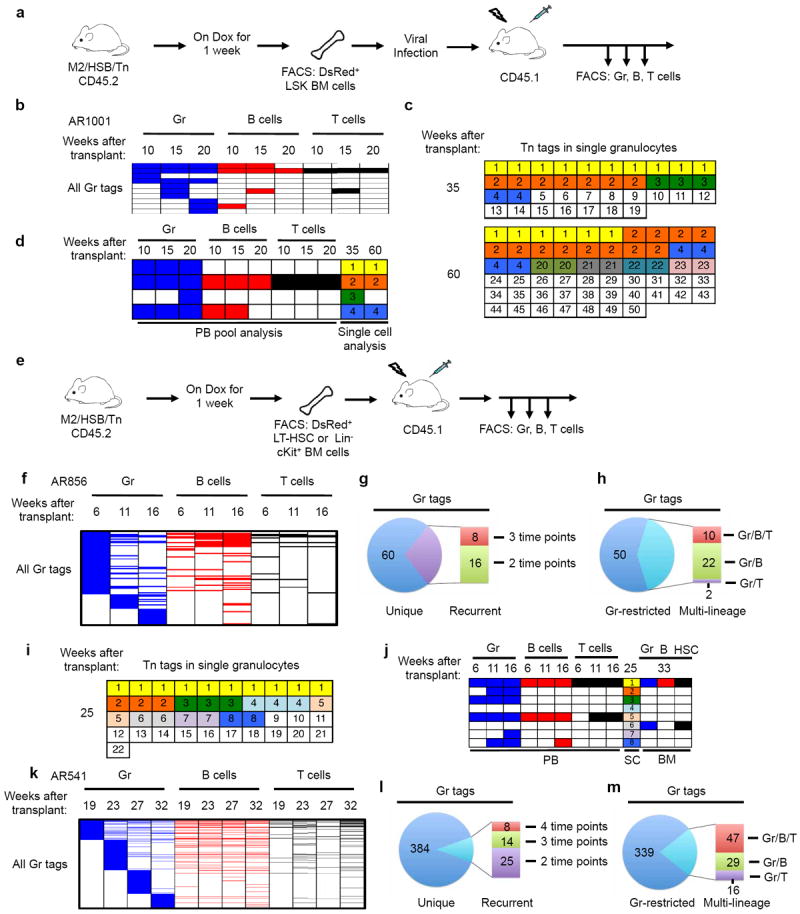
a, Experimental flow chart showing viral infection of donor cells and longitudinal analysis of clonal dynamics in the transplant mouse. 2,000 DsRed+ LSK cells were transduced with retrovirus in the presence of TPO, Flt3 and SCF for 2 days and transferred to lethally irradiated recipients in the presence of 1×10⁵ wild-type bone marrow cells. b, Distribution of PB Gr tags and their presence in B cells and T cells from recipient mouse AR1001 at three time points following transplantation. Tn tags unique to B cells or T cells are not shown. c, Single-cell analysis of PB granulocyte Tn tags from mouse AR1001 at 35 and 60 weeks after transplantation. d, A subset of dominant clones revealed in single-cell analysis (c) are stable in PB. e, Experimental flow chart showing purification and transplantation of LT-HSCs or Lin−cKit+ BM cells from induced M2/HSB/Tn mice. 4 × 10⁴ DsRed+ LT-HSCs or 5×10⁴ DsRed+Lin−cKit+ cells per recipient mouse were used. f–h and k–m, Distribution, recurrence, and lineage potential of PB Gr clones from recipient mouse AR856 receiving LT-HSC donor cells (f–h) and mouse AR541 receiving Lin−cKit+ donor cells (k–m). Data are presented in the same manner as Fig. 2b–d. i, Single-cell analysis of granulocyte Tn tags from mouse AR856 25 weeks after transplantation. j, The dominant clone identified in single-cell (SC) analysis (clone no. 1 in i) is persistently detected in PB and BM from a single femur at 33 weeks. This clone is also detected in the LT-HSC compartment.
Extended Data Figure 10. Analysis of lineage output by LT - HSCs in mouse AR1122.
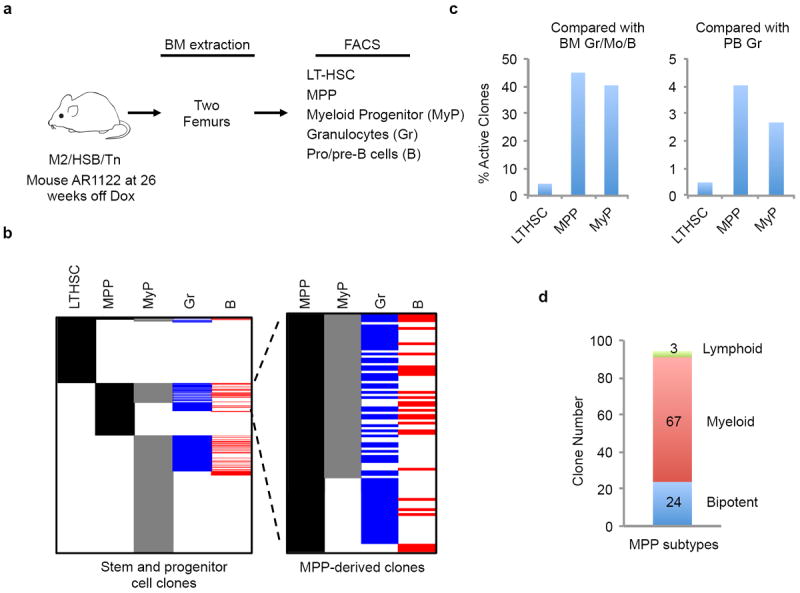
a, Schematic for clonal analyses of BM LT-HSC, multipotent progenitor (MPP), myeloerythroid progenitor (MyP), granulocytes and pro/pre-B cells. b, Comparison of identified Tn tags among different BM populations. Gr/B restricted tags are now shown. MPP-derived clones are displayed in the enlarged panel on the right. c, Percentage of LT-HSC, MPP, MyP clones that are present in BM granulocytes and pro/pre-B cells or PB granulocytes (PB Gr data are shown in Extended Data Fig. 4e). d, Subtypes of MPP clones. The lineage potential of MPP-derived clones are determined by comparing Tn tags among MPP, MyPs, granulocytes and pro/pre-B cells. Bipotent clones are those found in MPP/MyP/Gr/B, myeloid clones are MPP/Myp/Gr, and lymphoid clones are MPP/B.
Supplementary Material
Acknowledgments
We are grateful to members of the Camargo laboratory, L. Zon, S. Orkin, M. Goodell and F. Mercier for comments. We thank R. Mathew for cell sorting and Y. Fujiwara for transgenic injections (supported by NIH P30 DK049216). We thank Z. Izsvak (Max-Delbrück-Center) for HSB expression vector and M. Kay (Stanford University) for transposon plasmid. This work was supported by the NIH Director’s New Innovator Award (DP2OD006472) to F.D.C. and funds from the Harvard Stem Cell Institute to B.C. and O.H.
Footnotes
Author Contributions J.S. and F.D.C. designed the study, analysed the data, and wrote the manuscript. J.S. performed experiments with assistance of A.R. and L.L., A.R. and J.B.J. generated mouse models. B.C., Y.-J.H., O.H. developed computer scripts and A.K. performed statistical analyses on the single-cell data. F.D.C. supervised the study.
Supplementary Information is available in the online version of the paper.
Online Content Methods, along with any additional Extended Data display items and Source Data, are available in the online version of the paper; references unique to these sections appear only in the online paper.
The authors declare no competing financial interests.
References
- 1.Weissman IL. Stem cells: units of development, units of regeneration, and units in evolution. Cell. 2000;100:157–168. doi: 10.1016/s0092-8674(00)81692-x. [DOI] [PubMed] [Google Scholar]
- 2.Kondo M, et al. Biology of hematopoietic stem cells and progenitors: implications for clinical application. Annu Rev Immunol. 2003;21:759–806. doi: 10.1146/annurev.immunol.21.120601.141007. [DOI] [PubMed] [Google Scholar]
- 3.Snippert HJ, et al. Intestinal crypt homeostasis results from neutral competition between symmetrically dividing Lgr5 stem cells. Cell. 2010;143:134–144. doi: 10.1016/j.cell.2010.09.016. [DOI] [PubMed] [Google Scholar]
- 4.Kretzschmar K, Watt FM. Lineage tracing. Cell. 2012;148:33–45. doi: 10.1016/j.cell.2012.01.002. [DOI] [PubMed] [Google Scholar]
- 5.Bystrykh LV, Verovskaya E, Zwart E, Broekhuis M, de Haan G. Counting stem cells: methodological constraints. Nature Methods. 2012;9:567–574. doi: 10.1038/nmeth.2043. [DOI] [PubMed] [Google Scholar]
- 6.Kay HEM. How many cell-generations? Lancet. 1965;286:418–419. doi: 10.1016/s0140-6736(65)90763-4. [DOI] [PubMed] [Google Scholar]
- 7.Müller-Sieburg CE, Cho RH, Thoman M, Adkins B, Sieburg HB. Deterministic regulation of hematopoietic stem cell self-renewal and differentiation. Blood. 2002;100:1302–1309. [PubMed] [Google Scholar]
- 8.Dykstra B, et al. Long-term propagation of distinct hematopoietic differentiation programs in vivo. Cell Stem Cell. 2007;1:218–229. doi: 10.1016/j.stem.2007.05.015. [DOI] [PubMed] [Google Scholar]
- 9.Mátés L, et al. Molecular evolution of a novel hyperactive Sleeping Beauty transposase enables robust stable gene transfer in vertebrates. Nature Genet. 2009;41:753–761. doi: 10.1038/ng.343. [DOI] [PubMed] [Google Scholar]
- 10.Lamartina S, et al. Stringent control of gene expression in vivo by using novel doxycycline-dependent trans-activators. Hum Gene Ther. 2002;13:199–210. doi: 10.1089/10430340252769734. [DOI] [PubMed] [Google Scholar]
- 11.Yant SR, et al. High-resolution genome-wide mapping of transposon integration in mammals. Mol Cell Biol. 2005;25:2085–2094. doi: 10.1128/MCB.25.6.2085-2094.2005. [DOI] [PMC free article] [PubMed] [Google Scholar]
- 12.Akashi K, Traver D, Miyamoto T, Weissman IL. A clonogenic common myeloid progenitor that gives rise to all myeloid lineages. Nature. 2000;404:193–197. doi: 10.1038/35004599. [DOI] [PubMed] [Google Scholar]
- 13.Kiel MJ, et al. SLAM family receptors distinguish hematopoietic stem and progenitor cells and reveal endothelial niches for stem cells. Cell. 2005;121:1109–1121. doi: 10.1016/j.cell.2005.05.026. [DOI] [PubMed] [Google Scholar]
- 14.Foudi A, et al. Analysis of histone 2B-GFP retention reveals slowly cycling hematopoietic stem cells. Nature Biotechnol. 2009;27:84–90. doi: 10.1038/nbt.1517. [DOI] [PMC free article] [PubMed] [Google Scholar]
- 15.Dean FB, et al. Comprehensive human genome amplification using multiple displacement amplification. Proc Natl Acad Sci USA. 2002;99:5261–5266. doi: 10.1073/pnas.082089499. [DOI] [PMC free article] [PubMed] [Google Scholar]
- 16.Harkey MA, et al. Multiarm high-throughput integration site detection: limitations of LAM-PCR technology and optimization for clonal analysis. Stem Cells Dev. 2007;16:381–392. doi: 10.1089/scd.2007.0015. [DOI] [PubMed] [Google Scholar]
- 17.Osawa M, Hanada K, Hamada H, Nakauchi H. Long-term lymphohematopoietic reconstitution by a single CD34-low/negative hematopoietic stem cell. Science. 1996;273:242–245. doi: 10.1126/science.273.5272.242. [DOI] [PubMed] [Google Scholar]
- 18.Basu S, Hodgson G, Katz M, Dunn AR. Evaluation of role of G-CSF in the production, survival, and release of neutrophils from bone marrow into circulation. Blood. 2002;100:854–861. doi: 10.1182/blood.v100.3.854. [DOI] [PubMed] [Google Scholar]
- 19.Lemischka IR, Raulet DH, Mulligan RC. Developmental potential and dynamic behavior of hematopoietic stem cells. Cell. 1986;45:917–927. doi: 10.1016/0092-8674(86)90566-0. [DOI] [PubMed] [Google Scholar]
- 20.Jordan CT, Lemischka IR. Clonal and systemic analysis of long-term hematopoiesis in the mouse. Genes Dev. 1990;4:220–232. doi: 10.1101/gad.4.2.220. [DOI] [PubMed] [Google Scholar]
- 21.Shaposhnikov VL. Distribution of the bone marrow cells in the skeleton of mice. Biull Eksp Biol Med. 1979;87:510–512. in Russian. [PubMed] [Google Scholar]
- 22.Brugman MH, et al. Evaluating a ligation-mediated PCR and pyrosequencing method for the detection of clonal contribution in polyclonal retrovirally transduced samples. Hum Gene Ther Methods. 2013;24:68–79. doi: 10.1089/hgtb.2012.175. [DOI] [PMC free article] [PubMed] [Google Scholar]
- 23.Gerrits A, et al. Cellular barcoding tool for clonal analysis in the hematopoietic system. Blood. 2010;115:2610–2618. doi: 10.1182/blood-2009-06-229757. [DOI] [PubMed] [Google Scholar]
- 24.Naik SH, et al. Diverse and heritable lineage imprinting of early haematopoietic progenitors. Nature. 2013;496:229–232. doi: 10.1038/nature12013. [DOI] [PubMed] [Google Scholar]
- 25.Cheshier SH, Morrison SJ, Liao X, Weissman IL. In vivo proliferation and cell cycle kinetics of long-term self-renewing hematopoietic stem cells. Proc Natl Acad Sci USA. 1999;96:3120–3125. doi: 10.1073/pnas.96.6.3120. [DOI] [PMC free article] [PubMed] [Google Scholar]
- 26.Wilson A, et al. Hematopoietic stem cells reversibly switch from dormancy to self-renewal during homeostasis and repair. Cell. 2008;135:1118–1129. doi: 10.1016/j.cell.2008.10.048. [DOI] [PubMed] [Google Scholar]
- 27.Drize NJ, Keller JR, Chertkov JL. Local clonal analysis of the hematopoietic system shows that multiple small short-living clones maintain life-long hematopoiesis in reconstituted mice. Blood. 1996;88:2927–2938. [PubMed] [Google Scholar]
- 28.Drize NJ, et al. Lifelong hematopoiesis in both reconstituted and sublethally irradiated mice is provided by multiple sequentially recruited stem cells. Exp Hematol. 2001;29:786–794. doi: 10.1016/s0301-472x(01)00634-8. [DOI] [PubMed] [Google Scholar]
- 29.Zavidij O, et al. Stable long-term blood formation by stem cells in murine steady-state hematopoiesis. Stem Cells. 2012;30:1961–1970. doi: 10.1002/stem.1151. [DOI] [PubMed] [Google Scholar]
- 30.Buescher ES, Alling DW, Gallin JI. Use of an X-linked human neutrophil marker to estimate timing of lyonization and size of the dividing stem cell pool. J Clin Invest. 1985;76:1581–1584. doi: 10.1172/JCI112140. [DOI] [PMC free article] [PubMed] [Google Scholar]
- 31.Harrison DE, Lerner C, Hoppe PC, Carlson GA, Alling D. Large numbers of primitive stem cells are active simultaneously in aggregated embryo chimeric mice. Blood. 1987;69:773–777. [PubMed] [Google Scholar]
- 32.Visvader JE. Cells of origin in cancer. Nature. 2011;469:314–322. doi: 10.1038/nature09781. [DOI] [PubMed] [Google Scholar]
- 33.Beard C, Hochedlinger K, Plath K, Wutz A, Jaenisch R. Efficient method to generate single-copy transgenic mice by site-specific integration in embryonic stem cells. Genesis. 2006;44:23–28. doi: 10.1002/gene.20180. [DOI] [PubMed] [Google Scholar]
Associated Data
This section collects any data citations, data availability statements, or supplementary materials included in this article.


