

Background: Peter Pan (PPAN) localizes to nucleoli and functions in ribosome biogenesis.
Results: PPAN localizes also to mitochondria, and PPAN knockdown triggers p53-independent mitochondrial apoptosis and nucleolar stress as observed by de-stabilization of nucleophosmin.
Conclusion: PPAN orchestrates a p53-independent stress-response pathway by coupling nucleolar stress induction to the mitochondrial apoptosis.
Significance: Novel insight into the anti-apoptotic role of the ribosome processing factor PPAN is provided.
Keywords: Apoptosis, Bax, Mitochondria, Stress, Wnt Signaling, Nucleophosmin, Peter Pan, Staurosporine, Nucleoli, Ribosome Biogenesis
Abstract
Proper ribosome formation is a prerequisite for cell growth and proliferation. Failure of this process results in nucleolar stress and p53-mediated apoptosis. The Wnt target Peter Pan (PPAN) is required for 45 S rRNA maturation. So far, the role of PPAN in nucleolar stress response has remained elusive. We demonstrate that PPAN localizes to mitochondria in addition to its nucleolar localization and inhibits the mitochondrial apoptosis pathway in a p53-independent manner. Loss of PPAN induces BAX stabilization, depolarization of mitochondria, and release of cytochrome c, demonstrating its important role as an anti-apoptotic factor. Staurosporine-induced nucleolar stress and apoptosis disrupt nucleolar PPAN localization and induce its accumulation in the cytoplasm. This is accompanied by phosphorylation and subsequent cleavage of PPAN by caspases. Moreover, we show that PPAN is a novel interaction partner of the anti-apoptotic protein nucleophosmin (NPM). PPAN depletion induces NPM and upstream-binding factor (UBF) degradation, which is independent of caspases. In summary, we provide evidence for a novel nucleolar stress-response pathway involving PPAN, NPM, and BAX to guarantee cell survival in a p53-independent manner.
Introduction
Ribosome biogenesis ensures cell growth and survival and occurs in a subnuclear compartment, the nucleolus. The nucleolus forms during G1 phase around rDNA clusters termed nucleolar organizing regions (1). The rRNA precursors are transcribed by RNA polymerase I, assembled, and processed by the ribosome biogenesis machinery in a tightly regulated mechanism (2, 3).
The nucleolus functions as a cellular stress sensor for defective ribosome biogenesis and changes in nucleolar structure or function and acts as a central hub in the stress response (4). These failures are termed nucleolar or ribosomal stress and ultimately induce cell cycle arrest and/or apoptosis (2, 4–6). Nucleolar stress has multiple genotoxic and nongenotoxic causes (4). The most extensively studied mechanism underlying nucleolar stress-induced apoptosis depends on the tumor suppressor p53. Nucleolar stress induces the accumulation of free ribosomal proteins, which in turn inhibit MDM2 (mouse double minute 2 homolog), the E3-ubiquitin ligase of p53 (7). As a result, p53 is stabilized and triggers apoptosis.
Nucleolar stress has become a main focus of interest over the last decade, as nucleolar stress induction by chemotherapeutic agents is a promising approach for cancer treatment. Recent evidence uncovered novel stress-response pathways, which function independently of p53 and still result in cell cycle arrest and/or apoptosis. For instance, a nucleolar stress response in p53-silenced HCT116 cancer cells induces forced interaction of the ribosomal protein RpL11 with MDM2 resulting in E2F-1 degradation and cell cycle arrest (8). Further steps into this direction are required, as only a few p53-independent pathways are identified. Given that many cancers lack functional p53, it is of great importance to shed light on this emerging field of p53-independent pathways (5).
Staurosporine (STS)2 is a chemotherapeutic drug well known to trigger the intrinsic mitochondrial apoptosis pathway (9, 10). Activation of this pathway is characterized by release of cytochrome c from mitochondria (11). The pro-apoptotic Bcl-2 family protein BAX translocates upon an apoptotic stimulus to mitochondria and forms the mitochondrial pores by oligomerization (12). The pore formation corresponds to mitochondrial outer membrane permeabilization (MOMP), which causes cytochrome c release and mitochondrial depolarization (13). Cytosolic cytochrome c triggers apoptosome formation, which in turn activates caspases (11). The caspase cascade amplifies apoptosis and induces the hallmarks of apoptosis, including DNA fragmentation and degradation of caspase targets like poly(ADP-ribose) polymerase (PARP).
Wnt signaling regulates cell growth, proliferation, and differentiation and plays a crucial role in development and disease, including cancer (14). Canonical Wnt/β-catenin signaling is active during G1 phase to ensure cell growth and cell cycle progression (15). The Wnt target c-Myc drives RNA polymerases I–III transcription, which mediates ribosome biogenesis (16, 17). Wnt signaling also directly regulates ribosome biogenesis by activating the expression of Peter Pan (PPAN), Pescadillo (PES), and nucleophosmin (NPM/B23), all of which are essential nucleolar components of the ribosome biogenesis machinery (3, 18, 19). All three factors are up-regulated in cancers with constitutively active Wnt signaling (20–22).
PPAN was originally identified in a screen for growth-defective mutants in Drosophila (23). PPAN belongs to the conserved Brix domain protein family (biogenesis of ribosomes in Xenopus). Within the Brix domain, a σ70-like motif directly binds to rRNA (24). The yeast counterpart of PPAN, Ssf1, was studied in more detail regarding ribosome processing. It was demonstrated that PPAN, together with its interaction partner PES, regulates the maturation of the large ribosomal subunit in the nucleolus (18, 25). NPM is a direct binding factor of PES and is required for ribosome formation (19, 26). Besides, NPM is an anti-apoptotic factor regulating mitochondrial apoptosis (27). Cytosolic NPM inhibits the activation and translocation of BAX to mitochondria (27, 28) and is commonly mutated in human leukemias resulting in the expression of mislocalized cytosolic NPM (29).
We recently demonstrated that PPAN also functions independently of ribosome biogenesis. Depletion of PPAN in Xenopus embryos, which do not require ribosome biogenesis as they have maternal ribosomal storage, resulted in apoptosis (30). Interestingly, we observed a subcellular localization of human PPAN in HEK293 cells in the nucleoli but also in punctae co-staining with the mitochondrial marker MitoTracker (30). These initial findings pointed to a potential role of PPAN in mitochondrial apoptosis. However, the precise molecular mechanism underlying this novel PPAN function has remained uncharacterized.
In this study, we provide evidence that PPAN regulates mitochondrial apoptosis. PPAN functions independently of p53, highlighting its bi-functional role as a pro-survival factor in ribosome biogenesis and mitochondrial apoptosis. Collectively these data define a novel p53-independent nucleolar stress response.
EXPERIMENTAL PROCEDURES
Plasmids and siRNAs
PPAN constructs were generated by PCR amplification from HeLa cDNA and inserted into pEGFP-N1 (Life Technologies, Inc.) and pcDNA-FLAG, respectively (31). PPAN deletion mutants were generated by PCR using PPAN plasmids as a template. In PPAN(287–473)ΔNES, the NES signal comprising amino acids 312–322 was internally deleted by PCR mutagenesis.
The siRNA sequences are as follows: si PPAN-A, CCCUCGGUUUCCUUUCAUA; si PPAN-B, GGACGAUGAUGAACAGGAA; si p53, GACUCCAGUGGUAAUCUAC (32); si BAX, GCUCUGAGCAGAUCAUGAATT (33).
si control GCUACCUGUUCCAUGGCCA was described previously (31). siRNAs were obtained from Thermo Scientific and Qiagen.
Antibodies, Dyes, and Drugs
Commercial antibodies were purchased from Abnova (UBF), Pharmingen (cytochrome c), Cell Signaling (BAX (number 2772), PARP, cl. PARP, and GAPDH), Life Technologies, Inc. (NPM), Sigma (FLAG), ProteinTech (PPAN), Roche Applied Science (GFP), Santa Cruz Biotechnology (p53, lamin A/C), and Serotec (α-tubulin). Secondary antibodies were IRDye conjugates (Li-COR) for Western blotting or Alexa488 (Life Technologies, Inc.) and Cy2 and Cy3 conjugates (Dianova) for immunofluorescence stainings. MitoTracker Red CMXROS was purchased from Life Technologies, Inc., and DAPI mounting medium was from Dianova. STS, z-VAD-fluoromethyl ketone (z-VAD), and actinomycin D (AcD) were obtained from Enzo Life Sciences.
Cell Culture, Transfections, and Drug Treatments
HeLa and HEK293T cells were grown in DMEM supplemented with penicillin/streptomycin, 10% FCS, and cultured at 37 °C with 5% CO2. Cells were transfected with siRNAs (45 nm) for 48 h using Oligofectamine (Life Technologies, Inc.) or with 1 μg of plasmids for 15–24 h using polyethyleneimine (Sigma) or Lipofectamine2000 (Life Technologies, Inc.) according to the manufacturer's instructions. Cells were either incubated for 2 h with 1 μm STS or for 4–8 h with 330 nm STS in serum-free DMEM. For co-treatments, cells were simultaneously incubated with 330 nm STS and 10 μm z-VAD in serum-free DMEM. In Fig. 9, 100 μm z-VAD was added during the transfection time of 48 h. AcD was used 10 μm for 3, 4, or 8 h in serum-free DMEM. Control samples were incubated with serum-free DMEM and, where indicated, supplemented with DMSO for the indicated times.
FIGURE 9.
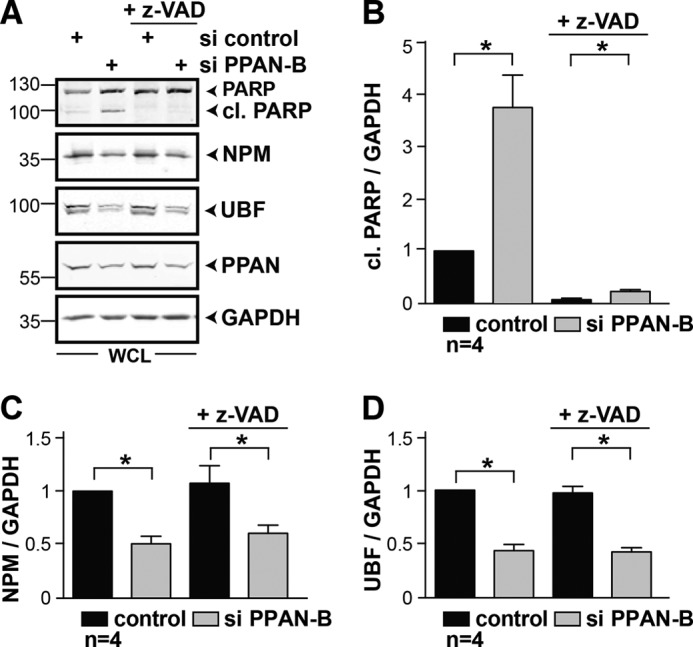
z-VAD efficiently prevents PPAN-mediated PARP cleavage but not NPM and UBF destabilization. A, loss of PPAN induces pan-caspase-dependent PARP cleavage. Transiently transfected HeLa cells were incubated with higher doses of the pan-caspase inhibitor z-VAD (100 μm) for 48 h as indicated. Control samples were incubated for 48 h without z-VAD. Whole cell lysates were analyzed by Western blotting using antibodies against PARP, NPM, UBF, PPAN, and GAPDH. Numbers indicate kDa. WCL = whole cell lysate. B, quantification of A. Relative levels of cl. PARP normalized to GAPDH as determined by densitometry. Error bars show S.E.M. Statistically significant differences are indicated by asterisks. 1st lane was set to 1. *, p < 0.05, n = number of independent experiments. C and D, quantification of NPM (C) and UBF (D) from A as shown in B. *, p < 0.05, n = number of independent experiments.
Cell Lysates, Co-immunoprecipitation, Western Blots, and Densitometry
For whole cell extracts, cells were washed once in PBS and lysed with RIPA buffer (50 mm Tris-HCl, pH 8.0, 150 mm NaCl, 1% Nonidet P-40, 0.1% SDS, 0.5% sodium deoxycholate) or were directly lysed in SDS sample buffer (Fig. 8F) followed by sonification.
FIGURE 8.
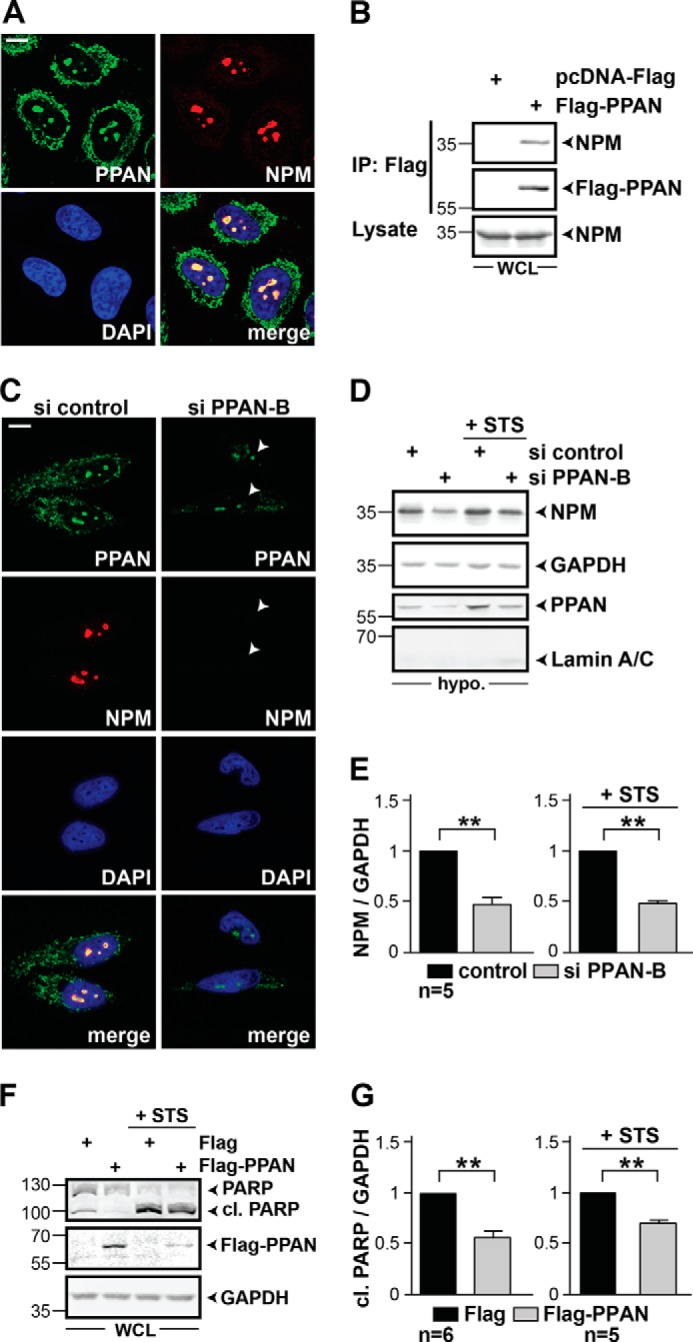
PPAN interacts with NPM and regulates NPM protein levels. A, subcellular co-localization of endogenous PPAN and NPM in nucleoli by confocal imaging. HeLa cells were stained as depicted within panels. Scale bar, 10 μm. Fluorescence images are representative of four independent experiments. B, overexpressed FLAG-PPAN interacts with endogenous NPM. Whole cell lysates of transiently transfected HEK293T cells were used for the co-immunoprecipitation. The immunoprecipitation (IP) was performed three times using covalently coupled FLAG-Sepharose beads. As a negative control, FLAG-Sepharose was incubated with FLAG empty vector transfected cell lysates. Western blots were detected with FLAG and NPM antibodies. Lysate denotes the input of the IP. Note that HEK293T cells were used due to their high transfection efficiency. WCL = whole cell lysate. C, siRNA-mediated knockdown of PPAN results in loss of nucleolar NPM. HeLa cells were stained for PPAN, NPM, and nuclei (DAPI) and analyzed by confocal microscopy. The arrowheads point to cells transfected with si PPAN-B showing both reduced PPAN and NPM staining. Scale bar, 10 μm. Fluorescence micrographs are representative of four independent experiments. D, PPAN knockdown reduces NPM protein levels in hypotonic extracts in the presence and absence of STS. HeLa cells were transiently transfected with the indicated siRNAs and incubated with STS for 2 h. Western blots of hypotonic extracts were probed for NPM, GAPDH, PPAN, and as nuclear marker lamin A/C. Of note, absence of the lamin A/C signal indicates that the hypotonic extracts do not contain nuclear proteins. Hypo. = hypotonic extracts. E, quantification of D. Relative levels of NPM normalized to GAPDH as determined by densitometry. Error bars represent S.E.M. Statistically significant differences are indicated by asterisks. The si control was set to 1. **, p < 0.005, n = number of independent experiments. Numbers in the Western blots indicate kDa. F, transient overexpression of FLAG-PPAN in HeLa cells down-regulates mitochondrial apoptosis both in presence or absence of STS as demonstrated by impaired PARP cleavage. Transiently transfected cells were incubated as indicated and whole cell lysates were subjected to Western blotting using PARP, FLAG, and GAPDH antibodies. Of note, FLAG-PPAN levels were reduced upon STS treatment indicating STS-mediated cleavage (compare 2nd and 4th lanes). G, quantification of F. Relative levels of cl. PARP normalized to GAPDH. The FLAG control was set to 1. **, p < 0.005, n = number of independent experiments. Numbers in the Western blots indicate kDa.
To obtain cytoplasmic fractions, cells were washed once in PBS and lysed in hypotonic buffer (25 mm Tris-HCl, pH 8.0, 1 mm EDTA). Where indicated, 20 mm NaF was added to the lysis buffer in case phosphatase inhibition was required. Lysates were cleared at 16,000 × g to remove nuclei. Absence of nuclear proteins in the supernatant was determined by Western blotting using lamin A/C antibodies.
For nuclear fractions, cells were washed with PBS and lysed in buffer A (10 mm HEPES, pH 7.9, 1.5 mm MgCl2,10 mm KCl) with 0.1% Nonidet P-40 (34). Nuclear fractions were pelleted at 500 × g, washed with buffer A, and were dissolved in RIPA buffer. Purity of nuclear extracts was determined by Western blotting using cytochrome c and α-tubulin as controls for mitochondria and cytosol, respectively. UBF or lamin A/C was used as nuclear loading control. Samples stimulated with 1 μm STS were co-incubated with 40 μm z-VAD to maintain the cellular integrity despite apoptosis induction. Mitochondrial fractions were obtained using the mitochondria/cytosol fractionation kit (BioVision) according to the manufacturer's protocol.
Co-immunoprecipitation of HEK293T cells was performed with FLAG-Sepharose (Sigma). Cells were transfected with polyethyleneimine and were lysed with L1 buffer (20 mm Tris-HCl, pH 8.0, 150 mm NaCl, 5 mm EDTA, 1% Triton X-100). Lysates were cleared at 16,000 × g and rotated for 2 h at 4 °C with FLAG-Sepharose; the IP was washed four times with low salt buffer (50 mm Tris-HCl, pH 8.0, 150 mm NaCl, 5 mm EDTA, 1% Triton-X-100) and cleared at 9,500 × g. Proteins were eluted with SDS sample buffer.
For the phosphatase IP, protein A/G PLUS-agarose, from Santa Cruz Biotechnology, PPAN antibodies, and hypotonic extracts (hypotonic buffer supplemented with 20 mm NaF) of STS-treated HeLa cells were rotated overnight at 4 °C. The IP was washed three times with low salt buffer to remove NaF, three times in phosphatase buffer (50 mm Tris-HCl, pH 8.0, 50 mm NaCl, 10 mm MgCl2, 0.1 mm ZnCl2), and cleared at 9,500 × g. Calf intestine phosphatase (CIP) from New England Biolabs was added for 2 h at 37 °C in New England Biolabs buffer 3 as recommended. The phosphatase was removed by performing two additional wash steps with low salt buffer and cleared at 9,500 × g. Proteins were eluted with SDS sample buffer.
Western blots were performed according to standard procedures. Nitrocellulose membranes were incubated overnight with indicated primary antibodies. As a loading control, blots were probed either with α-tubulin or GAPDH antibodies. Protein signals were visualized and quantified within a linear range of exposure using a Li-COR ODYSSEY Imager and ImageStudioLight software and eventually processed using Adobe Photoshop CS6 software. Statistical analysis was calculated with Excel and Prism software by nonparametric Mann-Whitney rank sum test using at least four experiments. The error bars indicate S.E.M.
Immunofluorescence
HeLa cells were grown on fibronectin-coated glass coverslips and treated with drugs as indicated. Cells were fixed with ice-cold methanol for 10 min and permeabilized with 0.1% Triton X-100. Cells were blocked in 0.5% BSA, incubated with primary and secondary antibodies for 2 h each, and mounted in DAPI mounting medium. Images were taken with a Leica TCS SP5 II confocal microscope (×63 objective) using LAS AF software and were eventually processed with Adobe Photoshop CS6 software. Fluorescence intensity of nucleolar PPAN was measured with ImageJ 1.44 using three-dimensional projection images generated with equal z-volume.
Nuclear Condensation Assay
HeLa cells were grown on fibronectin-coated glass coverslips and treated as indicated. Cells were washed with PBS, fixed with ice-cold methanol for 10 min, washed with PBS, and mounted in DAPI mounting medium. At least 400 cells per experiment were counted in random optical fields and are presented as percentages of cells with condensed nuclei related to the total number of randomly counted cells.
Annexin V Binding Assay
HeLa cells were grown on fibronectin-coated glass coverslips and were transfected and treated with drugs as indicated. Cells were washed with annexin binding buffer (10 mm HEPES, 140 mm NaCl, 2.5 mm CaCl2, pH 7.4) and stained with annexin V-Alexa Fluor 488 (Life Technologies, Inc.) according to the manufacturer's instructions. Cells were fixed with 4% paraformaldehyde for 15 min and mounted in DAPI mounting medium. Cells were counted in random optical fields and are presented as percentages of annexin V-positive cells related to the total number of randomly counted cells.
WST-1 Assay
Cell viability was assessed using WST-1 (water-soluble tetrazolium 1) from Roche Applied Science according to the manufacturer's instructions. HeLa cells were transfected in triplicates with 83 nm siRNAs in 96-well plates using Oligofectamine. 5 h prior to measurement, cells were incubated for 3 h with DMEM supplemented with 10 μm AcD followed by a 2-h WST-1 incubation. Unstimulated cells were incubated for 3 h with DMEM followed by a 2-h WST-1 incubation. The assay was measured 74 h after transfection using a HIDEX CHAMELEON plate reader.
NES Prediction, Mitochondrial Targeting Prediction, and Multiple Sequence Alignment
For NES prediction, the NetNES 1.1 server was used. It predicts leucine-rich NES in eukaryotic proteins using a combination of neural networks and hidden Markov models. Mitochondrial targeting sequences were predicted using the PSORT II and MitoProt II version 1.101 programs. Sequences were aligned with ClustalW2.
RESULTS
PPAN Localizes to Nucleoli and Mitochondria
PPAN was recently suggested to localize to the nucleolus and mitochondria (30). We first sought to validate this mitochondrial localization using human cervical cancer cells. Confocal imaging of endogenous PPAN showed a clear co-localization with MitoTracker in HeLa cells (Fig. 1A). The staining of both PPAN pools, in the nucleoli and the mitochondria, was considerably weaker upon transfection with two independent siRNAs targeting PPAN (Fig. 1C). Additionally, we biochemically purified mitochondria. This mitochondrial preparation was positive for PPAN and cytochrome c but negative for the cytoplasmic marker α-tubulin and the nuclear marker UBF (Fig. 1B). We also detected PPAN protein in cytosolic and nuclear fractions (Fig. 1B). Together, these findings confirm that PPAN localizes to mitochondria.
FIGURE 1.
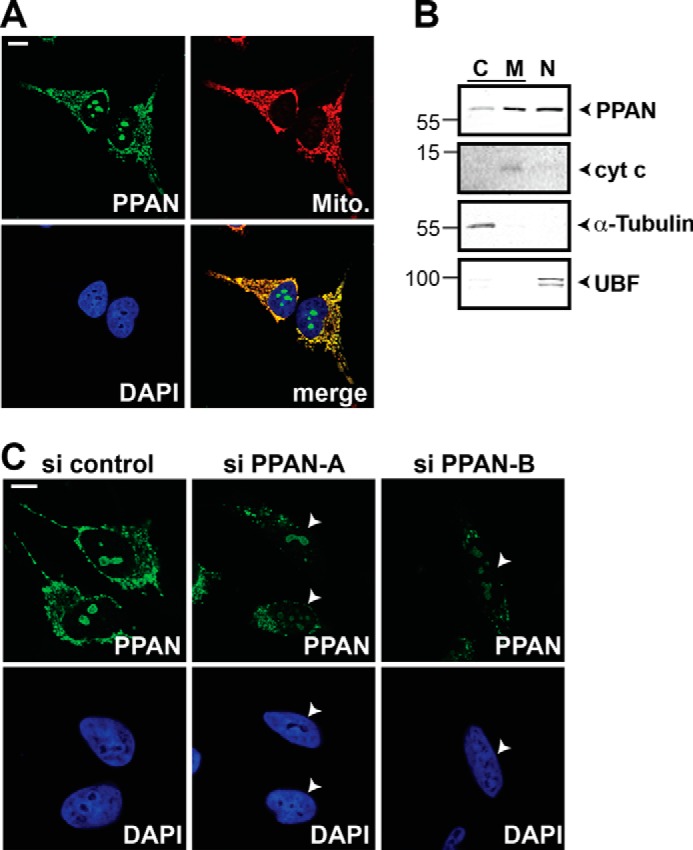
Endogenous PPAN specifically localizes to mitochondria. A, subcellular localization of endogenous PPAN protein by confocal imaging demonstrates the presence of two subcellular pools of PPAN in nucleoli and mitochondria, respectively. HeLa cells were stained for PPAN, mitochondria (Mito. indicates MitoTracker), and nuclei (DAPI) as depicted within the panels. Scale bar, 10 μm. A representative experiment is shown. B, PPAN protein is detected in cytosolic, mitochondrial and nuclear fractions. Western blot of HeLa cytosolic (C), mitochondrial (M), and nuclear (N) lysates is as indicated. Cytochrome c (cyt c) serves as mitochondrial loading control, α-tubulin and UBF were probed as negative controls for cytosol and nucleus, respectively. Numbers indicate kDa. Note that cytosolic and mitochondrial lysates were isolated by a different fractionation protocol than nuclear lysates, and therefore, PPAN protein levels cannot be directly compared. However, fractionations were performed in parallel using equal cell numbers and buffer volumes. The Western blot is representative of three independent experiments. C, siRNA-mediated knockdown of PPAN reduces both the mitochondrial and nucleolar pool of PPAN. HeLa cells were transiently transfected with two independent siRNAs against PPAN or control siRNA as indicated above the panels and analyzed by confocal microscopy. Cells were stained as depicted within the panels. The arrowheads point to cells with reduced PPAN signal. Scale bar, 10 μm. The images are representative of four experiments.
We next screened for mitochondrial localization signals using PSORT and MitoProt prediction algorithms. We identified a putative cleavable presequence located in the N terminus of PPAN (Fig. 2A). To get insights into the localization of PPAN, we cloned human PPAN, fused different fragments of PPAN to EGFP, and analyzed their intracellular localization (Fig. 2A). The N-terminal mutant PPAN(1–286) containing the putative presequence and both domains required for rRNA processing, the Brix-domain and the σ70-like motif, localized predominantly to the nucleus. In contrast, the C terminus comprising amino acids 287–473 was found in the mitochondria (Fig. 2B). A detailed in silico analysis of the C-terminal part indicated the presence of a putative nuclear export signal (NES) suggesting PPAN export from the nucleus. We found this motif to be conserved across species (data not shown). Deleting this short motif within the C-terminal half resulted in nucleolar localization of this (287–473)ΔNES mutant (Fig. 2B). The full-length C-terminally tagged PPAN-EGFP fusion localized exclusively to the nucleus and nucleoli (Fig. 2B). The N-terminally tagged FLAG-PPAN construct showed the same nucleolar localization when overexpressed (data not shown).
FIGURE 2.

PPAN has a functional NES motif and localizes to mitochondria via its C terminus. A, schematic representation of the PPAN constructs fused to EGFP as depicted. The Brix domain is shown in orange; the σ70-like motif is shown in red, and the EGFP tag is in green. The yellow line indicates the predicted cleavable mitochondrial presequence (cleavage site IRQLS). Numbers show amino acid positions. NES, nuclear export sequence. Δ312–322 denotes the internally deleted NES. B, subcellular localization of PPAN constructs when overexpressed. PPAN constructs were transiently transfected in HeLa cells as shown above panels and stained for GFP, mitochondria (Mito.), and nuclei (DAPI) as depicted within the panels. Of note, the C terminus of PPAN(287–473) localizes to mitochondria, whereas the corresponding ΔNES mutant accumulates in the nucleoli. Scale bar, 10 μm. Fluorescence images are representative of four independent experiments.
These data suggest that the N-terminal part of PPAN is sufficient for nuclear localization but does not suffice to drive PPAN localization exclusively into the nucleoli. The nucleolar localization is encoded within the C terminus, which also harbors the information for mitochondrial localization. In full-length PPAN, the nuclear localization signal is dominant over the mitochondrial localization signal, at least under conditions of overexpression. Similarly, the mitochondrial localization signal is dominant over the nucleolar localization signal when the C-terminal part of PPAN is overexpressed. Hence, these data confirm that PPAN has two main intracellular localizations, the nucleolus and the mitochondria.
PPAN Is Released from Nucleoli and Cleaved by Caspases during Nucleolar Stress and Apoptosis
Apoptosis is accompanied by a disassembly of nucleoli (6, 35). We therefore investigated the intracellular localization of endogenous PPAN upon nucleolar stress and apoptosis by stimulation with staurosporine (STS) (9, 36, 37). Immunofluorescence studies revealed a loss of nucleolar PPAN upon STS treatment in 30% of the cells and reduced nucleolar PPAN staining in 70% of the cells (Fig. 3, A and B). Nuclear preparations of unstimulated and STS-stimulated HeLa cells showed reduced levels of PPAN protein upon apoptosis induction as determined by Western blotting (Fig. 3C). In line, we found a nearly 3-fold increase of PPAN in hypotonic extracts upon STS treatment (Fig. 3, D and E), suggesting release of PPAN from nucleoli and export into the cytoplasm. The detected PPAN signal of 55 kDa was sensitive toward transfection with two independent PPAN siRNAs indicating the specificity of the observed signal (Fig. 3, D and E, left). We noticed that the down-regulation of PPAN in hypotonic lysates by si PPAN-A transfection was not significant in STS-treated cells, whereas si PPAN-A significantly reduced PPAN protein levels in unstimulated controls in the same experiment (Fig. 3, D and E). In contrast, knockdown of PPAN was apparent in STS-treated samples when transfecting the more efficient si PPAN-B (Fig. 3, D and E). We conclude that the STS-mediated release of PPAN from nucleoli disguises the si PPAN-A-mediated knockdown of PPAN in hypotonic lysates.
FIGURE 3.

Stimulating HeLa cells with STS induces the translocation of PPAN into the cytoplasm and triggers PPAN phosphorylation and cleavage in a pan-caspase-dependent manner. A, STS reduces the nucleolar PPAN localization. HeLa cells were stained for PPAN, mitochondria, and nuclei and analyzed by confocal microscopy. Representative PPAN and merge images are shown. Where indicated, cells were stimulated with STS for 2 h. The arrowhead points to loss of PPAN from nucleoli after STS treatment. Scale bar, 10 μm. Fluorescence micrographs are representative of five independent experiments. B, upper, representative three-dimensional projection images generated with equal z-volume showing normal (unstimulated), reduced (+STS), and lost (+STS) PPAN nucleolar localization. The fluorescence intensity (I) of nucleolar PPAN from representative cells is expressed as percentage and is indicated below the corresponding panels. Scale bar, 2 μm. B, lower, quantification of nucleolar PPAN localization in unstimulated and STS-stimulated cells. Cells were analyzed by fluorescence microscopy and classified according to the nucleolar localization of PPAN. The percentage of cells with normal, reduced, and lost nucleolar PPAN localization of unstimulated (−STS) and STS-stimulated cells (+STS) is depicted. Error bars represent S.E.M., p values were calculated by nonparametric Mann-Whitney rank sum test. Statistical significant differences are indicated by asterisks. **, p < 0.005. N = number represents the total number of randomly counted cells; n = number of independent experiments. C, left, stimulating HeLa cells with STS reduces PPAN levels in the nucleus. HeLa cells were simultaneously exposed to 1 μm STS and the pan-caspase inhibitor z-VAD (40 μm) for 2 h or were left untreated as indicated and subjected to nuclear fractionation. Note that z-VAD was added to maintain the cellular integrity despite apoptosis induction. Representative Western blots of nuclear (N) extracts were probed for PPAN and lamin A/C as nuclear loading control. α-Tubulin and cytochrome c (cyt c) were probed as negative controls for cytosol and mitochondria. Numbers indicate kDa. C, right, relative levels of nuclear PPAN normalized to loading control lamin A/C as determined by densitometry. Statistical significant differences are indicated by asterisks: *, p < 0.05.; n = number of independent experiments. The unstimulated control was set to 1. D, STS increases PPAN levels in hypotonic extracts. HeLa cells were transiently transfected with indicated siRNAs, exposed to STS for 2 h, and lysed with hypotonic buffer. Representative Western blots of hypotonic extracts probed for PPAN and α-tubulin as loading control are shown. Hypo. = hypotonic extract. E, quantification of D. Relative levels of PPAN normalized to loading control α-tubulin as determined by densitometry. The unstimulated control was set to 1. Statistical significant differences are indicated by asterisks: *, p < 0.05; **, p < 0.005. ns, not significant; n = number of independent experiments. F, total protein levels of PPAN decline during apoptosis. HeLa cells were exposed to STS for indicated time periods, and whole cell lysates were monitored by Western blotting. After 4 h of STS treatment, a lower molecular mass band of 35 kDa was detected by PPAN antibodies indicating PPAN cleavage. α-Tubulin serves as loading control. WCL = whole cell lysates. G, 35-kDa PPAN cleavage product is detected in hypotonic extracts. Simultaneous co-incubation with STS and the pan-caspase inhibitor z-VAD (10 μm) prevents STS-mediated PPAN cleavage. Hypotonic extracts (supplemented with NaF) of HeLa cells treated as above panels. Of note, after 4 h of STS treatment, the PPAN protein band was modified as shown by retarded mobility of the 55-kDa band. PPAN 55 and 35 kDa was detected on the same blot; however, a darker exposure of the middle panel (35 kDa) is shown. The experiment was performed three times, and a representative Western blot is depicted. Hypo. = hypotonic extract. H, STS induces PPAN phosphorylation, whereas phosphatase treatment specifically reduces the phosphorylation status of PPAN. HeLa cells were stimulated with STS for 4 h as in G, and hypotonic extracts were used for immunoprecipitation (IP) of endogenous PPAN. After NaF washout, the IP was treated with CIP as indicated. The phosphorylation status of PPAN (phos. PPAN) was determined by densitometry. Phosphorylated PPAN of the −CIP control was set to 1. Statistical significant differences are indicated: **, p < 0.005, n = number of independent experiments. Hypo. = hypotonic extract; p. = phosphorylated PPAN; de-p. = de-phosphorylated PPAN. A representative Western blot is depicted. The number in the Western blot indicates kDa.
Prolonged treatment with STS resulted in robust signs of apoptosis such as PARP cleavage (Fig. 3F). At the same time, we observed the appearance of a smaller molecular mass band of 35 kDa recognized by the anti-PPAN antibody in whole cell lysates (Fig. 3F). This was accompanied by reduced amounts of full size PPAN protein suggesting PPAN cleavage and degradation during apoptosis. The same PPAN cleavage product was observed in hypotonic extracts suggesting that the cleavage occurs in the cytoplasm and is probably mediated by caspases (Fig. 3G). To further substantiate this finding, we co-treated cells with STS and the pan-caspase inhibitor z-VAD. This treatment efficiently prevented PPAN cleavage (Fig. 3G).
When the phosphatase inhibitor NaF was added to the lysis buffer, we observed an additional full size PPAN signal migrating with lower velocity after STS treatment (Fig. 3, G and H). This pointed to a post-translational modification of PPAN during apoptosis, presumably by phosphorylation. To test this, we treated HeLa cells with STS, immunoprecipitated full size PPAN, and incubated the precipitate after NaF washout with CIP. CIP treatment resulted in an increase in the faster migrating band, whereas the slower migrating band appeared with reduced intensity. Quantification revealed a significant increase in the de-phosphorylated form of PPAN upon CIP treatment (Fig. 3H). These data show that PPAN is released from nucleoli during drug-induced nucleolar stress and apoptosis and that PPAN is subsequently post-translationally modified by phosphorylation and degraded in the cytoplasm.
PPAN Counteracts Apoptosis Independently of p53
As inhibition of ribosome formation in the nucleoli was shown to result in a stabilization of p53 (7) and apoptosis (35), we wondered whether PPAN knockdown affects p53 protein levels. We used HeLa cells, which have low basal levels of p53 and depleted PPAN by siRNAs either in non- or STS-stimulated samples. We observed a stabilization of p53 after PPAN knockdown in whole cell lysates, in particular of nonstimulated cells (Fig. 4, A and B). In contrast, we did not observe stabilization of p53 after 2 h of STS treatment of controls.
FIGURE 4.

PPAN negatively regulates the mitochondrial apoptosis pathway in a p53-independent manner. A, transient knockdown of PPAN stabilizes p53 protein levels in the absence of STS. Western blot of HeLa whole cell extracts as depicted above panels. Membranes were probed for p53, PPAN, and GAPDH. WCL = whole cell lysates. B, quantification of A. Relative levels of p53 normalized to GAPDH as determined by densitometry. The unstimulated control was set to 1. Error bars show S.E.M., statistically significant differences are indicated by asterisks: *, p < 0.05, ns = not significant; n = number of independent experiments. C, PPAN knockdown elevates cytochrome c (cyt c) accumulation in hypotonic extracts in the presence or absence of STS. Cells were treated as indicated above panels and incubated with STS for 2 h. Hypotonic extracts were subjected to Western blotting as indicated. Triggered apoptosis was monitored using antibodies against cytochrome c. α-Tubulin served as loading control. Hypo. = hypotonic extract. D, quantification of C. Relative levels of cytochrome c normalized to α-tubulin was determined by densitometry. The si control was set to 1. Statistical significant differences are indicated by asterisks, *, p < 0.05, n = number of independent experiments. E, loss of PPAN induces PARP cleavage in a p53-independent manner. Whole cell lysates of transiently transfected HeLa cells as indicated were analyzed by Western blotting using antibodies against PARP, p53, and GAPDH. WCL = whole cell lysates. F, quantification of E. Relative levels of cl. PARP normalized to GAPDH as determined by densitometry. The si control was set to 1. *, p < 0.05. G, loss of PPAN induces PARP cleavage in a p53-independent manner in presence of STS. Transiently transfected HeLa cells were exposed to STS for 2 h, and whole cell lysates were analyzed by Western blotting. H, quantification of G. Relative levels of cl. PARP normalized to GAPDH as determined by densitometry. The si control was set to 1. **, p < 0.005. Numbers in the Western blots indicate kDa.
To examine the influence of PPAN itself on apoptosis, we analyzed the effect of PPAN knockdown on cytochrome c levels in hypotonic extracts. Indeed loss of PPAN in unstimulated and STS-stimulated cells resulted in a significant increase of cytochrome c, being indicative for apoptosis induction (Fig. 4, C and D). Moreover, loss of PPAN enhanced the cleavage of PARP in whole cell lysates of unstimulated and STS-stimulated cells significantly (Fig. 4, E–H, left).
We next asked whether apoptosis triggered by PPAN loss is mediated by p53. To this end, we depleted p53 using a well characterized p53 siRNA (32) in cells also depleted of PPAN, and we quantified cleaved PARP. Interestingly, p53 knockdown did not abrogate PARP cleavage, neither in unstimulated nor in STS-stimulated cells when compared with controls (Fig. 4, E–H, right). These data demonstrate that PPAN acts in an anti-apoptotic manner and that this effect is mediated independently of stabilized p53.
PPAN Is Released from Nucleoli and Cleaved after AcD Treatment and Sensitizes Cells to AcD-mediated Apoptosis
Because STS treatment induced PPAN relocalization and degradation, we wondered whether nucleolar stress induced by other agents would have similar consequences. We investigated the effect of the clinically relevant drug AcD, which induces nuclear stress and apoptosis (4, 38). Similar to STS, PPAN staining in the nucleoli was dramatically reduced upon treatment with AcD (Fig. 5A). Besides, we observed increased levels of PPAN in hypotonic extracts after 4 and 8 h of AcD stimulation (Fig. 5B), which was accompanied by PPAN cleavage (Fig. 5C). Importantly, PPAN knockdown enhanced PARP cleavage in AcD-stimulated cells, showing that loss of PPAN sensitizes cells to AcD treatment (Fig. 5D).
FIGURE 5.

AcD triggers PPAN accumulation and cleavage in hypotonic extracts and PPAN knockdown sensitizes cells to AcD-mediated apoptosis. A, AcD treatment disturbs nucleolar localization of PPAN as monitored by confocal imaging. HeLa cells were incubated with AcD for 4 h as indicated and stained for PPAN, mitochondria (MitoTracker = Mito.), and nuclei (DAPI) as depicted within the panels. Scale bar, 10 μm. B, AcD increases PPAN levels in hypotonic extracts. HeLa cells were exposed to AcD for 4 and 8 h as indicated. The control (0h AcD) was incubated with DMSO. A representative Western blot of hypotonic (hypo.) extracts probed for PPAN, PARP, and α-tubulin is shown. C, AcD induces PPAN cleavage. HeLa cells were exposed to AcD as shown on top of the panel. A representative Western blot of whole cell lysates (WCL) probed for PPAN, PARP, and α-tubulin is shown. After 4 h of AcD, a lower molecular mass band of 35 kDa is detected by PPAN antibodies indicating PPAN cleavage. PPAN 55 and 35 kDa was detected on the same blot; however, a darker exposure of the middle panel (35 kDa) is shown. The experiments are representative of three independent experiments. D, PPAN knockdown elevates apoptosis in presence and absence of AcD. HeLa cells were transfected with si control and si PPAN-B as indicated above panels and incubated with AcD or DMSO for 3 h. Whole cell lysates were subjected to Western blotting as indicated. Induced apoptosis was monitored by PARP cleavage. The Western blot is representative of three independent experiments. E, PPAN knockdown impairs cell viability as observed by WST-1 assay. siRNA-mediated knockdown of PPAN impairs WST-1 cleavage and further abrogates AcD-mediated loss of cell viability as compared with controls. HeLa cells were transiently transfected with indicated siRNAs and analyzed by WST-1 colorimetric measurement. Where indicated, cells were exposed to 10 μm AcD for 3 h prior to measurement. Unstimulated controls were set to 100% cell viability. Error bars show S.E.M., statistically significant differences are indicated; **, p < 0.005. n = number of independent experiments.
To analyze the influence of PPAN knockdown on cell survival in general, we assessed cell viability by WST-1 colorimetric assay of unstimulated and AcD-stimulated cells. We found that knockdown of PPAN significantly diminished cell viability of unstimulated HeLa cells (Fig. 5E). The same was true for AcD-stimulated cells (Fig. 5E).
PPAN Knockdown Induces Apoptosis as Revealed by Annexin V Staining and Nuclear Condensation
To confirm our findings, we used alternative approaches to assess apoptosis induction after PPAN knockdown of untreated and STS- and AcD-treated cells. We analyzed key hallmarks of apoptosis, such as externalization of phosphatidylserine, which can be detected by annexin V staining. Indeed, PPAN knockdown significantly increased the number of annexin V-positive cells of unstimulated and STS- and AcD-stimulated cells in fluorescence analyses (Fig. 6, A–D). In addition, loss of PPAN significantly increased the number of cells with condensed nuclei of unstimulated and STS-/AcD-stimulated cells (Fig. 6, E–H). Collectively, our data support the notion that PPAN has anti-apoptotic properties.
FIGURE 6.

PPAN knockdown induces apoptosis as revealed by annexin V staining and nuclear condensation. A, siRNA-mediated knockdown of PPAN triggers apoptosis as revealed by increased annexin V staining. HeLa cells were transiently transfected with the indicated siRNAs and analyzed by confocal microscopy. The arrowheads point to cells with annexin V staining. Fluorescence images are representative of five independent experiments. Scale bar, 10 μm. B, PPAN knockdown further enhances STS-mediated apoptosis as revealed by increased annexin V staining. HeLa cells were treated for 2 h with STS and analyzed as in A. The arrowheads point to annexin V-positive cells. Fluorescence images are representative of five independent experiments. Scale bar, 10 μm. C, PPAN knockdown further enhances AcD-mediated apoptosis as revealed by increased annexin V staining. HeLa cells were treated for 3 h with AcD and analyzed as in A. The arrowheads point to annexin V-positive cells. Fluorescence images are representative of five independent experiments. Scale bar, 10 μm. D, quantification of annexin V-positive cells from A to C. Error bars show S.E.M., and statistically significant differences are indicated: *, p < 0.05; **, p < 0.005. N = numbers below bars represent total number of randomly counted cells; n = number of independent experiments. E, siRNA-mediated knockdown of PPAN results in nuclear condensation as revealed by DAPI staining. HeLa cells were transiently transfected with indicated siRNAs, and DAPI staining was analyzed by confocal microscopy. The arrowheads point to cells with condensed nuclei. Fluorescence images are representative of six independent experiments. Scale bar, 10 μm. F, PPAN knockdown further enhances STS-mediated nuclear condensation. HeLa cells were treated for 2 h with STS and analyzed as in E. The arrowheads point to cells with condensed nuclei. Fluorescence images are representative of six independent experiments. Scale bar, 10 μm. G, PPAN knockdown further enhances AcD-mediated nuclear condensation. HeLa cells were treated for 3 h with AcD and analyzed as in E. The arrowheads point to cells with condensed nuclei. Fluorescence images are representative of six independent experiments. Scale bar, 10 μm. H, quantification of cells with condensed nuclei from E to G. *, p < 0.05; **, p < 0.005. N = numbers below bars represent total number of randomly counted cells; n = number of independent experiments.
Loss of PPAN Increases MOMP through BAX Stabilization
Our initial data indicated that loss of PPAN triggers cytochrome c release from the mitochondria (Fig. 4C). Together with the mitochondrial localization, this suggested that PPAN might act at the level of mitochondrial apoptosis. To test this, we monitored MOMP by use of MitoTracker, which is a well known readout for this purpose (39, 40). Indeed, siRNA-mediated knockdown of PPAN resulted in a greatly reduced signal for MitoTracker thereby indicating loss of mitochondrial membrane potential and increase of MOMP (Fig. 7A). To provide further proof that this is based on MOMP, we investigated the protein levels of BAX. Immunofluorescence staining of PPAN-depleted cells revealed an increase of BAX staining in MitoTracker-negative cells when compared with controls (Fig. 7B). This argues that BAX is destabilized in the presence of PPAN.
FIGURE 7.
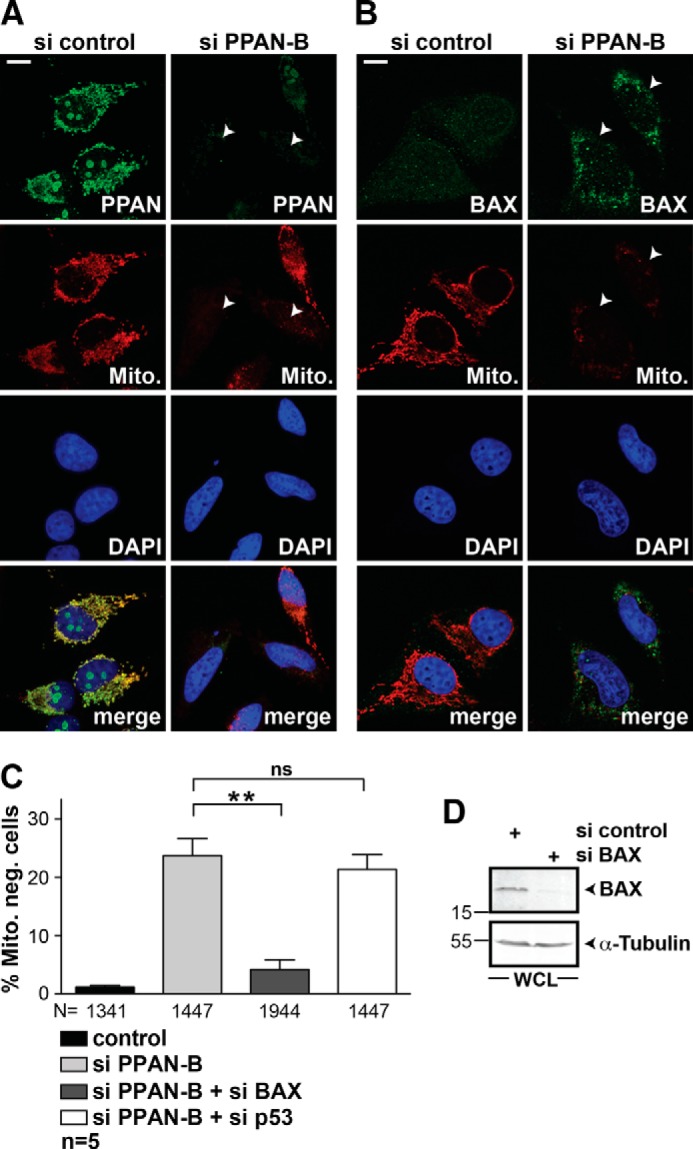
PPAN knockdown induces BAX-dependent mitochondrial depolarization. A, siRNA-mediated knockdown of PPAN results in mitochondrial depolarization as revealed by impaired MitoTracker staining. HeLa cells were transiently transfected with indicated siRNAs and analyzed by confocal microscopy. Cells were stained as depicted within panels. The arrowheads point to cells transfected with si PPAN-B lacking both PPAN expression and MitoTracker staining. Fluorescence images are representative of five independent experiments. Scale bar, 10 μm. B, siRNA-mediated knockdown of PPAN stabilizes BAX protein levels. HeLa cells were transiently transfected as in A. Cells were stained as depicted within panels. The arrowheads point to cells transfected with si PPAN-B showing increased BAX staining as well as loss of MitoTracker staining. Fluorescence micrographs are representative of three independent experiments. Scale bar, 10 μm. C, mitochondrial depolarization after PPAN knockdown is rescued upon BAX siRNA co-transfection but not by p53 siRNA. Quantification of MitoTracker-negative cells after siRNA transfection as indicated. Error bars show S.E.M., statistically significant differences are indicated, **, p < 0.005, ns, not significant. N = numbers below bars represent total number of randomly counted cells; n = number of independent experiments. D, siRNA-mediated knockdown of BAX. HeLa cells were transiently transfected with indicated siRNAs. A representative Western blot of whole cell lysates probed for BAX and α-tubulin is shown. Numbers in the Western blots indicate kDa. WCL = whole cell lysate.
If loss of PPAN leads to BAX-mediated MOMP, then simultaneous knockdown of BAX should re-establish the MitoTracker staining. We addressed this issue similarly and quantified the number of MitoTracker-negative cells. Co-transfection of PPAN siRNA with a functional BAX siRNA significantly restored the MitoTracker signal almost back to normal levels. In contrast, PPAN siRNA alone or co-transfected with p53 siRNA showed more than 20% of MitoTracker-negative cells (Fig. 7, C and D). Hence, loss of PPAN per se suffices to trigger apoptosis via BAX stabilization independently of p53.
PPAN Interacts with NPM
To elucidate the underlying mechanism, we investigated the interaction partners of PPAN. We concentrated on NPM as a putative candidate due to the fact it (i) interacts with the PPAN interaction partner PES (26) and (ii) counteracts apoptosis by preventing BAX translocation to mitochondria (27). Subcellular localization analysis of endogenous PPAN and NPM showed a clear co-localization in nucleoli by confocal imaging, whereas NPM was not detected in the cytoplasm by this method (Fig. 8A). We could specifically co-immunoprecipitate endogenous NPM from HEK293T whole cell lysates with FLAG-PPAN, whereas FLAG immunoprecipitates were negative for NPM (Fig. 8B). Together, this shows that PPAN forms complexes with NPM.
In STS-induced apoptotic cells, the nucleolar localization of PPAN (compare Fig. 3A) and NPM (37) was disturbed, suggesting that the localization of either protein is affected following nucleolar stress and apoptosis. Thus, we analyzed whether PPAN knockdown alters NPM localization. PPAN-depleted cells showed reduced overall NPM staining when compared with controls (Fig. 8C). To quantify this, we analyzed HeLa lysates for NPM by Western blotting. We detected a significant decrease of NPM by as much as 50% after PPAN depletion, which was apparent in hypotonic and whole cell extracts of unstimulated (Fig. 8, D and E, 9A) and STS-stimulated cells (Fig. 8, D and E). In summary, our data suggest that PPAN is required for NPM protein stability.
To elucidate whether nucleolar PPAN makes cells more resistant to nuclear stress and apoptosis, we overexpressed FLAG-tagged PPAN in HeLa cells and monitored PARP cleavage in unstimulated and STS-stimulated cells. Indeed, cells expressing FLAG-PPAN showed significantly reduced PARP cleavage, both in unstimulated and STS-stimulated cells when compared with FLAG empty vector expressing cells (Fig. 8, F and G).
UBF and NPM Destabilization Occur Irrespective of Caspases
It was recently reported that the nucleolar proteins NPM and UBF are targeted by caspases during apoptosis (41–43). Thus, we wondered whether the destabilization of NPM after PPAN knockdown is simply a result of triggering mitochondrial apoptosis. To address this, we first monitored NPM and UBF protein levels of PPAN siRNA-transfected cells in the presence or absence of z-VAD. We observed a significant destabilization of UBF after PPAN knockdown when compared with controls, which was also detected for NPM (Fig. 9, A, C, and D, left). Using high doses of z-VAD, we could efficiently down-regulate PPAN-mediated PARP cleavage, revealing that caspases were blocked robustly (Fig. 9, A and B, right). Still, we failed to stabilize NPM or UBF (Fig. 9, A, C, and D, right). Because of the fact that z-VAD did not influence the protein levels of NPM or UBF after PPAN knockdown, we can rule out a contribution of caspases. Moreover, NPM and UBF were destabilized irrespective of p53, given that p53 knockdown did not alter the protein levels of either protein (Fig. 10).
FIGURE 10.
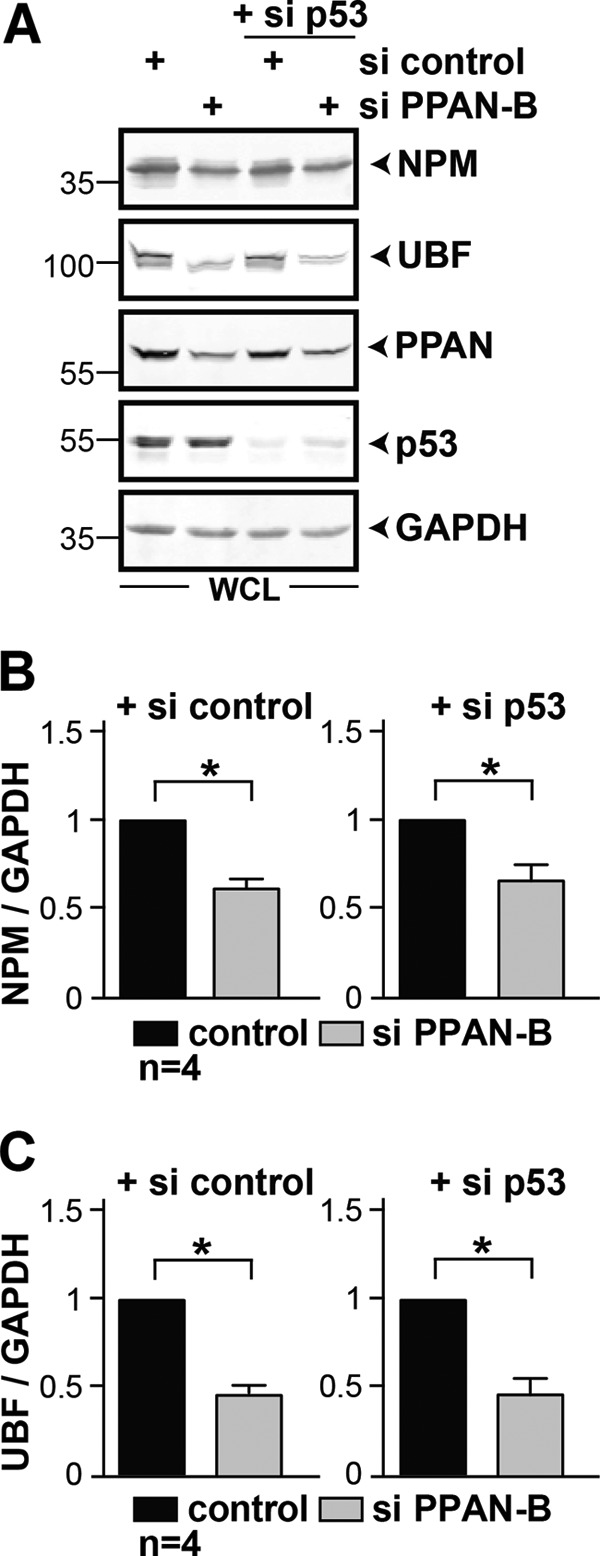
siRNA-mediated knockdown of PPAN destabilizes NPM and UBF in a p53-independent manner. A, HeLa cells were transiently transfected with the indicated siRNAs. Western blots of whole cell lysates (WCL) were probed for NPM, UBF, PPAN, p53, and GAPDH. Numbers indicate kDa. B, relative levels of NPM from A normalized to GAPDH as determined by densitometry. Error bars show S.E.M., statistically significant differences are indicated by asterisks. The si control was set to 1. *, p < 0.05; n = number of independent experiments. C, relative levels of UBF from A normalized to GAPDH as seen in B. The si control was set to 1. *, p < 0.05; n = number of independent experiments.
DISCUSSION
We show here for the first time that PPAN inhibits mitochondrial apoptosis independently of p53. These data allow us to define a novel nucleolar stress-response pathway that acts in parallel to p53-mediated effects.
PPAN Inhibits Mitochondrial Apoptosis Independently of p53
Our knockdown experiments show that PPAN is required to actively inhibit the mitochondrial apoptosis program. We placed PPAN upstream of cytochrome c as it has a pivotal role in blocking BAX stabilization and BAX-mediated mitochondrial membrane permeabilization. PPAN depletion sensitizes cells to the chemotherapeutic drugs STS and AcD indicating that PPAN might be part of the nucleolar stress-response pathway.
PPAN overexpression in nuclei/nucleoli reduces PARP cleavage in unstimulated and STS-stimulated cells, demonstrating that the nuclear/nucleolar pool of PPAN counteracts apoptosis. In contrast, endogenous PPAN localizes also to mitochondria, and PPAN siRNA knocks down PPAN in either compartment. Hence, does mitochondrial PPAN also inhibit apoptosis? A pro-argument is that the net outcome of PPAN knockdown is pro-apoptotic. Mitochondrial depolarization and increased cytochrome c release following PPAN knockdown would further suggest that PPAN exerts anti-apoptotic properties within the mitochondria. Together, this indicates that PPAN is required to sustain cell viability at different cellular levels and that in case of failure an amplified stress response could be ensured. However, a thorough in-depth analysis is necessary to elucidate the precise role of mitochondrial PPAN.
Interfering with ribosome biogenesis is well known to result in p53 accumulation and apoptosis (7). Indeed, PPAN knockdown stabilizes p53, which is more prominent in unstimulated cells. A slight increase in p53 levels is also detected in STS-treated cells. Taken together, our findings indicate that loss of PPAN could initiate the p53-mediated program. Nevertheless, p53 knockdown does not alter PARP cleavage nor the mitochondrial depolarization in PPAN-depleted cells, revealing that PPAN-mediated apoptosis functions independently of p53. Interestingly, yeast is also sensitive to stress, although p53-dependent stress-response mechanisms do not count, because yeast lacks p53 and MDM2 proteins (44). Consequently ancestral, the so far unraveled modes of p53-independent stress response could exist, which were retained in higher organisms as a safety mechanism. Our data add a novel p53-independent stress response mechanism to the still small number of p53-independent pathways with PPAN being a potential candidate orchestrating an ancient stress-response pathway.
Nucleolar PPAN Is Exported and Degraded following Nucleolar Stress and Apoptosis
We show that endogenous PPAN is lost from nucleoli and accumulates in the cytoplasm in STS- and AcD-treated cells, arguing that its nuclear export is favored following cellular stress. We assume that PPAN is exported to robustly trigger the apoptotic response. Export might be a mechanism to foster its additional cytoplasmic and mitochondrial functions.
We found that PPAN is phosphorylated following STS exposure. Phosphorylation might be either a prerequisite or consequence of STS-induced PPAN relocalization. It was noticed that post-translational modifications of nucleolar proteins might play a major role in stress-induced nucleolar reorganization (4). Several nucleolar proteins, among them NPM, are exported and phosphorylated following stress to provoke the stress response (28) to be in agreement with our data. As the stress stimulus continues, PPAN cleavage products are detected in hypotonic extracts indicating that it is cleaved in the cytoplasm in a caspase-dependent manner. In line, we observe that FLAG-PPAN levels are reduced upon STS treatment when compared with the unstimulated samples suggesting STS-mediated degradation of overexpressed PPAN similar to endogenous PPAN.
The PPAN antibody used in our study was raised against the C-terminal 300 amino acids. Consequently, the 35-kDa fragment generated during apoptosis might represent the C-terminal part of PPAN. Data supporting this come from apoptotic T-lymphocytes, in which PPAN was found to be cleaved at the AEPD motif located in the center of the protein (45).
In general, cleavage might be a mechanism to inactivate anti-apoptotic factors to allow efficient execution of cell death. This is based on the fact that anti-apoptotic Bcl-2 is a substrate of caspases, for example. The cleavage event even converts Bcl-2 into a pro-apoptotic BAX-like fragment to enhance the apoptotic response (46, 47). Whether this is true for the 35-kDa PPAN fragment remains to be determined.
We noticed that the expression of the mitochondrial PPAN mutant (287–473) was weak in comparison with the other PPAN-EGFP constructs, which therefore prevented further gain-of-function experiments (data not shown). Importantly, the corresponding nucleolar PPAN(287–473)ΔNES mutant was strongly expressed (data not shown). As only low expressing cells were detected, we speculate that mitochondrial PPAN(287–473) might either be destabilized or might induce apoptosis when overexpressed. It is presently unclear whether this is a dominant-negative effect of the truncated mutant or whether it reflects the function of mitochondrial PPAN.
PPAN Interacts with NPM and Stabilizes NPM and UBF
Nucleoli are sites of ribosome biogenesis; however, increasing evidence emerges showing that they also function as stress sensors and participate in apoptosis (1). Nucleolar localization of UBF is lost early during apoptosis as a result of cleavage by caspases (41, 42), and NPM gets degraded after caspase-3 activation (43). Also, PPAN knockdown reduces UBF and NPM protein levels. Interestingly, this degradation occurs in a caspase-independent manner. PPAN knockdown might induce proteasomal degradation of NPM and UBF. In support of this, it was reported that proteasomes are active early during apoptosis and precede caspase activation (48). Strikingly, it was shown that UBF is degraded by the proteasome and that NPM is stabilized by the proteasome inhibitor MG132 (49, 50). In fact, the previously observed cleavage of UBF into multiple fragments implies that UBF might be targeted by several proteases during apoptosis (42). It was suggested that the degradation of key nuclear substrates contributes to the apoptosis-induced collapse of the nuclear structure followed by nuclear fragmentation.
We found that overexpressed PPAN binds to NPM and that both co-localize in nucleoli. The complex formation of PPAN with NPM seems to be necessary to prevent NPM destabilization. It is well established that destabilization of key factors of nucleolar integrity, like NPM and UBF, represent markers for nucleolar stress preceding apoptosis (6, 36). This suggests that loss of PPAN per se suffices to induce nucleolar stress and early events of apoptosis. Vice versa, FLAG-PPAN overexpressing cells became more resistant to apoptotic stimuli.
Recently, a novel NPM-BAX pathway was identified, orchestrating death evasion in hepatocellular carcinoma cells. It was shown that lowering NPM levels induces BAX accumulation in mitochondria to trigger apoptosis independently of p53 (27). The striking similarities to our data obtained from cervical cancer cells argue for PPAN functioning upstream of the NPM-BAX pathway, as PPAN loss induces (i) NPM degradation, (ii) BAX stabilization, and most probably (iii) BAX activation, which is followed by mitochondrial depolarization. Because NPM up-regulation and p53 inactivation are frequently found in progressing cancers, it is tempting to speculate that PPAN might be a target for anti-cancer therapies to antagonize cancer death evasion by triggering nucleolar stress and apoptosis. In support of this, PPAN expression is regulated by Wnt signaling pathways (20, 30) and could be up-regulated in cancers with the constitutive Wnt-on mode. However, further studies are necessary to prove the clinical significance of our findings.
PPAN Localization, Evidence for Tight Control Mechanisms
To understand the mitochondrial localization of PPAN, we screened for mitochondrial localization signals by database analyses. Using PSORT and MitoProt prediction algorithms, we identified a putative cleavable presequence located in the N terminus of PPAN. Cleavable presequences are the classical type of mitochondrial targeting signals and are typically located in the N terminus of the precursor proteins (51). Additionally, we experimentally identified a mitochondrial localization domain located in the C-terminal half of PPAN. It has been reported that some mitochondrial proteins contain rather diverse targeting signals at various positions. However, these presequence-like motifs are occasionally solely used for targeting and do not necessarily have to be cleaved (51).
Interestingly, we showed that overexpressed full-length PPAN localizes to the nucleus and nucleoli, similar to the yeast counterpart (52). We found that this distribution is independent of neither the size (FLAG versus EGFP) nor the terminus (N or C) of the added tag. In contrast, endogenous PPAN is found in nucleoli and mitochondria. We assume that the N-terminal Brix- and σ70-like motif might mask the mitochondrial localization signals under conditions of overexpression, as the mutant PPAN(287–473) lacking these domains localizes to mitochondria.
Moreover, we identified a functional leucine- and lysine-rich NES motif within the C terminus. The human PPAN NES is highly conserved and shares 60% amino acid identity to Xenopus PPAN. Internal deletion of the NES in the mutant (287–473) induces nucleolar localization, suggesting that PPAN contains a C-terminal nucleolar localization signal, over which the NES is dominant. Our data reveal that PPAN shuttles between the nucleus, cytoplasm, and mitochondria as different domains of PPAN are targeted to different intracellular compartments.
Collectively, our data establish a novel p53-independent nucleolar stress-response pathway involving PPAN-NPM-BAX. Further work is required to uncover the regulatory mechanisms underlying this pathway.
Acknowledgments
We thank P. Dietmann for technical support and J. Behrens and M. Philipp for providing plasmids and reagents.
This work was supported by German Federal Ministry of Research and Technology within SyStaR Grant BMF0315894A (to M. Kühl), State of Baden-Württemberg Perspektivförderung (to M. Kühl), and Medical Faculty of Ulm University Baustein 3.2, LSBN0101 (to A. S. P.).
- STS
- staurosporine
- AcD
- actinomycin D
- CIP
- calf intestine phosphatase
- cl. PARP
- cleaved poly(ADP-ribose)polymerase
- EGFP
- enhanced green fluorescent protein
- IP
- immunoprecipitation
- Mito.
- MitoTracker
- MOMP
- mitochondria outer membrane permeabilization
- NES
- nuclear export sequence
- NPM
- nucleophosmin
- PARP
- poly(ADP-ribose) polymerase
- PES
- Pescadillo
- p
- phosphorylated
- UBF
- upstream-binding factor
- WCL
- whole cell lysate
- WST-1
- water-soluble tetrazolium 1
- z-VAD
- carbobenzoxy-valyl-alanyl-aspartyl-(O-methyl-fluoromethyl ketone).
REFERENCES
- 1. Boisvert F. M., van Koningsbruggen S., Navascués J., Lamond A. I. (2007) The multifunctional nucleolus. Nat. Rev. Mol. Cell Biol. 8, 574–585 [DOI] [PubMed] [Google Scholar]
- 2. Burger K., Eick D. (2013) Functional ribosome biogenesis is a prerequisite for p53 destabilization: impact of chemotherapy on nucleolar functions and RNA metabolism. Biol. Chem. 394, 1133–1143 [DOI] [PubMed] [Google Scholar]
- 3. Fatica A., Tollervey D. (2002) Making ribosomes. Curr. Opin. Cell Biol. 14, 313–318 [DOI] [PubMed] [Google Scholar]
- 4. Boulon S., Westman B. J., Hutten S., Boisvert F. M., Lamond A. I. (2010) The nucleolus under stress. Mol. Cell 40, 216–227 [DOI] [PMC free article] [PubMed] [Google Scholar]
- 5. Holmberg Olausson K., Nistér M., Lindström M. S. (2012) p53-dependent and -independent nucleolar stress responses. Cells 1, 774–798 [DOI] [PMC free article] [PubMed] [Google Scholar]
- 6. Rubbi C. P., Milner J. (2003) Disruption of the nucleolus mediates stabilization of p53 in response to DNA damage and other stresses. EMBO J. 22, 6068–6077 [DOI] [PMC free article] [PubMed] [Google Scholar]
- 7. Dai M. S., Zeng S. X., Jin Y., Sun X. X., David L., Lu H. (2004) Ribosomal protein L23 activates p53 by inhibiting MDM2 function in response to ribosomal perturbation but not to translation inhibition. Mol. Cell. Biol. 24, 7654–7668 [DOI] [PMC free article] [PubMed] [Google Scholar]
- 8. Donati G., Brighenti E., Vici M., Mazzini G., Treré D., Montanaro L., Derenzini M. (2011) Selective inhibition of rRNA transcription downregulates E2F-1: a new p53-independent mechanism linking cell growth to cell proliferation. J. Cell Sci. 124, 3017–3028 [DOI] [PubMed] [Google Scholar]
- 9. Stepczynska A., Lauber K., Engels I. H., Janssen O., Kabelitz D., Wesselborg S., Schulze-Osthoff K. (2001) Staurosporine and conventional anticancer drugs induce overlapping, yet distinct pathways of apoptosis and caspase activation. Oncogene 20, 1193–1202 [DOI] [PubMed] [Google Scholar]
- 10. Nicolier M., Decrion-Barthod A. Z., Launay S., Prétet J. L., Mougin C. (2009) Spatiotemporal activation of caspase-dependent and -independent pathways in staurosporine-induced apoptosis of p53wt and p53mt human cervical carcinoma cells. Biol. Cell 101, 455–467 [DOI] [PubMed] [Google Scholar]
- 11. Cain K. (2003) Chemical-induced apoptosis: formation of the Apaf-1 apoptosome. Drug Metab. Rev. 35, 337–363 [DOI] [PubMed] [Google Scholar]
- 12. Westphal D., Kluck R. M., Dewson G. (2014) Building blocks of the apoptotic pore: how Bax and Bak are activated and oligomerize during apoptosis. Cell Death Differ. 21, 196–205 [DOI] [PMC free article] [PubMed] [Google Scholar]
- 13. Heiskanen K. M., Bhat M. B., Wang H. W., Ma J., Nieminen A. L. (1999) Mitochondrial depolarization accompanies cytochrome c release during apoptosis in PC6 cells. J. Biol. Chem. 274, 5654–5658 [DOI] [PubMed] [Google Scholar]
- 14. MacDonald B. T., Tamai K., He X. (2009) Wnt/β-catenin signaling: components, mechanisms, and diseases. Dev. Cell 17, 9–26 [DOI] [PMC free article] [PubMed] [Google Scholar]
- 15. Niehrs C., Acebron S. P. (2012) Mitotic and mitogenic Wnt signalling. EMBO J. 31, 2705–2713 [DOI] [PMC free article] [PubMed] [Google Scholar]
- 16. Arabi A., Wu S., Ridderstråle K., Bierhoff H., Shiue C., Fatyol K., Fahlén S., Hydbring P., Söderberg O., Grummt I., Larsson L. G., Wright A. P. (2005) c-Myc associates with ribosomal DNA and activates RNA polymerase I transcription. Nat. Cell Biol. 7, 303–310 [DOI] [PubMed] [Google Scholar]
- 17. Grandori C., Gomez-Roman N., Felton-Edkins Z. A., Ngouenet C., Galloway D. A., Eisenman R. N., White R. J. (2005) c-Myc binds to human ribosomal DNA and stimulates transcription of rRNA genes by RNA polymerase I. Nat. Cell Biol. 7, 311–318 [DOI] [PubMed] [Google Scholar]
- 18. Fatica A., Cronshaw A. D., Dlakić M., Tollervey D. (2002) Ssf1p prevents premature processing of an early pre-60S ribosomal particle. Mol. Cell 9, 341–351 [DOI] [PubMed] [Google Scholar]
- 19. Lindström M. S. (2011) NPM1/B23: a multifunctional chaperone in ribosome biogenesis and chromatin remodeling. Biochem. Res. Int. 2011, 195209. [DOI] [PMC free article] [PubMed] [Google Scholar]
- 20. Sansom O. J., Meniel V. S., Muncan V., Phesse T. J., Wilkins J. A., Reed K. R., Vass J. K., Athineos D., Clevers H., Clarke A. R. (2007) Myc deletion rescues Apc deficiency in the small intestine. Nature 446, 676–679 [DOI] [PubMed] [Google Scholar]
- 21. Xie W., Feng Q., Su Y., Dong B., Wu J., Meng L., Qu L., Shou C. (2012) Transcriptional regulation of PES1 expression by c-Jun in colon cancer. PLoS One 7, e42253. [DOI] [PMC free article] [PubMed] [Google Scholar]
- 22. Willert J., Epping M., Pollack J. R., Brown P. O., Nusse R. (2002) A transcriptional response to Wnt protein in human embryonic carcinoma cells. BMC Dev. Biol. 2, 8. [DOI] [PMC free article] [PubMed] [Google Scholar]
- 23. Migeon J. C., Garfinkel M. S., Edgar B. A. (1999) Cloning and characterization of peter pan, a novel Drosophila gene required for larval growth. Mol. Biol. Cell 10, 1733–1744 [DOI] [PMC free article] [PubMed] [Google Scholar]
- 24. Wehner K. A., Baserga S. J. (2002) The σ(70)-like motif: a eukaryotic RNA binding domain unique to a superfamily of proteins required for ribosome biogenesis. Mol. Cell 9, 329–339 [DOI] [PubMed] [Google Scholar]
- 25. Bogengruber E., Briza P., Doppler E., Wimmer H., Koller L., Fasiolo F., Senger B., Hegemann J. H., Breitenbach M. (2003) Functional analysis in yeast of the Brix protein superfamily involved in the biogenesis of ribosomes. FEMS Yeast Res. 3, 35–43 [DOI] [PubMed] [Google Scholar]
- 26. Zhang J., Yang Y., Wu J. (2009) B23 interacts with PES1 and is involved in nucleolar localization of PES1. Acta Biochim. Biophys. Sin. 41, 991–997 [DOI] [PubMed] [Google Scholar]
- 27. Lo S. J., Fan L. C., Tsai Y. F., Lin K. Y., Huang H. L., Wang T. H., Liu H., Chen T. C., Huang S. F., Chang C. J., Lin Y. J., Yung B. Y., Hsieh S. Y. (2013) A novel interaction of nucleophosmin with BCL2-associated X protein regulating death evasion and drug sensitivity in human hepatoma cells. Hepatology 57, 1893–1905 [DOI] [PubMed] [Google Scholar]
- 28. Lindenboim L., Borner C., Stein R. (2011) Nuclear proteins acting on mitochondria. Biochim. Biophys. Acta 1813, 584–596 [DOI] [PubMed] [Google Scholar]
- 29. Colombo E., Alcalay M., Pelicci P. G. (2011) Nucleophosmin and its complex network: a possible therapeutic target in hematological diseases. Oncogene 30, 2595–2609 [DOI] [PubMed] [Google Scholar]
- 30. Bugner V., Tecza A., Gessert S., Kühl M. (2011) Peter Pan functions independently of its role in ribosome biogenesis during early eye and craniofacial cartilage development in Xenopus laevis. Development 138, 2369–2378 [DOI] [PubMed] [Google Scholar]
- 31. Pfister A. S., Tanneberger K., Schambony A., Behrens J. (2012) Amer2 protein is a novel negative regulator of Wnt/β-catenin signaling involved in neuroectodermal patterning. J. Biol. Chem. 287, 1734–1741 [DOI] [PMC free article] [PubMed] [Google Scholar]
- 32. Brummelkamp T. R., Bernards R., Agami R. (2002) A system for stable expression of short interfering RNAs in mammalian cells. Science 296, 550–553 [DOI] [PubMed] [Google Scholar]
- 33. Fang H., Harned T. M., Kalous O., Maldonado V., DeClerck Y. A., Reynolds C. P. (2011) Synergistic activity of fenretinide and the Bcl-2 family protein inhibitor ABT-737 against human neuroblastoma. Clin. Cancer Res. 17, 7093–7104 [DOI] [PMC free article] [PubMed] [Google Scholar]
- 34. Dignam J. D., Lebovitz R. M., Roeder R. G. (1983) Accurate transcription initiation by RNA polymerase II in a soluble extract from isolated mammalian nuclei. Nucleic Acids Res. 11, 1475–1489 [DOI] [PMC free article] [PubMed] [Google Scholar]
- 35. Suzuki A., Kogo R., Kawahara K., Sasaki M., Nishio M., Maehama T., Sasaki T., Mimori K., Mori M. (2012) A new PICTure of nucleolar stress. Cancer Sci. 103, 632–637 [DOI] [PMC free article] [PubMed] [Google Scholar]
- 36. Marquez-Lona E. M., Tan Z., Schreiber S. S. (2012) Nucleolar stress characterized by downregulation of nucleophosmin: a novel cause of neuronal degeneration. Biochem. Biophys. Res. Commun. 417, 514–520 [DOI] [PMC free article] [PubMed] [Google Scholar]
- 37. Geng Y., Walls K. C., Ghosh A. P., Akhtar R. S., Klocke B. J., Roth K. A. (2010) Cytoplasmic p53 and activated Bax regulate p53-dependent, transcription-independent neural precursor cell apoptosis. J. Histochem. Cytochem. 58, 265–275 [DOI] [PMC free article] [PubMed] [Google Scholar]
- 38. Hoye A. T., Davoren J. E., Wipf P., Fink M. P., Kagan V. E. (2008) Targeting mitochondria. Acc. Chem. Res. 41, 87–97 [DOI] [PubMed] [Google Scholar]
- 39. Susin S. A., Lorenzo H. K., Zamzami N., Marzo I., Snow B. E., Brothers G. M., Mangion J., Jacotot E., Costantini P., Loeffler M., Larochette N., Goodlett D. R., Aebersold R., Siderovski D. P., Penninger J. M., Kroemer G. (1999) Molecular characterization of mitochondrial apoptosis-inducing factor. Nature 397, 441–446 [DOI] [PubMed] [Google Scholar]
- 40. Perry S. W., Norman J. P., Barbieri J., Brown E. B., Gelbard H. A. (2011) Mitochondrial membrane potential probes and the proton gradient: a practical usage guide. BioTechniques 50, 98–115 [DOI] [PMC free article] [PubMed] [Google Scholar]
- 41. Torres-Montaner A., Bolívar J., Astola A., Gimenez-Mas J. A., Brieva J. A., Valdivia M. M. (2000) Immunohistochemical detection of ribosomal transcription factor UBF and AgNOR staining identify apoptotic events in neoplastic cells of Hodgkin's disease and in other lymphoid cells. J. Histochem. Cytochem. 48, 1521–1530 [DOI] [PubMed] [Google Scholar]
- 42. Casiano C. A., Martin S. J., Green D. R., Tan E. M. (1996) Selective cleavage of nuclear autoantigens during CD95 (Fas/APO-1)-mediated T cell apoptosis. J. Exp. Med. 184, 765–770 [DOI] [PMC free article] [PubMed] [Google Scholar]
- 43. Chou C. C., Yung B. Y. (2001) Increased stability of nucleophosmin/B23 in anti-apoptotic effect of ras during serum deprivation. Mol. Pharmacol. 59, 38–45 [DOI] [PubMed] [Google Scholar]
- 44. James A., Wang Y., Raje H., Rosby R., DiMario P. (2014) Nucleolar stress with and without p53. Nucleus 5, 402–426 [DOI] [PMC free article] [PubMed] [Google Scholar]
- 45. Van Damme P., Martens L., Van Damme J., Hugelier K., Staes A., Vandekerckhove J., Gevaert K. (2005) Caspase-specific and nonspecific in vivo protein processing during Fas-induced apoptosis. Nat. Methods 2, 771–777 [DOI] [PubMed] [Google Scholar]
- 46. Zhu J., Yang Y., Wu J. (2007) Bcl-2 cleavages at two adjacent sites by different caspases promote cisplatin-induced apoptosis. Cell Res. 17, 441–448 [DOI] [PubMed] [Google Scholar]
- 47. Cheng E. H., Kirsch D. G., Clem R. J., Ravi R., Kastan M. B., Bedi A., Ueno K., Hardwick J. M. (1997) Conversion of Bcl-2 to a Bax-like death effector by caspases. Science 278, 1966–1968 [DOI] [PubMed] [Google Scholar]
- 48. Hirsch T., Dallaporta B., Zamzami N., Susin S. A., Ravagnan L., Marzo I., Brenner C., Kroemer G. (1998) Proteasome activation occurs at an early, premitochondrial step of thymocyte apoptosis. J. Immunol. 161, 35–40 [PubMed] [Google Scholar]
- 49. Kanellis D. C., Bursac S., Tsichlis P. N., Volarevic S., Eliopoulos A. G. (2014) Physical and functional interaction of the TPL2 kinase with nucleophosmin. Oncogene 10.1038/onc.2014.183 [DOI] [PubMed] [Google Scholar]
- 50. Liu M., Tu X., Ferrari-Amorotti G., Calabretta B., Baserga R. (2007) Downregulation of the upstream-binding factor1 by glycogen synthase kinase3β in myeloid cells induced to differentiate. J. Cell. Biochem. 100, 1154–1169 [DOI] [PubMed] [Google Scholar]
- 51. Chacinska A., Koehler C. M., Milenkovic D., Lithgow T., Pfanner N. (2009) Importing mitochondrial proteins: machineries and mechanisms. Cell 138, 628–644 [DOI] [PMC free article] [PubMed] [Google Scholar]
- 52. Kim J., Hirsch J. P. (1998) A nucleolar protein that affects mating efficiency in Saccharomyces cerevisiae by altering the morphological response to pheromone. Genetics 149, 795–805 [DOI] [PMC free article] [PubMed] [Google Scholar]