

Abstract
Mixed lineage leukemia (MLL) fusion proteins directly activate the expression of key downstream genes such as MEIS1, HOXA9 to drive an aggressive form of human leukemia. However, it is still poorly understood what additional transcriptional regulators, independent of the MLL fusion pathway, contribute to the development of MLL leukemia. Here we show that the transcription factor PU.1 is essential for MLL leukemia and is required for the growth of MLL leukemic cells via the promotion of cell-cycle progression and inhibition of apoptosis. Importantly, PU.1 expression is not under the control of MLL fusion proteins. We further identified a PU.1-governed 15-gene signature, which contains key regulators in the MEIS-HOX program (MEIS1, PBX3, FLT3, and c-KIT). PU.1 directly binds to the genomic loci of its target genes in vivo, and is required to maintain active expression of those genes in both normal hematopoietic stem and progenitor cells and in MLL leukemia. Finally, the clinical significance of the identified PU.1 signature was indicated by its ability to predict survival in acute myelogenous leukemia patients. Together, our findings demonstrate that PU.1 contributes to the development of MLL leukemia, partially via crosstalk with the MEIS/HOX pathway.
Keywords: PU.1, MEIS1, MLL leukemia, transcription regulation
INTRODUCTION
Acute myeloid leukemias (AMLs) are a heterogeneous group of diseases characterized by recurrent chromosomal rearrangements and a blockade of differentiation in distinct hematopoietic lineages and at different developmental stages. AML with mixed lineage leukemia (MLL) translocations represents a group of aggressive forms of acute leukemias with poor prognosis.1,2 The most common MLL fusion partners are AF4, AF9, ENL, AF10 and ELL, which together account for more than 85% of all.3 The AF9 protein is highly homologous to the gene product of ENL.4 AF4, ENL, AF9, and AF10 form a complex that promotes transcription through DOT1L-dependent H3K79 methylation.5,6 MLL chromosomal translocations initiate the disease, yet the translocation alone usually is not sufficient to result in full-blown leukemia.1,7 Forty percent of MLL-rearranged AML cases were shown to harbor mutations in genes involved in the RAS pathway, including mutations in N-RAS, K-RAS, PTPN11 and NF1. In addition, approximately 5% of MLL patients had FLT3 mutations.8
Aberrant transcriptional programs have a critical role in the development of AMLs.9 Expression profiling using cDNA microarray on patient primary samples and established mouse models has revealed hundreds of genes, which are dysregulated in AML with MLL rearrangements.10–13 MLL fusion proteins, resulting from chromosomal translocations, directly activate the expression of downstream genes including MEIS1 and HOXA9.14,15 Persistent overexpression of MEIS1 and HOXA9 has been shown to be essential for the initiation and maintenance of MLL-associated leukemia.16–21 Previous studies have shown that Hox proteins not only interact with cofactors such MEIS1, but also collaborate with additional sequence-specific transcription factors to modulate target gene expression.22 Specifically, many Hoxa9 and Meis1 binding sites are also bound by PU.1 and other lineage-restricted transcription factors implicated in the establishment of myeloid enhancers in hematopoietic stem and progenitor cells.23 Considering the critical requirement of MEIS1 and HOXA9 in MLL leukemia, it remains unknown whether the lineage-specific transcription factor, such as PU.1, collaborates with MEIS/HOX proteins and contributes to the development of MLL leukemia.
In this study, we identified PU.1 as an essential regulator in the development of MLL fusion myeloid leukemias. We showed that PU.1 expression is not regulated by the MLL fusion protein and has a critical role in the initiation and maintenance of mouse MLL-AF9 leukemia models. The PU.1-driven transcriptional program predicted survival in AML patients. Mechanistically, PU.1 activated receptor tyrosine kinases FLT3, c-KIT and transcription factors MEIS1 and PBX3, key genes in the MLL fusion-regulated MEIS/HOX pathway.23–27 Our study demonstrated that the PU.1-driven transcriptional program contributes to the development of MLL leukemia via crosstalk with the MEIS/HOX pathway.
MATERIALS AND METHODS
Cells
A murine MLL-ENL-inducible cell line (csh3) was obtained from Dr Robert Slany (University Erlangen, Germany) and maintained in a RPMI 1640 medium supplemented with 10% fetal bovine serum, with 5ng/ml IL-3, IL-6, GM-CSF, 50 ng/ml SCF and 100 nM 4-hydroxytamoxifen (4-OH). HEK293T cells were grown in DMEM with 10% fetal bovine serum. All cells were maintained at 37°C, 95% humidity and 5% CO2. THP1 and MV4;11 were maintained in a RPMI 1640 medium supplemented with 10% fetal bovine serum.
Chromatin Immunoprecipitation (ChIP)
THP1, MV4;11 and csh3 cells were cross-linked with 1% formaldehyde for 10 min at room temperature and the reaction was subsequently stopped with 0.125 M glycine. Cross-linked cell pellets were sonicated five times at 10 s at a 25% amplitude for csh3 and four-times at 10 s at a 20% amplitude for THP1 and MV4;11 (Fisher Sonic Dismembrator Model 500) a at 4 °C. After centrifugation, the supernatants were precleared with Protein A/G sepharose beads (17-5280-01, 17-0618-01, GE healthcare) for 1 h at 4 °C. The pre-cleared lysate was incubated with an anti-PU.1 antibody (sc-352X, Santa Cruz, Dallas, TX, USA) and an anti-MEIS1/2 antibody (sc-10599X, Santa Cruz) at 4 °C overnight. The ChIP-enriched DNA was purified using the MinElute Reaction Cleanup Kit (Cat. No 28206, QIAGEN, Valencia, CA, USA) and subjected to SYBR Green qPCR analysis (Bio-Rad, Hercules, CA, USA) using various primer sets (Supplementary Table S2).
RNA Interference
shRNAs specific for PU.1 and MEIS1 were obtained from Openbiosystem (Thermo Scientific, Pittsburgh, PA, USA). High-titer production of lentivirus was achieved by transiently cotransfecting 293T cells with pCMVR8.2, pCMV-VSVG and the shRNA of interest. At 60% confluence, csh3 cells were infected with the indicated shRNA lentivirus with the help of RetroNectin (T100B, TAKARA, Mountain View, CA, USA) according to the manufacturers instructions. Lysates or RNA was collected 48 h post infection and used for ChIP, RT-qPCR and western blots. Knockdown efficiency was determined by RT-qPCR.
Real-Time qPCR
Total RNA was isolated and then reverse transcribed to cDNA using the TRIzol Reagent (15596018, Invitrogen, Carlsbad, CA, USA) and the Reverse Transcription System (A3500, Promega, Madison, WI, USA), respectively, according to manufacturer’s instructions. Gene-expression assays were performed by using the Maxima SYBR Green qPCR Master Mix (K0222, Fermentas) on a MyiQThermocycler (Bio-Rad). All transcript levels were normalized to GAPDH (see Supplementary Table S2 for primer sequences).
Cell Growth Assay
To measure the cell growth rate, mouse MLL-ENL expressing csh3 cells were cultured at 60% confluence on 48-well plates and infected with the indicated shRNA lentivirus with the help of RetroNectin. At various times after transduction, cell growth was monitored by cell counting.
Cell-cycle and apoptosis assay
The csh3 cells were infected with lentivirus containing the PU.1 specific shRNA or scramble shRNA. Cells were collected at 72 h after infection. Nuclei were stained with propidium iodide (P4864, Sigma, St Louis, MO, USA) and analysis of the nuclear DNA content was performed using the CellQuest-Pro software (BD Biosciences, San Jose, CA, USA). For analysis of apoptosis, cells were collected 72 h after shRNA infection and suspended in an Annexin-V-FITC-PI dye using the FITC Annexin V/Dead Cell Apoptosis Kit (V13242, Invitrogen). After adding the Annexin-Vbinding buffer, the samples were run through a Flow cytometer.
Antibodies
Polyclonal rabbit antibody to PU.1 (Spi-1, Santa Cruz sc-352X) and polyclonal goat antibody to MEIS1 (MEIS1/2, Santa Cruz sc-10599X) were used for ChIP. For western blots, we also used the following antibodies: MEIS1 (Upstate Biotechnology, Billerica, MA, USA; #05-779), PU.1 (ab88082, Abcam, Cambridge, MA, USA), beta-action (ab8226, Abcam) and GAPDH (ab75834, Abcam).
Retrovirus transduction
Retroviruses MSCV-Flag-MLL-AF9-hPGK-eGFP and corresponding blank virus were generated by calcium phosphate transient co-transfection of the retroviral vectors with the packaging plasmids Gag and Eco-env into 293T cells. The supernatants containing retroviruses were collected after 42 h of culture, filtered through a 0.45 μm filter and immediately used to infect recipient cells.
Mouse and BM transplantation assay
PU.1 conditional knockout (PU.1flox/flox/Mx1-Cre), PU.1 upstream regulatory elements (URE) knockout and mRUNX UREki/ki mice were previously described.28–30 All animals were housed in the animal barrier facility at the Cincinnati Children’s Hospital Medical Center. All animal studies were conducted according to an approved Institutional Animal Care and Use Committee protocol and federal regulations. Bone marrow cell transplantations were performed as described previously.31
GEO Datasets and statistical analysis
Publicly available gene-expression datasets of AML patients were downloaded from NCBI-GEO with accession numbers GSE1159,11 GSE6891,32 GSE10358,33 GSE1315934 and GSE1241735 (http://www.ncbi.nlm.nih.gov/geo/). PU.1 ChIP-seq data from hematopoietic progenitor cells-7 and macrophage cells were also downloaded from NCBI-GEO with accession numbers GSE2217836 and GSE21314.37 For sample size and other detailed information regarding each dataset please see Supplementary Table S1. Statistical analysis relative to microarray gene-expression data were performed using RMAExpress,38 BRB-Array Tools (http://linus.nci.nih.gov/BRB-ArrayTools.html) and R (Version 2.12.0). We utilized several different R/Bioconductor packages for further statistical analysis including the t-test, Wilcoxon rank-sum test, Pearson correlation calculation and so on.
Survival analysis
We used multivariate Cox proportional-hazards regression analysis to evaluate the association between survival and gene-expression levels within a given gene signature. Four microarray datasets (GSE1159, GSE6891, GSE10358 and GSE12417) of AML patients were used. Clinical outcome information was obtained from the same study or the same group, respectively. A risk score was generated by Cox regression for each patient. All patients were classified into a high- and low-risk group with the 75% quantile of all risk scores as the threshold value. The Kaplan–Meier method was used to estimate overall survival and log-rank test was used to compare prognostic difference among different risk groups. See the Supplementary Materials and methods section for details.
RESULTS
PU.1 is required for the initiation and maintenance of MLL fusion leukemia
The binding of transcription factors Meis1 and Hoxa9 at myeloid enhancers has been shown to be associated with that of PU.1 in murine myeloblastic cells.23 In an effort to explore the potential role of PU.1 in MLL leukemias, which consistently have a high expression of MEIS1 and HOXA9, we found that PU.1 is differentially expressed at a significantly higher level in MLL leukemia compared with CD34 control bone marrow (P = 0.04649, Supplementary Figure S1A), cytogenetically normal AML (P = 1.6e-05, Supplementary Figure S1B) and non-MLL AMLs with distinct cytogenetic abnormalities (except inv(16) and tri8) (Supplementary Figure S1A and S1B). To directly determine the functional relevance of PU.1 activation in the pathogenesis of MLL leukemia in vivo, we employed a PU.1 hypomorphic mouse model, in which PU.1 expresses at approximately 20% of wild-type mice levels due to knockout of the endogenous URE of PU.1 (PU.1URE−/−). These mice develop spontaneous AML with a long latency. To induce MLL-AF9 leukemia, we transduced the PU.1 URE−/− and PU.1flox/flox/Mx1-Cre bone marrow (see Materials and Methods) with the MLL-AF9 retrovirus. In this primary bone marrow transplantation (BMT) assay, MLL-AF9 infected bone marrow cells with normal PU.1 (PU.1flox/flox/Mx1-Cre) induced a typical MLL-associated leukemia in recipient mice that died of the disease from day 20 to day 50 (n = 8). In contrast, low PU.1-expressing bone marrow cells (PU.1 URE−/−) did not result in leukemia until day 50 after the BMT (Figure 1a). These data demonstrate that lower PU.1 expression can significantly delay the onset of MLL-AF9 induced leukemia in the primary BMT assay.
Figure 1.
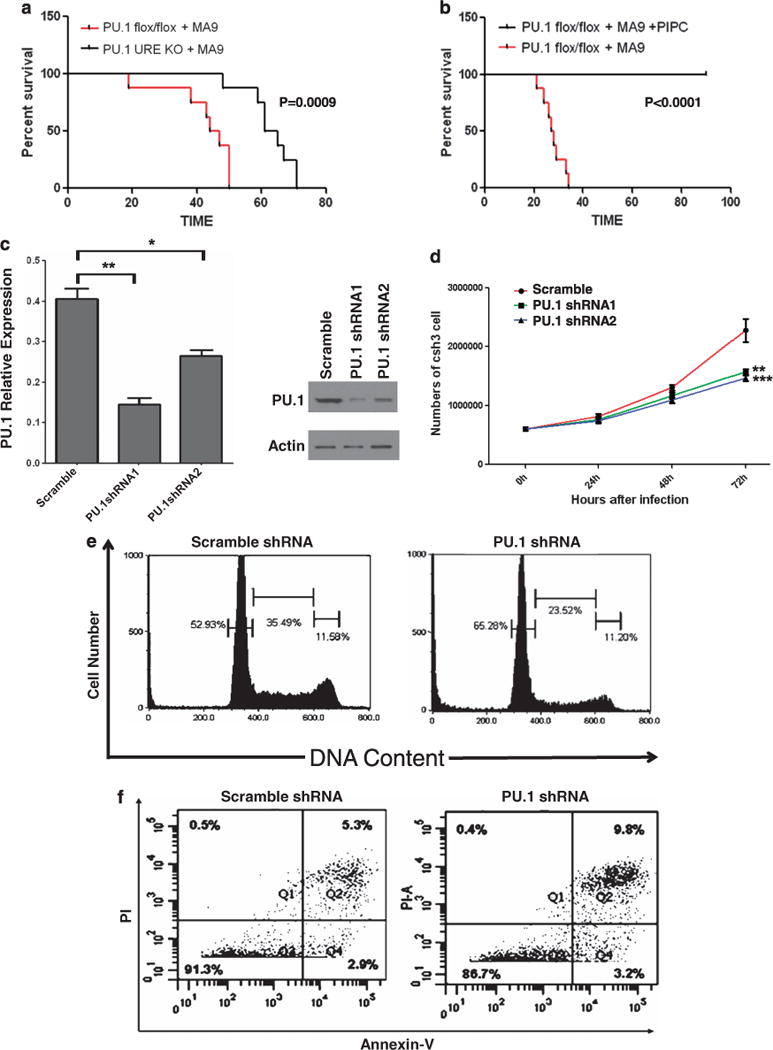
PU.1 is required for the initiation and maintenance of MLL fusion leukemia. (a) Kaplan–Meier survival curves of mice transplanted with MLL-AF9 (MA9) expressing bone marrow cells. Lineage-negative bone marrow cells of PU.1 URE−/− or PU.1flox/flox mice transduced with retrovirus constructs expressing MLL-AF9 were transplanted into lethally irradiated recipient mice (n = 8). (b) Kaplan–Meier survival curves of mice transplanted with PU.1flox/flox MLL-AF9 leukemia cells. Secondary recipient mice were transplanted with bone marrow cells from a primary PU.1flox/flox MA9 leukemic mouse (a) and then treated with pIpC (0.5 mg × 3) 2 weeks after BMT (n = 8). (c) PU.1 shRNA knockdown in MLL-ENL cells. MLL-ENL cells were transduced with two different PU.1 specific shRNA lentiviruses and a scramble shRNA lentivirus. Knockdown efficiency of PU.1 mRNA was examined through RT–PCR 48 h after transduction and normalized to the level of PGK (left panel, scramble vs PU.1shRNA1: P = 0.0065044, scramble vs PU.1shRNA2: P = 0.0210589) (*: P<0.05, **: P<0.01). Error bars represent standard deviation (s.d.). Western blot was preformed 72 h after transduction to examine expression changes at protein level (right panel). Actin was used as a loading control. (d) Lentivrius-mediated PU.1 knockdown inhibits cell proliferation in MLL-ENL cells. Cell counting at consecutive time points of 24 h, 48 h and 72 h after transduction showed a visible delay of cell growth caused by PU.1 knockdown (scramble vs PU.1shRNA1: P = 0.010728, scramble vs PU.1shRNA2: P = 0.007894) (**: P<0.01, ***: P<0.001). The red line represents scramble shRNA and the green and blue lines represent two different PU.1 specific shRNA lentiviruses. Data represent mean ± s.d. of three experiments. (e and f) Lentivirus-mediated PU.1 knockdown induces cell-cycle arrest and apoptosis in MLL-ENL Cells. Cells were transduced with PU.1 specific shRNA lentivirus or scramble lentivirus and cultured for 48 h in the presence of 4HT. Nuclei were extracted and stained with PI (e). Analysis of DNA content by Flow cytometry showed an increase in the proportion of G0/G1 nuclei (left peak) in PU.1 specific shRNA lentivriustransduced cells compared with scramble lentivirus. Increased apoptosis was evident by an increase in the uptake of PI and Annexin-V (f). The results from averaging three biological replicates are provided in Supplementary Figure 1C and 1D.
To gain further insight into the role of PU.1 in the maintenance of MLL-AF9 leukemia, we transplanted the PU.1flox/flox/Mx1-Cre leukemia cells isolated from the primary BMT leukemia mice into secondary recipients. As expected, these leukemia cells were engrafted in the recipient mice that quickly died of the disease (Figure 1b). Notably, injection of pIpC in this secondary BMT experiment completely abolished the expression of PU.1 in PU.1flox/flox/Mx1-Cre cells and resulted in 100% survival of the recipient mice. All of the PU.1flox/flox BMT mice injected with pIpC survived more than 2.5 months (end of the observation). Collectively, these data demonstrate that PU.1 has an essential role in the initiation and maintenance of MLL-AF9 leukemia.
To explore the potential mechanism underlying the functional role of PU.1, we turned to an in vitro model of MLL-ENL leukemia.13 Infection of the MLL-ENL expressing cell line with PU.1 shRNAs significantly downregulated PU.1 expression at both the RNA and protein levels (Figure 1c). PU.1 knockdown markedly slowed down the growth of MLL-ENL cells, compared with those infected with scrambled control shRNA lentivirus (Figure 1d), suggesting a requirement of PU.1 in the promotion of the growth of MLL leukemic cells. PU.1 shRNA transduced cells showed an increase in G0/G1 and a decrease in the proportions in S phase and G2/M (Figure 1e). Besides a cell-cycle defect, PU.1 shRNA transduction also led to an increase in apoptosis, as shown by Annexin-V and PI staining (Figure 1f). These data demonstrate that a high expression of PU.1 is required to promote proliferation of MLL-ENL leukemic cells.
PU.1 expression is not under the control of MLL fusion proteins
To explore the molecular mechanisms in the regulation of PU.1 in MLL leukemia, we examined whether PU.1 is a part of the MLL fusion-controlled program. Using a murine inducible MLL-ENL model,13 we performed an mRNA expression profiling and whole-genome promoter ChIP-chip experiments on MLL and H3K79me2 in the presence and absence of the MLL-ENL (GSE2479439). Multiple-known MLL fusion target gene sets were found to be significantly enriched in the MLL-ENL activated condition compared with fusion inactivated cells (gene sets for MLL-ENL39 and MLL-AF940,41)(Supplementary Figure S2). Interestingly, 72 h after induced MLL-ENL inactivation, PU.1 expression remained active, whereas known MLL fusion target genes such as Meis1 and Hoxa9 underwent a significant reduction in their mRNA expression (Figure 2a). Furthermore, promoter regions of MEIS1 and HOXA9 had significantly higher levels of MLL binding and enrichment of MLL fusion induced-H3K79 dimethylation (H3K79me2) in the presence of MLL-ENL (Figure 2b, middle and right panels, yellow highlighted boxes). In contrast, the enrichment of both MLL and MLL fusion-induced H3K79me2 at the PU.1 promoter remained at the same levels in the presence or absence of the MLL-ENL protein (Figure 2b, left panel), suggesting that PU.1 is not bound by MLL-ENL. Further, the PU.1 promoter region showed a high level of H3K79me2 enrichment, but minimally detected MLL binding in the presence of MLL-ENL. Together, these data demonstrate that PU.1 is not a downstream-direct target of MLL-ENL in this inducible model.
Figure 2.
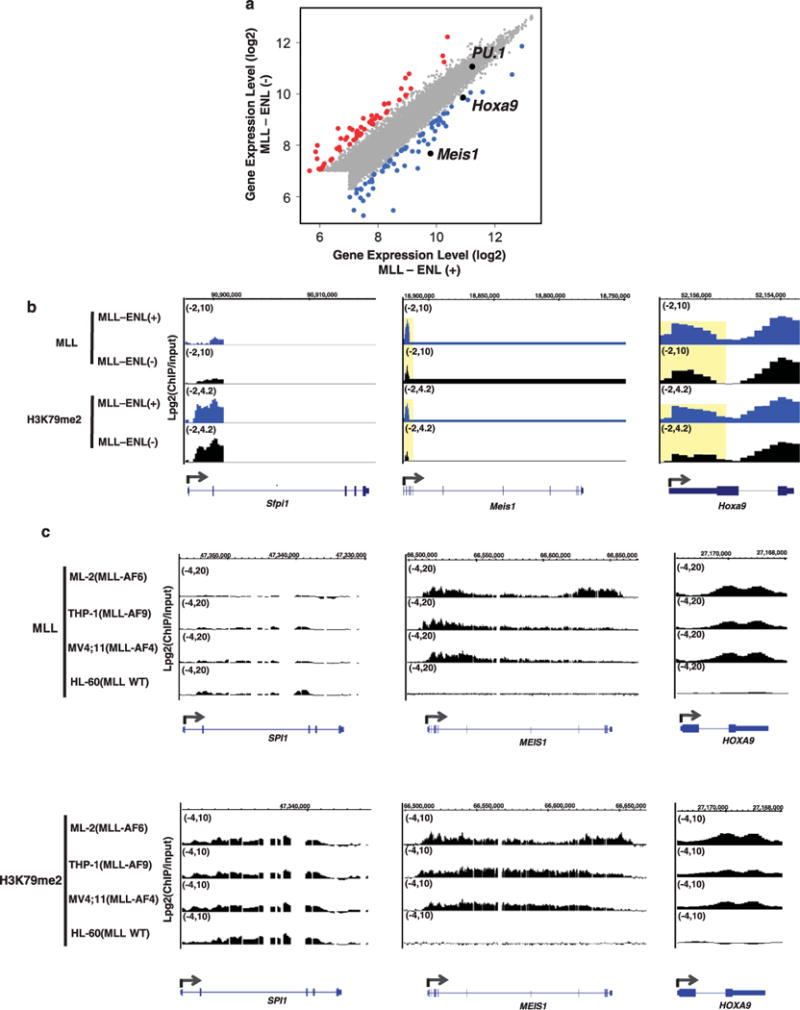
PU.1 expression is not under the control of MLL fusion proteins. (a) Scatter plot showing gene-expression levels in MLL-ENL induced (MLL-ENL(+)) and inactivated (MLL-ENL(−)) conditions. All 7858 expressed genes detected by mouse exon array are displayed.39 Significantly downregulated genes upon inactivation of MLL-ENL (FDR<0.05) are shown as blue dots. Significantly upregulated genes upon inactivation of MLL-ENL (FDR<0.05) are shown as red dots. Genes whose expression levels were not significantly changed between the two conditions are shown as gray dots. PU.1, Meis1 and Hoxa9 are indicated by black dots. (b) The level of MLL protein enrichment and H3K79 dimethylation (H3K79me2) is shown as Log2(ChIP/input) at the PU.1 (Sfpi1, left), Meis1 (middle) and Hoxa9 (right) locus (ChIP-chip: NimbleGen whole-genome promoter array, mouse39). Blue tracks represent MLL binding and H3K79me2 levels upon MLL-ENL induction (MLL-ENL(+)). Black tracks represent MLL binding and H3K79me2 levels upon MLL-ENL inactivation (MLL-ENL(−)). The regions showing differential ChIP signals are highlighted with a yellow box. (c) The level of MLL protein enrichment (upper panels) and H3K79me2 (lower panels) is shown as Log2 (ChIP/input) at the PU.1 (SPI1, left), MEIS1 (middle) and HOXA9 (right) locus (ChIP-chip: customized NimbleGen gene loci array, human39). The MLL fusion gene harbored by each cell line is indicated by parenthesis. MLL WT: MLL-wide type.
To further determine whether PU.1 is regulated by other MLL fusion proteins, we analyzed ChIP-chip data (GSE24794) of MLL and H3K79me2 in multiple-human MLL-leukemia cell lines, which harbor MLL-AF6 (ML-2 cells), MLL-AF9 (THP-1 cells) or MLL-AF4 (MV4; 11 cells).39 Although the genomic locus of PU.1 had significant enrichment of H3K79me2, MLL binding was barely detected in these MLL leukemia cells (Figure 2c, left panels). A similar binding pattern was observed in the non-MLL human-leukemia cell line HL-60, which actively expresses PU.1 (Figure 2c, left panels and data not shown). In sharp contrast, MEIS1 and HOXA9 loci had high levels of both MLL binding and H3K79me2 enrichment (Figure 2c, middle and right panels) in MLL-rearranged cell lines. HL-60 cells did not actively express MEIS1 and HOXA9, and were absent of MLL binding and H3K79me2 signals in the genomic regions of these two genes (Figure 2c, middle and right panels). These data are consistent with earlier genome-wide ChIP-seq studies that also did not identify PU.1 as a target of either MLL-AF9 or MLL-AF4.40,42 These data demonstrate that PU.1 is not a direct-downstream target of MLL-AF4, MLL-AF9 and MLL-AF6.
Identification of a PU.1 target genes signature in MLL leukemias
Having shown that regulation of PU.1 is independent of the MLL fusion proteins, we further sought to define the potential target genes directly regulated by PU.1 in AML. To achieve improved sensitivity and specificity in defining direct-target genes, we proceeded to conduct an integrative analysis of the DNA–protein binding and in vivo differential-expression data (Figure 3a). We first analyzed PU.1 ChIP-seq data from two publicly available datasets, hematopoietic progenitor cells36,43 and more mature macrophage cells.37 The common set of PU.1 targets shared by hematopoietic progenitor cells and macrophage may better reflect the monocytic origin of MLL leukemia, as AMLs with MLL translocation are typically associated with the monocytic lineage.44–46 Together, we identified a set of 5995 PU.1-bound genes shared by these two cell types. To determine the specific subset of genes whose expression is directly activated by PU.1, we compared the expression profiles of the Lin-Sca+ c-kit + hematopoietic stem and progenitor cell populations of wild type and mRUNX URE ki/ki mice (which express PU.1 at levels ~20% of wild type mice28). Among the 5995 PU.1-bound targets identified, 40 genes showed a significant decrease in mRNA expression in PU.1 low expressing Lin-Sca + c-kit + cells (mRUNX UREki/ki) (Figure 3a). To further identify PU.1 target genes that may have a role in MLL leukemia, we performed expression analysis of these 40 genes in a cohort of MLL-leukemia patients for which the expression profiling data are publicly available (GSE115911). Interestingly, 15 of the 40 genes share a similar expression pattern (Figure 3b) and on average, express at a ten-fold higher level compared with the remaining target genes within MLL patients (Figure 3c). We found that the 15 target genes of PU.1 express at a significantly higher level in MLL leukemia compared with normal CD34 bone marrow, as well as t(8;21) and t(15;17) AMLs, which are known to have suppressed PU.1 function47–49 (Supplementary Figure S3A). The level of PU.1 expression is well correlated with the average expression level of the 15 identified genes in AML patients (Figure 3d for dataset GSE1159, Pearson correlation coefficient = 0.667, P<2.2e-16; Supplementary Figure S3B for dataset ROSS2004,(ref. 12) Pearson correlation coefficient = 0.7064761, P<2.2e-16). We referred to these 15 targets as the ‘15 PU.1 targets’, which include key regulators in the MEIS/HOX pathway (FLT3, c-Kit, MEIS1, and PBX3),23–27 as well as those involved in stem cell function, cell proliferation and apoptosis.
Figure 3.
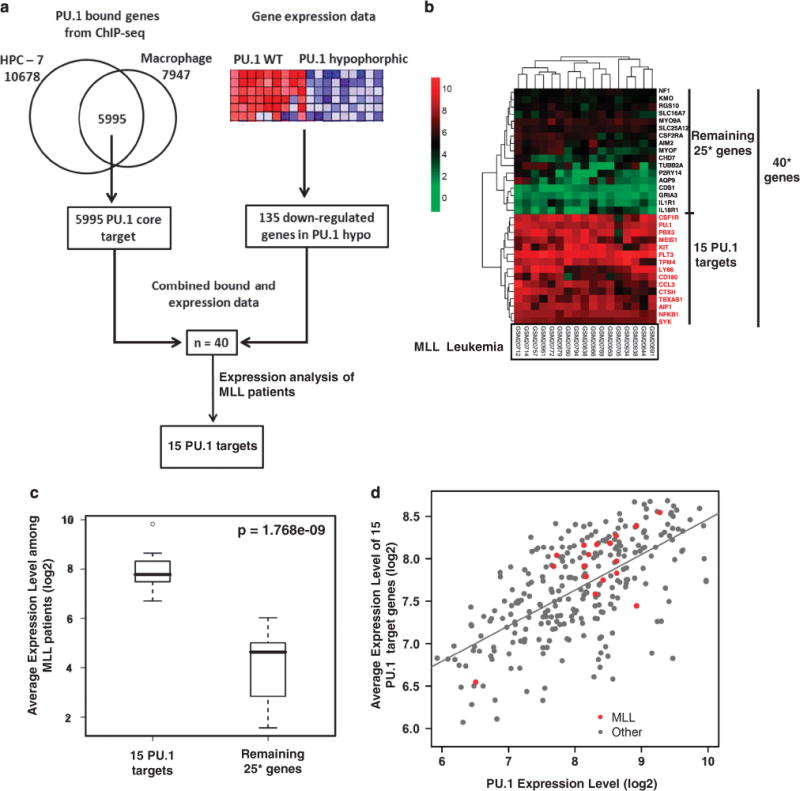
Identification of a PU.1 target gene signature in MLL leukemia. (a) Strategy and workflow of integrative analysis to identify 15 PU.1 target genes. (b) Unsupervised hierarchical clustering of 40 PU.1 target genes based on gene-expression profiling in 17 MLL patients (data obtained from GSE115911). Genes in the cluster with relatively high expression levels are shown in red and referred to as ‘15 PU.1 targets’. 40*: only 32 of the 40 genes identified by combined binding and expression analysis (a) were presented with designed probes in GSE1159. For the remaining 25 genes, there were only 17 genes presented with designed probes. (c) Average gene-expression levels of the ‘15 PU.1 targets’ and ‘other targets’ are shown in box plot. The ‘15 PU.1 targets’ expressed at significantly higher levels than ‘other targets’ (Wilcoxon rank-sum test, P-value = 1.768e-9). 25*: for the remaining 25 genes, there were only 17 genes presented with designed probes in GSE1159. (d) Scatter plot showing expression level of PU.1 and average expression level of PU.1 15 target genes in MLL leukemia (red dots) and other AML patients (gray dots) (data obtained from GSE11597). The Pearson correlation coefficient between PU.1 and the average expression of 15 targets in 285 AMLs was 0.667 (P<2.2e-16).
PU.1 directly regulates its 15 target genes in MLL leukemic cells
We further examined whether PU.1 directly activates the set of 15 target genes in MLL leukemia. PU.1 is required for the myeloblast proliferation of an MLL-leukemia cell line (Figure 1d). Knockdown of PU.1 resulted in the downregulated expression of the majority (14 out of 15) of its targets (Figure 4a), suggesting that PU.1 is required to maintain the expression of its target genes even in the presence of MLL fusion proteins. This result is consistent with the observation that PU.1 is necessary to sustain the expression of this set of all 15 genes in normal hematopoietic stem and progenitor cells (Figure 4b). To determine whether PU.1 directly binds to its target genes, we performed PU.1 ChIP-seq in the MLL-ENL cell line model. Physical presence of PU.1 proteins was detected at the genomic loci for all 15 target genes (Supplementary Figure S5). Using ChIP-qPCR, we confirmed the ChIP-seq results and detected significant binding of PU.1 at genomic regions of all 15 genes in MLL-ENL (Figure 4c), THP-1 (MLL-AF9) or MV4;11(MLL-AF4) cells (Supplementary Figure S4B). Together, these data suggest that the majority of these 15 genes is directly regulated by PU.1 in MLL leukemia cells.
Figure 4.
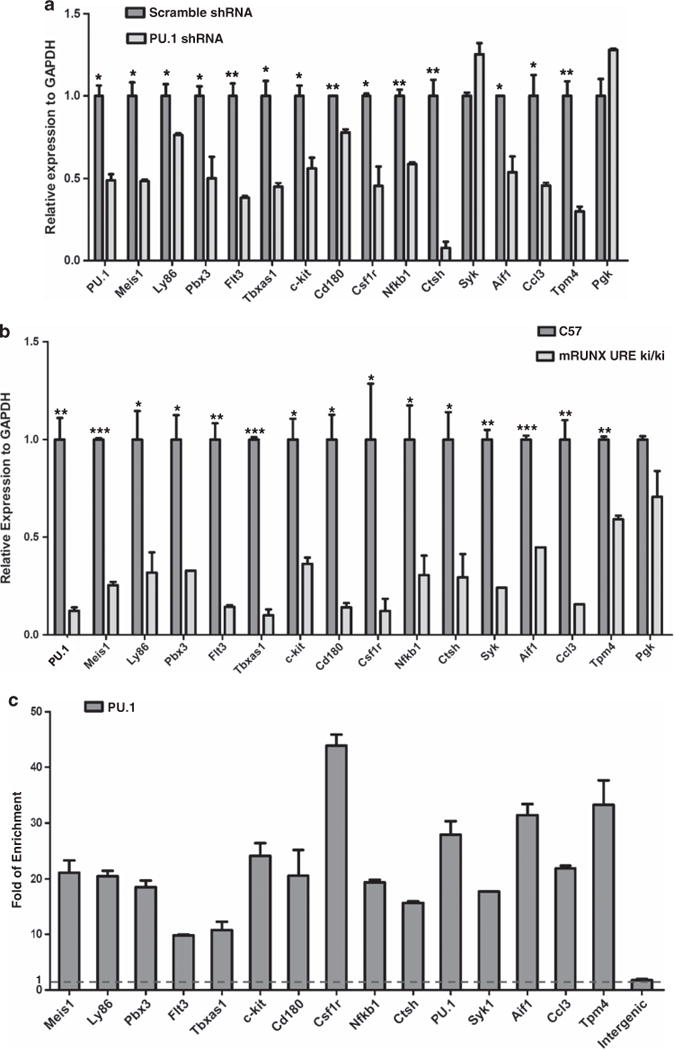
PU.1 directly regulates its target genes in MLL leukemic cells. (a) Effects of PU.1 knockdown on target gene expression in MLL-ENL cells. The MLL-ENL cells were transduced with PU.1 specific shRNA lentivirus and scramble control lentivirus. The expression of PU.1 and its 15 target genes were examined through RT–PCR 48h after transduction. The relative expression was normalized to GAPDH. Expression under the condition of the scramble targeting cell was designated to be one. Bar charts are mean±s.d. Genes with significantly decreased levels of expression after PU.1 knockdown are indicated (t-test, *: P<0.05, **: P<0.01, ***: P<0.001). (b) Expression pattern of PU.1 15 target genes in PU.1-defected mice. Q-PCR was performed in the Lin-Sca + c-kit + population of WT C57 mice and mRUNX URE ki/ki mice, respectively. The relative expression was normalized to GAPDH. Bar charts are mean±s.d. Genes with significantly decreased levels of expression in UREki/ki mice are indicated (t-test, *: P<0.05, **: P<0.01, ***: P<0.001). (c) PU.1 binding at gene regions of 15 PU.1 target genes. PU.1 binding at gene-body regions with ChIP-seq PU.1 signals (data not shown) was examined using ChIP-qPCR. The amounts of input DNA and ChIP DNA were normalized and the data are shown as relative enrichment ratios of precipitated DNA to input DNA. Intergenic region was used as the negative control. Bar charts are mean±s.d. The dotted line indicates the level of no enrichment over input.
We further examined whether the remaining 25 genes in the original 40-gene set (Figure 3b) are similarly regulated by PU.1 in MLL-ENL cells. Consistent with the low expression of this set of 25 genes in MLL patients (Figure 3b), 9 out of 25 genes were undetectable in the MLL-ENL containing cells using RT-qPCR. For the remaining 16 genes, the majority (12 out 16) did not show a significant change in expression levels after knockdown of PU.1 (Supplementary Figure S4A). However, in the ChIP-seq analyses of MLL-ENL cells, significant PU.1 binding was detected at the genomic loci of all 25 genes (data not shown). These data suggest that the majority of the remaining 25 genes in the original 40-gene set (Figure 3b) are not directly regulated by PU.1 at the mRNA level in MLL-ENL cells, although physical presence of PU.1 at the gene loci can be detected.
A subset of 15 PU.1 targets is also regulated by MEIS1
Considering that the PU.1 gene signature includes known regulators (MEIS1, PBX3, c-Kit and FLT3) in the MEIS/HOX pathway,23–27 we examined whether PU.1 and MEIS1 co-regulate the same set of target genes in MLL leukemia cells. Knockdown of MEIS1 in the MLL-ENL cells resulted in decreased expression for a subset (7 out 15) of PU.1 target genes (Meis1, Ly86, Pbx3, Flt3, Tbxas1, c-Kit and CD180), whereas expression for the remaining PU.1 targets was unaffected (Figure 5a). We referred to this set of seven genes as PU.1/MEIS1 co-regulated target genes. Consistently, inactivation of MLL-ENL resulted in a lowered MEIS1 expression and decreased expression of the same set of genes (Figure 5b) that were downregulated upon MEIS1 knockdown. These data strongly suggest that among the targets of PU.1, a subset of key genes that include c-Kit and Flt3, are co-regulated by MEIS1.
Figure 5.
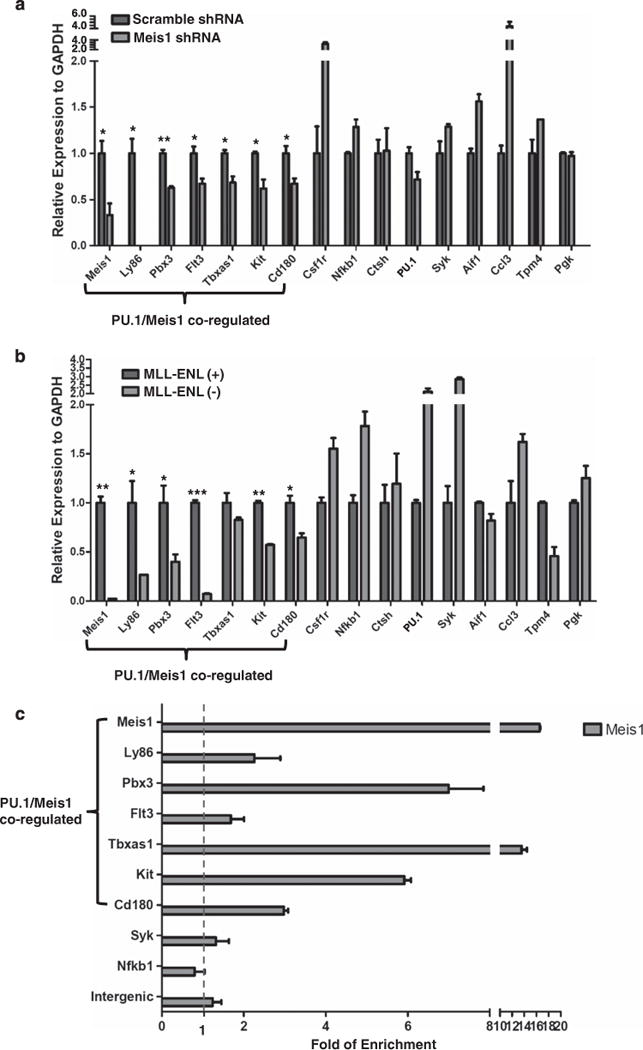
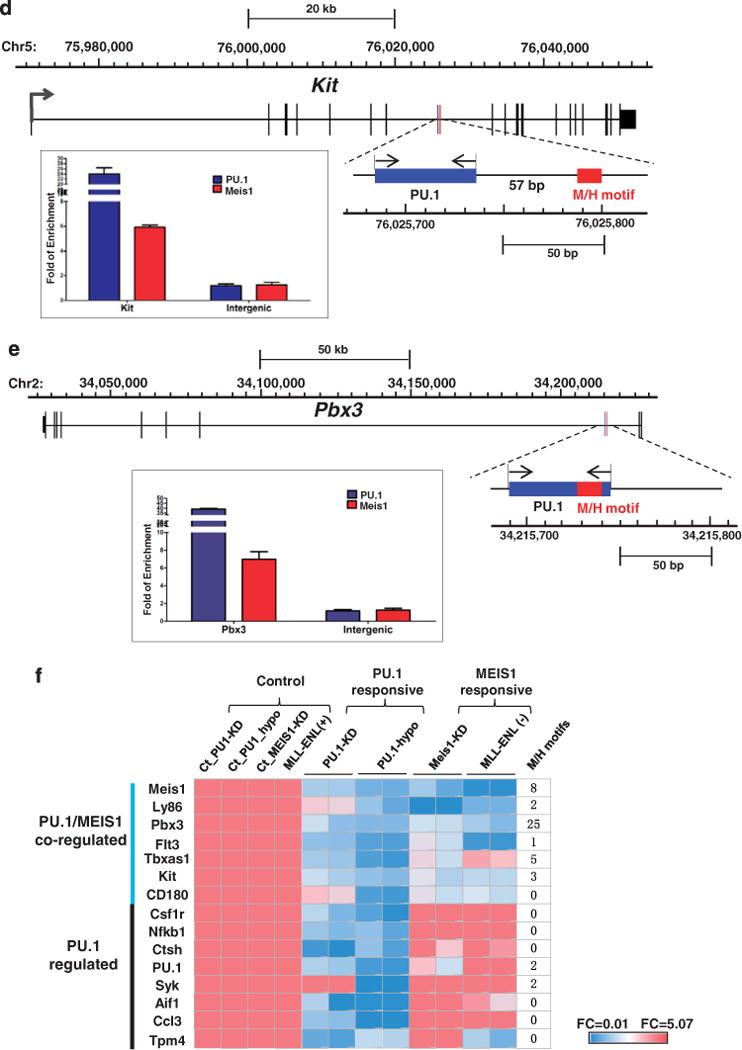
A subset of 15 PU.1 targets is also regulated by Meis1. (a) Meis1 knockdown in MLL-ENL cell line. The cells were transduced for 48 h with the lentivirus constructs of Meis1 specific shRNA or scramble shRNA control. PU.1 and its target gene expression were examined using RT-PCR. The seven PU.1/Meis1 co-regulated genes are indicated. The relative expression was normalized to GAPDH. Expression under the condition of scramble shRNA transduced cells was designated to be one. Bar charts are mean ± s.d. Genes with significantly decreased levels of expression after Meis1 knockdown are indicated (t-test, *: P<0.05, **: P<0.01). (b) Regulation of PU.1 target genes by the MLL fusion protein. Expression of PU.1 15 target genes in the presence (+) and absence (−) of MLL-ENL. Gene expression was examined through RT–PCR at a time point of 72 h after MLL-ENL inactivation (without 4HT). The relative expression was normalized to GAPDH. Expression under the condition of MLL-ENL (–) was designated to be one. Bar charts are mean ± s.d. Genes with significantly decreased levels of expression after MLL-ENL inactivation (without 4HT) are indicated (t-test, *: P<0.05, **: P<0.01, ***: P<0.001). (c) MEIS1 binding at gene regions of PU.1 target genes. MEIS1 binding at regions with predicted MEIS1/HOXA9 motifs was examined using ChIP-qPCR. The amounts of input DNA and ChIP DNA were normalized and the data are shown as relative enrichment ratios of precipitated DNA to input DNA. Intergenic region was used as the negative control. Bar charts are mean ± s.d. The seven PU.1/Meis1 co-regulated genes (a and b) are indicated. The dotted line indicates the level of no enrichment over input. (d) PU.1 and Meis1 co-binding at the c-Kit locus. The DNA element bound by both PU.1 and Meis1 is enlarged from the gene structure (chromosome coordinates from mm9 are indicated). Positions of the conserved MEIS1/HOXA9 motif (http://genome.ucsc.edu/) and the PU.1 binding signal detected by ChIP-qPCR are shown as red and blue rectangles, respectively. The paired arrows above the DNA element represent the primers used in detecting the binding of both Meis1 and PU.1. The enrichments levels of MEIS1 and PU.1 detected by ChIP-qPCR are shown in the bar plot. Bar charts are mean ±s.d. (e) PU.1 and Meis1 co-binding at the Pbx3 locus. The DNA element bound by both PU.1 and MEIS1 is enlarged from the gene structure (chromosome coordinates from mm9 are indicated). Positions of the conserved MEIS1/HOXA9 motif (http://genome.ucsc.edu/) and the PU.1 binding signal detected by ChIP-qPCR are shown as red and blue rectangles, respectively. The paired arrows above the DNA element represent the primers used in detecting the binding of both MEIS1 and PU.1. The enrichments levels of MEIS1 and PU.1 detected by ChIP-qPCR are shown in the bar plot. Bar charts are mean ±s.d. (f) Heatmap for the fold change of 15 PU.1 target gene expression under various conditions (the same data used for Figures 4a and b, a and b, and summarized in this heatmap). PU.1-KD: PU.1 knockdown in MLL-ENL cells (data for Figure 4a); PU.1-Ki/Ki: hematopoietic stem and progenitor cellss from mRUNX UREki/ki mice (data for Figure 4b); MEIS1-KD: MEIS1 knockdown in MLL-ENL cells (data for a); and MLL-ENL (+) (−): MLL-ENL cells under MLL-ENL induced or inactivated condition (data for b). Each experimental condition had a control group (ct). The level of gene expression is indicated by a color code: genes with relatively higher expression level changes are shown in red and lower changes are shown in blue. M/H: MEIS1/HOXA motif.
We further inquired whether the set of seven PU.1/MEIS1 co-regulated genes is part of the MEIS1/HOXA9 program. Using the ‘transcription factor binding site conserved’ function in the UCSC genome browser (http://genome.ucsc.edu/), we searched for evolutionarily conserved MEIS1/HOXA9 motifs in each gene locus between 2 kb upstream of the transcription start site (TSS) and 2 kb downstream of TES (transcription end site). Notably, regions of the seven PU.1/MEIS1-co-regulated genes contain multiple MEIS1/HOXA9 sites, whereas the remaining eight PU.1 targets are deprived of the predicted motifs (Figure 5f, and data not shown). Using ChIP-qPCR, we were able to confirm the binding of MEIS1 at the predicted MEIS1/HOXA9 motif for Meis1, Pbx3, Tbxas1 and c-Kit in the MLL-ENL cells (Figure 5c and Supplementary Figure S4C). As Meis1 and Hoxa9 have been shown to interact with enhanceosomes that contain lineage-specific transcription factors such as PU.1,23 we further examined whether MEIS1 and PU.1 co-bind to common regulatory sequences. To this end, we looked for ChIP-seq PU.1 signals within the proximity (200 bp) of the predicted MEIS1/HOXA9 motifs (Figure 5f and data not shown) and validated the binding of MEIS1 and PU.1 using ChIP-qPCR. This analysis identified three DNA elements, which have significant enrichment of both MEIS1 and PU.1 in the genomic regions of c-Kit, Pbx3 and Meis1, respectively (Figures 5d–e, and Supplementary Figure S6). These data are consistent with the recent ChIP-seq data, which showed that two out of seven MEIS1-responsive PU.1 targets were bound by MEIS1 and/or HOXA9 (c-Kit, and Tbxas1) in immortalized mouse hematopoietic stem and progenitor cells, whereas none of the eight remaining PU.1 target genes were bound by either MEIS1 or HOXA9 in their experimental setting.23 Together, these results showed that PU.1 directly regulates Meis1 and Pbx3, and also important genes in the MEIS/HOX pathway that includes known MEIS/HOX targets c-Kit and Tbxas123 (Figure 5d).
The PU.1-driven target gene signature is a predictive factor for patient survival in AML patients
To examine the clinical relevance of the PU.1-driven transcription program in AML patients, we performed a multivariate Cox proportional-hazards regression analysis50 using the PU.1 15-gene signature in four published datasets of patients with AML, for whom gene expression and time-to-event data were available (NCBI-GEO accession number GSE1159, GSE6891, GSE10358 and GSE12417, see Supplementary Table S1). A risk score was generated by Cox regression for each patient. The Kaplan–Meier analysis showed that patients stratified as ‘high score group’ (those with a high-risk score: top 25%) had a significantly lower overall survival rate than patients in the ‘low score group’ (those with a low-risk score: bottom 75%) in GSE1159 (P<1e-4, Figure 6a), as well as in GSE6891 (P<1e-4, Figure 6b). Results from the other two independent cohorts were similar (Supplementary Figure S7A, GSE10358: P=0.0002; Supplementary Figure S7B, GSE12417: P<1e-4). We further combined all patients from the four datasets into one large cohort of 804 AML patients using a random effect model of meta-analysis.51 This analysis demonstrated that PU.1 15-gene signature had a prognostic effect on the combined cohort of patients (n = 804, Figure 6c).
Figure 6.
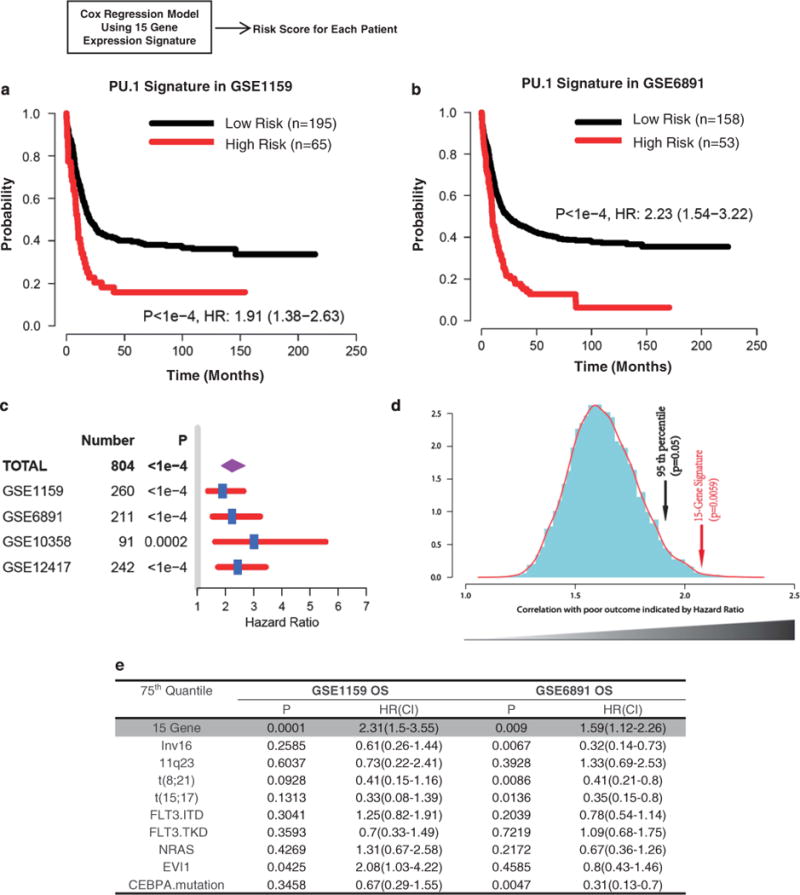
The PU.1-driven target gene signature is a predictive factor for patient survival in AML patients. (a and b) The Kaplan–Meier survival analysis based on risk predictions using the PU.1 15-gene signature. Risk score for each patient was predicted by multivariate Cox proportional-hazards regression using PU.1 15-gene signature: GSE115911 (a, P<1e-4) and GSE689132 (b, P<1e-4). High- and low-score groups were defined using 75th percentile of risk index as the cut-off value. See Supplementary Figure S4 for survival analyses from the other two AML cohorts. (c) Forest plot of hazard ratios (HRs) comparing overall survival of combined patient-cohorts using meta-analysis and each independent study. Hazard ratios for each study are represented by squares and the horizontal line crossing the square represents the 95% confidence interval. Diamonds represent the estimated overall effect based on the meta-analysis using random-effects of all cohorts.51 Log-rank P-values were calculated for classification of the 15-gene signature in each dataset. (d) Histograms of 10000 Monte-Carlo P-values in meta-analysis of all four AML datasets. Kaplan–Meier analyses were performed to evaluate associations between 10000 individual randomly generated 15-gene signatures and patient outcomes in combined AML cohorts. The random signatures were ordered by log-rank P-values generated in a Kaplan–Meier survival analysis. The red arrow indicates the real P-value calculated in meta-analysis and the black arrow indicates 95th percentile (P = 0.05) for reference. (e) PU.1 15-gene signature is an independent predictor. Multivariate COX hazard regression analysis for prognostic factors in GSE6891 and GSE1159.
To address the concern that many published cancer signatures are not significantly better outcome predictors than random signatures,52 we performed Kaplan–Meier analyses on 10000 individual randomly selected 15-gene sets in each dataset. The real PU.1 15-gene signature showed a significant ability for outcome prediction and outperformed most 10000 randomly generated gene signatures (Monte-Carlo P=0.0059, Figure 6d). We performed multivariate analysis using a Cox regression model in GSE1159 and GSE6891 (Figure 6e). The results showed that the predictive power of PU.1 15-gene signature is independent of known clinical variables (P=0.0001 in GSE1159, P= 0.009 in GSE6891), indicating it could provide additional prognostic information for AML patient’s outcomes. These results demonstrate the clinical significance of a PU.1-driven transcriptional program in AML. The independent prognostic ability of the PU.1 15-gene signature may provide novel prognostic information that can influence treatment decisions along with previously established classification method in AMLs.
DISCUSSION
Transcriptional dysregulation is a major driving force in the development of human AMLs, including those with MLL translocations. Despite extensive studies on the MLL fusion-driven abnormal MEIS/HOX transcription program, the regulatory mechanisms underlying the disordered expression in MLL leukemia, however, remain under investigation. Here we show that PU.1 is not regulated by MLL fusions but is essential for the development of MLL leukemia. MLL leukemia failed to maintain in vivo in the absence of PU.1. We also found that the 15-gene PU.1-governed transcription program is predictive of AML patient survival. Furthermore, PU.1 collaborates with MEIS1 to sustain high expression of key regulators in MLL leukemia such as MEIS1, PBX3, c-Kit and FLT3. These findings demonstrate the prognostic value of the PU.1-governed transcription program and have important implications for targeting the PU.1-pathway as an effective therapy in MLL leukemias.
Various studies have shown that maintenance of a proper level of PU.1 is critical for preventing the development of myeloid leukemia. Suppression of PU.1 activity by AML1-ETO or PML-RARα fusion proteins leads to a block of neutrophil differentiation and serves as a crucial step in the development of M2/M3 AML.47–49 Inactivation of PU.1 by gene deletion or knockdown of PU.1 by radiation-induced point mutation of its DNA binding domain causes a block of differentiation and AML in mice.53 PU.1 mutations, although rare, have been shown to be associated with AML in humans.54 Despite the important requirement of PU.1 in the development of MLL leukemia, the functional role of PU.1, as a positive regulator, may not be limited to MLL leukemias in AMLs. Here, PU.1 differentially expressed at a significantly high level in both MLL and inv(16) AMLs compared with other cytogenetic aberrations and normal CD34 cells (Supplementary Figure S1A). Notably, PU.1 has been shown to be required for the initiation and maintenance of leukemia stem cells induced by MOZ fusion proteins.55 Considering the general requirement of PU.1 in hematopoietic stem cell,29,56 PU.1 may be required for the survival of leukemia stem cells in multiple subtypes of AMLs. Consistently, the PU.1-regulated gene signature showed profound concordance with prognosis in segregating high-risk and low-risk AML patients (Figures 6a–d, Supplementary Figure S7A and B). As a result of the limited number of patients with distinct cytogenetic abnormalities, we were unable to examine the prognostic value of the PU.1 15-gene signature using stratified analysis in AML subgroups. Future large cohort studies are needed to confirm the PU.1-pathway as a strong prognostic factor for MLL leukemia.
Development of both human and murine MLL-rearranged leukemia is critically dependent on the persistent overexpression of MEIS1 and HOXA9.16–21 Interestingly, PU.1 binds to and directly activates not only MEIS1 and PBX3, but downstream targets in the MEIS1/HOXA9 pathway including c-Kit and FLT3 (Figures 3a, 4c and h). This finding is consistent with a recent report, which shows that PU.1 and MEIS1 cooperatively regulate downstream target genes in mouse hematopoietic stem and progenitor cells.23 It remains to be determined how PU.1, MEIS1 and PBX3 interact at the molecular level. Our data are consistent with a model in which the transcriptional regulator PU.1 cooperates with the MLL fusion protein to sustain the MEIS/HOX/PBX3 pathway to contribute to MLL myeloid leukemia. These finding suggest that the PU.1-driven transcriptional program could serve as a molecular target for MLL leukemia therapy. As PU.1 is critical for the commitment and survival of both myeloid and B-cell lineages, future studies are warranted to investigate the role of PU.1 in MLL mediated B- ALL.
Supplementary Material
Acknowledgments
We thank Drs Jose Cancelas, H Leighton Grimes, James Mulloy, Susumu Goyama (Cincinnati Children’s Hospital Medical Center) and Frank Rosenbauer (Max Delbrück Center for Molecular Medicine) for their critical reading and valuable comments on the manuscript. We also thank Tami R Bartell for English editing. This study was supported by the Hundred Talents Program of the Chinese Academy of Sciences (to QFW), the National Natural Science Foundation of China grants No. 81070442 and No. 91331111 (to QFW), No. 81100381 (to JZ), No. 81300438 (to JW) and the ‘Strategic Priority Research Program’ of the Chinese Academy of Sciences (to QFW), No. XDA01010305. This work was also supported in part by the Knowledge Innovation Program of the Chinese Academy of Sciences (to FHH) and sponsored by the Scientific Research Foundation for the Returned Overseas Chinese Scholars, State Education Ministry (to QFW). We would like to acknowledge support from the Cincinnati Children’s Hospital Research Foundation, the Ohio Cancer Research Associates, the Cancer Free Kids, the Leukemia Research Foundation and the Pilot Research Grant of the State Key Laboratory of Experimental Hematology (Tianjin, China) (to GH), the NIH grant HL112719 (to DGT) and NIH grant HL111192 (to AK).
Footnotes
CONFLICT OF INTEREST
The authors declare no conflict of interest.
Supplementary Information accompanies this paper on the Leukemia website (http://www.nature.com/leu)
References
- 1.Krivtsov A, Armstrong S. MLL translocations, histone modifications and leukaemia stem-cell development. Nat Rev Cancer. 2007;7:823. doi: 10.1038/nrc2253. [DOI] [PubMed] [Google Scholar]
- 2.de Boer J, Walf-Vorderwülbecke V, Williams O. In focus: MLL rearranged leukemia. Leukemia. 2013;27:1224–1228. doi: 10.1038/leu.2013.78. [DOI] [PubMed] [Google Scholar]
- 3.Meyer C, Kowarz E, Hofmann J, Renneville A, Zuna J, Trka J, et al. New insights to the MLL recombinome of acute leukemias. Leukemia. 2009;23:1490–1499. doi: 10.1038/leu.2009.33. [DOI] [PubMed] [Google Scholar]
- 4.Nakamura T, Alder H, Gu Y, Prasad R, Canaani O, Kamada N, et al. Genes on chromosomes 4, 9 and 19 involved in 11q23 abnormalities in acute leukemia share sequence homology and/or common motifs. Natl Acad Sci U S A. 1993;90:4631–4635. doi: 10.1073/pnas.90.10.4631. [DOI] [PMC free article] [PubMed] [Google Scholar]
- 5.Bitoun E, Oliver P, Davies K. The mixed-lineage leukemia fusion partner AF4 stimulates RNA polymerase II transcriptional elongation and mediates coordinated chromatin remodeling. Hum Mol Genet. 2007;16:92. doi: 10.1093/hmg/ddl444. [DOI] [PubMed] [Google Scholar]
- 6.Mueller D, Bach C, Zeisig D, Garcia-Cuellar M, Monroe S, Sreekumar A, et al. A role for the MLL fusion partner ENL in transcriptional elongation and chromatin modification. Blood. 2007;110:4445. doi: 10.1182/blood-2007-05-090514. [DOI] [PMC free article] [PubMed] [Google Scholar]
- 7.Greaves M, Wiemels J. Origins of chromosome translocations in childhood leukaemia. Nat Rev Cancer. 2003;3:639. doi: 10.1038/nrc1164. [DOI] [PubMed] [Google Scholar]
- 8.Balgobind B, Zwaan C, Pieters R, Van den Heuvel-Eibrink M. The heterogeneity of pediatric MLL-rearranged acute myeloid leukemia. Leukemia. 2011;25:1239–1248. doi: 10.1038/leu.2011.90. [DOI] [PubMed] [Google Scholar]
- 9.Rosenbauer F, Tenen DG. Transcription factors in myeloid development: balancing differentiation with transformation. Nat Rev Immunol. 2007;7:105–117. doi: 10.1038/nri2024. [DOI] [PubMed] [Google Scholar]
- 10.Armstrong S, Staunton J, Silverman L, Pieters R, den Boer M, Minden M, et al. MLL translocations specify a distinct gene expression profile that distinguishes a unique leukemia. Nat Genet. 2002;30:41. doi: 10.1038/ng765. [DOI] [PubMed] [Google Scholar]
- 11.Valk PJM, Verhaak RGW, Beijen MA, Erpelinck CAJ, van Doorn-Khosrovani SBW, Boer JM, et al. Prognostically useful gene-expression profiles in acute myeloid leukemia. N Engl J Med. 2004;350:1617–1628. doi: 10.1056/NEJMoa040465. [DOI] [PubMed] [Google Scholar]
- 12.Ross ME, Mahfouz R, Onciu M, Liu HC, Zhou X, Song G, et al. Gene expression profiling of pediatric acute myelogenous leukemia. Blood. 2004;104:3679–3687. doi: 10.1182/blood-2004-03-1154. [DOI] [PubMed] [Google Scholar]
- 13.Zeisig BB, Milne T, García-Cuéllar MP, Schreiner S, Martin ME, Fuchs U, et al. Hoxa9 and Meis1 are key targets for MLL-ENL-mediated cellular immortalization. Mol Cell Biol. 2004;24:617–628. doi: 10.1128/MCB.24.2.617-628.2004. [DOI] [PMC free article] [PubMed] [Google Scholar]
- 14.Martin ME, Milne TA, Bloyer S, Galoian K, Shen W, Gibbs D, et al. Dimerization of MLL fusion proteins immortalizes hematopoietic cells. Cancer cell. 2003;4:197–207. doi: 10.1016/s1535-6108(03)00214-9. [DOI] [PubMed] [Google Scholar]
- 15.So CW, Lin M, Ayton PM, Chen EH, Cleary ML. Dimerization contributes to oncogenic activation of MLL chimeras in acute leukemias. Cancer cell. 2003;4:99–110. doi: 10.1016/s1535-6108(03)00188-0. [DOI] [PubMed] [Google Scholar]
- 16.Ayton PM, Cleary ML. Transformation of myeloid progenitors by MLL oncoproteins is dependent on Hoxa7 and Hoxa9. Genes Dev. 2003;17:2298. doi: 10.1101/gad.1111603. [DOI] [PMC free article] [PubMed] [Google Scholar]
- 17.Wang J, Iwasaki H, Krivtsov A, Febbo PG, Thorner AR, Ernst P, et al. Conditional MLL-CBP targets GMP and models therapy-related myeloproliferative disease. EMBO J. 2005;24:368. doi: 10.1038/sj.emboj.7600521. [DOI] [PMC free article] [PubMed] [Google Scholar]
- 18.Okada Y, Feng Q, Lin Y, Jiang Q, Li Y, Coffield V, et al. hDOT1L links histone methylation to leukemogenesis. Cell. 2005;121:167. doi: 10.1016/j.cell.2005.02.020. [DOI] [PubMed] [Google Scholar]
- 19.Kumar A, Hudson W, Chen W, Nishiuchi R, Yao Q, Kersey J. Hoxa9 influences the phenotype but not the incidence of Mll-AF9 fusion gene leukemia. Blood. 2004;103:1823. doi: 10.1182/blood-2003-07-2582. [DOI] [PubMed] [Google Scholar]
- 20.Kumar AR, Li Q, Hudson WA, Chen W, Sam T, Yao Q, et al. A role for MEIS1 in MLL-fusion gene leukemia. Blood. 2009;113:1756. doi: 10.1182/blood-2008-06-163287. [DOI] [PMC free article] [PubMed] [Google Scholar]
- 21.Wong P, Iwasaki M, Somervaille TC, So CWE, Cleary ML. Meis1 is an essential and rate-limiting regulator of MLL leukemia stem cell potential. Genes Dev. 2007;21:2762. doi: 10.1101/gad.1602107. [DOI] [PMC free article] [PubMed] [Google Scholar]
- 22.Mann RS, Lelli KM, Joshi R. Hox specificity: unique roles for cofactors and collaborators. Curr Top Dev Biol. 2009;88:63–101. doi: 10.1016/S0070-2153(09)88003-4. [DOI] [PMC free article] [PubMed] [Google Scholar]
- 23.Huang Y, Sitwala K, Bronstein J, Sanders D, Dandekar M, Collins C, et al. Identification and characterization of Hoxa9 binding sites in hematopoietic cells. Blood. 2012;119:388–398. doi: 10.1182/blood-2011-03-341081. [DOI] [PMC free article] [PubMed] [Google Scholar]
- 24.Hu Y-L, Fong S, Ferrell C, Largman C, Shen W-F. HOXA9 modulates its oncogenic partner Meis1 to influence normal hematopoiesis. Mol Cell Biol. 2009;29:5181–5192. doi: 10.1128/MCB.00545-09. [DOI] [PMC free article] [PubMed] [Google Scholar]
- 25.Wang GG, Pasillas MP, Kamps MP. Persistent transactivation by Meis1 replaces Hox function in myeloid leukemogenesis models: evidence for co-occupancy of Meis1-Pbx and Hox-Pbx complexes on promoters of leukemia-associated genes. Mol Cell Biol. 2006;26:3902. doi: 10.1128/MCB.26.10.3902-3916.2006. [DOI] [PMC free article] [PubMed] [Google Scholar]
- 26.Wang GG, Pasillas MP, Kamps MP. Meis1 programs transcription of FLT3 and cancer stem cell character, using a mechanism that requires interaction with Pbx and a novel function of the Meis1 C-terminus. Blood. 2005;106:254–264. doi: 10.1182/blood-2004-12-4664. [DOI] [PMC free article] [PubMed] [Google Scholar]
- 27.Wang Q-f, Li Y-j, Dong J-f, Li B, Kaberlein JJ, Zhang L, et al. Regulation of MEIS1 by distal enhancer elements in acute leukemia. Leukemia. 2013;28:138–146. doi: 10.1038/leu.2013.260. [DOI] [PMC free article] [PubMed] [Google Scholar]
- 28.Huang G, Zhang P, Hirai H, Elf S, Yan X, Chen Z, et al. PU.1 is a major downstream target of AML1 (RUNX1) in adult mouse hematopoiesis. Nature Genet. 2008;40:51. doi: 10.1038/ng.2007.7. [DOI] [PubMed] [Google Scholar]
- 29.Iwasaki H, Somoza C, Shigematsu H, Duprez EA, Iwasaki-Arai J, Mizuno S, et al. Distinctive and indispensable roles of PU.1 in maintenance of hematopoietic stem cells and their differentiation. Blood. 2005;106:1590–1600. doi: 10.1182/blood-2005-03-0860. [DOI] [PMC free article] [PubMed] [Google Scholar]
- 30.Rosenbauer F, Wagner K, Kutok JL, Iwasaki H, Le Beau MM, Okuno Y, et al. Acute myeloid leukemia induced by graded reduction of a lineage-specific transcription factor, PU.1. Nature Genet. 2004;36:624–630. doi: 10.1038/ng1361. [DOI] [PubMed] [Google Scholar]
- 31.Zhang Y, Yan X, Sashida G, Zhao X, Rao Y, Goyama S, et al. Stress hematopoiesis reveals abnormal control of self-renewal, lineage bias, and myeloid differentiation in Mll partial tandem duplication (Mll-PTD) hematopoietic stem/progenitor cells. Blood. 2012;120:1118–1129. doi: 10.1182/blood-2012-02-412379. [DOI] [PMC free article] [PubMed] [Google Scholar]
- 32.Verhaak RG, Wouters BJ, Erpelinck CA, Abbas S, Beverloo HB, Lugthart S, et al. Prediction of molecular subtypes in acute myeloid leukemia based on gene expression profiling. Haematologica. 2009;94:131. doi: 10.3324/haematol.13299. [DOI] [PMC free article] [PubMed] [Google Scholar]
- 33.Tomasson MH, Xiang Z, Walgren R, Zhao Y, Kasai Y, Miner T, et al. Somatic mutations and germline sequence variants in the expressed tyrosine kinase genes of patients with de novo acute myeloid leukemia. Blood. 2008;111:4797. doi: 10.1182/blood-2007-09-113027. [DOI] [PMC free article] [PubMed] [Google Scholar]
- 34.Haferlach T, Kohlmann A, Wieczorek L, Basso G, Te Kronnie G, Béné M-C, et al. Clinical utility of microarray-based gene expression profiling in the diagnosis and subclassification of leukemia: report from the International Microarray Innovations in Leukemia Study Group. J Clin Oncol. 2010;28:2529–2537. doi: 10.1200/JCO.2009.23.4732. [DOI] [PMC free article] [PubMed] [Google Scholar]
- 35.Metzeler KH, Hummel M, Bloomfield CD, Spiekermann K, Braess J, Sauerland MC, et al. An 86-probe-set gene-expression signature predicts survival in cytogenetically normal acute myeloid leukemia. Blood. 2008;112:4193–4201. doi: 10.1182/blood-2008-02-134411. [DOI] [PMC free article] [PubMed] [Google Scholar]
- 36.Wilson NK, Foster SD, Wang X, Knezevic K, Schütte J, Kaimakis P, et al. Combinatorial transcriptional control in blood stem/progenitor cells: genome-wide analysis of ten major transcriptional regulators. Cell Stem Cell. 2010;7:532–544. doi: 10.1016/j.stem.2010.07.016. [DOI] [PubMed] [Google Scholar]
- 37.Lefterova MI, Steger DJ, Zhuo D, Qatanani M, Mullican SE, Tuteja G, et al. Cell-Specific Determinants of Peroxisome Proliferator-Activated Receptor g Function in Adipocytes and Macrophages. Mol Cell Biol. 2010;30:2078. doi: 10.1128/MCB.01651-09. [DOI] [PMC free article] [PubMed] [Google Scholar]
- 38.Barash Y, Dehan E, Krupsky M, Franklin W, Geraci M, Friedman N, et al. Comparative analysis of algorithms for signal quantitation from oligonucleotide microarrays. Bioinformatics. 2004;20:839. doi: 10.1093/bioinformatics/btg487. [DOI] [PubMed] [Google Scholar]
- 39.Wang Q-f, Wu G, Mi S, He F, Wu J, Dong J, et al. MLL fusion proteins preferentially regulate a subset of wild-type MLL target genes in the leukemic genome. Blood. 2011;117:6895–6905. doi: 10.1182/blood-2010-12-324699. [DOI] [PMC free article] [PubMed] [Google Scholar]
- 40.Bernt KM, Zhu N, Sinha AU, Vempati S, Faber J, Krivtsov AV, et al. MLL-Rearranged Leukemia Is Dependent on Aberrant H3K79 Methylation by DOT1L. Cancer cell. 2011;20:66–78. doi: 10.1016/j.ccr.2011.06.010. [DOI] [PMC free article] [PubMed] [Google Scholar]
- 41.Zuber J, Rappaport AR, Luo W, Wang E, Chen C, Vaseva AV, et al. An integrated approach to dissecting oncogene addiction implicates a Myb-coordinated self-renewal program as essential for leukemia maintenance. Genes Dev. 2011;25:1628–1640. doi: 10.1101/gad.17269211. [DOI] [PMC free article] [PubMed] [Google Scholar]
- 42.Guenther MG, Lawton LN, Rozovskaia T, Frampton GM, Levine SS, Volkert TL, et al. Aberrant chromatin at genes encoding stem cell regulators in human mixed-lineage leukemia. Genes Dev. 2008;22:3403–3408. doi: 10.1101/gad.1741408. [DOI] [PMC free article] [PubMed] [Google Scholar]
- 43.Knezevic K, Bee T, Wilson NK, Janes ME, Kinston S, Polderdijk S, et al. A Runx1-Smad6 Rheostat Controls Runx1 Activity during Embryonic Hematopoiesis. Mol Cell Biol. 2011;31:2817. doi: 10.1128/MCB.01305-10. [DOI] [PMC free article] [PubMed] [Google Scholar]
- 44.Poirel H, Rack K, Delabesse E, Radford-Weiss I, Troussard X, Debert C, et al. Incidence and characterization of MLL gene (11q23) rearrangements in acute myeloid leukemia M1 and M5. Blood. 1996;87:2496–2505. [PubMed] [Google Scholar]
- 45.Rabbitts T. Chromosomal translocations in human cancer. Nature. 1994;372:143. doi: 10.1038/372143a0. [DOI] [PubMed] [Google Scholar]
- 46.Swansbury G. The proportion of clonal divisions varies in different hematologic malignancies. The United Kingdom Cancer Cytogenetics Group (UKCCG) [corrected] Cancer Genet Cytogenet. 1998;104:139. doi: 10.1016/s0165-4608(97)00477-9. [DOI] [PubMed] [Google Scholar]
- 47.Vangala RK, Heiss-Neumann MS, Rangatia JS, Singh SM, Schoch C, Tenen DG, et al. The myeloid master regulator transcription factor PU.1 is inactivated by AML1-ETO in t (8; 21) myeloid leukemia. Blood. 2003;101:270–277. doi: 10.1182/blood-2002-04-1288. [DOI] [PubMed] [Google Scholar]
- 48.Wang K, Wang P, Shi J, Zhu X, He M, Jia X, et al. PML/RARalpha targets promoter regions containing PU.1 consensus and RARE half sites in acute promyelocytic leukemia. Cancer cell. 2010;17:186. doi: 10.1016/j.ccr.2009.12.045. [DOI] [PubMed] [Google Scholar]
- 49.Mueller BU, Pabst T, Fos J, Petkovic V, Fey MF, Asou N, et al. ATRA resolves the differentiation block in t (15; 17) acute myeloid leukemia by restoring PU.1 expression. Blood. 2006;107:3330. doi: 10.1182/blood-2005-07-3068. [DOI] [PMC free article] [PubMed] [Google Scholar]
- 50.Harrell F, Lee KL, Mark DB. Tutorial in biostatistics multivariable prognostic models: issues in developing models, evaluating assumptions and adequacy, and measuring and reducing errors. Stat Med. 1996;15:361–387. doi: 10.1002/(SICI)1097-0258(19960229)15:4<361::AID-SIM168>3.0.CO;2-4. [DOI] [PubMed] [Google Scholar]
- 51.DerSimonian R, Laird N. Meta-analysis in clinical trials. Control Clin Trials. 1986;7:177–188. doi: 10.1016/0197-2456(86)90046-2. [DOI] [PubMed] [Google Scholar]
- 52.Venet D, Dumont JE, Detours V. Most random gene expression signatures are significantly associated with breast cancer outcome. PLoS Comput Biol. 2011;7:e1002240. doi: 10.1371/journal.pcbi.1002240. [DOI] [PMC free article] [PubMed] [Google Scholar]
- 53.Cook WD, McCaw BJ, Herring C, John DL, Foote SJ, Nutt SL, et al. PU.1 is a suppressor of myeloid leukemia, inactivated in mice by gene deletion and mutation of its DNA binding domain. Blood. 2004;104:3437–3444. doi: 10.1182/blood-2004-06-2234. [DOI] [PubMed] [Google Scholar]
- 54.Mueller BU, Pabst T, Osato M, Asou N, Johansen LM, Minden MD, et al. Heterozygous PU.1 mutations are associated with acute myeloid leukemia. Blood. 2002;100:998–1007. doi: 10.1182/blood.v100.3.998. [DOI] [PubMed] [Google Scholar]
- 55.Aikawa Y, Katsumoto T, Zhang P, Shima H, Shino M, Terui K, et al. PU.1-mediated upregulation of CSF1R is crucial for leukemia stem cell potential induced by MOZ-TIF2. Nature Med. 2010;16:580–585. doi: 10.1038/nm.2122. [DOI] [PMC free article] [PubMed] [Google Scholar]
- 56.Staber P, Zhang P, Ye M, Welner R, Nombela-Arrieta C, Bach C, et al. Sustained PU.1 levels balance cell-cycle regulators to prevent exhaustion of adult hematopoietic stem cells. Mol Cell. 2013;49:934–946. doi: 10.1016/j.molcel.2013.01.007. [DOI] [PMC free article] [PubMed] [Google Scholar]
Associated Data
This section collects any data citations, data availability statements, or supplementary materials included in this article.