

Abstract
Background
Measurements of the concentrations of γ-aminobutyric acid (GABA) and glutamate in the motor cortex and lentiform nucleus of dystonic patients using single voxel 1H magnetic resonance spectroscopy (MRS) have yielded conflicting results so far. This study aimed at investigating dynamic changes in metabolite concentrations after stimulation of the motor cortex in patients with upper limb dystonia.
Methods
Using single voxel MRS at 3 T, the concentrations of GABA, glutamate plus glutamine, and N-acetylaspartate were measured bilaterally in the primary sensorimotor cortex, lentiform nucleus, and occipital region before and after 5 Hz transcranial magnetic stimulation (TMS) over the dominant motor cortex. Data obtained from 15 patients with upper limb primary dystonia were compared to data obtained from 14 healthy volunteers.
Results
At baseline, there was no group difference in concentration of metabolites in any of the regions. rTMS induced a local (in the stimulated motor cortex) decrease of N-acetylaspartate (p < 0.006) to the same extent in healthy volunteers and patients. GABA concentrations were modulated differently, however, decreasing mildly in patients and increasing mildly in healthy volunteers (p = 0.05). There were no remote effects in the lentiform nucleus in either group.
Conclusion
The stimulation-induced changes in metabolite concentrations are interpreted in the view of the increased energy demand induced by rTMS. Dynamics of the GABA concentration are specifically impaired in dystonic patients. Whether these changes reflect changes in the extra synaptic or synaptic GABA component is discussed.
Keywords: gamma-aminobutyric acid (GABA), NAA, transcranial magnetic stimulation, dystonia, spectroscopy
Introduction
Patients with writer’s cramp, a task-specific idiopathic focal dystonia, present involuntary sustained muscle contractions causing abnormal movements and postures during writing. The neurochemical bases of idiopathic dystonia are poorly understood. Indirect measures, using paired pulse transcranial magnetic stimulation (TMS), have consistently pointed to an altered baseline excitability of inhibitory circuits using γ-aminobutyric acid (GABA) as neurotransmitter in the motor cortex (MC) of dystonic patients. 1, 2 In contrast, direct measures of GABA concentrations in the few post-mortem studies performed so far have provided discordant results, with normal GABA concentrations observed in idiopathic dystonia3 and markedly reduced GABA in the basal ganglia in symptomatic dystonia.1H magnetic resonance spectroscopy (MRS) permits in vivo serial and temporal quantitative assessment of GABA metabolism.5 Using MRS, contradictory results have been reported in writer’s cramp, with lower GABA levels at 1.5 T in the MC and the lentiform nucleus contralateral to the affected hand 6, and no differences in these regions at 3 T.7 Non-invasive cortical stimulation techniques (repetitive TMS or rTMS and transcranial direct current stimulation) are tools that temporally change the excitability of cortical regions and their related networks. MRS has been used to assess the local and remote metabolic consequences of such changes. rTMS to the dorsolateral prefrontal cortex,8, 9 parietal cortex, 10 and secondary somatosensory cortex11 has been shown to affect the glutamate/glutamine release close to the site of stimulation but also in remote regions in healthy 8, 10 and pathological brains. 9,11 Data on changes of GABA release after non-invasive cortical stimulation are scarce. Continuous theta burst rTMS and cathodal transcranial direct current stimulation protocols, both decreasing MC excitability, led to increase12 or decrease of GABA metabolism, 13 respectively.
Given the efficacy of non-invasive cortical stimulation to unveil glutamate changes in various pathological conditions and the tight link between GABA and glutamate metabolism,14 we reasoned that measuring GABA metabolism after boosting the excitability of the MC and its related cortico-striatal pathway could help in measuring the changes in GABA metabolism in dystonic patients. We hypothesized that patients would present decreased GABA metabolism after MC activation, locally as well as remotely in the striatum. Additionally, N-acetylaspartate (NAA), which has been proposed to be a marker of neuronal health and viability through its role in mitochondrial energy production from Glu,15 was studied. We used subthreshold 5 Hz stimulation to stimulate the MC as such stimulation induces greater effects in patients with upper limb dystonia than in healthy subjects.16
Material and methods
Experimental procedures were approved by the local Ethics Committee and performed according to the ethical standards laid down in the Declaration of Helsinki. All subjects gave their written informed consent before the experiments.
Subjects
Fifteen patients with primary upper limb dystonia (4 males; mean age ± SD: 47.5 ± 12.6 years, range: 22–63 years) and 14 healthy volunteers (7 males, 40.2 ± 13.5 years, range: 23–68 years) (p = 0.6) were included in the study (Table 1). No patient received botulinum toxin during the 6 months preceding the study or other medications for dystonia.
Table 1.
Clinical characteristics of the patients
| N° | Age | Sex | Affected side/handedness | Duration (years) | Triggering activities | Dystonic movements/posture |
|---|---|---|---|---|---|---|
| 1 | 57 | F | R/R | 11 | writing | flex. I, II, III, wrist flex. |
| 2 | 52 | F | R/R | 22 | writing drawing, precise movements | fingers & wrist flex. |
| 3 | 46 | F | R/R | 10 | writing | flex. I, II, wrist ext. & add. |
| 4 | 57 | M | R/R | 8 | writing | flex. I, II, III |
| 5 | 34 | M | R/R | 4 | writing typing | ext. II |
| 6 | 58 | M | R+L/R | R: 30 L: 15 |
writing drawing | R: wrist flex. & add, flex. I, III L: wrist flex., ext. I, flex. II, V |
| 7 | 56 | F | R/R | 8 | writing | wrist ext. & add, flex. I, II, III |
| 8 | 24 | M | R+L/R | R:11 L: 2 |
writing contact of palm with an object | R: myoclonus L: wrist flex. & add. |
| 9 | 52 | F | R/R | 3 | writing | wrist flex. |
| 10 | 47 | F | R/R | 8 | writing computer | ext. I, wrist ext. & abd. |
| 11 | 55 | F | R/R | 35 | writing | flex. III, IV, wrist add. |
| 12 | 38 | F | R/R | 9 | writing | wrist abd. |
| 13 | 40 | F | L/L | 4 | writing | flex. II |
| 14 | 24 | F | R/R | 4 | writing computer | tremor, wrist and finger flex. |
| 15 | 59 | F | R/R | 16 | writing | ext. I, flex. II, wrist flex. & add. |
Abbreviations. Abd.: abduction, add.: adduction, ext.: extension, F: female, flex.: flexion, L: left, M: male, R: right, WC: writer’s cramp, I: thumb, II: index finger, III: middle finger, V: little finger.
Data acquisition
Study protocol (Figure 1)
Figure 1. Experimental design.
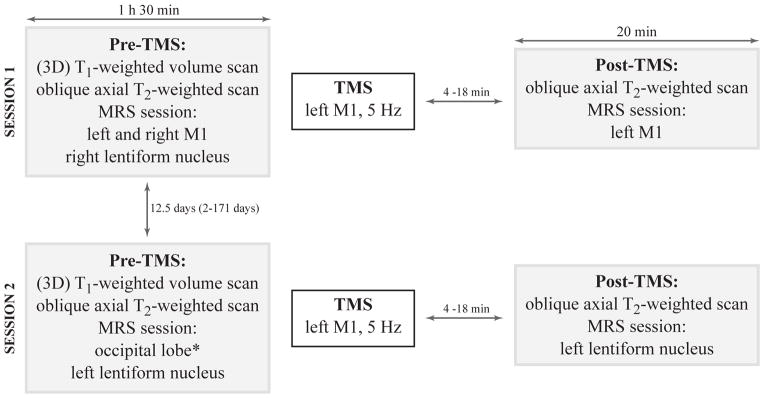
The study was divided into two sessions due to the relatively long MRS acquisition time (15 min per voxel) and the duration of the post effects of rTMS (20 min). In one session, the post-rTMS MRS scan was performed in dominant MC. In the other session, the post-rTMS MRS scan was performed in the lentiform nucleus on the same side. Sessions were randomly ordered. The delay between the end of the TMS procedure and the beginning of the post-TMS MRS acquisition varied from 4 to 18 min (session 1: healthy volunteers: 11.0 ± 3.3 min, patients: 12.4 ± 4.1 min, p = 0.3; session 2: healthy volunteers: 10.2 ± 3.7 min, patients: 11.9 ± 2.9 min, p = 0.2).
Each session was composed of a pre-rTMS MRS session, the rTMS procedure, and a post-rTMS MRS session. Following the pre-rTMS MRS examination, subjects were moved out of the scanner to the TMS room. After the rTMS procedure, subjects were pushed back to the scanner room using a wheelchair to avoid subjects’ motion. The study was divided into two sessions due to the relatively long MRS acquisition time (15 min per voxel) and the duration of rTMS post effects (20 min). In one session, the post-rTMS scan was performed in dominant MC, and in the other session in the dominant lentiform nucleus. The sessions were randomly ordered.
Magnetic resonance examination
Acquisitions were performed using a 3 T whole-body system (MAGNETOM Trio, Siemens, Erlangen, Germany). Radiofrequency transmission was performed with the built-in body coil, and signal was received with a 12-channel receive-only head coil.
Data were acquired using a MEGA-PRESS 17, 18 sequence (TR = 3 s, TE = 68 ms) with double-banded editing pulses (180° Shinnar-Le Roux, duration = 17 ms, bandwidth = 70 Hz). PRESS spatial localization utilized a 90° Hamming-filtered sinc pulse (duration = 2.12 ms, bandwidth = 4.2 kHz) and two 180° mao pulses (duration = 5.25 ms, bandwidth = 1.2 kHz). Additional water suppression using variable power with optimized relaxation delays (VAPOR) and outer volume suppression techniques18 were incorporated prior to MEGA-PRESS. The final spectra were calculated by subtracting spectra acquired with the double-banded editing pulse applied at 1.9 and 4.7 ppm from those acquired with the double-banded editing pulse applied at 4.7 and 7.5 ppm (128 pairs of scans). Free induction decays were stored separately in memory and individually frequency and phase corrected using the total creatine signal at 3.03 ppm. Metabolite-nulled macromolecular spectra (TIR = 900 ms, 128 x 2 scans) were acquired in the occipital lobe of 13 subjects. Shimming was performed using a fast automatic shimming technique with echo-planar signal trains using mapping along projections, FAST(EST)MAP.19
Three voxels were prescribed using anatomical landmarks observed on the T1- and T2-weighted images in the sensorimotor region (MC) using the hand knob as a landmark (28.8 mL)20 (Figure 2A), the lentiform nucleus including the putamen and the globus pallidus (20.8 mL) (Figure 2B), and the occipital region (27.6 mL) (Figure 2C).
Figure 2. Regions of interest and data quality.

Upper part: The location and size of the voxels shown on T2-weighted images in the axial plane for (a) the motor cortex, (b) the lentiform nucleus, and (c) the occipital cortex.
Lower part: Data quality. All spectra obtained in healthy volunteers (upper row) and patients (lower row) in: (a) the motor cortex, (b) the lentiform nucleus, and (c) the occipital cortex. All spectra are shown with the vertical scale adjusted based on water reference. The edited MEGA-PRESS spectra allowed measurement of NAA, Glx and GABA concentrations. The resonances of each of those neurochemicals can be easily identified.
Abbreviations. NAA: N-acetylaspartate, Glx: glutamate + glutamine, GABA: γ-aminobutyric acid, MM: macromolecules.
TMS
A figure-eight shaped cooled coil (inner diameter 7 cm) connected to a SuperRapid2 magnetic stimulator (Magstim Company, Dyfed, UK) was used to deliver the stimulations. During session 1 (Figure 1), the hot spot for the first dorsal interosseous (FDI) muscle, on the dominant hemisphere, was identified. This position was maintained throughout the session with the help of a MRI-based neuronavigation system (eXimia 2.2.0, Nextim Ltd., Helsinki, Finland). The coil was placed with the handle pointing backwards at about 45° laterally. Elicited pulses were biphasic and currents in the brain had PA–AP direction. After identifying the FDI hot spot, the resting motor threshold (RMT) was calculated according to standard procedure.
rTMS protocol:21 at the FDI hot spot, 1800 pulses were delivered at 5 Hz in 12 blocks of 150 pulses (inter-train interval: 10 s, intensity: 0.9 x RMT).
The hotspot for FDI identified during session 1 was stored in the neuronavigation system and used for session 2. Intensity was adjusted according to the RMT calculated at each session.
MRS data analysis and quantification
The MEGA-PRESS edited spectra were analyzed using LCModel 6.1–4 G22, 23 (Fig. 3) with the basis set comprised of experimentally measured macromolecular spectra from the occipital region and spectra measured from 100 mM solutions of NAA, GABA, Glu, and Gln (pH = 7.2, 37°C). No baseline correction, zero-filling, or apodization functions were applied to the in vivo data prior to the analysis. The LCModel fitting was performed over the spectral range from 0.5 to 4.5 ppm.
Figure 3. LCModel analysis.

LCModel analysis of representative spectra obtained in: (a) the motor cortex, (b) the lentiform nucleus, and (c) the occipital cortex. In vivo data, LCModel fits, residuals and baselines. A close match between the LCModel fits and the in vivo spectra was achieved as evidenced by the noise-dominated fit residuals and flat baselines.
Quantification was performed using unsuppressed water signal obtained from the same voxel (24). Concentrations were corrected for cerebrospinal fluid content using turbo spin echo images segmented using SPM8 software (www.fil.ion.ucl.ac.uk/spm). The relative densities of MR-visible water for gray matter, white matter, and cerebrospinal fluid were assumed to be 0.78, 0.65, 0.97, respectively.24
For the calculation of attenuation factors, the T1 and T2 relaxation times of water and metabolites were taken from a previously published report.25
Only results with Cramér-Rao lower bounds ≤ 50% were included in the analysis based on the recommendation from the LCModel manual.
Statistical analysis
TMS data
RMT, intensity of rTMS, and delay between the end of the rTMS and the MRS acquisition were compared between sessions 1 and 2 using paired t-tests, and between groups using unpaired t-tests.
Metabolite concentrations
In the first analysis, the between-group differences in baseline metabolite concentrations were estimated by fitting a linear mixed model for each metabolite,26 with subject as random factor and voxel (lentiform nucleus, MC, occipital cortex), hemisphere (dominant, non-dominant) and group (patient, healthy volunteers) as fixed factors. In a secondary analysis, a linear mixed model approach was used to determine the effects of TMS and group on each metabolite concentration. For each of the two regions (MC and lentiform nucleus) and for each metabolite, a linear mixed model was fitted for repeated measurements (pre- versus post-rTMS measurements) with subject as the random effect and group and TMS (pre versus post) as fixed factors. To rule out a confounding effect of the difference in baseline GABA concentrations, an additional analysis was performed using the normalized values of the metabolites (concentration post/concentration pre) instead of the raw values. A linear mixed model was fitted with subject as random effect and voxel (MC, lentiform nucleus) and group as fixed effects.
Statistical analyses were performed using SAS version 9.2 (SAS Institute, Cary, NC). All tests were two-sided at the 5% level.
Results
RMT
The mean RMTs were 58 ± 11% of stimulator output in healthy volunteers and 56 ± 8% in patients (p = 0.5) in session 1, and 57 ± 12% and 57 ± 7% (p = 0.8) in session 2, respectively. The mean intensities of stimulation were 53 ± 11% of stimulator output in healthy volunteers and 50 ± 7% in patients (p = 0.4) in session 1, and 51 ± 11 % and 51 ± 6 % (p = 0.9) in session 2, respectively. There were no significant differences between session 1 and 2 in RMT (p = 0.9) or intensity used (p = 0.9).
Spectral quality
Spectra were of very high quality without any contamination from signals outside of the voxel such as lipids as shown in Figures 2 and 3. Similar water linewidths were obtained in MC (5.7 ± 0.5 Hz) and occipital lobe (6.3 ± 0.5 Hz). Broader water linewidths were obtained in the lentiform nucleus (9 ± 1.5 Hz).
Baseline concentrations
At baseline, there was no significant difference in concentrations of NAA, Glx, and GABA between patients and healthy volunteers in studied regions (Figure 4). In both groups, there was a marked hemisphere effect for NAA (non-dominant versus dominant: p < 0.0001, group p = 0.4) and Glx (p < 0.0006, group p = 0.3) in the lentiform nucleus, with higher concentrations in the non-dominant vs. the dominant side. No asymmetry was observed in any other brain region for any metabolite.
Figure 4. Concentrations of NAA, Glx and GABA measured by MRS at baseline and after rTMS to the dominant motor cortex.

(A) Bars represent the average absolute concentrations of brain metabolites quantified using LCModel and SD. Baseline concentrations of NAA (upper panel), Glx (middle panel) and GABA (lower panel) in motor cortices on the dominant (black bars) and non-dominant (dark grey bars) sides, lentiform nuclei on the dominant side (white bars) and non-dominant side (light grey bars) and occipital region (shaded bars) in healthy volunteers (left) and dystonic patients (right). (B): Average concentrations of NAA (upper panel), Glx (middle panel) and GABA (lower panel) in the dominant motor cortex (right) and in the lentiform nucleus (Lleft) are plotted at baseline and after 5 Hz rTMS to the dominant motor cortex in healthy subjects (black squares) and dystonic patients (grey diamonds). After rTMS, NAA decreased in both groups in motor cortex, GABA decreased in the patient group while it increased in the healthy volunteers group, and Glx was not modified in the healthy volunteers group while it decreased in the patient group.
Statistical significance is indicated by the stars: * p 0.05, ** 0.01 > p > 0 .001
Abbreviations: D: dominant, LN: lentiform nucleus, MC: motor cortex, ND: non-dominant
Pre- versus post-rTMS
Concentrations of metabolites pre- vs. post-rTMS were compared for the dominant hemisphere (left for 14/15 patients and 13/14 healthy volunteers) (Figure 4). There were no rTMS-induced changes observed in the lentiform nucleus for any metabolite. In the dominant MC, rTMS induced a significant decrease in NAA in both groups (TMS p < 0.005, group*TMS p = 0.6). A significant effect of TMS on Glx concentration was also observed, with a trend to have larger decrease in patients (TMS p < 0.01, TMS*group p = 0.07). TMS had different effects on GABA concentrations in patients and healthy volunteers (TMS p = 0.2, TMS*group p = 0.05): TMS induced a mild increase in GABA concentrations in healthy volunteers, whereas there was a mild decrease in patients.
The rTMS–induced variations in metabolite concentrations (post-rTMS/pre) were significantly different between healthy volunteers and patients only for GABA (p < 0.04) (NAA p = 0.6; Glx p = 0.4), confirming that the different changes in GABA concentrations in healthy volunteers and patients were not biased by different baseline levels.
Discussion
Our results provide, for the first time, direct evidence that the dynamic modulation in GABA concentrations induced by excitatory rTMS is altered in patients with writer’s cramp. After rTMS, MRS-GABA decreased locally in dystonic patients compared to the baseline condition, in contrast with an increase in MRS-GABA in healthy volunteers. In the baseline condition, no differences were found in MRS-GABA in patients as compared to healthy volunteers in line with a recent MRS study at 3 T.7 Altered inhibition in dystonia relies on strong evidence such as altered GABA inhibitory mechanisms in the MC1, 2 and reduced GABA receptors binding using 11C-flumazenil, a specific ligand of the GABA-A receptor.2,7 Here, we complement these results by showing that modulation of GABA by neuronal activation is abnormal in these patients.
Several mechanisms may explain the increase in MRS-GABA observed in healthy volunteers after rTMS to the MC. GABA is produced in the presynaptic terminals of GABAergic neurons by decarboxylation of glutamate by the glutamic acid decarboxylase. Activity of the glutamic acid decarboxylase is believed to be the limiting factor for regulating the steady-state concentration of GABA in vivo. The glutamic acid decarboxylase has active and inactive forms. Increases in the active form of the glutamic acid decarboxylase and activity-dependent GABA synthesis have been associated with increased cortical activity.28 A previous study has shown that 5 Hz cortical stimulation induces a lasting increase in blood oxygen level dependant (BOLD) signal29 and an increase in regional cerebral blood flow in the primary sensorimotor region30 indicating increased neuronal activity and energy demand. The increase in MRS-GABA observed in healthy volunteers after 5 Hz rTMS to the MC may thus result from an increase in glutamic acid decarboxylase activity and GABA synthesis. Reduced rTMS-induced modulation of GABA in dystonic patients may thus result from altered GABA synthesis and neurotransmission.
Another interesting issue is the compartmental origin of GABA changes, i.e. intracellular or extracellular at the synaptic or extrasynaptic levels. MRS measures the overall concentration of GABA and does not provide information about the concentrations in different compartments. However, several lines of evidence from previous studies suggest that the increase in MRS-GABA observed in healthy volunteers reflects an increase in extrasynaptic31 rather than synaptic GABA concentration. First, high-frequency rTMS has been shown to result in decreased short interval intracortical inhibition, which reflects synaptic GABA inhibition, as opposed to increased MRS GABA concentrations.32 Second, there is no direct relationship between MRS-GABA and short interval intracortical inhibition further suggesting that MRS-GABA concentrations are poorly related with synaptic GABA inhibition.33 Instead, MRS-GABA concentrations may better reflect the extrasynaptic GABA tone as suggested previously.33 Extrasynaptic GABA is believed to activate extrasynaptic receptors located on cell membranes and to be implicated in the mediation of neuronal tonic signaling.34 Further investigation will determine whether extrasynaptic GABA signaling is involved in the pathophysiology of dystonia.
GABA decrease in dystonic patients after cortical activation may participate in the maladaptive plasticity documented in dystonia with a prolonged response and a loss of the spatial organization of plastic changes.35 This is supported by in vitro studies in animals, which have demonstrated that the tonic GABAergic tone controls the induction of synaptic plasticity.36, 37 In vitro studies in slices of rat neocortex38 and in vivo studies in humans 39 have also shown that disruption of local synaptic inhibitory activity promotes long-term potentiation (LTP)/plasticity. In dystonic patients, abnormal short-term synaptic plasticity in the MC, characterized by enhanced responsiveness to 5 Hz TMS, has been observed.16 Five Hz rTMS induced no obvious changes in Glx concentrations in healthy volunteers, but it induced a decrease in patients. In healthy volunteers, a similar increase of MRS-GABA and no change of Glx induced by TMS were observed after continuous thetaburst stimulation.12 These two types of rTMS protocols have opposite effects on brain excitability with lasting increase of cortical excitability for 5 Hz TMS40 and lasting decrease of cortical excitability for continuous thetaburst stimulation.12 This suggests that MRS-induced changes of Glx and GABA are not directly related to the type of TMS-induced plasticity per se. Alternatively, changes in GABA concentrations may be related to the increased energy demand associated with neuronal activation.41
Neuroimaging data are in agreement with this interpretation: low and high frequency cortical stimulation induces similar lasting increases in regional cerebral blood flow, despite differential effects on cortical excitability (as measured by the change in size of the motor evoked responses).30, 42 In contrast to healthy volunteers, MRS-Glx had a trend to decrease after rTMS in patients in line with the enhanced effect of 5 Hz rTMS in dystonia.16 An unexpected finding was that 5 Hz rTMS to the MC induced a prominent local decrease of NAA to the same extent in both groups. Reduction in NAA concentration has been associated with neuronal activation in humans using MRS.41, 43 Neuronal activation induced by TMS may therefore trigger the release of NAA in the extracellular compartment by neurons, which can be used to control water distribution43 and to participate in the Krebs cycle and oxidative metabolism.41
In the lentiform nucleus, NAA and Glx levels were higher in the non-dominant hemisphere. Such an asymmetry was in contrast to a previous study using MRS at 2 T.44 The origin of the lateralization of metabolite levels is unknown but may be related to the asymmetry of brain areas as shown using structural imaging,45 diffusion connectivity,46 or fMRI.47
Limitations of the study
Due to time limitations, the relationship between TMS-induced metabolite changes and TMS-induced physiological changes was not explored. Another limitation was the size of the voxels being larger than the structure of interest, although this was similar to other studies in which GABA was measured in vivo in human brain. Therefore, we can not exclude contribution of other regions (such as premotor cortex for MC) to the observed changes. The absence of remote effects of rTMS in the lentiform nucleus in either group may be due to technical issues: the part of this nucleus receiving projections from primary motor representation of the hand is relatively small compared to the size of the MRS voxel. This reduces the sensitivity of MRS to the potential change in the concentration of neurochemicals. It was also not possible to separate glutamate and glutamine resonances at 3 T due to the high correlation coefficient between glutamine and glutamine, which is a limiting factor to interpret changes in Glx.
Conclusions
This study promotes TMS as an effective tool to induce dynamic changes in the concentrations of metabolites, which makes it possible to detect abnormalities in cases where baseline levels remain unaltered. The use of rTMS revealed altered dynamic GABA changes in dystonic patients, which may be better reflected by changes in the extrasynaptic than in the synaptic GABA component.
Acknowledgments
Funding sources for study.
This work was supported by l’Agence Nationale de le Recherche (project ANR-07-NEURO – 023 – 01), by Assistance Publique – Hôpitaux de Paris (P060502), the Lilly Institute and the Institut Fédératif de Recherche 49 – IFR 49, CEA, NeuroSpin, 91191 Gif-sur-Yvette, France and Assistance Publique – Hôpitaux de Paris (P060502). The research was also supported by the French dystonia foundations (AMADYS and alliance France Dystonie).
Patients were recruited via the French INSERM dystonia network. We thank patient’s associations (Alliance France Dystonie and AMADYS) for their support.
Abbreviations
- FDI
first dorsal interosseous
- GABA
γ-aminobutyric acid
- Glx
glutamate + glutamine
- MC
motor cortex
- MRI
magnetic resonance imaging
- MRS
magnetic resonance spectroscopy
- NAA
N-acetylaspartate
- RMT
resting motor threshold
- rTMS
repetitive transcranial magnetic stimulation
- TMS
transcranial magnetic stimulation
Footnotes
Financial disclosure/Conflict of interest
None of the authors reported biomedical financial interest or potential conflict of interest.
Author’s role
Research project
Conception: S Meunier, M Marjańska, S Lehéricy,
Organization: S Meunier, M Vidailhet, C Gallea
Execution: recruitment and clinical testing: C Bonnet, D Grabli; MRS acquisitions and analysis: M Marjańska, R Valabregue, EJ Auerbach, Y Worbe, C Gallea; TMS procedures: T Popa, S Meunier, M Russo
Statistical analysis
Design, execution: M Coudert;
Review and critique: L Y Cherif
Manuscript
Writing of the first draft: S Meunier
Writing of the revised version: M Marjańska, S Meunier
Review and critique: S Lehéricy, M Vidailhet
Full financial disclosure of all authors for the past year
M Marjańska and EJ Auerbach acknowledge support by Biotechnology Research Center (BTRC) grant P41 RR008079 (NCRR) and P41 EB015894 (NIBIB) and NCC P30 NS057091.
S Lehéricy acknowledges support from Agence Nationale de le Recherche (project ANR-07-NEURO – 023 – 01) and the Institut Fédératif de Recherche 49 – IFR 49, CEA, NeuroSpin, 91191 Gif-sur-Yvette, France and Assistance Publique – Hôpitaux de Paris (P060502).
R Valabregue is employed by INSERM.
T Popa is employed by INSERM. He received a grant from the “Fondation Motrice”.
Y Worbe acknowledges support from Agence Nationale de le Recherche (project ANR-07-NEURO – 023 – 01), she received a grant from FYSSEN Fondation for postdoctoral research (University of Cambridge).
M Russo received a PHD grant from the University of Messina-Italy.
D Grabli serves as consultant for Lundbeck-Teva, is employed by Assistance Publique Hôpitaux de Paris (APHP) and Institut National de la Santé et de la recherche Médicale (INSERM), received lecture fees from Lundbeck, Teva, Novartis and Boeringher-Ingelheim; travel grants from Novartis and Abott Products, received grants from Direction Générale de l’Organisation des soins (DGOS), Institut National de la Santé et de la Recherche Médicale (INSERM), MJ Fox Fundation for Parkinson Research and French association for Essential Tremor (APTES).
M Vidailhet received travel expenses from ENS; EFNS, MDS, DRMF. She received Research supports from French national founding for clinical research: grants from ANR, DHOS-INSERM and patient’s associations: French dystonia foundation (AMADYS and alliance France Dystonie); essential tremor foundation (CERTRE). She served as Scientific advisory board for Novartis, Boehringer. She acknowledges support by “Contrat d’interface” INSERM/Assistance Publique Hôpitaux de Paris.
C Bonnet is supported by the Czech Ministry of Education, research project
MSM0021620849, Grantove agentury UK 441611 Charles University in Prague and IGA MZ ÈR NT/12288-5/2011.
C Gallea is employed by Paris VI University. She received a grant from Fondation Recherche Médicale (FRM).
M Coudert, LY Cherif have nothing to declare.
S Meunier is employed by INSERM, she received a grant from the “Dystonia medical Research foundation” (DMRF), she acknowledges support by “Contrat d’interface” INSERM/Assistance Publique Hôpitaux de Paris.
References
- 1.Ridding MC, Sheean G, Rothwell JC, Inzelberg R, Kujirai T. Changes in the balance between motor cortical excitation and inhibition in focal, task specific dystonia. J Neurol Neurosurg Psychiatry. 1995;59:493–498. doi: 10.1136/jnnp.59.5.493. [DOI] [PMC free article] [PubMed] [Google Scholar]
- 2.Edwards MJ, Huang YZ, Wood NW, Rothwell JC, Bhatia KP. Different patterns of electrophysiological deficits in manifesting and non-manifesting carriers of the DYT1 gene mutation. Brain. 2003;126:2074–2080. doi: 10.1093/brain/awg209. [DOI] [PubMed] [Google Scholar]
- 3.Hornykiewicz O, Kish SJ, Becker LE, Farley I, Shannak K. Brain neurotransmitters in dystonia musculorum deformans. New Engl J Med. 1986;315:347–353. doi: 10.1056/NEJM198608073150602. [DOI] [PubMed] [Google Scholar]
- 4.de Yebenes JG, Vazquez A, Martinez A, et al. Biochemical findings in symptomatic dystonias. Adv Neurol. 1988;50:167–175. [PubMed] [Google Scholar]
- 5.Mescher M, Merkle H, Kirsch J, Garwood M, Gruetter R. Simultaneous in vivo spectral editing and water suppression. NMR Biomed. 1998;11:266–272. doi: 10.1002/(sici)1099-1492(199810)11:6<266::aid-nbm530>3.0.co;2-j. [DOI] [PubMed] [Google Scholar]
- 6.Levy LM, Hallett M. Impaired brain GABA in focal dystonia. Ann Neurol. 2002;51:93–101. [PubMed] [Google Scholar]
- 7.Herath P, Gallea C, van der Veen JW, Horovitz SG, Hallett M. In vivo neurochemistry of primary focal hand dystonia: a magnetic resonance spectroscopic neurometabolite profiling study at 3T. Mov Disord. 2010;25:2800–2808. doi: 10.1002/mds.23306. [DOI] [PMC free article] [PubMed] [Google Scholar]
- 8.Michael N, Gösling M, Reutemann M, et al. Metabolic changes after repetitive transcranial magnetic stimulation (rTMS) of the left prefrontal cortex: a sham-controlled proton magnetic resonance spectroscopy (1H MRS) study of healthy brain. Eur J Neurosci. 2003;17:2462–2468. doi: 10.1046/j.1460-9568.2003.02683.x. [DOI] [PubMed] [Google Scholar]
- 9.Luborzewski A, Schubert F, Seifert F, et al. Metabolic alterations in the dorsolateral prefrontal cortex after treatment with high-frequency repetitive transcranial magnetic stimulation in patients with unipolar major depression. J Psychiatr Res. 2007;41:606–615. doi: 10.1016/j.jpsychires.2006.02.003. [DOI] [PubMed] [Google Scholar]
- 10.Clark VP, Coffman BA, Trumbo MC, Gasparovic C. Transcranial direct current stimulation (tDCS) produces localized and specific alterations in neurochemistry: a 1H magnetic resonance spectroscopy study. Neurosci Lett. 2011;500:67–71. doi: 10.1016/j.neulet.2011.05.244. [DOI] [PubMed] [Google Scholar]
- 11.Fregni F, Potvin K, Dasilva D, et al. Clinical effects and brain metabolic correlates in non-invasive cortical neuromodulation for visceral pain. Eur J Pain. 2011;15:53–60. doi: 10.1016/j.ejpain.2010.08.002. [DOI] [PMC free article] [PubMed] [Google Scholar]
- 12.Stagg CJ, Wylezinska M, Matthews PM, et al. Neurochemical effects of theta burst stimulation as assessed by magnetic resonance spectroscopy. J Neurophysiol. 2009;101:2872–2877. doi: 10.1152/jn.91060.2008. [DOI] [PMC free article] [PubMed] [Google Scholar]
- 13.Stagg CJ, Best JG, Stephenson MC, et al. Polarity-sensitive modulation of cortical neurotransmitters by transcranial stimulation. J Neurosci. 2009;29:5202–5206. doi: 10.1523/JNEUROSCI.4432-08.2009. [DOI] [PMC free article] [PubMed] [Google Scholar]
- 14.Petroff OA. GABA and glutamate in the human brain. Neuroscientist. 2002;8:562–73. doi: 10.1177/1073858402238515. [DOI] [PubMed] [Google Scholar]
- 15.Moffett JR, Ross B, Arun P, Madhavarao CN, Namboodiri AM. N-Acetylaspartate in the CNS: from neurodiagnostics to neurobiology. Prog Neurobiol. 2007;81:89–131. doi: 10.1016/j.pneurobio.2006.12.003. [DOI] [PMC free article] [PubMed] [Google Scholar]
- 16.Gilio F, Suppa A, Bologna M, Lorenzano C, Fabbrini G, Berardelli A. Short-term cortical plasticity in patients with dystonia: a study with repetitive transcranial magnetic stimulation. Mov Disord. 2007;22:1436–43. doi: 10.1002/mds.21465. [DOI] [PubMed] [Google Scholar]
- 17.Mescher M, Tannus A, Johnson MO, Garwood M. Solvent suppression using selective echo dephasing. J Magn Reson. 1996;123:226–229. [Google Scholar]
- 18.Tkac I, Starcuk Z, Choi IY, Gruetter R. In vivo1H NMR spectroscopy of rat brain at 1 ms echo time. Magn Reson Med. 1999;41:649–656. doi: 10.1002/(sici)1522-2594(199904)41:4<649::aid-mrm2>3.0.co;2-g. [DOI] [PubMed] [Google Scholar]
- 19.Gruetter R, Tkac I. Field mapping without reference scan using asymmetric echo-planar techniques. Magn Reson Med. 2000;43:319–323. doi: 10.1002/(sici)1522-2594(200002)43:2<319::aid-mrm22>3.0.co;2-1. [DOI] [PubMed] [Google Scholar]
- 20.Yousry TA, Schmid UD, Alkadhi H, et al. Localization of the motor hand area to a knob on the precentral gyrus. A new landmark Brain. 1997;120:141–157. doi: 10.1093/brain/120.1.141. [DOI] [PubMed] [Google Scholar]
- 21.Quartarone A, Bagnato S, Rizzo V, et al. Distinct changes in cortical and spinal excitability following high-frequency repetitive TMS to the human motor cortex. Exp Brain Res. 2005;161:114–124. doi: 10.1007/s00221-004-2052-5. [DOI] [PubMed] [Google Scholar]
- 22.Provencher SW. Estimation of metabolite concentrations from localized in vivo proton NMR spectra. Magn Reson Med. 1993;30:672–679. doi: 10.1002/mrm.1910300604. [DOI] [PubMed] [Google Scholar]
- 23.Provencher SW. Automatic quantitation of localized in vivo 1H spectra with LCModel. NMR Biomed. 2001;14:260–264. doi: 10.1002/nbm.698. [DOI] [PubMed] [Google Scholar]
- 24.Gasparovic C, Song T, Devier D, et al. Use of tissue water as a concentration reference for proton spectroscopic imaging. Magn Reson Med. 2006;55:1219–1226. doi: 10.1002/mrm.20901. [DOI] [PubMed] [Google Scholar]
- 25.Träber F, Block W, Lamerichs R, Gieseke J, Schild HH. 1H metabolite relaxation times at 3. 0 tesla: Measurements of T1 and T2 values in normal brain and determination of regional differences in transverse relaxation. J Magn Reson Imaging. 2004;19:537–545. doi: 10.1002/jmri.20053. [DOI] [PubMed] [Google Scholar]
- 26.Littell RC, Milliken GA, Stroup WW, Wolfinger RD, Schabenberge O. 2. SAS for Mixed Models. Cary, NC: SAS Institute Inc; 2006. [Google Scholar]
- 27.Garibotto V, Romito LM, Elia AE, Soliveri P, Panzacchi A, Carpinelli A, Tinazzi M, Albanese A, Perani D. In vivo evidence for GABA(A) receptor changes in the sensorimotor system in primary dystonia. Mov Disord. 2011;26:852–827. doi: 10.1002/mds.23553. [DOI] [PubMed] [Google Scholar]
- 28.Patel AB, de Graaf RA, Mason GF, Rothman DL, Shulman RG, Behar KL. The contribution of GABA to glutamate/glutamine cycling and energy metabolism in the rat cortex in vivo. Proc Natl Acad Sci USA. 2005;102:5588–5593. doi: 10.1073/pnas.0501703102. [DOI] [PMC free article] [PubMed] [Google Scholar]
- 29.Tegenthoff M, Ragert P, Pleger B, Schwenkreis P, Förster AF, Nicolas V, Dinse HR. Improvement of tactile discrimination performance and enlargement of cortical somatosensory maps after 5 Hz rTMS. PLoS Biol. 2005;3:e362.11, 2031–2040. doi: 10.1371/journal.pbio.0030362. [DOI] [PMC free article] [PubMed] [Google Scholar]
- 30.Rounis E, Lee L, Siebner HR, et al. Frequency specific changes in regional cerebral blood flow and motor system connectivity following rTMS to the primary motor cortex. NeuroImage. 2005;26:164–176. doi: 10.1016/j.neuroimage.2005.01.037. [DOI] [PubMed] [Google Scholar]
- 31.Semyanov A, Walker MC, Kullmann DM, Silver RA. Tonically active GABA A receptors: modulating gain and maintaining the tone. Trends Neurosci. 2004;27:262–9. doi: 10.1016/j.tins.2004.03.005. [DOI] [PubMed] [Google Scholar]
- 32.Fitzgerald PB, Fountain S, Daskalakis ZJ. A comprehensive review of the effects of rTMS on motor cortical excitability and inhibition. Clin Neurophysiol. 2006;117:2584–96. doi: 10.1016/j.clinph.2006.06.712. [DOI] [PubMed] [Google Scholar]
- 33.Stagg CJ, Bestmann S, Constantinescu AO, Moreno LM, Allman C, Mekle R, Woolrich M, Near J, Johansen-Berg H, Rothwell JC. Relationship between physiological measures of excitability and levels of glutamate and GABA in the human motor cortex. J Physiol. 2011;589:5845–55. doi: 10.1113/jphysiol.2011.216978. [DOI] [PMC free article] [PubMed] [Google Scholar]
- 34.Kullmann DM, Ruiz A, Rusakov DM, Scott R, Semyanov A, Walker MC. Presynaptic, extrasynaptic and axonal GABAA receptors in the CNS: where and why? Progress in biophysics and molecular biology. 2005;87:33–46. doi: 10.1016/j.pbiomolbio.2004.06.003. [DOI] [PMC free article] [PubMed] [Google Scholar]
- 35.Quartarone A, Bagnato S, Rizzo V, Siebner HR, Dattola V, Scalfari A, Morgante F, Battaglia F, Romano M, Girlanda P. Abnormal associative plasticity of the human motor cortex in writer’s cramp. Brain. 2003;126:2586–2596. doi: 10.1093/brain/awg273. [DOI] [PubMed] [Google Scholar]
- 36.Martin LJ, Zurek AA, MacDonald JF, Roder JC, Jackson MF, Orser BA. α5GABAA receptor activity sets the threshold for long-term potentiation and constrains hippocampus-dependent memory. J Neurosci. 2010;30:5269–5282. doi: 10.1523/JNEUROSCI.4209-09.2010. [DOI] [PMC free article] [PubMed] [Google Scholar]
- 37.Arima-Yoshida F, Watabe AM, Manabe T. The mechanisms of the strong inhibitory modulation of long-term potentiation in the rat dentate gyrus. Eur J Neurosci. 2011;33:1637–46. doi: 10.1111/j.1460-9568.2011.07657.x. [DOI] [PubMed] [Google Scholar]
- 38.Castro-Alamancos MA, Donoghue JP, Connors BW. Different forms of synaptic plasticity in somatosensory and motor areas of the neocortex. J Neurosci. 1995;15:5324–5333. doi: 10.1523/JNEUROSCI.15-07-05324.1995. [DOI] [PMC free article] [PubMed] [Google Scholar]
- 39.Ziemann U, Hallett M, Cohen LG. Mechanisms of deafferentation-induced plasticity in human motor cortex. J Neurosci. 1998;18:7000–7. doi: 10.1523/JNEUROSCI.18-17-07000.1998. [DOI] [PMC free article] [PubMed] [Google Scholar]
- 40.Peinemann A, Reimer B, Löer C, et al. Long-lasting increase in corticospinal excitability after 1800 pulses of subthreshold 5 Hz repetitive TMS to the primary motor cortex. Clin Neurophysiol. 2004;115:1519–1526. doi: 10.1016/j.clinph.2004.02.005. [DOI] [PubMed] [Google Scholar]
- 41.Mangia S, Tkác I, Gruetter R, Van de Moortele PF, Maraviglia B, Uğurbil K. Sustained neuronal activation raises oxidative metabolism to a new steady-state level: evidence from 1H NMR spectroscopy in the human visual cortex. J Cereb Blood Flow Metab. 2007;27:1055–1063. doi: 10.1038/sj.jcbfm.9600401. [DOI] [PubMed] [Google Scholar]
- 42.Strafella AP, Paus T. Cerebral blood-flow changes induced by paired-pulse transcranial magnetic stimulation of the primary motor cortex. J Neurophysiol. 2001;85:2624–2629. doi: 10.1152/jn.2001.85.6.2624. [DOI] [PubMed] [Google Scholar]
- 43.Baslow MH, Hrabe J, Guilfoyle DN. Dynamic relationship between neurostimulation and N-acetylaspartate metabolism in the human visual cortex: evidence that NAA functions as a molecular water pump during visual stimulation. J Mol Neurosci. 2007;32:235–245. doi: 10.1007/s12031-007-0049-9. [DOI] [PubMed] [Google Scholar]
- 44.Pouwels PJ, Frahm J. Regional metabolite concentrations in human brain as determined by quantitative localized proton MRS. Magn Reson Med. 1998;39:53–60. doi: 10.1002/mrm.1910390110. [DOI] [PubMed] [Google Scholar]
- 45.Kloppel S, Mangin JF, Vongerichten A, Frackowiak RS, Siebner HR. Nurture versus nature: long-term impact of forced right-handedness on structure of pericentral cortex and basal ganglia. J Neurosci. 2010;30:3271–3275. doi: 10.1523/JNEUROSCI.4394-09.2010. [DOI] [PMC free article] [PubMed] [Google Scholar]
- 46.Iturria-Medina Y, Pérez Fernández A, Morris DM, et al. Brain hemispheric structural efficiency and interconnectivity rightward asymmetry in human and nonhuman primates. Cereb Cortex. 2011;21:56–67. doi: 10.1093/cercor/bhq058. [DOI] [PubMed] [Google Scholar]
- 47.Woolley DG, Wenderoth N, Heuninckx S, Zhang X, Callaert D, Swinnen SP. Visual guidance modulates hemispheric asymmetries during an interlimb coordination task. Neuroimage. 2010;50:1566–1577. doi: 10.1016/j.neuroimage.2010.01.012. [DOI] [PubMed] [Google Scholar]