

Abstract
Myeloid leukemias are highly diverse diseases and have been shown to be associated with microRNA (miRNA) expression aberrations. The present study involved an in-depth miRNome analysis of two human acute myeloid leukemia (AML) cell lines, HL-60 and THP-1, and one human chronic myeloid leukemia (CML) cell line, K562, via massively parallel signature sequencing. mRNA expression profiles of these cell lines that were established previously in our lab facilitated an integrative analysis of miRNA and mRNA expression patterns. miRNA expression profiling followed by differential expression analysis and target prediction suggested numerous miRNA signatures in AML and CML cell lines. Some miRNAs may act as either tumor suppressors or oncomiRs in AML and CML by targeting key genes in AML and CML pathways. Expression patterns of cell type-specific miRNAs could partially reflect the characteristics of K562, HL-60 and THP-1 cell lines, such as actin filament-based processes, responsiveness to stimulus and phagocytic activity. miRNAs may also regulate myeloid differentiation, since they usually suppress differentiation regulators. Our study provides a resource to further investigate the employment of miRNAs in human leukemia subtyping, leukemogenesis and myeloid development. In addition, the distinctive miRNA signatures may be potential candidates for the clinical diagnosis, prognosis and treatment of myeloid leukemias.
Keywords: miRNA profiling, Acute myeloid leukemia, Chronic myeloid leukemia, Myeloid differentiation
Introduction
Myeloid development is an important component of hematopoiesis, which involves a step-wise progression characterized by sequential regulator expression [1]. Mutation or dysregulation of those regulators may result in a failure to induce differentiation during myeloid development, thereby leading to myeloid leukemias. Myeloid leukemias, including acute myeloid leukemia (AML) and chronic myeloid leukemia (CML), are clonal bone marrow diseases characterized by the pathological proliferation of abnormal white blood cells. A large number of studies have addressed myeloid leukemia classification, diagnosis, pathogenesis and therapy, and have investigated chromosomal abnormalities, gene mutations and epigenetic alterations such as DNA methylation and histone modifications [2]. Leukemia cell lines, such as the CML cell line K562 [3], the acute promyelocytic leukemia (APL) cell line HL-60 [4] and the acute monocytic leukemia (AMoL) cell line THP-1 [5], have been widely used in AML and CML studies, owing to their distinct genetic backgrounds, abundant epigenetic data available and readily-identifiable biological functions.
The past decade witnessed an explosion of knowledge regarding microRNAs (miRNAs) and their roles in both normal physiological and disease contexts. miRNAs are small non-coding RNAs 19–25 nucleotides in length, which can inhibit the translation or induce the degradation of mRNA, usually by binding to the 3′-untranslated regions (UTRs) of target mRNAs [6]. Since their initial observation, 1871 precursors and 2794 mature human miRNAs have been registered in miRBase (GRCh37.p5, v20) [7]. miRNA expression profiling is gaining popularity because miRNA signatures have been associated with the diagnosis and prognosis of diseases such as leukemias [8,9]. Notably, stable miRNAs have been reproducibly identified in serum or plasma, and the unique expression patterns of serum or plasma miRNAs can be used as biomarkers for various diseases [10,11]. miRNAs have been profiled using real-time quantitative PCR (RT-qPCR), high-throughput microarray and sequencing technologies [12]. Given its increasing availability and decreasing costs, high-throughput sequencing has emerged as an attractive approach for global miRNA analysis that provides advantages over the other two aforementioned technologies. These include a high accuracy in distinguishing miRNAs with very similar sequences and isomiRs, a high sensitivity for detecting novel low-abundance miRNAs, and a wide expression range for analyzing the expression of all annotated miRNAs [13,14].
Accumulating evidence indicates that miRNAs play crucial roles in myeloid development and leukemogenesis. For example, the hematopoietic lineage-specific miR-223 enhances retinoic acid-induced granulocyte differentiation by targeting NFIA encoding nuclear factor I/A [15] but inhibits erythroid differentiation by downregulating LMO2 encoding LIM domain only 2 [16]. In addition, the miR-17-92 cluster has been characterized as an oncomiR in B-cell lymphomas [17]. Conversely, miR-29b was shown to function as a tumor suppressor in AML by targeting several DNA methyltransferases, and the ectopic expression of miR-29b was shown to induce the re-expression of tumor suppressor genes [18]. Large-scale miRNA expression profiling has been used to analyze the roles of miRNAs in the context of imatinib treatment of CML [19] or the distinction between cytogenetic and molecular AML subtypes [20,21]. We previously examined K562, HL-60 and THP-1 cell lines using mRNA transcriptomic analysis and revealed the differences in pathways between CML and AML, the unique functional characteristics of myeloid cells and the distinct gene expression patterns throughout myeloid development [22]. In this study, deep sequencing was used to distinguish AMLs and CMLs by comparing the miRNomes between the AML lines HL-60 and THP-1 and the CML line K562 and to elucidate the differences in miRNA expression at various differentiation stages. We also revealed functional miRNAs that either targeted AML and CML pathways, induced unique functional characteristics in myeloid cells or regulated myeloid development. The miRNA signatures identified in our study provide a resource for clinical applications of miRNAs in the context of myeloid leukemias.
Results
Small RNA expression profiling in myeloid leukemia cell lines
We applied massively parallel sequencing for an in-depth analysis of the miRNomes of three myeloid leukemia cell lines including K562 (CML), HL-60 (APL) and THP-1 (AMoL). Small RNA (sRNA) fractions isolated from each sample were size-selected using electrophoresis and sequenced on the Illumina GA IIx platform. The generated sRNA sequencing data were then analyzed using the deep-sequencing sRNA analysis pipeline (DSAP) web server [23]. As shown in Table 1, 22–26 million high-quality raw reads were generated from the three samples, and the reliability of each sample exceeded 99.8%. The miRNA reads represented approximately 54% and 58% of the total reads in HL-60 and THP-1, respectively, suggesting that miRNAs are the predominant sRNA species in these cell lines. However, only approximately 14% of the total reads in K562 were derived from miRNAs, a finding that was also noted in a previous study [24]. Further, 474, 455 and 413 miRNAs in K562, HL-60 and THP-1 cell lines were matched in miRBase (Version 16 on the DSAP server), respectively. A total of 621 known miRNAs were detected in at least one of the three sequenced samples.
Table 1.
Small RNA transcriptome mapping summary
| K562 | HL-60 | THP-1 | |
|---|---|---|---|
| No. of total reads | 26,035,998 | 25,923,770 | 22,060,786 |
| Percentage of reliable reads (%) | 99.88 | 99.86 | 99.99 |
| No. of total reads matched to Rfam | 12,205,116 | 3,578,408 | 1,436,685 |
| No. of matched crank in Rfam | 799 | 685 | 552 |
| No. of total reads matched to miRBase | 2,696,327 | 9,767,200 | 8,609,820 |
| Percentage of total reads matched to miRBase (%)∗ | 14.09 | 53.82 | 57.85 |
| No. of matched miRNAs in miRBase | 474 | 455 | 413 |
| No. of matched miRNAs in miRBase (CF ⩾ 0.1%) | 238 | 197 | 160 |
| No. of predicted novel miRNAs | 409 | 894 | 1159 |
| No. of novel miRNAs (Expr. ⩾ 100) | 78 | 76 | 75 |
Note: Rfam is a transcribed sequence library of non-coding RNAs and the version 9.1 was used; miRBase is a miRNA sequence database and version 16 was used. ‘∗’ indicates the proportion of total reads of known miRNAs in that of total small RNAs. CF stands for clone frequency and Expr indicates the expression value of miRNAs generated from miRDeep∗.
miRNA expression patterns
The absolute read counts were transformed into transcript abundances by normalizing the read counts of each miRNA using the cloning frequency (CF) in each library [14]. To test the reliability of miRNA sequencing, we compared the CF values from sequencing with the expression intensities obtained from the RT-qPCR analysis of 7 different miRNAs including let-7i, miR-10a, miR-143, miR-148a, miR-16, miR-17 and miR-181a. Our results showed that the two sets of miRNA expression agreed with each other well (Figure 1A; R2 = 0.6579, P = 8.7 × 10⁻⁷), thus suggesting that the CF can be used as an abundance indicator. In addition, the results also confirmed the integrity and relevance of the samples used in this study.
Figure 1.
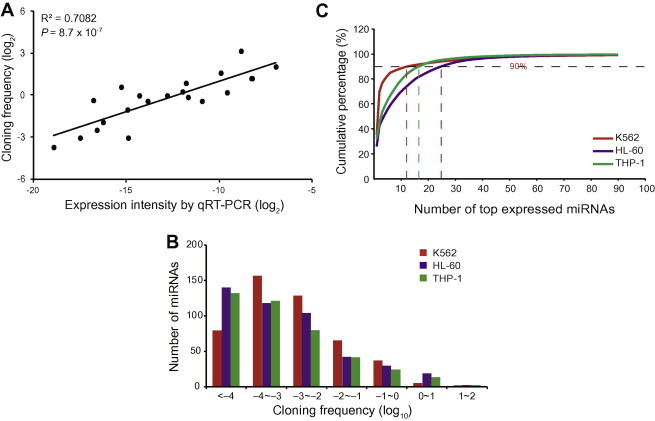
miRNA expression patterns in the three cell lines A. Correlation between RT-qPCR and small RNA-seq (sRNA-seq) for selected miRNAs in HL-60, K562 and THP1 cells lines. The selected miRNAs include hsa-let-7i, hsa-miR-10a, hsa-miR-143, hsa-miR-148a, hsa-miR-16, hsa-miR-17 and hsa-miR-181a. The X-axis and Y-axis represents the log transformed average of 2−ΔCt and the log transformed cloning frequency (CF), respectively. B. The distribution of miRNA expression levels with respect to the number of miRNAs. C. Cumulative miRNA expression percentages.
A wide range of expression (CF values 0.00001–35) was observed in the sequencing data (Figure 1B). The majority of the miRNAs were expressed at low levels; approximately 16%–32% of the miRNAs in each sample exhibited a low abundance (CF < 0.0001). However, expression of a few miRNAs accounted for the majority of the total expression. For example, expression of 12 highly-expressed miRNAs accounted for 90% of the total expression in K562, whereas 90% of the total expression in HL-60 and THP-1 was attributed to the expression of 25 and 17 highly-expressed miRNAs, respectively (Figure 1C). Overall, 33 miRNAs were highly expressed in at least one of the three leukemia cell lines (Table S1). Among them, miR-191 and miR-25 were highly expressed in all three cell lines and their expression was upregulated relative to that in normal cells [24]. These data indicated that these miRNAs may share a common role in leukemogenesis or leukemic progression. miR-191 and miR-25 displayed elevated expression and functioned as oncogenes in AML and several solid cancers [8,20,24–27]. Eight miRNAs, including miR-486-5p, miR-146b-5p, miR-127-3p, miR-20a, miR-21∗, miR-10a, miR-22 and miR-30e, were highly expressed only in K562, whereas 6 members of the let-7 family (let-7f, let-7a, let-7g, let-7d, let-7b and let-7i) and 9 other miRNAs (miR-103-as, miR-222, miR-181a, miR-221, miR-320a, miR-140-3p, miR-185, miR-423-5p and miR-29a) were highly expressed in both AML cell lines. Besides miR-185 and miR-29a in HL-60, the remaining 13 miRNAs that were highly expressed in both AML cell lines had also been previously reported as high-abundance miRNAs in HL-60 and THP-1 [20]. Interestingly, 18 of the high-abundance miRNAs in the AML lines were identified in the AML miRNA network [28].
Since numerous low-abundance miRNAs were observed in these samples, we decided to primarily focus on miRNAs with CFs of >0.1%. Using this cutoff, >99.9% of all miRNA reads from each sample were included for a further analysis. A total of 307 miRNAs had a CF of >0.1% in at least one cell line, of which 238, 197 and 160 miRNAs were expressed in K562, HL-60 and THP-1, respectively (Figure 2).
Figure 2.
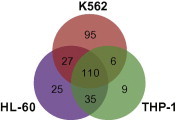
Distribution of miRNAs expressed (CF ⩾ 0.1%) in the three cell lines The overlapping regions show the numbers of miRNAs expressed in two or three cell lines.
The identification of novel miRNAs is a unique advantage of high-throughput sequencing. We predicted novel miRNAs using miRDeep∗, an improved miRDeep pipeline [29]. A total of 409, 894 and 1159 novel miRNAs were predicted in the three samples, of which only 19.1% (K562), 8.5% (HL-60) and 6.5% (THP-1) had expression levels >0.001. Notably, several novel miRNAs were predicted with a high level of confidence (miRDeep∗ score of >10) in the three cell lines (Table 2), some of which were highly expressed and may be potential candidates for future analyses. These results suggest that high-throughput sRNA sequencing is a good approach for the detection of low-abundance miRNAs and novel miRNAs due to the wide detection range.
Table 2.
Novel miRNAs with miRDeep∗ score >10 in all three myeloid leukemia cell lines
| Cell line | Score | Expression of miRNA | Locus of miRNA | Sequence of miRNA |
|---|---|---|---|---|
| K562 | 2739.64 | 2819 | Chr12: 104519004–104519108 (+) | AUACCACCCUGAACGCGCCCGAU |
| 2640.97 | 2819 | Chr6: 165823048–165823145 (+) | AUACCACCCUGAACGCGCCCGAU | |
| 65.81 | 119 | Chr2: 155088243–155088322 (+) | AAAAACUGUGAUUACUUUUGCA | |
| 65.63 | 119 | Chr1: 174317410–174317489 (+) | AAAAACUGUGAUUACUUUUGCA | |
| 65.09 | 119 | Chr12: 105721687–105721766 (+) | AAAAACUGUGAUUACUUUUGCA | |
| 26.82 | 193 | Chr6: 38533746–38533837 (+) | UUCUCACUACUGCACUUGACUA | |
| HL-60 | 9118.02 | 1,8023 | Chr6: 38533747–38533838 (+) | UUCUCACUACUGCACUUGACUA |
| 286.2 | 275 | Chr3: 150905876–150905984 (+) | GUCUACGGCCAUACCACCCUGAA | |
| 257.36 | 275 | Chr10: 327963–328075 (–) | GUCUACGGCCAUACCACCCUGAA | |
| 184.65 | 273 | Chr8: 32114002–32114095 (+) | GUCUACGGCCAUACCACCCUGAA | |
| 91.16 | 152 | Chr16: 24214459–24214541 (+) | CUGCAGACUCGACCUCCCAGGC | |
| THP-1 | 979.41 | 1863 | Chr6: 106902693–106902809 (+) | CUCCCACUGCUUCACUUGACUA |
Note: Score was generated using miRDeep∗, which indicates the confidence of the novel miRNA prediction.
Distinctive miRNA signatures in myeloid cells
A total of 110 miRNAs were expressed in all three cell lines, whereas 95, 25 and 9 miRNAs were uniquely expressed in K562, HL-60 and THP-1, respectively (Figure 2). We initially analyzed these uniquely-expressed miRNAs to identify the cell type-related miRNAs.
The 95 K562-specific miRNAs included three highly-expressed miRNAs (miR-486-5p, miR-127-3p and miR-10a) in K562 as well as several erythropoiesis-related miRNAs such as miR-451, miR-144, miR-376a and miR-126/126∗ [30–33]. The putative target genes of these K562-specific miRNAs were predicted using miRecords [34] and filtered to only include mRNAs upregulated in both HL-60 and THP-1 according to our previous mRNA-seq data [22]. Functional enrichment analysis revealed that the targets were significantly involved in leukocyte activation, actin filament-based processes and programmed cell death (see Figure S1A for the miRNAs and targets involved in these processes). miR-486-5p and miR-127-3p were expressed at extremely high levels in K562 cells. The former participated in leukocyte activation and programmed cell death by targeting FOXP1 encoding forkhead box P1 and UNC5C encoding unc-5 homolog C, and the latter functions to regulate genes involved in apoptosis.
Among the HL-60-specific miRNAs, the high expression of miR-124 and miR-326 had been previously confirmed in AML samples [35,36], and the targets of miR-124, miR-324-3p, miR-326 and miR-573 mainly participate in biological processes such as response to stimulus, regulation of endocytosis and regulation of cellular component biogenesis (Figure S1B). These functions are closely related to the phagocytic activity and response to chemotactic stimuli of HL-60 cells [37]. miR-124 may be a potential regulator of the endocytosis function of HL-60 acting through its validated target LDLRAP1 encoding low density lipoprotein receptor adaptor protein 1 [38] and putative target EPN2 encoding epsin 2. miR-503 has been experimentally validated to target CCND1 encoding cyclin D1 [39], which is involved in responses to inorganic substances. miR-573 targeted 5 genes, 4 of which are involved in responses to inorganic substances, suggesting its potential role as a regulator of HL-60 cell responsiveness.
THP-1-specific-miRNAs were expressed at low levels. The targets of four THP-1-specific miRNAs, miR-455, miR-219-5p, miR-449a and miR-455-5p, were enriched in the functions of mesodermal development, intracellular receptor-mediated signaling pathways, negative cell growth regulation and positive apoptosis regulation (Figure S1C). These four miRNAs were also responsible for the phagocytic activity of THP-1 cells [5]. In addition, monocytes have been reported to play important roles in development and homeostasis, partially by removing apoptotic cells and scavenging toxic compounds [40]. In particular, miR-219-5p and miR-449a may target 5–6 genes associated with these functions. In summary, these uniquely-expressed miRNAs are cell function-related and may reflect the unique characteristics of the corresponding cell lines.
Differentially-expressed miRNAs between CML and AML cell lines
The three representative cell lines were derived from patients with myeloid leukemia and thus can reflect clinical features of myeloid leukemia to some extent. To study the underlying patterns of miRNA expression and the relationship between the samples, we applied a hierarchical clustering method that incorporated all 307 miRNAs. This analysis showed that the expression patterns of HL-60 and THP-1 miRNAs were more similar to each other than to those of K562 miRNAs (Figure 3A), which may be attributed to the fact that K562 is a CML cell line whereas HL-60 and THP-1 are AML cell lines. We also analyzed the differentially-expressed miRNAs on the basis of statistical analyses and fold changes described in the Materials and methods section. A pair-wise comparison of miRNA expression revealed larger differences between K562 and HL-60 or THP-1 than between HL-60 and THP-1 (Figure 3B). Therefore, there is an evident difference in miRNA profiles between the CML cell line (K562) and the AML cell lines (HL-60 and THP-1).
Figure 3.
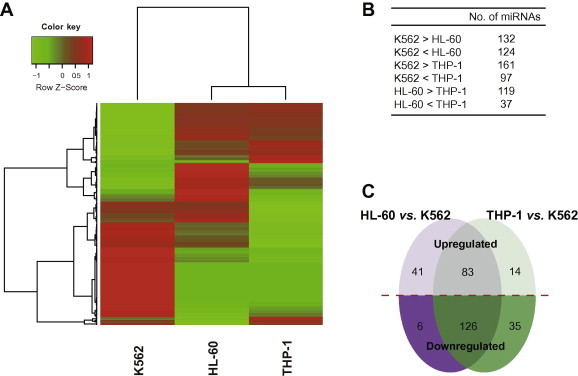
Differences in miRNA expression between acute and chronic myeloid leukemia cell lines A. Hierarchical clustering of miRNA expression profiles for myeloid leukemia cell lines. B. Pair-wise comparison of miRNA expression in the myeloid leukemia cell lines. C. Differences in miRNA expression between the chronic and acute myeloid leukemia cell lines. The numbers of differentially-expressed miRNAs in the HL-60 and THP-1 cell lines compared with the K562 cell line are shown.
Expression of 126 miRNAs including 93 K562-specific ones was upregulated in the CML line, whereas expression of 83 miRNAs was upregulated in both AML cell lines (Figure 3C). Previous studies have comprehensively shown the relevance of miRNAs with respect to cytogenetic alterations in AML cell lines [20,21]; therefore, we did not intend to address this topic in HL-60 and THP-1. CML is characterized by the Philadelphia chromosome (Ph) [3], which results from the reciprocal translocation of chromosomes 9 and 22 [t(9;22)(q34;q11)] and leads to the formation of the BCR-ABL1 oncoprotein [41]. During the blast crisis phase, CML is also associated with the expression of the AML-1/EVI-1 and NUP98/HOXA9 fusion proteins resulting from t(3;21)(q26;q22) and t(7;11)(p15;p15) translocations, respectively [3,42]. Notably, miR-126, which is mapped to 9q34, was uniquely expressed in K562 cells. Expression of the miR-301b-130b cluster transcribed from 22q11 and miR-148a and miR-196b transcribed from 7p15 was upregulated in K562 cells; in contrast, expression of miR-199b-3p transcribed from 9q34 and miR-185 transcribed from 22q11 was downregulated in K562 cells. The genomic locations and expression patterns of these miRNAs suggested their potential roles in CML.
In K562, the upregulated miRNAs included four members of the polycistronic miR-17-92 cluster that may be involved in CML pathogenesis [43]. miR-10a, miR-125, miR-151, miR-199a-5p, miR-96, miR-451, miR-183, miR-134, miR-126, miR-144 and miR-224 have been detected in CML patients [44,45]. In AML lines, the upregulated miRNAs included 6 members of the let-7 family, 3 miR-181s and 21 miRNAs that have been previously described in AML miRNA expression profiles or networks [28,35]. Pathway analysis (Table 3) revealed that the targets of upregulated miRNAs in K562 were enriched in processes upregulated in AML cells (enriched from upregulated genes in AML vs. CML), such as chemokine signaling pathway, adipocytokine signaling pathway, neurotrophin signaling pathway and acute myeloid leukemia pathway; conversely, the targets of the upregulated miRNAs in AML lines were enriched in CML-upregulated processes (enriched from upregulated genes in CML vs. AML), such as adherens junction, TGF-β signaling pathway, p53 signaling pathway. Most of these function-enriched miRNAs were also upregulated in HL-60 or K562 cells compared with normal cells [24]. Moreover, 6 let-7 family members were the most upregulated miRNAs in AML cell lines. Jak-STAT signaling pathway activation was reportedly upregulated in CML [22], and let-7 family members may act as tumor suppressors in CML by targeting the Jak-STAT signaling pathway and PIM oncogenes encoding proviral integration site to induce CML cell apoptosis. Expression of miR-337-3p, miR-625, miR-218, miR-27b and miR-411, which target oncogenes PML encoding promyelocytic leukemia, RARA encoding retinoic acid receptor, alpha and FLT3 encoding FMS-related tyrosine kinase 3, was downregulated in AML cell lines (Table 4 and Figure S2), suggesting that these may act as tumor suppressors in AML. However, these miRNAs could not inhibit leukemogenesis because of their downregulated expression levels in AML cells. miR-130b, miR-145, miR-19a, miR-20a, miR-301a and b, miR-370, miR-411, miR-454, miR-485-3p, miR-486-5p, miR-125b and miR-625 were upregulated in the CML line and may act as oncomiRs by suppressing CTBPs encoding C-terminal binding proteins and the tumor suppressors INK4α/ARF (CDKN2A) encoding cyclin-dependent kinase inhibitor 2A. miR-125b is a validated oncomiR that induces myeloid leukemias in mice, and its targets include ARF [58]. miR-625 may function similarly as miR-125b; however, few studies on its role in leukemia have been reported, given its relatively low expression in leukemia cell lines. miR-107, miR-128, miR-15a, miR-188-5p, miR-193a-3p, let-7a, let-7b, let-7d, let-7f, let-7g, let-7i, miR-339-5p, miR-29a, miR-29b and miR-29c may suppress CML via CRKL encoding v-crk avian sarcoma virus CT10 oncogene homolog-like, BCL2L1 encoding BCL2-like 1 and MDM2 encoding murine double minute 2 (Table 4 and Figure S2). Our previous transcriptome analysis demonstrated that activity of the PI3K/Akt signaling pathway was upregulated in AML [22]. In addition, PIK3CD encoding phosphatidylinositol-4,5-bisphosphate 3-kinase, catalytic subunit delta was suppressed by miR-199a-5p, miR-30a [59] and miR-30e in our study. The expression patterns of PIK3CD and MDM2 were validated via RT-qPCR, which demonstrated expression of these genes corresponded well with that of the targeting miRNAs (Figure S3). In summary, these differentially-expressed miRNAs were leukemia-related and could be used as references for distinguishing AML and CML.
Table 3.
Pathway analysis of miRNAs up-regulated in CML or AML
| Pathway | No. | P value | |
|---|---|---|---|
| Targets of CML up-regulated miRNAs | Adipocytokine signaling pathway | 11 | 0.000591 |
| Chemokine signaling pathway | 19 | 0.00127 | |
| Neurotrophin signaling pathway | 14 | 0.002837 | |
| Notch signaling pathway | 8 | 0.003989 | |
| Pathways in cancer | 25 | 0.008548 | |
| Axon guidance | 13 | 0.010503 | |
| Toll-like receptor signaling pathway | 11 | 0.012503 | |
| Acute myeloid leukemia | 8 | 0.012698 | |
| Apoptosis | 10 | 0.013341 | |
| Dorso-ventral axis formation | 5 | 0.022053 | |
| Regulation of actin cytoskeleton | 17 | 0.025238 | |
| Small cell lung cancer | 9 | 0.029938 | |
| PPAR signaling pathway | 8 | 0.030441 | |
| Leukocyte transendothelial migration | 11 | 0.033357 | |
| Pancreatic cancer | 8 | 0.037258 | |
| Chronic myeloid leukemia | 8 | 0.045012 | |
| B cell receptor signaling pathway | 8 | 0.045012 | |
| Adherens junction | 8 | 0.050719 | |
| Natural killer cell mediated cytotoxicity | 11 | 0.065819 | |
| Focal adhesion | 14 | 0.099884 | |
| Targets of AML up-regulated miRNAs | Adherens junction | 18 | 5.57E–06 |
| Pathways in cancer | 38 | 5.08E–04 | |
| TGF-beta signaling pathway | 15 | 0.001227 | |
| T cell receptor signaling pathway | 17 | 0.001405 | |
| Regulation of actin cytoskeleton | 25 | 0.00566 | |
| Colorectal cancer | 13 | 0.007274 | |
| Acute myeloid leukemia | 10 | 0.011324 | |
| Tight junction | 17 | 0.012104 | |
| Prostate cancer | 12 | 0.027433 | |
| p53 signaling pathway | 10 | 0.029809 | |
| SNARE interactions in vesicular transport | 7 | 0.033378 | |
| Wnt signaling pathway | 17 | 0.033709 | |
| Melanoma | 10 | 0.038073 | |
| Pancreatic cancer | 10 | 0.041144 | |
| Endometrial cancer | 8 | 0.04834 | |
| Bladder cancer | 7 | 0.051188 | |
| VEGF signaling pathway | 10 | 0.051347 | |
| Chronic myeloid leukemia | 10 | 0.051347 | |
| ErbB signaling pathway | 11 | 0.052902 | |
| Cell cycle | 14 | 0.059231 | |
| Renal cell carcinoma | 9 | 0.080632 | |
| MAPK signaling pathway | 24 | 0.094287 | |
Table 4.
Functional annotation of miRNAs in acute and chronic myeloid leukemia pathways
| Pathway | Target gene | miRNA |
|---|---|---|
| Acute myeloid leukemia | KRAS | let-7a, miR-155, miR-181a, b, d, miR-193a-3p |
| LEF1 | miR-193a-3p | |
| MAPK1 | miR-106b, miR-140-3p, miR-181a, b, d, miR-320a, miR-330-3p | |
| NRAS | let-7a, b, d, f, g, i | |
| PIM1 | let-7d, miR-107, miR-15a, miR-24, miR-331-3p, miR-33a, b | |
| PIM2 | miR-24, miR-339-5p | |
| STAT3 | let-7a, b, d, f, g, i, miR-106b | |
| STAT5A | miR-222 [46] | |
| STAT5B | let-7i, miR-23a | |
| TCF7 | miR-193a-3p, miR-24 | |
| CCNA1 | miR-30a, e | |
| FLT3 | miR-411 | |
| PML | miR-337-3p, miR-625 | |
| RARA | miR-218, miR-27b, miR-625 | |
| Chronic myeloid leukemia | AKT3 | miR-125a-5p, miR-125b, miR-195, miR-20a, miR-22 |
| CDKN2A | miR-10b [47], miR-125b [48], miR-625 | |
| CTBP1 | miR-485-3p | |
| CTBP2 | miR-486-5p | |
| IKBKB | miR-195, miR-199a-5p [49], miR-214, miR-218 [50], miR-377, miR-409-3p, miR-494 | |
| NFKB1 | miR-146a[51], miR-323-3p, miR-625 | |
| TGFBR2 | miR-130b, miR-145, miR-19a, miR-20a [52], miR-21 [53], miR-301a, b, miR-370 [54], miR-411, miR-454 | |
| BCL2L1 | let-7a, b, d, f, g, I [55] | |
| CRKL | miR-107, miR-128, miR-15a [56], miR-188-5p, miR-193a-3p | |
| MDM2 | miR-25 [57], miR-32 [57], miR-339-5p | |
| TGFB2 | miR-29a, b, c | |
Note: KRAS, Kirsten rat sarcoma viral oncogene homolog; LEF1, lymphoid enhancer-binding factor 1; MAPK1, mitogen-activated protein kinase 1; NRAS, neuroblastoma RAS viral (v-ras) oncogene homolog; PIM1, pim-1 oncogene; PIM2, pim-2 oncogene; STAT, signal transducer and activator of transcription; TCF7, transcription factor 7 (T-cell specific, HMG-box); CCNA1, cyclin A1; FLT3, FMS-related tyrosine kinase 3; PML, promyelocytic leukemia; RARA, retinoic acid receptor; AKT3, v-akt murine thymoma viral oncogene homolog 3; CDKN2A, cyclin-dependent kinase inhibitor 2A; CTBP1, C-terminal binding protein 1; CTBP2, C-terminal binding protein 2; IKBKB, inhibitor of kappa light polypeptide gene enhancer in B-cells, kinase beta; NFKB1, nuclear factor of kappa light polypeptide gene enhancer in B-cells 1; TGFBR2, transforming growth factor, beta receptor II (70/80 kDa); BCL2L1, BCL2-like 1; CRKL, v-crk avian sarcoma virus CT10 oncogene homolog-like; MDM2, murine double minute 2; TGFB2, transforming growth factor, beta 2.
Dynamic miRNA expression at different stages of myeloid development
K562 expresses a normal erythrocyte surface glycoprotein pattern [60] and has been characterized as a multipotent hematopoietic cell [61] that can spontaneously differentiate into early progenitors of erythroid, monocyte/macrophage and megakaryocytic lineages [62]. The promyeloblast HL-60 is a myeloid precursor that can be induced in vitro to differentiate into a number of different cell types, including granulocytes, monocytes, macrophage-like cells and eosinophils [37,63]. Previous studies [64] and the differential potentials of K562, HL-60 and THP-1 indicate that these cell lines represent three stages of myeloid differentiation. This differentiation tendency was evident from the hierarchical clustering via miRNA frequencies (Table 5). To further investigate whether specific miRNAs can regulate myeloid development and cell differentiation, we examined the miRNA expression patterns in these three myeloid cell lines and evaluated the relevance of their targets with respect to myeloid cell differentiation (GO: 0030099) and its child terms. Two comparisons were made in our dataset: K562 vs. HL-60 and HL-60 vs. THP-1. In the K562 vs. HL-60 comparison, the downregulated miRNAs in K562 (let-7 family and miR-17) primarily targeted genes related to erythrocyte differentiation (JAK2 encoding Janus kinase 2, GATA2 encoding GATA binding protein 2 and TAL1 encoding T-cell acute lymphocytic leukemia 1) (Table 5), whereas those downregulated in HL-60, such as miR-27b and miR-214, primarily targeted genes related to myeloid cell differentiation (e.g., PML and JAG1 encoding jagged 1) (Table 5). Expression of some miRNAs identified in this study, such as miR-185, miR-107, miR-10a and miR-128, had been reported to be down-regulated during the induced erythroid differentiation of K562 cells [65]. In particular, expression of the erythroid differentiation-related miRNAs miR-155, miR-221, miR-222 and miR-24 was downregulated in K562 cells, whereas expression of their validated targets SMAD5, FOXO3 encoding forkhead box O3, KIT and ACVR1B encoding activin A receptor, type IB was upregulated [66–70]. Caspase-3 (CASP3), which participates in erythroid differentiation [71], is a validated target of let-7a and miR-30d [72,73]. miR-24 was shown to inhibit erythropoiesis by targeting the human activin type I receptor ALK4 encoding activin A receptor, type IB [70]. FAS encoding Fas cell surface death receptor is a target of miR-146a [74], and JAG1 is a target of miR-143, miR-145, miR-21 and miR-34a [75,76]; their expression levels during myeloid cell differentiation exhibit opposing patterns. This finding demonstrated the dual nature of K562 cells as erythrocytes and multipotent hematopoietic cells. With respect to HL-60 and THP-1, the validated target JUN encoding jun proto-oncogene of THP-1-downregulated miRNAs miR-15a and miR-16 [77] positively regulated monocyte differentiation, whereas the target HOXA7 of THP-1-upregulated miRNAs miR-196a and miR-196b [78] negatively regulated monocyte differentiation (Table 5). These results suggest that miRNAs are important regulators of myeloid differentiation and that their expression levels tend to decrease during myeloid development to allow the expression of differentiation-promoting genes.
Table 5.
Function annotation of miRNAs at different developmental stages
 |
Note: Genes participating in differentiation are indicated in orange and genes in green are regulators of differentiation. Genes in red and blue are positive and negative regulators of differentiation, respectively. ATPIF1, ATPase inhibitory factor 1; CASP3, caspase 3, apoptosis-related cysteine peptidase; DYRK3, dual-specificity tyrosine-(Y)-phosphorylation regulated kinase 3; JAK2, Janus kinase 2; KIT, v-kit Hardy-Zuckerman 4 feline sarcoma viral oncogene homolog; SMAD5, SMAD family member 5; CDK6, cyclin-dependent kinase 6; ACVR1B, activin A receptor, type IB; ACVR2A, activin A receptor, type IB; FOXO3, forkhead box O3; GATA2, GATA binding protein 2; TAL1, T-cell acute lymphocytic leukemia 1; KLF13, Kruppel-like factor 13; PML, promyelocytic leukemia; PRKX, protein kinase, X-linked; SNRK, SNF related kinase; FAS, Fas cell surface death receptor; JAG1, jagged 1; HOXB8, homeobox B8; MEIS2, Meis homeobox 2; JUN, jun proto-oncogene; HOXA7, homeobox A7.
Discussion
In this study, we analyzed the differential miRNA expression patterns in three human myeloid leukemia cell lines using high-throughput parallel sequencing. Our effort to understand the miRNomes of these three cell lines has provided several interesting observations, including the identification of differentially-expressed miRNAs that represent different myeloid cell types, distinguish CML from AML cell lines and regulate myeloid differentiation.
mRNA expression profiling facilitates miRNA functional annotation
In this study, integrative analyses of miRNA and mRNA expression profiles in the same cell lines allow the functional definitions of miRNAs and their putative targets in leukemogenesis and myeloid differentiation. This represents an advantage of our work over previous studies [14,24]. To reduce the false positive rates, we used miRecords [34] to predict the targets of miRNAs by applying at least four widely-used tools as well as validated targets identified during literature curation. Strictly assigned anti-correlations of miRNA and target expression also reduced the false positive rate. In brief, every list of miRNAs and mRNAs was determined from the intersections of two sets of pair-wise comparisons (e.g., Figure 3C) that incorporated the expression data from all three cell lines. GO-based biological functional enrichment and KEGG pathway analysis of the extracted targets facilitated the identification of putative miRNA functions. In summary, the approach applied in this study should be of value for future studies on the functions of miRNAs [79]. Certainly, large-scale investigations of miRNA–target binding via Argonaute CLIP-Seq in corresponding cell lines would improve prediction reliability [80], and traditional techniques such as overexpression, reporter assays and site mutation may be needed in future to verify some of the critical miRNA–target relationships.
miRNA signatures of distinct myeloid cells
We identified distinctive miRNAs and targets across all three myeloid cell lines. K562 expresses a normal erythrocyte surface glycoprotein pattern [60] that relies on actin filament-based processes. We observed that several K562-specific miRNAs such as miR-10a, miR-144 and miR-411 participate in this process by targeting actins, myosins and EPB41 encoding erythrocyte membrane protein band 4.1. HL-60 cells exhibit phagocytic activity and response to chemotactic stimuli [37]. Accordingly, the targets of HL-60-specific miRNAs are involved in endocytosis and response to stimuli and thus exactly match the physiological characteristics of this cell line. The apoptosis-promoting and cell growth-arresting activities of two THP-1-unique miRNAs (miR-219-5p and miR-449a) have been investigated [81,82]; the present study predicted several genes as targets of these two miRNAs, possibly shedding light on the mechanisms by which these miRNAs regulate apoptosis and cell growth and thus contribute to the pathogenesis of THP-1 [5]. In summary, cell-specific miRNAs harbor unique functions and reflect the unique characteristics of the corresponding cell lines.
Differentially-expressed miRNAs between AML and CML cell lines
The diagnostic and prognostic significances of miRNAs have been demonstrated in leukemias [9–11,20,21,35]. Many of the potential targets of miRNAs downregulated in K562 were enriched in CML pathogenesis-related pathways, while the potential targets of miRNAs downregulated in AML cell lines were enriched in AML-related pathways (Table 3). Furthermore, miRNAs could act as tumor suppressors or oncomiRs through targeting oncogenes or tumor suppressors in AML or CML pathways (Figure S2). Members of the let-7 family reportedly act as tumor suppressors in several cancers and leukemias [83,84]. In this study, let-7 family members represented the most upregulated miRNAs in the AML lines, and they suppressed the Jak-STAT signaling pathway and PIM oncogenes to induce apoptosis. Other miRNAs, including miR-411, miR-337-3p, miR-625, miR-218 and miR-27b, may act as tumor suppressors in AML as well. In the CML pathway, miR-125b and miR-625 functioned as oncomiRs by targeting the tumor suppressors INK4α/ARF (CDKN2A) (Figure S2). Therefore, we can conclude that some of the differentially-expressed miRNAs between the AML and CML lines may distinguish these two myeloid leukemia types and act as diagnostic and prognostic biomarkers.
miRNAs involved in myeloid differentiation
Our study provided a list of miRNAs that targeted genes involved in erythroid differentiation (TAL1, JAK2 and GATA2), myeloid cell differentiation (PML, JAG1 and FAS) and monocyte differentiation (JUN). In general, upregulated miRNAs tend to inhibit the differentiation of corresponding cell lines, whereas downregulated miRNAs support differentiation. miRNAs that control myeloid cell differentiation are largely unknown, and our results can thus provide some information in this regard. For example, miR-34a was shown to target JAG1 in carcinomas [85] and expression of JAG1 was correlated with myeloid cell differentiation. miR-196a [86] has been shown to target HOXA7 encoding homeobox A7, whereas miR-15a and miR-16 [77] have been shown to target JUN; we therefore associated their roles with monocyte differentiation.
Taken together, our findings strongly suggest that an understanding of the molecular biology of myeloid leukemias will require consideration of both miRNomes and mRNA transcriptomes. Using this integrated approach, our data from the three representative cell lines may contribute to subsequent investigations of specific miRNAs in leukemia subtyping, leukemogenesis and myeloid differentiation using a limited number of samples. However, the small number of cell lines and the lack of patient samples limited the scientific significance of our study. In future, more leukemia cell lines and patient samples will be included in miRNA profiling analyses in order to further explore the clinical significance of these miRNAs. Nonetheless, our results can serve as a reference for future laboratory and clinical studies of myeloid leukemia miRNAs. Our future interests include the functional annotation of novel miRNAs and experimental validation of the predicted miRNAs’ functions in myeloid leukemia. With validated functions, some of the miRNAs may serve as candidates for the clinical diagnosis, prognosis and treatment of myeloid leukemias.
Materials and methods
sRNA library construction and sequencing
Cell culture and total RNA extraction were performed as described previously [22]. RNAs from each sample were run on denaturing polyacrylamide gels to obtain RNAs of approximately 18–30 nucleotides. These RNAs were then ligated to sequencing adaptors on both ends and were reversely transcribed using a sRNA sample prep kit (Illumina, San Diego, CA, USA). miRNA sequencing was conducted using the Illumina Genome Analyzer IIx (GA IIx) platform.
Data processing and differential expression analysis
Sequencing reads were pre-processed prior to reference mapping. We used Perl scripts to clip 3′-adaptor and 5′-adaptor contaminations and further removed poly (A)-containing or low-quality reads. The filtered reads were further clustered and uploaded to DSAP [23], an automated web service that provides analytical solutions for sRNA sequencing data. The numbers of reads mapped to individual miRNAs were further normalized to the CF, which indicates the individual miRNA abundance relative to the entire miRNA library [14]. Novel miRNAs were predicted using miRDeep∗ [29]. The sequencing read data were uploaded to the Gene Expression Omnibus (GEO; accession No. GSE48059). The location of the miRNAs was downloaded from BioMart track (GRch37.p10 assembly) at the Ensembl Genome Browser [87] (http://asia.ensembl.org/biomart/martview). The raw miRNome data from normal peripheral blood cells, K562 cells and HL-60 cells, which have been generated by Vaz et al. [24], were downloaded and analyzed as a reference to our data.
Differentially-expressed miRNAs between the samples were identified according to the following two criteria: P ⩽ 0.001 and fold change of ⩾2. These were determined using DEGseq [88], an R software package. We defined leukemia-associated and differentiation-associated miRNAs from the intersections of two sets of pair-wise comparisons. In brief, AML-upregulated miRNAs were those that were upregulated in both HL-60 and THP-1 compared with K562, and UD miRNAs were upregulated in HL-60 compared with both K562 and THP-1 (U indicates miRNAs that were upregulated in HL-60 relative to K562 and D indicates miRNAs that were downregulated in THP-1 relative to HL-60). mRNA-seq data of these cell lines generated previously in our lab are available in the NCBI GEO data repository (accession No. GSE39374 and GSE46164) and were analyzed similarly.
RT-qPCR
Stem-loop RT-qPCR was performed to evaluate miRNA expression. In brief, residual DNA was removed from the total RNA using the TURBO DNA-free™ Kit (Ambion, AM1907, CA, USA) and a poly (A) tail with ATP was added using poly (A) polymerase (New England Biolabs). Poly (A)-tailed RNA was reversely transcribed with the QmiR-RT primer using the RevertAid First Strand cDNA Synthesis Kit (Thermo Scientific, K1622, MD, USA) according to the manufacturer’s instructions. RT-qPCR was performed using Maxima® SYBR Green/ROX qPCR Master Mixes (2 ×) (Fermentas, K0223, MD, USA) and the CFX96™ Real-Time PCR Detection System (Bio-Rad). Primer pairs comprised a QmiR-specific reverse primer and miRNA-specific forward primers (sequences were downloaded from miRBase). The data were analyzed using the 2−ΔΔCt method, and miRNA transcript levels were calculated relative to that of human RNU6-2. RT-qPCR for mRNA was performed as described previously [22].
miRNA target prediction
The targets of differentially-expressed miRNAs were screened according to the following criteria: (a) presence in the validated target list (last updated on April 27, 2013) or prediction by at least four of the target prediction tools integrated by miRecords [34] and (b) anti-correlation in the expression pattern between miRNA and mRNA after intersecting the two sets of pair-wise comparisons [22].
Functional annotation, pathway analysis and network construction
The gene ontology annotation and KEGG pathways of the miRNA targets were assigned using DAVID bioinformatics resources [89]. The genes associated with myeloid cell differentiation (GO: 0030099) and child terms were downloaded from the AmiGO browser [90]. The networks were presented using Cytoscape software [91].
Authors’ contributions
QX performed RT-qPCR, prepared the figures, interpreted the results and drafted the manuscript. YY and SW analyzed the sRNA sequencing data. HW and JY performed high-throughput small RNA sequencing. JL performed statistical analysis. YL, YY, KC and XR cultured the cells and extracted total RNA. HS and XF designed the research, edited and revised the manuscript. All authors read and approved the final manuscript.
Competing interests
The authors declare no competing financial interests.
Acknowledgements
This research was supported by the “Strategic Priority Research Program” of the Chinese Academy of Sciences, Stem Cell and Regenerative Medicine Research (Grant No. XDA01040405), National Programs for High Technology Research and Development (863 Projects, Grant No. 2012AA022502) and National Key Scientific Instrument and Equipment Development Projects of China (Grant No. 2011YQ03013404) awarded to XF.
Footnotes
Peer review under responsibility of Beijing Institute of Genomics, Chinese Academy of Sciences and Genetics Society of China.

Contributor Information
Songnian Hu, Email: husn@big.ac.cn.
Xiangdong Fang, Email: fangxd@big.ac.cn.
Supplementary material
Functional annotation of cell type-specific miRNAs in myeloid cell lines Functional enrichment of the miRNAs uniquely expressed in the K562 (A), HL-60 (B) and THP-1 (C) cell lines.
Functional annotation of the miRNAs enriched in acute myeloid leukemia and chronic myeloid leukemia pathways The illustrations for acute myeloid leukemia pathway (A) and chronic myeloid leukemia pathway (B) were obtained from the KEGG database; oncogenes and tumor suppressors are labeled in orange and blue boxes, respectively. miRNAs are shown in red (upregulated) or green (downregulated) and their targets are shown in sienna boxes.
miRNA expression patterns in the three cell lines The expression intensities of the selected targets PIK3CD (A) and MDM2 (C) as measured by RNA-seq and real-time qPCR and the corresponding targeting miRNAs as determined by RNA-seq (B, D). PIK3CD, phosphatidylinositol-4,5-bisphosphate 3-kinase, catalytic subunit delta; MDM2, murine double minute 2.
Top 90% expressed miRNAs in three myeloid leukemia cell lines.
References
- 1.Bissels U., Bosio A., Wagner W. MicroRNAs are shaping the hematopoietic landscape. Haematologica. 2012;97:160–167. doi: 10.3324/haematol.2011.051730. [DOI] [PMC free article] [PubMed] [Google Scholar]
- 2.Murati A., Brecqueville M., Devillier R., Mozziconacci M.J., Gelsi-Boyer V., Birnbaum D. Myeloid malignancies: mutations, models and management. BMC Cancer. 2012;12:304. doi: 10.1186/1471-2407-12-304. [DOI] [PMC free article] [PubMed] [Google Scholar]
- 3.Lozzio C.B., Lozzio B.B. Human chronic myelogenous leukemia cell-line with positive Philadelphia chromosome. Blood. 1975;45:321–334. [PubMed] [Google Scholar]
- 4.Collins S.J., Gallo R.C., Gallagher R.E. Continuous growth and differentiation of human myeloid leukaemic cells in suspension culture. Nature. 1977;270:347–349. doi: 10.1038/270347a0. [DOI] [PubMed] [Google Scholar]
- 5.Tsuchiya S., Yamabe M., Yamaguchi Y., Kobayashi Y., Konno T., Tada K. Establishment and characterization of a human acute monocytic leukemia cell line (THP-1) Int J Cancer. 1980;26:171–176. doi: 10.1002/ijc.2910260208. [DOI] [PubMed] [Google Scholar]
- 6.Guo H., Ingolia N.T., Weissman J.S., Bartel D.P. Mammalian microRNAs predominantly act to decrease target mRNA levels. Nature. 2010;466:835–840. doi: 10.1038/nature09267. [DOI] [PMC free article] [PubMed] [Google Scholar]
- 7.Kozomara A., Griffiths-Jones S. MiRBase: annotating high confidence microRNAs using deep sequencing data. Nucleic Acids Res. 2014;42:D68–D73. doi: 10.1093/nar/gkt1181. [DOI] [PMC free article] [PubMed] [Google Scholar]
- 8.Garzon R., Volinia S., Liu C.G., Fernandez-Cymering C., Palumbo T., Pichiorri F. MicroRNA signatures associated with cytogenetics and prognosis in acute myeloid leukemia. Blood. 2008;111:3183–3189. doi: 10.1182/blood-2007-07-098749. [DOI] [PMC free article] [PubMed] [Google Scholar]
- 9.Mi S., Lu J., Sun M., Li Z., Zhang H., Neilly M.B. MicroRNA expression signatures accurately discriminate acute lymphoblastic leukemia from acute myeloid leukemia. Proc Natl Acad Sci U S A. 2007;104:19971–19976. doi: 10.1073/pnas.0709313104. [DOI] [PMC free article] [PubMed] [Google Scholar]
- 10.Zhi F., Cao X., Xie X., Wang B., Dong W., Gu W. Identification of circulating microRNAs as potential biomarkers for detecting acute myeloid leukemia. PLoS One. 2013;8:e56718. doi: 10.1371/journal.pone.0056718. [DOI] [PMC free article] [PubMed] [Google Scholar]
- 11.Fayyad-Kazan H., Bitar N., Najar M., Lewalle P., Fayyad-Kazan M., Badran R. Circulating miR-150 and miR-342 in plasma are novel potential biomarkers for acute myeloid leukemia. J Transl Med. 2013;11:31. doi: 10.1186/1479-5876-11-31. [DOI] [PMC free article] [PubMed] [Google Scholar]
- 12.Pritchard C.C., Cheng H.H., Tewari M. MicroRNA profiling: approaches and considerations. Nat Rev Genet. 2012;13:358–369. doi: 10.1038/nrg3198. [DOI] [PMC free article] [PubMed] [Google Scholar]
- 13.Wang Z., Gerstein M., Snyder M. RNA-Seq: a revolutionary tool for transcriptomics. Nat Rev Genet. 2009;10:57–63. doi: 10.1038/nrg2484. [DOI] [PMC free article] [PubMed] [Google Scholar]
- 14.Landgraf P., Rusu M., Sheridan R., Sewer A., Iovino N., Aravin A. A mammalian microRNA expression atlas based on small RNA library sequencing. Cell. 2007;129:1401–1414. doi: 10.1016/j.cell.2007.04.040. [DOI] [PMC free article] [PubMed] [Google Scholar]
- 15.Fazi F., Rosa A., Fatica A., Gelmetti V., De Marchis M.L., Nervi C. A minicircuitry comprised of microRNA-223 and transcription factors NFI-A and C/EBPalpha regulates human granulopoiesis. Cell. 2005;123:819–831. doi: 10.1016/j.cell.2005.09.023. [DOI] [PubMed] [Google Scholar]
- 16.Yuan J.Y., Wang F., Yu J., Yang G.H., Liu X.L., Zhang J.W. MicroRNA-223 reversibly regulates erythroid and megakaryocytic differentiation of K562 cells. J Cell Mol Med. 2009;13:4551–4559. doi: 10.1111/j.1582-4934.2008.00585.x. [DOI] [PMC free article] [PubMed] [Google Scholar]
- 17.He L., Thomson J.M., Hemann M.T., Hernando-Monge E., Mu D., Goodson S. A microRNA polycistron as a potential human oncogene. Nature. 2005;435:828–833. doi: 10.1038/nature03552. [DOI] [PMC free article] [PubMed] [Google Scholar]
- 18.Garzon R., Liu S., Fabbri M., Liu Z., Heaphy C.E., Callegari E. MicroRNA-29b induces global DNA hypomethylation and tumor suppressor gene reexpression in acute myeloid leukemia by targeting directly DNMT3A and 3B and indirectly DNMT1. Blood. 2009;113:6411–6418. doi: 10.1182/blood-2008-07-170589. [DOI] [PMC free article] [PubMed] [Google Scholar]
- 19.Flamant S., Ritchie W., Guilhot J., Holst J., Bonnet M.L., Chomel J.C. Micro-RNA response to imatinib mesylate in patients with chronic myeloid leukemia. Haematologica. 2010;95:1325–1333. doi: 10.3324/haematol.2009.020636. [DOI] [PMC free article] [PubMed] [Google Scholar]
- 20.Starczynowski D.T., Morin R., McPherson A., Lam J., Chari R., Wegrzyn J. Genome-wide identification of human microRNAs located in leukemia-associated genomic alterations. Blood. 2011;117:595–607. doi: 10.1182/blood-2010-03-277012. [DOI] [PubMed] [Google Scholar]
- 21.Daschkey S., Rottgers S., Giri A., Bradtke J., Teigler-Schlegel A., Meister G. MicroRNAs distinguish cytogenetic subgroups in pediatric AML and contribute to complex regulatory networks in AML-relevant pathways. PLoS One. 2013;8:e56334. doi: 10.1371/journal.pone.0056334. [DOI] [PMC free article] [PubMed] [Google Scholar]
- 22.Wang H., Hu H., Zhang Q., Yang Y., Li Y., Hu Y. Dynamic transcriptomes of human myeloid leukemia cells. Genomics. 2013;102:250–256. doi: 10.1016/j.ygeno.2013.06.004. [DOI] [PubMed] [Google Scholar]
- 23.Huang P.J., Liu Y.C., Lee C.C., Lin W.C., Gan R.R., Lyu P.C. DSAP: deep-sequencing small RNA analysis pipeline. Nucleic Acids Res. 2010;38:W385–W391. doi: 10.1093/nar/gkq392. [DOI] [PMC free article] [PubMed] [Google Scholar]
- 24.Vaz C., Ahmad H.M., Sharma P., Gupta R., Kumar L., Kulshreshtha R. Analysis of microRNA transcriptome by deep sequencing of small RNA libraries of peripheral blood. BMC Genomics. 2010;11:288. doi: 10.1186/1471-2164-11-288. [DOI] [PMC free article] [PubMed] [Google Scholar]
- 25.Volinia S., Calin G.A., Liu C.G., Ambs S., Cimmino A., Petrocca F. A microRNA expression signature of human solid tumors defines cancer gene targets. Proc Natl Acad Sci U S A. 2006;103:2257–2261. doi: 10.1073/pnas.0510565103. [DOI] [PMC free article] [PubMed] [Google Scholar]
- 26.Nagpal N., Ahmad H.M., Molparia B., Kulshreshtha R. MicroRNA-191, an estrogen-responsive microRNA, functions as an oncogenic regulator in human breast cancer. Carcinogenesis. 2013;34:1889–1899. doi: 10.1093/carcin/bgt107. [DOI] [PubMed] [Google Scholar]
- 27.Kumar M., Lu Z., Takwi A.A., Chen W., Callander N.S., Ramos K.S. Negative regulation of the tumor suppressor p53 gene by microRNAs. Oncogene. 2011;30:843–853. doi: 10.1038/onc.2010.457. [DOI] [PMC free article] [PubMed] [Google Scholar]
- 28.Volinia S., Galasso M., Costinean S., Tagliavini L., Gamberoni G., Drusco A. Reprogramming of miRNA networks in cancer and leukemia. Genome Res. 2010;20:589–599. doi: 10.1101/gr.098046.109. [DOI] [PMC free article] [PubMed] [Google Scholar]
- 29.An J., Lai J., Lehman M.L., Nelson C.C. MiRDeep∗: an integrated application tool for miRNA identification from RNA sequencing data. Nucleic Acids Res. 2013;41:727–737. doi: 10.1093/nar/gks1187. [DOI] [PMC free article] [PubMed] [Google Scholar]
- 30.Dore L.C., Amigo J.D., Dos Santos C.O., Zhang Z., Gai X., Tobias J.W. A GATA-1-regulated microRNA locus essential for erythropoiesis. Proc Natl Acad Sci U S A. 2008;105:3333–3338. doi: 10.1073/pnas.0712312105. [DOI] [PMC free article] [PubMed] [Google Scholar]
- 31.Bruchova-Votavova H., Yoon D., Prchal J.T. MiR-451 enhances erythroid differentiation in K562 cells. Leuk Lymphoma. 2010;51:686–693. doi: 10.3109/10428191003629362. [DOI] [PubMed] [Google Scholar]
- 32.Wang F., Yu J., Yang G.H., Wang X.S., Zhang J.W. Regulation of erythroid differentiation by miR-376a and its targets. Cell Res. 2011;21:1196–1209. doi: 10.1038/cr.2011.79. [DOI] [PMC free article] [PubMed] [Google Scholar]
- 33.Huang X., Gschweng E., Van Handel B., Cheng D., Mikkola H.K., Witte O.N. Regulated expression of microRNAs-126/126∗ inhibits erythropoiesis from human embryonic stem cells. Blood. 2011;117:2157–2165. doi: 10.1182/blood-2010-08-302711. [DOI] [PMC free article] [PubMed] [Google Scholar]
- 34.Xiao F., Zuo Z., Cai G., Kang S., Gao X., Li T. MiRecords: an integrated resource for microRNA-target interactions. Nucleic Acids Res. 2009;37:D105–D110. doi: 10.1093/nar/gkn851. [DOI] [PMC free article] [PubMed] [Google Scholar]
- 35.Dixon-McIver A., East P., Mein C.A., Cazier J.B., Molloy G., Chaplin T. Distinctive patterns of microRNA expression associated with karyotype in acute myeloid leukaemia. PLoS One. 2008;3:e2141. doi: 10.1371/journal.pone.0002141. [DOI] [PMC free article] [PubMed] [Google Scholar]
- 36.Marcucci G., Radmacher M.D., Maharry K., Mrózek K., Ruppert A.S., Paschka P. MicroRNA expression in cytogenetically normal acute myeloid leukemia. N Engl J Med. 2008;358:1919–1928. doi: 10.1056/NEJMoa074256. [DOI] [PubMed] [Google Scholar]
- 37.Gallagher R., Collins S., Trujillo J., McCredie K., Ahearn M., Tsai S. Characterization of the continuous, differentiating myeloid cell line (HL-60) from a patient with acute promyelocytic leukemia. Blood. 1979;54:713–733. [PubMed] [Google Scholar]
- 38.Lim L.P., Lau N.C., Garrett-Engele P., Grimson A., Schelter J.M., Castle J. Microarray analysis shows that some microRNAs downregulate large numbers of target mRNAs. Nature. 2005;433:769–773. doi: 10.1038/nature03315. [DOI] [PubMed] [Google Scholar]
- 39.Jiang Q., Feng M.G., Mo Y.Y. Systematic validation of predicted microRNAs for cyclin D1. BMC Cancer. 2009;9:194. doi: 10.1186/1471-2407-9-194. [DOI] [PMC free article] [PubMed] [Google Scholar]
- 40.Auffray C., Sieweke M.H., Geissmann F. Blood monocytes: development, heterogeneity, and relationship with dendritic cells. Annu Rev Immunol. 2009;27:669–692. doi: 10.1146/annurev.immunol.021908.132557. [DOI] [PubMed] [Google Scholar]
- 41.Wu S.Q., Voelkerding K.V., Sabatini L., Chen X.R., Huang J., Meisner L.F. Extensive amplification of bcr/abl fusion genes clustered on three marker chromosomes in human leukemic cell line K-562. Leukemia. 1995;9:858–862. [PubMed] [Google Scholar]
- 42.Calabretta B., Perrotti D. The biology of CML blast crisis. Blood. 2004;103:4010–4022. doi: 10.1182/blood-2003-12-4111. [DOI] [PubMed] [Google Scholar]
- 43.Venturini L., Battmer K., Castoldi M., Schultheis B., Hochhaus A., Muckenthaler M.U. Expression of the miR-17-92 polycistron in chronic myeloid leukemia (CML) CD34+ cells. Blood. 2007;109:4399–4405. doi: 10.1182/blood-2006-09-045104. [DOI] [PubMed] [Google Scholar]
- 44.Machova Polakova K., Koblihova J., Stopka T. Role of epigenetics in chronic myeloid leukemia. Curr Hematol Malig Rep. 2013;8:28–36. doi: 10.1007/s11899-012-0152-z. [DOI] [PMC free article] [PubMed] [Google Scholar]
- 45.San Jose-Eneriz E., Roman-Gomez J., Jimenez-Velasco A., Garate L., Martin V., Cordeu L. MicroRNA expression profiling in Imatinib-resistant Chronic Myeloid Leukemia patients without clinically significant ABL1-mutations. Mol Cancer. 2009;8:69. doi: 10.1186/1476-4598-8-69. [DOI] [PMC free article] [PubMed] [Google Scholar]
- 46.Dentelli P., Rosso A., Orso F., Olgasi C., Taverna D., Brizzi M.F. MicroRNA-222 controls neovascularization by regulating signal transducer and activator of transcription 5A expression. Arterioscler Thromb Vasc Biol. 2010;30:1562–1568. doi: 10.1161/ATVBAHA.110.206201. [DOI] [PubMed] [Google Scholar]
- 47.Gabriely G., Yi M., Narayan R.S., Niers J.M., Wurdinger T., Imitola J. Human glioma growth is controlled by microRNA-10b. Cancer Res. 2011;71:3563–3572. doi: 10.1158/0008-5472.CAN-10-3568. [DOI] [PMC free article] [PubMed] [Google Scholar]
- 48.Pogue A.I., Cui J.G., Li Y.Y., Zhao Y., Culicchia F., Lukiw W.J. Micro RNA-125b (miRNA-125b) function in astrogliosis and glial cell proliferation. Neurosci Lett. 2010;476:18–22. doi: 10.1016/j.neulet.2010.03.054. [DOI] [PubMed] [Google Scholar]
- 49.Chen R., Alvero A.B., Silasi D.A., Kelly M.G., Fest S., Visintin I. Regulation of IKKbeta by miR-199a affects NF-kappaB activity in ovarian cancer cells. Oncogene. 2008;27:4712–4723. doi: 10.1038/onc.2008.112. [DOI] [PMC free article] [PubMed] [Google Scholar]
- 50.Song L., Huang Q., Chen K., Liu L., Lin C., Dai T. MiR-218 inhibits the invasive ability of glioma cells by direct downregulation of IKK-beta. Biochem Biophys Res Commun. 2010;402:135–140. doi: 10.1016/j.bbrc.2010.10.003. [DOI] [PubMed] [Google Scholar]
- 51.Bhaumik D., Scott G.K., Schokrpur S., Patil C.K., Campisi J., Benz C.C. Expression of microRNA-146 suppresses NF-kappaB activity with reduction of metastatic potential in breast cancer cells. Oncogene. 2008;27:5643–5647. doi: 10.1038/onc.2008.171. [DOI] [PMC free article] [PubMed] [Google Scholar]
- 52.Dews M., Fox J.L., Hultine S., Sundaram P., Wang W., Liu Y.Y. The myc-miR-17∼92 axis blunts TGFβ signaling and production of multiple TGFβ-dependent antiangiogenic factors. Cancer Res. 2010;70:8233–8246. doi: 10.1158/0008-5472.CAN-10-2412. [DOI] [PMC free article] [PubMed] [Google Scholar]
- 53.Papagiannakopoulos T., Shapiro A., Kosik K.S. MicroRNA-21 targets a network of key tumor-suppressive pathways in glioblastoma cells. Cancer Res. 2008;68:8164–8172. doi: 10.1158/0008-5472.CAN-08-1305. [DOI] [PubMed] [Google Scholar]
- 54.Lo S.S., Hung P.S., Chen J.H., Tu H.F., Fang W.L., Chen C.Y. Overexpression of miR-370 and downregulation of its novel target TGFβ-RII contribute to the progression of gastric carcinoma. Oncogene. 2012;31:226–237. doi: 10.1038/onc.2011.226. [DOI] [PubMed] [Google Scholar]
- 55.Shimizu S., Takehara T., Hikita H., Kodama T., Miyagi T., Hosui A. The let-7 family of microRNAs inhibits Bcl-xL expression and potentiates sorafenib-induced apoptosis in human hepatocellular carcinoma. J Hepatol. 2010;52:698–704. doi: 10.1016/j.jhep.2009.12.024. [DOI] [PubMed] [Google Scholar]
- 56.Russ A.C., Sander S., Luck S.C., Lang K.M., Bauer M., Rucker F.G. Integrative nucleophosmin mutation-associated microRNA and gene expression pattern analysis identifies novel microRNA – target gene interactions in acute myeloid leukemia. Haematologica. 2011;96:1783–1791. doi: 10.3324/haematol.2011.046888. [DOI] [PMC free article] [PubMed] [Google Scholar]
- 57.Suh S.S., Yoo J.Y., Nuovo G.J., Jeon Y.J., Kim S., Lee T.J. MicroRNAs/TP53 feedback circuitry in glioblastoma multiforme. Proc Natl Acad Sci U S A. 2012;109:5316–5321. doi: 10.1073/pnas.1202465109. [DOI] [PMC free article] [PubMed] [Google Scholar]
- 58.Amir S., Ma A.H., Shi X.B., Xue L., Kung H.J., Devere White R.W. Oncomir miR-125b suppresses p14(ARF) to modulate p53-dependent and p53-independent apoptosis in prostate cancer. PLoS One. 2013;8:e61064. doi: 10.1371/journal.pone.0061064. [DOI] [PMC free article] [PubMed] [Google Scholar]
- 59.Zhong M., Bian Z., Wu Z. MiR-30a suppresses cell migration and invasion through downregulation of PIK3CD in colorectal carcinoma. Cell Physiol Biochem. 2013;31:209–218. doi: 10.1159/000343362. [DOI] [PubMed] [Google Scholar]
- 60.Andersson L.C., Nilsson K., Gahmberg C.G. K562–a human erythroleukemic cell line. Int J Cancer. 1979;23:143–147. doi: 10.1002/ijc.2910230202. [DOI] [PubMed] [Google Scholar]
- 61.Lozzio B.B., Lozzio C.B. Properties and usefulness of the original K-562 human myelogenous leukemia cell line. Leuk Res. 1979;3:363–370. doi: 10.1016/0145-2126(79)90033-x. [DOI] [PubMed] [Google Scholar]
- 62.Sutherland J.A., Turner A.R., Mannoni P., McGann L.E., Turc J.M. Differentiation of K562 leukemia cells along erythroid, macrophage, and megakaryocyte lineages. J Biol Response Mod. 1986;5:250–262. [PubMed] [Google Scholar]
- 63.Collins S.J. The HL-60 promyelocytic leukemia cell line: proliferation, differentiation, and cellular oncogene expression. Blood. 1987;70:1233–1244. [PubMed] [Google Scholar]
- 64.Goldberger A., Brewer G., Hnilica L.S., Briggs R.C. Nonhistone protein antigen profiles of five leukemic cell lines reflect the extent of myeloid differentiation. Blood. 1984;63:701–710. [PubMed] [Google Scholar]
- 65.Choong M.L., Yang H.H., McNiece I. MicroRNA expression profiling during human cord blood-derived CD34 cell erythropoiesis. Exp Hematol. 2007;35:551–564. doi: 10.1016/j.exphem.2006.12.002. [DOI] [PubMed] [Google Scholar]
- 66.Felli N., Fontana L., Pelosi E., Botta R., Bonci D., Facchiano F. MicroRNAs 221 and 222 inhibit normal erythropoiesis and erythroleukemic cell growth via kit receptor down-modulation. Proc Natl Acad Sci U S A. 2005;102:18081–18086. doi: 10.1073/pnas.0506216102. [DOI] [PMC free article] [PubMed] [Google Scholar]
- 67.Masaki S., Ohtsuka R., Abe Y., Muta K., Umemura T. Expression patterns of microRNAs 155 and 451 during normal human erythropoiesis. Biochem Biophys Res Commun. 2007;364:509–514. doi: 10.1016/j.bbrc.2007.10.077. [DOI] [PubMed] [Google Scholar]
- 68.Kong W., He L., Coppola M., Guo J., Esposito N.N., Coppola D. MicroRNA-155 regulates cell survival, growth, and chemosensitivity by targeting FOXO3a in breast cancer. J Biol Chem. 2010;285:17869–17879. doi: 10.1074/jbc.M110.101055. [DOI] [PMC free article] [PubMed] [Google Scholar] [Retracted]
- 69.Rai D., Kim S.W., McKeller M.R., Dahia P.L., Aguiar R.C. Targeting of SMAD5 links microRNA-155 to the TGF-β pathway and lymphomagenesis. Proc Natl Acad Sci U S A. 2010;107:3111–3116. doi: 10.1073/pnas.0910667107. [DOI] [PMC free article] [PubMed] [Google Scholar]
- 70.Wang Q., Huang Z., Xue H., Jin C., Ju X.L., Han J.D. MicroRNA miR-24 inhibits erythropoiesis by targeting activin type I receptor ALK4. Blood. 2008;111:588–595. doi: 10.1182/blood-2007-05-092718. [DOI] [PubMed] [Google Scholar]
- 71.Ribeil J.A., Zermati Y., Vandekerckhove J., Cathelin S., Kersual J., Dussiot M. Hsp70 regulates erythropoiesis by preventing caspase-3-mediated cleavage of GATA-1. Nature. 2007;445:102–105. doi: 10.1038/nature05378. [DOI] [PubMed] [Google Scholar]
- 72.Li N., Kaur S., Greshock J., Lassus H., Zhong X., Wang Y. A combined array-based comparative genomic hybridization and functional library screening approach identifies mir-30d as an oncomir in cancer. Cancer Res. 2012;72:154–164. doi: 10.1158/0008-5472.CAN-11-2484. [DOI] [PMC free article] [PubMed] [Google Scholar]
- 73.Tsang W.P., Kwok T.T. Let-7a microRNA suppresses therapeutics-induced cancer cell death by targeting caspase-3. Apoptosis. 2008;13:1215–1222. doi: 10.1007/s10495-008-0256-z. [DOI] [PubMed] [Google Scholar]
- 74.Suzuki Y., Kim H.W., Ashraf M., Haider H.Kh. Diazoxide potentiates mesenchymal stem cell survival via NF-kappaB-dependent miR-146a expression by targeting Fas. Am J Physiol Heart Circ Physiol. 2010;299:H1077–H1082. doi: 10.1152/ajpheart.00212.2010. [DOI] [PMC free article] [PubMed] [Google Scholar]
- 75.Hashimi S.T., Fulcher J.A., Chang M.H., Gov L., Wang S., Lee B. MicroRNA profiling identifies miR-34a and miR-21 and their target genes JAG1 and WNT1 in the coordinate regulation of dendritic cell differentiation. Blood. 2009;114:404–414. doi: 10.1182/blood-2008-09-179150. [DOI] [PMC free article] [PubMed] [Google Scholar]
- 76.Boucher J.M., Peterson S.M., Urs S., Zhang C., Liaw L. The miR-143/145 cluster is a novel transcriptional target of Jagged-1/Notch signaling in vascular smooth muscle cells. J Biol Chem. 2011;286:28312–28321. doi: 10.1074/jbc.M111.221945. [DOI] [PMC free article] [PubMed] [Google Scholar]
- 77.Calin G.A., Cimmino A., Fabbri M., Ferracin M., Wojcik S.E., Shimizu M. MiR-15a and miR-16-1 cluster functions in human leukemia. Proc Natl Acad Sci U S A. 2008;105:5166–5171. doi: 10.1073/pnas.0800121105. [DOI] [PMC free article] [PubMed] [Google Scholar]
- 78.Hafner M., Landthaler M., Burger L., Khorshid M., Hausser J., Berninger P. Transcriptome-wide identification of RNA-binding protein and microRNA target sites by PAR-CLIP. Cell. 2010;141:129–141. doi: 10.1016/j.cell.2010.03.009. [DOI] [PMC free article] [PubMed] [Google Scholar]
- 79.Yan Z., Shah P.K., Amin S.B., Samur M.K., Huang N., Wang X. Integrative analysis of gene and miRNA expression profiles with transcription factor-miRNA feed-forward loops identifies regulators in human cancers. Nucleic Acids Res. 2012;40:e135. doi: 10.1093/nar/gks395. [DOI] [PMC free article] [PubMed] [Google Scholar]
- 80.Yang J.H., Li J.H., Shao P., Zhou H., Chen Y.Q., Qu L.H. StarBase: a database for exploring microRNA-mRNA interaction maps from Argonaute CLIP-Seq and Degradome-Seq data. Nucleic Acids Res. 2011;39:D202–D209. doi: 10.1093/nar/gkq1056. [DOI] [PMC free article] [PubMed] [Google Scholar]
- 81.Zhang M.C., Lv Y., Qi Y.T., Zhang Z., Fu X.N., Yuan C.G. Knockdown and overexpression of miR-219 lead to embryonic defects in zebrafish development. Fen Zi Xi Bao Sheng Wu Xue Bao. 2008;41:341–348. [PubMed] [Google Scholar]
- 82.Lize M., Pilarski S., Dobbelstein M. E2F1-inducible microRNA 449a/b suppresses cell proliferation and promotes apoptosis. Cell Death Differ. 2010;17:452–458. doi: 10.1038/cdd.2009.188. [DOI] [PubMed] [Google Scholar]
- 83.Jongen-Lavrencic M., Sun S.M., Dijkstra M.K., Valk P.J., Lowenberg B. MicroRNA expression profiling in relation to the genetic heterogeneity of acute myeloid leukemia. Blood. 2008;111:5078–5085. doi: 10.1182/blood-2008-01-133355. [DOI] [PubMed] [Google Scholar]
- 84.Zhang B., Pan X., Cobb G.P., Anderson T.A. MicroRNAs as oncogenes and tumor suppressors. Dev Biol. 2007;302:1–12. doi: 10.1016/j.ydbio.2006.08.028. [DOI] [PubMed] [Google Scholar]
- 85.Pang R.T., Leung C.O., Ye T.M., Liu W., Chiu P.C., Lam K.K. MicroRNA-34a suppresses invasion through downregulation of Notch1 and Jagged1 in cervical carcinoma and choriocarcinoma cells. Carcinogenesis. 2010;31:1037–1044. doi: 10.1093/carcin/bgq066. [DOI] [PubMed] [Google Scholar]
- 86.Yekta S., Shih I.H., Bartel D.P. MicroRNA-directed cleavage of HOXB8 mRNA. Science. 2004;304:594–596. doi: 10.1126/science.1097434. [DOI] [PubMed] [Google Scholar]
- 87.Kinsella R.J., Kahari A., Haider S., Zamora J., Proctor G., Spudich G. Ensembl BioMarts: a hub for data retrieval across taxonomic space. Database. 2011;2011:bar030. doi: 10.1093/database/bar030. [DOI] [PMC free article] [PubMed] [Google Scholar]
- 88.Wang L., Feng Z., Wang X., Zhang X. DEGseq: an R package for identifying differentially expressed genes from RNA-seq data. Bioinformatics. 2010;26:136–138. doi: 10.1093/bioinformatics/btp612. [DOI] [PubMed] [Google Scholar]
- 89.Huang da W., Sherman B.T., Lempicki R.A. Systematic and integrative analysis of large gene lists using DAVID bioinformatics resources. Nat Protoc. 2009;4:44–57. doi: 10.1038/nprot.2008.211. [DOI] [PubMed] [Google Scholar]
- 90.Carbon S., Ireland A., Mungall C.J., Shu S., Marshall B., Lewis S. AmiGO: online access to ontology and annotation data. Bioinformatics. 2009;25:288–289. doi: 10.1093/bioinformatics/btn615. [DOI] [PMC free article] [PubMed] [Google Scholar]
- 91.Cline M.S., Smoot M., Cerami E., Kuchinsky A., Landys N., Workman C. Integration of biological networks and gene expression data using Cytoscape. Nat Protoc. 2007;2:2366–2382. doi: 10.1038/nprot.2007.324. [DOI] [PMC free article] [PubMed] [Google Scholar]
Associated Data
This section collects any data citations, data availability statements, or supplementary materials included in this article.
Supplementary Materials
Functional annotation of cell type-specific miRNAs in myeloid cell lines Functional enrichment of the miRNAs uniquely expressed in the K562 (A), HL-60 (B) and THP-1 (C) cell lines.
Functional annotation of the miRNAs enriched in acute myeloid leukemia and chronic myeloid leukemia pathways The illustrations for acute myeloid leukemia pathway (A) and chronic myeloid leukemia pathway (B) were obtained from the KEGG database; oncogenes and tumor suppressors are labeled in orange and blue boxes, respectively. miRNAs are shown in red (upregulated) or green (downregulated) and their targets are shown in sienna boxes.
miRNA expression patterns in the three cell lines The expression intensities of the selected targets PIK3CD (A) and MDM2 (C) as measured by RNA-seq and real-time qPCR and the corresponding targeting miRNAs as determined by RNA-seq (B, D). PIK3CD, phosphatidylinositol-4,5-bisphosphate 3-kinase, catalytic subunit delta; MDM2, murine double minute 2.
Top 90% expressed miRNAs in three myeloid leukemia cell lines.