Abstract
Objective
Visceral white adipose tissue (WAT) expansion and macrophage accumulation are associated with metabolic dysfunction. Visceral WAT typically shows greater macrophage infiltration. Preadipocytes show varying pro-inflammatory expression profiles among WAT depots. Our objective was to examine the secretomes and chemoattractive properties of preadipocytes from visceral and subcutaneous WAT.
Design and Methods
A label-free quantitative proteomics approach was applied to study secretomes of subcutaneous and omental preadipocytes from obese subjects. Enzyme-linked immunosorbent assays and chemotaxis assays were used to confirm pro-inflammatory chemokine secretion between depots.
Results
Preadipocyte secretomes showed greater variation between depots than did intracellular protein expression. Chemokines were the most differentially secreted proteins. Omental preadipocytes induced chemoattraction of macrophages and monocytes. Neutralizing antibodies to the identified chemokines reduced macrophage/monocyte chemoattraction. Subcutaneous preadipocytes treated with interleukin-6 (IL-6) resembled omental preadipocytes in terms of chemokine secretion and macrophage/monocyte chemoattraction. Janus-activated kinase (JAK 1/2) protein expression, which transduces IL-6 signaling, was higher in omental than subcutaneous preadipocytes and WAT. Inhibiting JAK in omental preadipocytes decreased chemokine secretion and macrophage/monocyte chemoattraction to levels closer to that observed in subcutaneous preadipocytes.
Conclusion
Secretomes of omental and subcutaneous preadipocytes are distinct, with the former inducing more macrophage/monocyte chemoattraction, in part through IL-6/JAK-mediated signaling.
Keywords: abdominal subcutaneous preadipocytes, inflammation, obesity, omental preadipocytes
Introduction
Chronic low-grade white adipose tissue (WAT) inflammation is associated with metabolic dysfunction (1). Macrophages are closely linked to the metabolic dysfunction associated with obesity (2). Excess visceral WAT accumulation is associated with morbidity and is a marker of dysregulated insulin responsiveness, independent of total body adiposity (3–6). Macrophages are generally more abundant in visceral than subcutaneous WAT, and the extent of macrophage infiltration is associated with morbidity (7–9). WAT expresses and secretes a range of autocrine, paracrine, and endocrine factors, including monocyte/macrophage chemokines (10). Mechanisms that account for greater macrophage accumulation in visceral vs subcutaneous WAT are not fully understood, nor is the link between visceral adiposity and inflammation.
One potential explanation involves variation in preadipocyte characteristics among WAT depots (11–14). New adipocytes arise from preadipocytes (also termed fat cell progenitors, adipose-derived stem cells, and other names, as recently reviewed by us 15), which account for 15%–50% of adipose stromal vascular cells (16). Preadipocytes from different depots vary in their capacity for replication and differentiation into fat cells, and their gene expression profiles differ as well (15). These differences remain evident even after 40 population doublings in strains derived from single preadipocytes isolated from different depots of the same subjects (12,13).
Preadipocytes secrete a number of inflammatory mediators and exhibit robust innate immune responses (17). Therefore, we tested the hypothesis that inherent differences between the secreted proteins of visceral and subcutaneous preadipocytes contribute to variation in inflammation and macrophage accretion. Differences in protein secretion, monocyte/macrophage chemoattraction, and the mechanisms responsible for these differences were examined by comparing abdominal subcutaneous with omental preadipocytes from the same obese and lean volunteers.
Materials and Methods
The protocol was approved by the Mayo Clinic Institutional Review Board.
Subjects
Adipose tissue (source of isolated preadipocytes) was obtained during abdominal surgery (eg, gastric bypass, hernia repair, cholecystectomy) from 8 subjects following informed written consent. All were women, mean (SEM) age of 46 (5.0) years, with mean (SD) body mass index (BMI) of 45 (6.4) kg/m2. Subjects with malignancies or on thiazolidinediones or corticosteroids were excluded. Abdominal subcutaneous (outside the fascia superficialis) and greater omental WAT were obtained from subjects in parallel. Subcutaneous and omental WAT was obtained from an additional 8 obese subjects (all women; age range, 35–55 years; mean [SD] BMI, 45 [6.4] kg/m2) for analysis of Janus-activated kinase (JAK) and chemokine expression in intact WAT. Samples from morbidly obese subjects were used in the study because they are especially likely to have inflammation-related morbidity (17–20). These samples were compared with subcutaneous and omental WAT from 6 apparently healthy non–morbidly obese kidney transplant donors (all women; age range, 30–55 years; mean [SD] BMI, 25 [3.4] kg/m2).
Preadipocyte Culture
Subcutaneous and omental WAT were digested in parallel and preadipocyte populations were isolated and passaged for 4 subcultures, as previously described (11–13). We found that subculturing and our culture conditions reduced macrophage and endothelial cell contamination: macrophage (Emr-1, CD14, CD11b, MAC-1/Mac-3, CD45) and endothelial (von Willebrand factor, CD31, CD34, CD105/endoglin, vascular endothelial cadherin, Sca-1) markers were not detected in either subcutaneous or omental preadipocytes by mass spectroscopy (MS). No macrophages or endothelial cells, which have a morphologic appearance distinct from preadipocytes, were seen in cultures. In the final subculture, conditioned medium (CM) was prepared from confluent preadipocytes that had been washed 10 times with phosphate-buffered saline, pH 7.4 (Invitrogen), and then maintained serum-free in RPMI medium with 100 U/mL penicillin, 100 µg/mL streptomycin, 4 mM l-glutamine, 1 mM sodium pyruvate, 1% MEM vitamins, and 1% MEM nonessential amino acids.
Sample Preparation
CM was collected after 24-hour incubation and filtered through a 0.2-µm filter to remove cellular debris. The filtrate was concentrated to 5 mL using a 3-kDa–cutoff centrifugal filter unit (Millipore) and desalted with a 6-kDa–cutoff spin column (Thermo Scientific). Protein concentration was assayed by using a Bradford quantification kit (Bio-Rad). Twenty-five µg of protein were loaded and separated on a 4%–15% gradient precast gel (Bio-Rad). Each sample was cut into 6 sections at protein bands that were uniform across the lanes. Each band was then destained by 50% acetonitrile with 50 mM ammonium bicarbonate, reduced with 10 mM dithiothreitol (Sigma), incubated at 56°C for 30 minutes, and then alkylated using 200 mM iodoacetamide (Sigma) in the dark for 30 minutes. The alkylated protein samples were then digested with 500 ng of trypsin (Promega) for 12 hours at 37°C.
Mass Spectroscopy
All MS data were acquired using a nano–liquid chromatography/tandem mass spectroscopy (LC/MS-MS) system and a Finnigan LTQ Orbitrap hybrid mass spectrometer (Thermo-Fisher) with a nanospray ion source connected to a nanoLC-2D pump (Eksigent). Chromatographic separation was performed using a packed tip 150 mm × 75 µm C18 reverse-phase column (Michrom Bioresources) with a 50-minute linear gradient from 5%–60% acetonitrile in 0.1% formic acid at a flow rate of 400 nL/min. Survey scans were acquired in the positive-ion mode over the mass range of 400 to 2,000 m/z at a resolution of 60,000, isolation width of 2.0, normalized collision energy of 35 V, and an activation Q of 0.25. All acquisition and method development was performed using Xcalibur version 3.0.
Protein Identification and Quantification
MS data were imported into the Elucidator software package (Ceiba Solutions) and analyzed using the multidimensional LC-MS workflow. Protein identification was performed using the workflow built into the Elucidator software package with Mascot v2.2 (Matrix Science). The search engine used a Swiss-Prot database (containing reversed sequences) using a precursor ion tolerance of 20 ppm and a fragment ion tolerance of 0.6 Da with strict tryptic specificity allowing for a maximum of 2 missed cleavage sites. Mass raw data were analyzed statistically by analysis of variance (ANOVA), where only high-quality features were used, as determined by time and m/z scores higher than 0.75 and 0.8, respectively, and peak time width >0.1 min. A list of differentially expressed proteins was selected by performing a 2-group, 1-way ANOVA comparing subcutaneous and omental preadipocytes with a P-value cut-off of 0.001. NanoLC/MS-MS data (raw files and Elucidator output) were deposited at ProteomeCommons.org (http://proteomecommons.org/tranche/), from which they may be downloaded using the following hash codes: LC/MS-MS raw files: ioykFugjEzcbarhs3XskQ3xxTdhMimbqDxPOjQfKOH/SDhZXitegE79dcHVu1g6lbp4WdD7C2bDYDadmsZ9ZZ3p+KWUAAAAAAACAnQ== and Elucidator Output: 2ek37ppmmpJKiL0F4b3oRP+hjvMwe8G3oLE01/KO8tWYLZs4ozL/Wori0H2xPr4PYYUwtuc98xuAwymH25f7qEVvvKUAAAAAAAAJTA==.
Enzyme-Linked Immunosorbent Assays
Concentrations of differentially secreted proteins (monocyte chemoattractant protein-1 [MCP-1]; chemokine [C-C motif] ligand-5 [CCL5]; retinoic acid receptor responder 2 [RARRES2]; interleukin [IL]-6; and IL-8) were analyzed by quantitative enzyme-linked immunosorbent assays (ELISA) of CM using commercial kits (Invitrogen).
Chemotaxis Assay
Cellular chemotaxis assays were performed using disposable 12-well Transwell polycarbonate membrane inserts with 3-µm pore diameter (Corning). One mL of CM was plated directly into the bottom wells of the plate in triplicate. Serum-free media were plated directly into the wells as a negative control. For antibody-blocking chemotaxis assays, 2 µg/mL of human MCP-1 affinity-purified polyclonal antibody (R&D Systems), 1 µg/mL of human CCL5 monoclonal antibody (R&D Systems), 3 µg/mL human IL-6 monoclonal antibody (Clone 1936; R&D Systems), and 1 µg/mL RARRES2 MaxPab rabbit polyclonal antibody against full-length human RARRES2 (Abnova) were used for neutralization. The CM was pre-incubated with antibodies for 30 min at 37°C (5% CO2). THP-1 cells (1×10⁶; ATCC) or human peripheral blood mononuclear cells (HPBMC; Lonza), both of which are models of human monocytes, were placed onto each chamber. The monocytes were allowed to migrate into the lower chamber for 6 hours at 37°C (5% CO2). CM was then centrifuged at 150×g for 6 minutes and the supernatants were removed. The cells were quantified by a CyQUANT cell proliferation assay kit (Invitrogen). Chemotaxis index was calculated using the following equation: Chemotaxis index = (number of monocytes in the wells of the plate − control)/total number of monocytes seeded in the top of the chamber.
Western Blotting
Total protein lysates (50 µg) were quantified using Bio-Rad Protein Assay Kit I, separated by sodium dodecyl sulfate–polyacrylamide gel electrophoresis in 4%–15% gels, and transferred to immunoblot polyvinylidene fluoride membranes (Bio-Rad) that were incubated (1 hour at room temperature) in Tris-buffered saline containing 5% bovine serum albumin (Sigma) and 0.1% Tween 20, then overnight at 4°C with antibodies against JAK1, phospho-JAK1, JAK2, and phospho-JAK2 (rabbit; 1:2,000 dilution; Cell Signaling). Horseradish peroxidase-linked secondary antibodies (Santa Cruz) were detected using a kit (Supersignal West Pico Chemiluminescent Substrate Kits; Pierce).
Pathway Analysis
The protein list was first narrowed by considering secreted proteins containing signal peptides using SecretomeP3.0 (21). The log2 fold-change ratios (subcutaneous/omental) for WAT depot–dependent secretome data were then imported into pathway analysis software (Metacore; GeneGo).
Clustering Analysis
Geometric means and fold changes were calculated for clustering analysis. Clustering analysis was performed using R version 2.10.0. Distance matrix was computed by R function “dist.” Hierarchical clustering was performed by R function “hclust” along both tissue types and proteins. Dendrograms were added along the rows or columns. The original data values are displayed in bicolor style.
Statistical Analysis
Paired Student t tests were used for within-subject comparisons of chemotaxis in subcutaneous and omental preadipocytes. The effects of blocking chemoattractants and IL-6 using antibodies and the effects of pharmacologically inhibiting JAK were first determined by 1-way ANOVA followed by Bonferroni or Duncan multiple range post hoc testing. Differences were considered significant when P<.05. All data are expressed as mean (SEM).
Results
Secretory Phenotypes of Subcutaneous and Omental Preadipocytes Are Distinct
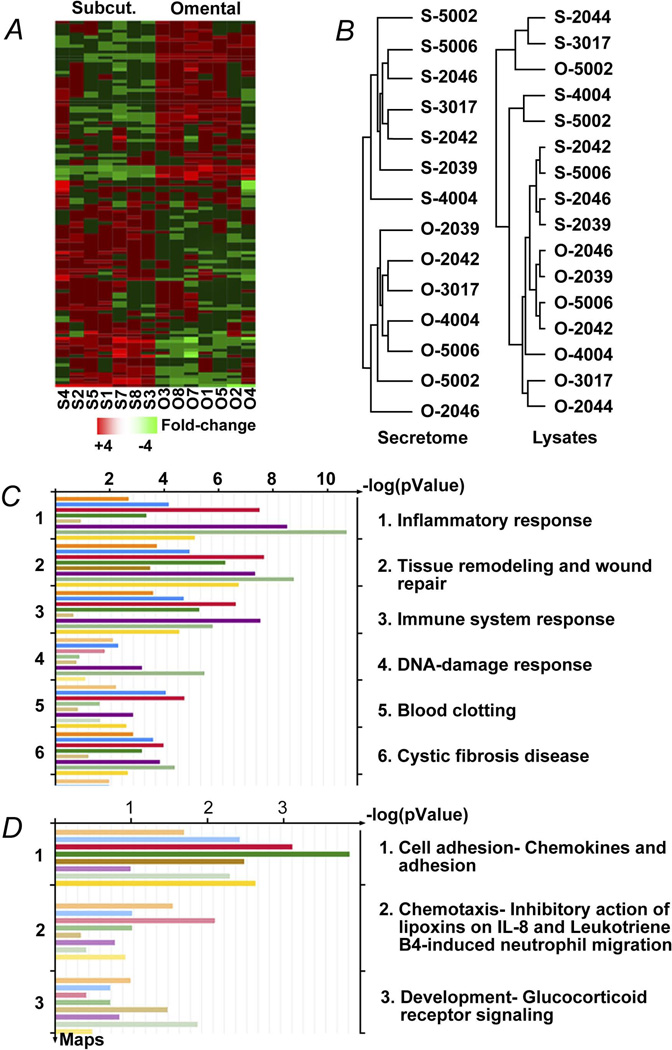
Pairs of omental and subcutaneous preadipocytes from 8 female, middle-aged, obese subjects undergoing elective surgery were cultured in parallel for 4 population doublings to reduce potential effects of regional variation in circulation, nutrient supply, or innervation under conditions in which other cell types, including macrophages and endothelial cells, were excluded from cultures. One hundred twenty-two differentially secreted proteins (Table S1) were identified by MS analysis of medium in which cells were cultured (Figure 1A; >1.5-fold difference; false discovery rate–adjusted P value [FDR] <.05). The secreted-protein profiles of subcutaneous preadipocytes were similar across subjects, as were omental secretory profiles (Figure 1B; unsupervised centroid linkage hierarchical clustering analysis of proteins with >1.5-fold differences; 1-way ANOVA; P<.005; FDR<0.05 between the 2 WAT depots in 8 subjects). Conversely, in the case of protein lysates, differences between subjects were more pronounced than those between WAT depots (Figure 1B), indicating that secreted proteins, in aggregate, differ among depots to a greater extent than intracellular proteins. Chemotaxis and inflammation figured prominently among the biological functions of the secreted proteins that differed between depots (Figure 1C; Metacore pathway analysis). Macrophage and endothelial cell markers were not detected in subcutaneous or omental cultures, nor were cells with morphologic characteristics of endothelial cells or macrophages (see Materials and Methods).
Figure 1.
The secretome of human omental preadipocytes is distinct from subcutaneous cells. A, Profiles of 122 proteins that were secreted differentially between subcutaneous and omental preadipocytes by at least 1.5-fold and had a significant FDR (<0.05) were organized by unsupervised centroid linkage hierarchical clustering analysis across depots, subjects, and genes. Each lane (column) represents a different depot and subject. Lanes are ordered from left to right in an unsupervised manner that is based on aligning lanes with the most similar expression profiles adjacent to each other. Similarly, rows (each representing a gene across subjects and depots) were ordered in an unsupervised manner, so each aligns with genes with the most similar expression profiles in rows above and below. Higher expression is shown in red and lower expression in green (z-scored expression relative to the means for each protein across all subjects and depots). Protein names are in Table S1. B, Subcutaneous and omental preadipocytes sorted into 2 distinct groups by hierarchical clustering analysis of their secreted protein profiles, but this was not the case for protein profiles from lysates. Dendrograms developed by unsupervised centroid linkage hierarchical clustering analysis of CM (secretome) showed intracellular (lysates) proteins that were significantly different (>1.5-fold change) between depots (n=8 subjects; P<.005; FDR<0.05; ANOVA). C–D, Inflammatory processes were among the biologic functions most closely associated with the proteins differentially secreted between depots. Pathway candidates were generated from fold changes and P values of differences between proteins secreted by omental and subcutaneous preadipocytes (Metacore GeneGo analysis). Each bar represents an individual subject and the length of each bar represents significance (−log P value). Images are GeneGo Canonical Pathway Maps histograms after enrichment analysis of proteins that passed threshold and P-value filters (P<−log3). The 3 most significantly enriched GeneGo biological processes involved differences between depots. ANOVA denotes analysis of variance; CM, conditioned medium; ELISA, enzyme-linked immunosorbent assay; FDR, false discovery rate–adjusted P value; JAK, Janus-activated kinase; O, omental; S (Subcut.), subcutaneous.
Omental Preadipocytes Induce More Monocyte/Macrophage Chemoattraction Than Subcutaneous Cells
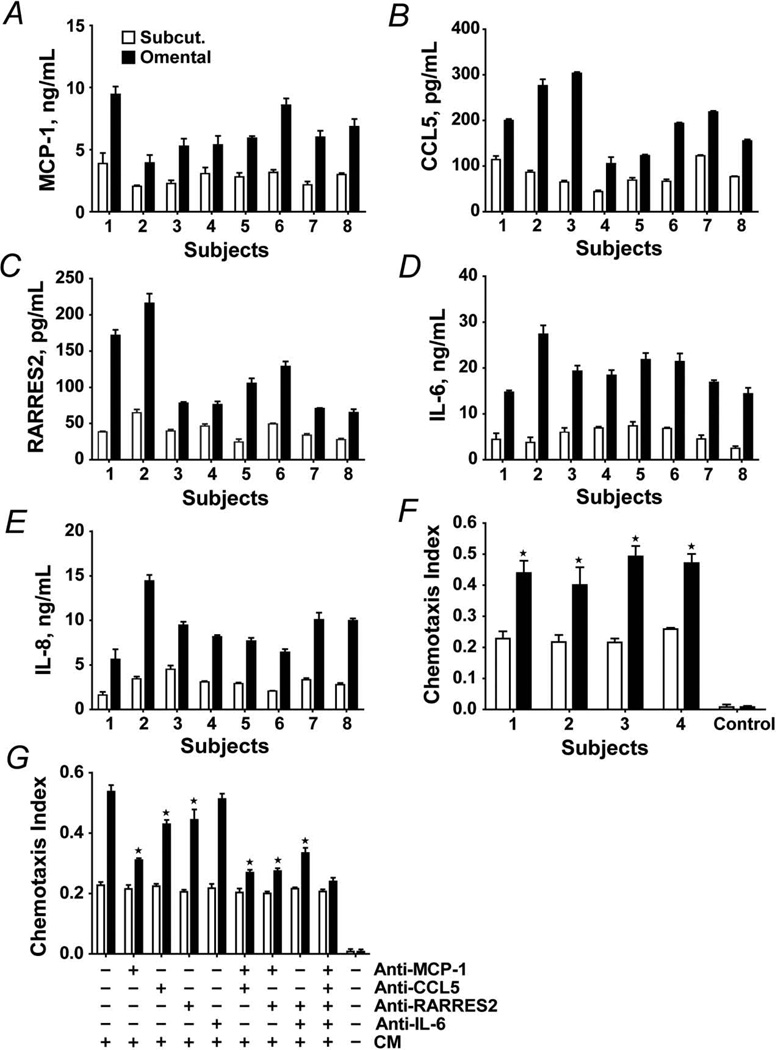
Among the proteins upregulated in omental preadipocytes were the inflammatory cytokines and chemokines MCP-1, IL-6, IL-8, CCL5, and RARRES2, which are involved in regulating inflammation, hemostasis, and recruitment and activation of macrophages. Increased secretion of these pro-inflammatory proteins by omental preadipocytes was confirmed by ELISA (Figure 2A–E). Secretion of the macrophage chemokines MCP-1, CCL5, and RARRES2 was 2.4 (0.3)–fold, 2.6 (0.8)–fold, and 2.9 (1.0)–fold greater, respectively, in omental than subcutaneous preadipocytes cultured in parallel from the 8 subjects (P<.005 for each chemokine; 1-way ANOVA and Duncan multiple range test). Secretion of the inflammatory cytokines IL-6 and IL-8 was markedly distinct between depots, being 4.1 (1.2)–fold and 3.1 (0.5)–fold greater, respectively, in omental cells (P<.05 for both; 1-way ANOVA).
Figure 2.
Chemoattraction of THP-1 and human peripheral blood–derived monocytes, both models of macrophages, by omental preadipocytes is greater than by subcutaneous preadipocytes. A–E, Omental preadipocyte macrophage chemokine secretion is greater than that of subcutaneous cells. Subcutaneous (open bars) and omental (solid bars) preadipocytes were cultured in serum-free CM for 24 hours when supernatants were analyzed by ELISA. Results are means ± SEM (n=4 subjects; 3 replicates). F, Chemotaxis of human primary blood-derived mononuclear cells was greater in response to CM from subcutaneous (open bars) than omental (solid bars) preadipocytes. G, Chemotaxis of THP-1 cells in response to CM from subcutaneous and omental preadipocytes that were pre-incubated with neutralizing antibodies to MCP-1 (5 µg/mL), CCL5 (5 µg/mL), RARRES2 (5 µg/mL), IL-6 (10 µg/mL), their combinations, or vehicle. Means ± SEM of 4 subjects are shown. Asterisks indicate P<0.05 by ANOVA and Duncan test. Abbreviations are defined in the Figure 1 legend.
Next, we tested if monocyte/macrophage chemotaxis induced by omental preadipocytes differed from that of subcutaneous cells using an in vitro chemotaxis assay and 2 different culture models of human macrophages, THP-1 cells and HPBMC (Figure 2F, 2G). The chemotactic response of both HPBMC and THP1 human monocytes was 2-fold greater upon exposure to omental than subcutaneous preadipocyte-CM (HPBMC: n=4 subjects; P<.05 [Figure 2F]; THP1 cells: n=4 subjects; P<.05; 1-way ANOVA and Duncan test [Figure 2G]). Neutralizing antibodies to MCP-1, CCL5, RARRES2, IL-6, and their combinations were added to CM (Figure 2G). Migration was inhibited by antibodies to MCP-1, CCL5, and RARRES2 but was affected little by anti–IL-6. Among the neutralizing antibodies, anti–MCP-1 was most effective, with chemotaxis being reduced around 40% (P<.05). Anti-CCL5 and anti-RARRES2 blocked chemotaxis by 5%–10% (both P<.05). Thus, MCP-1 appears to be particularly important in the induction of monocyte/macrophage migration by omental preadipocytes.
IL-6 Enhances Chemokine Secretion by Subcutaneous Preadipocytes
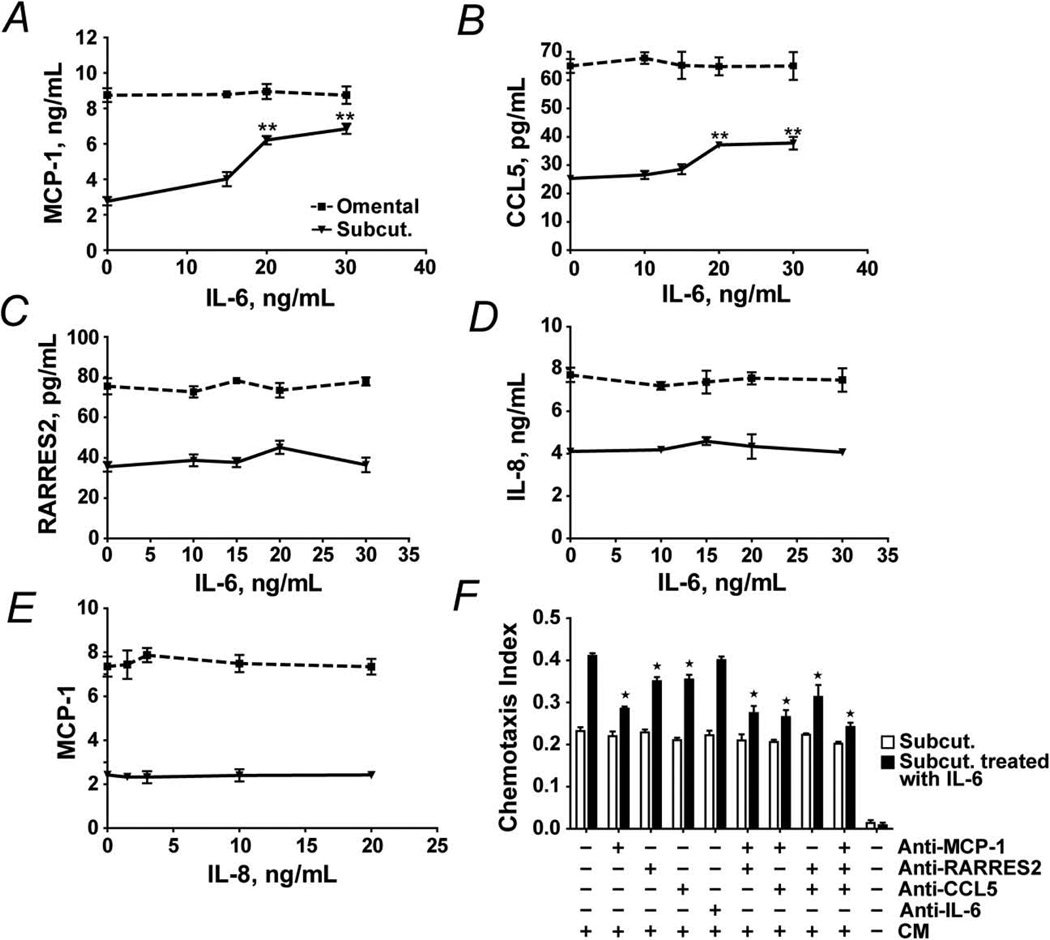
Secretion of IL-6 was greater in omental than subcutaneous preadipocytes from all 8 subjects. We examined the effect of exposure to exogenous IL-6 or IL-8 on preadipocyte protein secretion (Figure 3A–E). After exposing subcutaneous preadipocytes to different concentrations of IL-6 or IL-8 for 18 hours, MCP-1, CCL5, and RARRES2 were analyzed in CM by ELISA. MCP-1 secretion increased up to 2.5-fold after exposure to IL-6 in a dose-dependent manner. CCL5 increased in a dose-dependent manner as well. RARRES2 secretion was not significantly increased by IL-6. IL-8 did not increase MCP-1 significantly (Figure 3E). In addition to inducing secretion of MCP-1 and CCL5 by subcutaneous preadipocytes, IL-6 treatment of subcutaneous preadipocytes enhanced their capacity to attract monocytes/macrophages by almost 2-fold (Figure 3F). This chemoattraction was blunted by neutralizing antibodies to MCP-1, CCL5, and their combination, particularly by anti–MCP-1. Thus, IL-6 made subcutaneous preadipocytes resemble omental preadipocytes with respect to chemokine release and monocyte/macrophage chemoattraction.
Figure 3.
IL-6 stimulates chemokine production and THP-1 cell diapedesis by subcutaneous preadipocytes. A–D, MCP-1, CCL5, RARRES2, and IL-8 secreted by subcutaneous and omental preadipocytes exposed to various IL-6 concentrations for 18 hours were assayed by ELISA. E, MCP-1 secreted by subcutaneous and omental preadipocytes exposed to various IL-8 concentrations for 18 hours was assayed by ELISA. Results are means ± SEM (n=8 subjects; 3 replicates/subject; double asterisks indicate P<.01; ANOVA and Duncan test). F, IL-6 induces THP-1cell attraction in subcutaneous preadipocytes. Chemotaxis assays were performed with THP-1 cells in response to CM from IL-6 treated (15 ng/mL for 18 hours) and untreated subcutaneous preadipocytes. CM was pre-incubated with neutralizing antibodies to: MCP-1 (5 µg/mL), CCL5 (5 µg/mL), RARRES2 (5 µg/mL), IL-6 (10 µg/mL), their combinations, or vehicle. Results are means ± SEM (n=4 subjects; asterisks indicate P<.05; ANOVA and Duncan test). Abbreviations are defined in the Figure 1 legend.
More JAK in Omental Preadipocytes and WAT
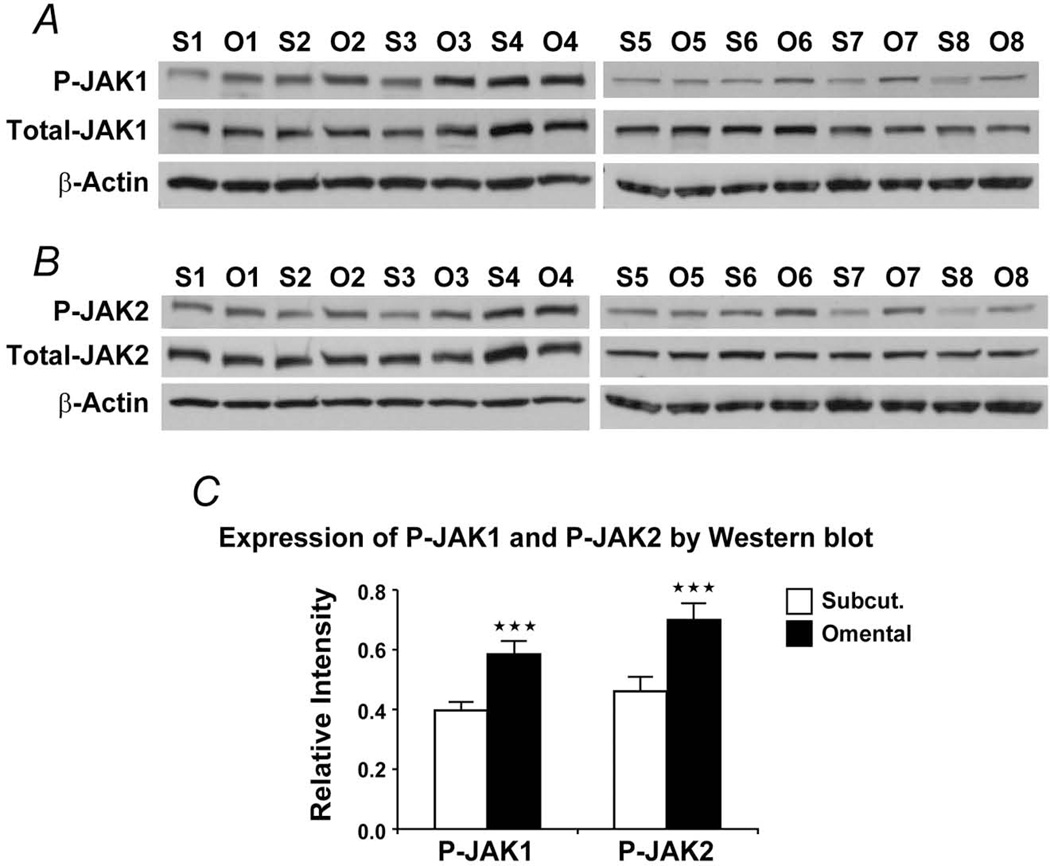
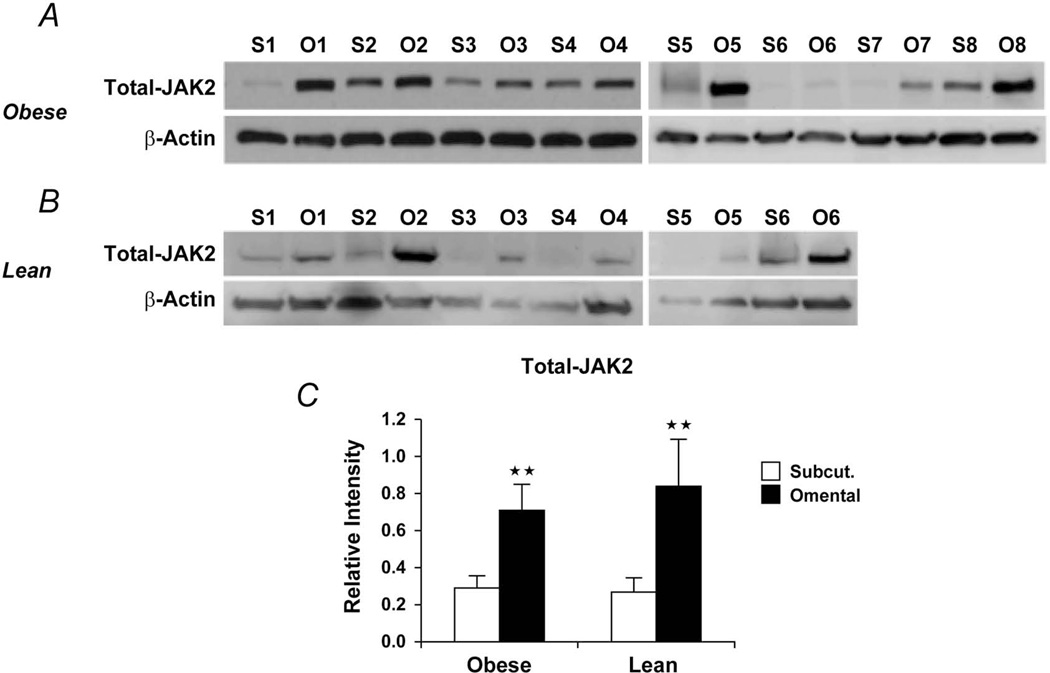
As shown above, omental preadipocytes secreted more IL-6 than subcutaneous cells. JAK kinases are activated by IL-6 and mediate IL-6 effects. We assayed JAK in lysates of omental and subcutaneous preadipocytes cultured from 8 obese subjects. Both the total and phosphorylated forms of JAK1/2 were greater in omental than subcutaneous preadipocytes (Figure 4). We next assayed protein extracts from intact WAT from both lean and obese subjects (Figure 5). Total JAK2 was higher in omental than subcutaneous WAT from obese subjects (Figure 5C), and total JAK1 tended to be higher in omental WAT, although not significantly (Figure S1). As in obese subjects, total JAK2 was significantly higher in omental than subcutaneous WAT from lean subjects (Figure 5C).
Figure 4.
JAK is higher in omental than subcutaneous preadipocytes. A–B, Total and phosphorylated JAK1 and JAK2 were assayed by Western blot (phospho-Jak1 [Tyr1022/1023]; phospho-Jak2 [Tyr1007/1008]). S1 represents subcutaneous preadipocytes from subject 1, whereas O1 represents omental preadipocytes from subject 1. This pattern was maintained for all 8 subjects. C, Densitometric values of the phosphorylated JAK isoforms, expressed as a function of total JAK, obtained after densitometry of the bands are means ± SEM; β-actin bands were used as loading controls for each sample; triple asterisks indicate P<.01; 2-way ANOVA). Abbreviations are defined in the Figure 1 legend.
Figure 5.
A, Total JAK2 was higher in visceral fat tissue lysates from 8 morbidly obese women (age, 46±5.0 years; body mass index, 45±6.4 kg/m2). B, Total JAK2 was higher in visceral fat tissue lysates from 6 non–morbidly obese, healthy women (age, 42±5.0 years; body mass index, 25±3.4 kg/m2). C, Densitometric values of the total JAK2 (values for relative intensity obtained after densitometry of the bands are means ± SEM; double asterisks indicate P<.01; 2-way ANOVA). Abbreviations are defined in the Figure 1 legend.
JAK Inhibition Suppresses Chemotactic Activity of Omental Preadipocytes
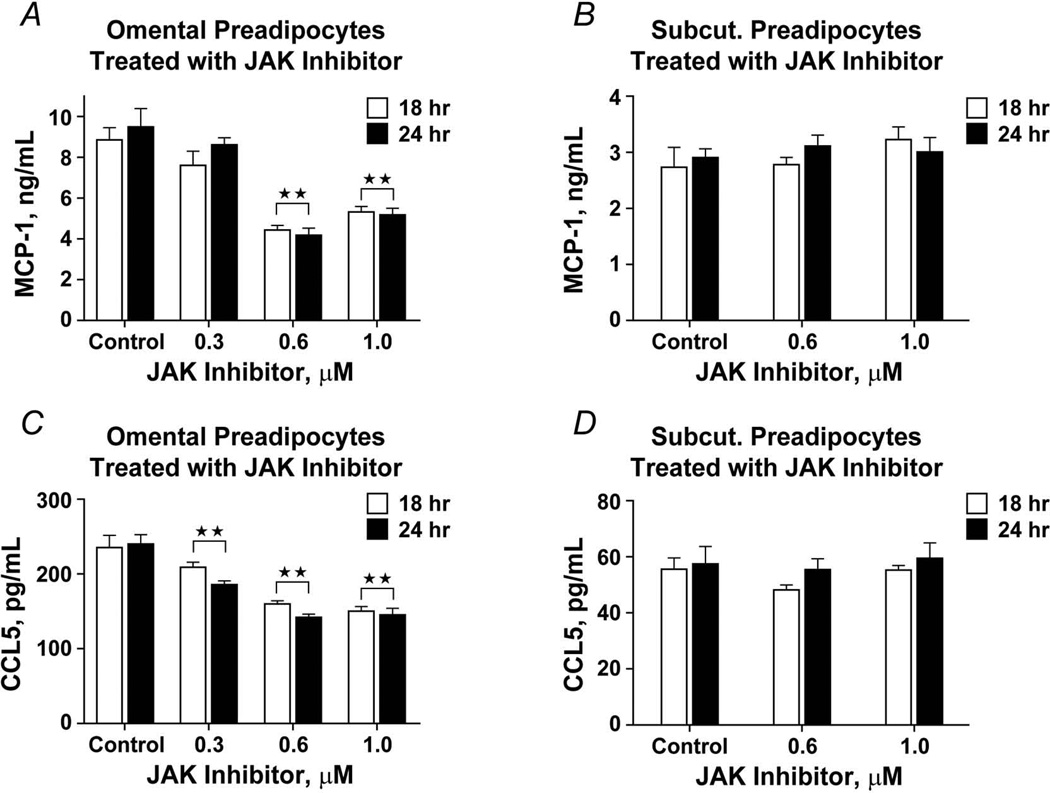
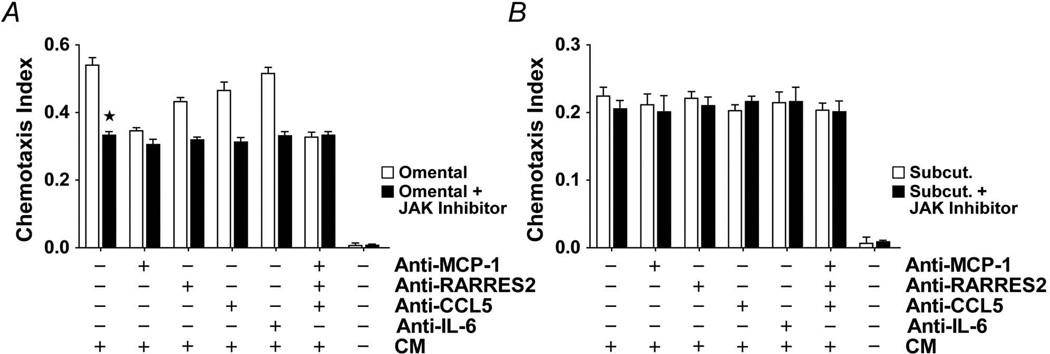
Omental and subcutaneous preadipocytes were exposed to a JAK1/2 inhibitor (Insolution JAK inhibitor I) for 18 or 24 hours, after which secreted MCP-1, CCL5, and RARRES2 were assayed by ELISA (Figure 6). At the highest concentration of the JAK1/2 inhibitor, omental preadipocyte MCP-1 and CCL5 secretion was reduced by 50% and 36%, respectively. Unlike omental preadipocytes, JAK inhibition had no significant effect on either MCP-1 or CCL5 production by subcutaneous cells. As was found after IL-6 treatment, RARRES2 was not significantly affected by JAK inhibition, suggesting that RARRES2 might be regulated through a different signaling mechanism. Exposure of omental preadipocytes to the JAK inhibitor (180 ng/mL for 18 hours) blunted monocyte/macrophage chemoattraction by 40% (Figure 7; n=4 subjects; P<.05; 1-way ANOVA and Duncan test). This was not further blunted by treatment with neutralizing antibodies against MCP-1, CCL5, RARRES2, or IL-6 individually or in combination.
Figure 6.
JAK1/2 inhibition decreases macrophage chemokine secretion by omental preadipocytes. A–B, Omental and subcutaneous preadipocytes were incubated with different concentrations of a JAK inhibitor (Calbiochem type 1) for 18 hours (open bars) or 24 hours (solid bars) when MCP-1 in CM was assayed (ELISA). C-D, CCL5 was also assayed in omental and subcutaneous preadipocytes that were incubated with different concentrations of the JAK inhibitor. Both MCP-1 and CCL5 secretion by omental preadipocytes was decreased by JAK inhibitor treatment, but no statistically significant effect on subcutaneous preadipocytes was seen (n=4 subjects; double asterisks indicate P<.01; 1-way ANOVA). Abbreviations are defined in the Figure 1 legend.
Figure 7.
A–B, JAK inhibition suppresses monocyte/macrophage chemoattraction by omental but not subcutaneous preadipocytes. THP-1 cell chemotaxis was assayed in response to CM from JAK inhibitor-treated (0.18 µg/mL) or vehicle-treated preadipocytes. CM was pre-incubated with neutralizing antibodies to MCP-1 (5 µg/mL), CCL5 (5 µg/mL), RARRES2 (5 µg/mL), IL-6 (10 µg/mL), their combinations, or vehicle. Monocyte/macrophage chemotaxis by omental preadipocytes was reduced by JAK inhibitor pretreatment, although omental chemotaxis remained greater than chemotaxis by subcutaneous cells. Neutralizing antibodies did not further reduce monocyte/macrophage chemoattraction by JAK inhibitor–treated omental preadipocytes. Means ± SEM are shown (n=4 subjects; asterisk indicates P<.05; ANOVA and Duncan test). Abbreviations are defined in the Figure 1 legend.
Discussion
Preadipocytes from different WAT depots have distinct capacities for replication, differentiation, and susceptibility to apoptosis; they also differ in gene expression profiles, particularly developmental genes (12–14). These differences remain evident in strains made from single human preadipocytes (by expressing telomerase), even after 40 population doublings (12), indicating that preadipocytes from different depots are inherently distinct. Macrophage infiltration is usually more pronounced in omental than subcutaneous WAT in obese adults (7–9,22). Of note, WAT macrophage abundance is associated with obesity-related pathologies (2,23).
We showed that preadipocytes isolated from the subcutaneous and omental depots of the same subjects in parallel retained marked differences in secreted peptide profiles in culture. This was even evident after 4 subcultures, suggesting that the differences may be cell-autonomous. A few proteins detected in the culture medium are usually considered to be intracytoplasmic, consistent with the cell lysis that generally occurs in culture, but they may also indicate the potential presence of secreted exosomes (24). Omental cells produced more collagens, matrix metalloproteinases, and other tissue remodeling–related secreted proteins than subcutaneous cells. In particular, omental cells were more pro-inflammatory, with greater production of monocyte/macrophage chemokines and induction of monocyte/macrophage migration. In addition to preadipocytes, mature adipocytes can attract monocytes/macrophages through chemokine secretion or possibly through adipocyte death and release of triglycerides (25,26). However, MCP-1 and other genes involved in chemoattraction are much more highly expressed in the stromal-vascular fraction, which includes preadipocytes, than in adipocyte fractions of WAT digests (27).
Dying adipocytes have been associated with “crown-like structures,” in which macrophages surround the necrotic cell (28). However, preventing adipocyte necrosis by knocking out cyclophilin D in mice does not prevent high-fat diet–induced WAT inflammation, monocyte/macrophage infiltration, or glucose intolerance (29). Conversely, preventing macrophage infiltration into WAT using genetic or pharmacologic interventions does not prevent adipocyte necrosis, but it does prevent inflammation and insulin resistance. This suggests that an upstream mechanism contributes to monocyte/macrophage infiltration in obesity, perhaps more so than any effects of adipocyte necrosis. Our finding that interdepot variation in preadipocyte chemokine secretion correlates with regional differences in macrophage abundance supports the hypothesis that inherent differences in preadipocyte chemokine production contribute to regional variation in macrophages. Possibly, other cell types normally resident in WAT (eg, endothelial cells) might also contribute, together with regional differences in fat-cell breakdown and lipid release.
Our data suggest that a preadipocyte IL-6/JAK mechanism contributes to regional variation in macrophage accumulation. Treating subcutaneous preadipocytes with IL-6, which is secreted to a greater extent by omental than subcutaneous preadipocytes, induced a secretory phenotype resembling that of omental preadipocytes. Inhibition of omental preadipocyte JAK activity, which reduced IL-6 signaling, induced a phenotype in subcutaneous preadipocytes resembling that of omental cells. Furthermore, JAK2 expression was higher in visceral than subcutaneous WAT from both morbidly obese and non–morbidly obese, healthy subjects. The IL-6/JAK mechanism may not depend on secretion of IL-6 because IL-6 antibodies did not decrease omental preadipocyte-induced monocyte/macrophage diapedesis, whereas JAK1/2 inhibitors did. This is reminiscent of the finding that a nonsecreted, autocrine IL-6 loop mediates the pro-inflammatory secretory phenotype of senescent cells (30).
Whether the greater pro-inflammatory state of omental than subcutaneous WAT actually contributes to metabolic dysfunction is controversial. Portal drainage from omental WAT delivers inflammatory cytokines to the liver, thereby contributing to glucose intolerance (31). However, recent work indicates that removal of omental WAT from obese patients without type 2 diabetes mellitus had no significant effect on insulin sensitivity during 6 months of observation (32,33). Another study suggested that omentectomy has long-term positive effects on glucose disposal and insulin sensitivity, although this was in combination with gastric banding (34). Surgical removal of the greater omentum from nonobese dogs suggested a tendency to improve insulin sensitivity (35). Furthermore, surgical removal of intra-abdominal WAT in early life from rodents improved their insulin sensitivity in later life, indicating that visceral WAT removal before morbidity onset might have beneficial effects (36,37). However, in rodents, intra-abdominal depots are not drained through the portal circulation, unlike some of the visceral depots in humans. It may be exceedingly difficult to use surgical approaches to understand the pathogenic role of visceral WAT from clinical studies because humans have 2 visceral WAT depots, mesenteric and omental, and only omental WAT is easily removed.
Subcutaneous WAT dysfunction contributes to obesity-related metabolic disease because normally functioning subcutaneous WAT appears to be metabolically protective, at least in mice (38). Transplanting subcutaneous WAT into visceral or subcutaneous regions was associated with improved insulin responsiveness, whereas transplanting visceral WAT was without effect in mice (38). Thus, although it is clear that omental WAT generally contains more pro-inflammatory elements than subcutaneous WAT, particularly in obesity, the precise role of visceral WAT in causing the metabolic disease associated with obesity is uncertain.
In summary, the secretomes of subcutaneous and omental preadipocytes are distinct, with omental preadipocytes possessing a greater pro-inflammatory phenotype. The pro-inflammatory phenotype of omental preadipocytes induces more monocyte/macrophage infiltration than subcutaneous preadipocytes, which might contribute to the greater metabolic risk associated with central adiposity. An IL-6/JAK pathway appears to contribute to regional variation in WAT macrophage abundance, and it therefore is a possible target for therapeutic intervention.
Supplementary Material
What is already known about this subject.
Macrophage accumulation and excess visceral white adipose tissue (WAT) are associated with metabolic dysfunction.
WAT expresses and secretes an array of autocrine, paracrine, and endocrine factors.
Preadipocytes from different depots vary in their replication and differentiation capacities.
What this study adds
The secretomes of omental and subcutaneous preadipocytes are distinct.
Inherent differences in omental and subcutaneous preadipocyte secretomes contribute to variation in WAT inflammation and macrophage accretion.
The mechanisms responsible for macrophage chemoattraction occur in part through IL-6/JAK-mediated signaling.
Acknowledgments
We are grateful for the assistance of Ms. Linda Wadum and Jacqueline L. Armstrong. The Proteomics Core is supported by Mr. and Mrs. Gordon C. Gilroy, the David Woods Kemper Memorial Foundation, and the Mayo Clinic College of Medicine. This work was funded by the Ted Nash Foundation, the National Institutes of Health AG31736 (J.L.K.), AG13925 (J.L.K.), AG41122 (J.L.K.), DK50456 (J.L.K. and M.D.J.), DK40484 (M.D.J.), the Ellison Foundation, INSERM (A.B.), and the Noaber Foundation.
Abbreviations
- ANOVA
analysis of variance
- BMI
body mass index
- CM
conditioned medium
- ELISA
enzyme-linked immunosorbent assay
- FDR
false discovery rate–adjusted P value
- HPBMC
human peripheral blood mononuclear cells
- IL
interleukin
- JAK
Janus-activated kinase
- LC
liquid chromatography
- MEM
minimal essential Eagle’s medium
- MS
mass spectroscopy
- MS-MS
tandem mass spectroscopy
- RPMI
Roswell Park Memorial Institute
- WAT
white adipose tissue
Footnotes
Author Contributions
Y.Z., T.T., M.B.S., J.L.K.: Concept generation, manuscript writing, editing, studies in the table and figures. N.G., L.W., P.L., C.J.H.H.: Studies in the table and figures. A.B., M.D.J., R.B.: Studies in table and figures and reviewed the manuscript.
Conflict of Interest
The authors declare no conflict of interest.
References
- 1.Dandona P, Aljada A, Bandyopadhyay A. Inflammation: the link between insulin resistance, obesity and diabetes. Trends Immunol. 2004 Jan;25(1):4–7. doi: 10.1016/j.it.2003.10.013. [DOI] [PubMed] [Google Scholar]
- 2.Chawla A, Nguyen KD, Goh YP. Macrophage-mediated inflammation in metabolic disease. Nat Rev Immunol. 2011 Oct 10;11(11):738–749. doi: 10.1038/nri3071. [DOI] [PMC free article] [PubMed] [Google Scholar]
- 3.Carr DB, Utzschneider KM, Hull RL, Kodama K, Retzlaff BM, Brunzell JD, et al. Intra-abdominal fat is a major determinant of the National Cholesterol Education Program Adult Treatment Panel III criteria for the metabolic syndrome. Diabetes. 2004 Aug;53(8):2087–2094. doi: 10.2337/diabetes.53.8.2087. [DOI] [PubMed] [Google Scholar]
- 4.Goodpaster BH, Krishnaswami S, Harris TB, Katsiaras A, Kritchevsky SB, Simonsick EM, et al. Obesity, regional body fat distribution, and the metabolic syndrome in older men and women. Arch Intern Med. 2005 Apr 11;165(7):777–783. doi: 10.1001/archinte.165.7.777. [DOI] [PubMed] [Google Scholar]
- 5.Goodpaster BH, Krishnaswami S, Resnick H, Kelley DE, Haggerty C, Harris TB, et al. Association between regional adipose tissue distribution and both type 2 diabetes and impaired glucose tolerance in elderly men and women. Diabetes Care. 2003 Feb;26(2):372–379. doi: 10.2337/diacare.26.2.372. [DOI] [PubMed] [Google Scholar]
- 6.Miyazaki Y, Glass L, Triplitt C, Wajcberg E, Mandarino LJ, DeFronzo RA. Abdominal fat distribution and peripheral and hepatic insulin resistance in type 2 diabetes mellitus. Am J Physiol Endocrinol Metab. 2002 Dec;283(6):E1135–E1143. doi: 10.1152/ajpendo.0327.2001. [DOI] [PubMed] [Google Scholar]
- 7.Cancello R, Tordjman J, Poitou C, Guilhem G, Bouillot JL, Hugol D, et al. Increased infiltration of macrophages in omental adipose tissue is associated with marked hepatic lesions in morbid human obesity. Diabetes. 2006 Jun;55(6):1554–1561. doi: 10.2337/db06-0133. [DOI] [PubMed] [Google Scholar]
- 8.Harman-Boehm I, Bluher M, Redel H, Sion-Vardy N, Ovadia S, Avinoach E, et al. Macrophage infiltration into omental versus subcutaneous fat across different populations: effect of regional adiposity and the comorbidities of obesity. J Clin Endocrinol Metab. 2007 Jun;92(6):2240–2247. doi: 10.1210/jc.2006-1811. Epub 2007 Mar 20. [DOI] [PubMed] [Google Scholar]
- 9.Zhang HM, Chen LL, Wang L, Xu S, Wang X, Yi LL, et al. Macrophage infiltrates with high levels of Toll-like receptor 4 expression in white adipose tissues of male Chinese. Nutr Metab Cardiovasc Dis. 2009 Dec;19(10):736–743. doi: 10.1016/j.numecd.2008.12.016. Epub 2009 Apr 8. [DOI] [PubMed] [Google Scholar]
- 10.Ouchi N, Parker JL, Lugus JJ, Walsh K. Adipokines in inflammation and metabolic disease. Nat Rev Immunol. 2011 Feb;11(2):85–97. doi: 10.1038/nri2921. Epub 2011 Jan 21. [DOI] [PMC free article] [PubMed] [Google Scholar]
- 11.Tchkonia T, Giorgadze N, Pirtskhalava T, Tchoukalova Y, Karagiannides I, Forse RA, et al. Fat depot origin affects adipogenesis in primary cultured and cloned human preadipocytes. Am J Physiol Regul Integr Comp Physiol. 2002 May;282(5):R1286–R1296. doi: 10.1152/ajpregu.00653.2001. [DOI] [PubMed] [Google Scholar]
- 12.Tchkonia T, Giorgadze N, Pirtskhalava T, Thomou T, DePonte M, Koo A, et al. Fat depot-specific characteristics are retained in strains derived from single human preadipocytes. Diabetes. 2006 Sep;55(9):2571–2578. doi: 10.2337/db06-0540. [DOI] [PubMed] [Google Scholar]
- 13.Tchkonia T, Lenburg M, Thomou T, Giorgadze N, Frampton G, Pirtskhalava T, et al. Identification of depot-specific human fat cell progenitors through distinct expression profiles and developmental gene patterns. Am J Physiol Endocrinol Metab. 2007 Jan;292(1):E298–E307. doi: 10.1152/ajpendo.00202.2006. Epub 2006 Sep 19. [DOI] [PubMed] [Google Scholar]
- 14.Yamamoto Y, Gesta S, Lee KY, Tran TT, Saadatirad P, Kahn CR. Adipose depots possess unique developmental gene signatures. Obesity (Silver Spring) 2010 May;18(5):872–878. doi: 10.1038/oby.2009.512. Epub 2010 Jan 28. Erratum in: Obesity (Silver Spring). 2010 May;18(5):1064. [DOI] [PMC free article] [PubMed] [Google Scholar]
- 15.Tchkonia T, Thomou T, Zhu Y, Karagiannides I, Pothoulakis C, Jensen MD, et al. Mechanisms and metabolic implications of regional differences among fat depots. Cell Metab. 2013 May 7;17(5):644–656. doi: 10.1016/j.cmet.2013.03.008. Epub 2013 Apr 11. [DOI] [PMC free article] [PubMed] [Google Scholar]
- 16.Tchkonia T, Morbeck DE, Von Zglinicki T, Van Deursen J, Lustgarten J, Scrable H, et al. Fat tissue, aging, and cellular senescence. Aging Cell. 2010 Oct;9(5):667–684. doi: 10.1111/j.1474-9726.2010.00608.x. Epub 2010 Aug 15. [DOI] [PMC free article] [PubMed] [Google Scholar]
- 17.Gustafson B. Adipose tissue, inflammation and atherosclerosis. J Atheroscler Thromb. 2010 Apr 30;17(4):332–341. doi: 10.5551/jat.3939. Epub 2010 Feb 3. [DOI] [PubMed] [Google Scholar]
- 18.Olefsky JM, Glass CK. Macrophages, inflammation, and insulin resistance. Annu Rev Physiol. 2010;72:219–246. doi: 10.1146/annurev-physiol-021909-135846. [DOI] [PubMed] [Google Scholar]
- 19.Vachharajani V, Granger DN. Adipose tissue: a motor for the inflammation associated with obesity. IUBMB Life. 2009 Apr;61(4):424–430. doi: 10.1002/iub.169. [DOI] [PMC free article] [PubMed] [Google Scholar]
- 20.Valtonen MK, Laaksonen DE, Laukkanen JA, Tolmunen T, Viinamaki H, Lakka HM, et al. Low-grade inflammation and depressive symptoms as predictors of abdominal obesity. Scand J Public Health. 2012 Nov;40(7):674–680. doi: 10.1177/1403494812461730. Epub 2012 Oct 5. [DOI] [PubMed] [Google Scholar]
- 21.Bendtsen JD, Nielsen H, von Heijne G, Brunak S. Improved prediction of signal peptides: SignalP 3.0. J Mol Biol. 2004 Jul 16;340(4):783–795. doi: 10.1016/j.jmb.2004.05.028. [DOI] [PubMed] [Google Scholar]
- 22.Tchoukalova YD, Sarr MG, Jensen MD. Measuring committed preadipocytes in human adipose tissue from severely obese patients by using adipocyte fatty acid binding protein. Am J Physiol Regul Integr Comp Physiol. 2004 Nov;287(5):R1132–R1140. doi: 10.1152/ajpregu.00337.2004. Epub 2004 Jul 29. [DOI] [PubMed] [Google Scholar]
- 23.Zeyda M, Stulnig TM. Adipose tissue macrophages. Immunol Lett. 2007 Oct 15;112(2):61–67. doi: 10.1016/j.imlet.2007.07.003. Epub 2007 Jul 31. [DOI] [PubMed] [Google Scholar]
- 24.Aoki N, Jin-no S, Nakagawa Y, Asai N, Arakawa E, Tamura N, et al. Identification and characterization of microvesicles secreted by 3T3-L1 adipocytes: redox- and hormone-dependent induction of milk fat globule-epidermal growth factor 8-associated microvesicles. Endocrinology. 2007 Aug;148(8):3850–3862. doi: 10.1210/en.2006-1479. Epub 2007 May 3. Retraction in: Endocrinology. 2013 Nov;154(11):4437. [DOI] [PubMed] [Google Scholar]
- 25.Curat CA, Miranville A, Sengenes C, Diehl M, Tonus C, Busse R, et al. From blood monocytes to adipose tissue-resident macrophages: induction of diapedesis by human mature adipocytes. Diabetes. 2004 May;53(5):1285–1292. doi: 10.2337/diabetes.53.5.1285. [DOI] [PubMed] [Google Scholar]
- 26.Strissel KJ, Stancheva Z, Miyoshi H, Perfield JW, 2nd, DeFuria J, Jick Z, et al. Adipocyte death, adipose tissue remodeling, and obesity complications. Diabetes. 2007 Dec;56(12):2910–2918. doi: 10.2337/db07-0767. Epub 2007 Sep 11. [DOI] [PubMed] [Google Scholar]
- 27.Cancello R, Henegar C, Viguerie N, Taleb S, Poitou C, Rouault C, et al. Reduction of macrophage infiltration and chemoattractant gene expression changes in white adipose tissue of morbidly obese subjects after surgery-induced weight loss. Diabetes. 2005 Aug;54(8):2277–2286. doi: 10.2337/diabetes.54.8.2277. [DOI] [PubMed] [Google Scholar]
- 28.Cinti S, Mitchell G, Barbatelli G, Murano I, Ceresi E, Faloia E, et al. Adipocyte death defines macrophage localization and function in adipose tissue of obese mice and humans. J Lipid Res. 2005 Nov;46(11):2347–2355. doi: 10.1194/jlr.M500294-JLR200. Epub 2005 Sep 8. [DOI] [PubMed] [Google Scholar]
- 29.Feng D, Tang Y, Kwon H, Zong H, Hawkins M, Kitsis RN, et al. High-fat diet-induced adipocyte cell death occurs through a cyclophilin D intrinsic signaling pathway independent of adipose tissue inflammation. Diabetes. 2011 Aug;60(8):2134–2143. doi: 10.2337/db10-1411. Epub 2011 Jul 6. [DOI] [PMC free article] [PubMed] [Google Scholar]
- 30.Kuilman T, Michaloglou C, Vredeveld LC, Douma S, van Doorn R, Desmet CJ, et al. Oncogene-induced senescence relayed by an interleukin-dependent inflammatory network. Cell. 2008 Jun 13;133(6):1019–1031. doi: 10.1016/j.cell.2008.03.039. [DOI] [PubMed] [Google Scholar]
- 31.Rytka JM, Wueest S, Schoenle EJ, Konrad D. The portal theory supported by venous drainage-selective fat transplantation. Diabetes. 2011 Jan;60(1):56–63. doi: 10.2337/db10-0697. Epub 2010 Oct 18. [DOI] [PMC free article] [PubMed] [Google Scholar]
- 32.Dunn JP, Abumrad NN, Breitman I, Marks-Shulman PA, Flynn CR, Jabbour K, et al. Hepatic and peripheral insulin sensitivity and diabetes remission at 1 month after Roux-en-Y gastric bypass surgery in patients randomized to omentectomy. Diabetes Care. 2012 Jan;35(1):137–142. doi: 10.2337/dc11-1383. Epub 2011 Oct 31. [DOI] [PMC free article] [PubMed] [Google Scholar]
- 33.Fabbrini E, Tamboli RA, Magkos F, Marks-Shulman PA, Eckhauser AW, Richards WO, et al. Surgical removal of omental fat does not improve insulin sensitivity and cardiovascular risk factors in obese adults. Gastroenterology. 2010 Aug;139(2):448–455. doi: 10.1053/j.gastro.2010.04.056. Epub 2010 May 7. [DOI] [PMC free article] [PubMed] [Google Scholar]
- 34.Thorne A, Lonnqvist F, Apelman J, Hellers G, Arner P. A pilot study of long-term effects of a novel obesity treatment: omentectomy in connection with adjustable gastric banding. Int J Obes Relat Metab Disord. 2002 Feb;26(2):193–199. doi: 10.1038/sj.ijo.0801871. [DOI] [PubMed] [Google Scholar]
- 35.Lottati M, Kolka CM, Stefanovski D, Kirkman EL, Bergman RN. Greater omentectomy improves insulin sensitivity in nonobese dogs. Obesity (Silver Spring) 2009 Apr;17(4):674–680. doi: 10.1038/oby.2008.642. Epub 2009 Feb 12. [DOI] [PMC free article] [PubMed] [Google Scholar]
- 36.Barzilai N, She L, Liu BQ, Vuguin P, Cohen P, Wang J, et al. Surgical removal of visceral fat reverses hepatic insulin resistance. Diabetes. 1999 Jan;48(1):94–98. doi: 10.2337/diabetes.48.1.94. [DOI] [PubMed] [Google Scholar]
- 37.Gabriely I, Ma XH, Yang XM, Atzmon G, Rajala MW, Berg AH, et al. Removal of visceral fat prevents insulin resistance and glucose intolerance of aging: an adipokine-mediated process? Diabetes. 2002 Oct;51(10):2951–2958. doi: 10.2337/diabetes.51.10.2951. [DOI] [PubMed] [Google Scholar]
- 38.Tran TT, Yamamoto Y, Gesta S, Kahn CR. Beneficial effects of subcutaneous fat transplantation on metabolism. Cell Metab. 2008 May;7(5):410–420. doi: 10.1016/j.cmet.2008.04.004. [DOI] [PMC free article] [PubMed] [Google Scholar]
Associated Data
This section collects any data citations, data availability statements, or supplementary materials included in this article.


