

Abstract
A prior genome-wide association study (GWAS) in Pima Indians identified a variant within PFKFB2 (rs17258746) associated with body mass index (BMI). PFKFB2 encodes 6-phosphofructo-2-kinase/fructose 2,6-bisphosphatase isoform 2, which plays a role in glucose metabolism. To follow-up on the GWAS, tag SNPs across PFKFB2 were genotyped in American Indians (AI) who had longitudinal data on BMI (n = 6839), type 2 diabetes (T2D; n = 7710), diabetic nephropathy (DN; n = 2452), % body fat (n = 555) and insulin secretion (n = 298). Two SNPs were further genotyped in urban AI to assess replication for DN (n = 864). PFKFB2 expression was measured in 201 adipose biopsies using real-time RT-PCR and 61 kidney biopsies using the Affymetrix U133 array. Two SNPs (rs17258746 and rs11120137), which capture the same signal, were associated with maximum BMI in adulthood (β = 1.02 per risk allele, P = 7.3 × 10⁻⁴), maximum BMI z-score in childhood (β = 0.079, P = 0.03) and % body fat in adulthood (β = 3.4%, P = 3 × 10⁻⁷). The adiposity-increasing allele correlated with lower PFKFB2 adipose expression (β = 0.81, P = 9.4 × 10⁻⁴). Lower expression of PFKFB2 further correlated with higher % body fat (r = −0.16, P = 0.02) and BMI (r = −0.17, P = 0.02). This allele was also associated with increased risk for DN in both cohorts of AI [odds ratio = 1.64 (1.32–2.02), P = 5.8 × 10⁻⁶], and similarly correlated with lower PFKFB2 expression in kidney glomeruli (β = 0.87, P = 0.03). The same allele was also associated with lower insulin secretion assessed by acute insulin response (β = 0.78, P = 0.03) and 30-min plasma insulin concentrations (β = 0.78, P = 1.1 × 10⁻⁴). Variation in PFKFB2 appears to reduce PFKFB2 expression in adipose and kidney tissues, and thereby increase risk for adiposity and DN.
Introduction
Pima Indians of Arizona have extremely high rates of obesity and type 2 diabetes (T2D) (1). To identify genetic variants that increase risk for these diseases in American Indians (AI), we performed a genome-wide association study (GWAS) using the Affymetrix Human SNP array 6.0 and previously published results from our analyses of early onset T2D (2) and body mass index (BMI) (3,4). A SNP, rs17258746, located in the 3′UTR region of PFKFB2 was among the top-20 distinct GWAS signals for BMI after follow-up genotyping in 6800 AI (4).
PFKFB2 encodes for 6-phosphofructo-2-kinase/fructose 2,6-bisphosphatase (PFK-2/FBPase-2) isoform 2, a bi-functional enzyme involved in the synthesis and degradation of fructose 2,6-bisphosphate (F2,6P2). F2,6P2 is a potent allosteric activator of the glycolytic enzyme phosphofructokinase-1, and an inhibitor of the gluconeogenic enzyme fructose 1,6-bisphosphatase-1; therefore, it is involved in regulating glycolysis and gluconeogenesis (5,6). Enhanced hepatic glycolysis in mice by over-expressing PFK-2/FBPase-2 in the liver reduced body weight and visceral fat content (7). PFK-2/FBPase-2 is also a binding partner for glucokinase (GCK) and plays a pivotal role in the rate-limiting step of glucose-stimulated insulin secretion in pancreatic β-cells (8–10). Based on the SNP associations with BMI in our prior GWAS analysis, and the potential biological role of PFKFB2 in obesity and insulin secretion, PFKFB2 was analyzed as a candidate gene for susceptibility for obesity, insulin secretory dysfunction and T2D in AI.
American Indian patients with T2D are also highly affected by DN, which is the leading cause of kidney failure associated with markedly increased risk of death and cardiovascular complications. Therefore, as part of our systematic analyses to identify genetic variants for T2D, we routinely assess whether a variant is associated with DN in AI.
Results
Supplemental Material, Fig. S1 provides a study overview.
Association analyses of PFKFB2 tag SNPs with adiposity
Thirteen tag SNPs (r2 ≥ 0.8) with a minor allele frequency (mAF) ≥0.01 were identified from whole-genome sequence data of 234 Pima Indians. These SNPs tagged a ∼127.7 kb region encompassing PFKFB2 (∼50 kb flanking each side of the gene). Thirteen tag SNPs were initially genotyped in 3625 full-heritage Pima Indians from the Gila River Indian Community (GRIC) with longitudinal data for BMI, T2D and DN, including 555 individuals with inpatient measures of % body fat and other anthropometric and metabolic traits. Eight out of thirteen tags with nominal evidence (P < 0.1) for association with BMI or previously analyzed in the GIANT (Genetic Investigation of ANthropometric Traits) meta-analysis (11), were further genotyped in remaining samples of 4085 mixed-heritage AI from the same community (Table1). Two tag SNPs, the lead GWAS SNP rs17258746 (3′UTR) and intronic SNP rs11120137 were associated with maximum BMI in adulthood (n = 6839, β = 1.02 per risk allele, as a multiplier, P = 7.3 × 10⁻⁴; β = 1.02, P = 2.0 × 10⁻⁴, respectively, adjusted for age, sex, birth-year and heritage) and maximum age- and sex-specific BMI z-score in childhood (n = 5350, β = 0.08, P = 0.03; β = 0.11, P = 7.6 × 10⁻⁴, respectively) in combined analyses of all AI from the GRIC. Neither rs17258746, nor rs11120137, nor other tag SNPs (Table1) were significantly associated with BMI in Caucasians analyzed in the GIANT meta-analysis (11).
Table1.
Associations of 13 tag SNPs in PFKFB2 with maximum BMI in adulthood and maximum BMI z-score in childhood in individuals from the GRIC including full-heritage Pima Indians and mixed-heritage AI; and comparison with data from GIANT*
| SNP | Location | R/N | Full-heritage Pima Adult BMI (n = 3412) BMI z-score (n = 2296) |
Mixed-heritage AI Adult BMI (n = 3427) BMI z-score (n = 3054) |
Entire GRIC (combined) Adult BMI (n = 6839) BMI z-score (n = 5350) |
GIANT*(n = 123795) |
|||||||
|---|---|---|---|---|---|---|---|---|---|---|---|---|---|
| RAF | Beta | P | RAF | beta | P | Beta | P | R/N | RAF | P | |||
| rs78357410 | 5′flanking | T/C | 0.05 | 1.008 0.004 |
0.54 0.96 |
||||||||
| rs79168343 | 5′flanking | C/T | 0.94 | 1.024 0.052 |
0.03 0.43 |
0.95 | 1.011 0.019 |
0.42 0.76 |
1.019 0.034 |
0.03 0.46 |
|||
| rs12032074 | 5′flanking | A/G | 0.85 | 1.006 −0.057 |
0.47 0.19 |
||||||||
| rs2243816 | intron | T/C | 0.22 | 1.011 0.023 |
0.08 0.53 |
0.20 |
1.012 0.037 |
0.09 0.31 |
1.012 0.033 |
0.01 0.21 |
T/C | 0.14 | 0.25 |
| rs11120137 | intron | T/C | 0.11 | 1.025 0.133 |
0.008 0.01 |
0.20 | 1.020 0.091 |
0.01 0.02 |
1.022 0.108 |
2.0 × 10⁻⁴ 7.6 × 10⁻⁴ |
T/C | 0.55 | 0.65 |
| rs77757597 | 3′UTR | G/T | 0.64 | 1.011 0.070 |
0.07 0.03 |
0.72 | 1.001 −0.009 |
0.84 0.78 |
1.006 0.030 |
0.16 0.18 |
|||
| chr1:207250175 | 3′UTR | T/C | 0.04 | 1.010 −0.054 |
0.47 0.40 |
||||||||
| rs1060286 | 3′UTR | G/A | 0.01 | 1.032 0.413 |
0.36 0.03 |
0.08 | 1.007 0.025 |
0.55 0.69 |
1.010 0.066 |
0.41 0.27 |
A/G | 0.57 | 0.60 |
| rs17258746 | 3′UTR | A/T | 0.10 | 1.029 0.103 |
0.004 0.06 |
0.11 | 1.016 0.057 |
0.09 0.24 |
1.023 0.079 |
7.3 × 10⁻⁴ 0.03 |
A/T | 0.14 | 0.24 |
| rs3748672 | 3′UTR | A/G | 0.01 | 1.046 0.329 |
0.06 0.04 |
0.01 | 1.019 0.110 |
0.07 0.04 |
1.022 0.137 |
0.03 0.007 |
G/A | 0.59 | 0.35 |
| rs6673422 | 3′UTR | G/A | 0.12 | 1.012 0.052 |
0.20 0.31 |
0.12 | 1.012 0.047 |
0.18 0.32 |
1.013 0.051 |
0.04 0.15 |
G/A | 0.13 | 0.21 |
| chr1:207260089 | 3′flanking | T/C | 0.91 | 1.012 0.049 |
0.26 0.37 |
||||||||
| rs56009508 | 3′flanking | A/C | 0.84 | 1.005 0.020 |
0.53 0.61 |
||||||||
Adult BMI is the maximum BMI (kg/m2) recorded at age ≥15 years (top row). Childhood BMI z-score is the maximum sex- and age-specific z-score identified between the ages of 5 and 20 years. For association analyses, BMI is loge−transformed, and beta is exponentiated to obtain the effect estimate for each risk allele, expressed as a multiplier. The risk allele (given first) is defined as the allele with a higher BMI. R: risk allele; N: non-risk allele. RAF: risk allele frequency. Beta and p values are adjusted for age, sex, birth-year and heritage. *GIANT meta-analysis (21). Bold values: P < 0.05.
In 555 AI with inpatient measures of anthropometric and metabolic traits, the BMI risk alleles for rs17258746 and rs11120137 were also associated with a higher % body fat (Table2, β = 3.4% per risk allele, P = 3 × 10⁻⁷; β = 2.3%, P = 1.7 × 10⁻⁴, respectively, adjusted for age, sex and heritage), higher waist circumference (β = 2.2 inch, P = 0.002; β = 1.5 inch, P = 0.02, respectively) and thigh circumference (β = 1.4 inch, P = 8 × 10⁻⁵; β = 1.0 inch, P = 0.002, respectively). Mouse models have shown that PFKFB2 affects adiposity via effects on energy expenditure and intake (7); therefore, data from the respiratory chamber (n = 423) and ad libitum food intake (n = 194) studies were also analyzed. The adiposity risk allele for rs11120137 was nominally associated with a lower 24-h energy expenditure (Table2, β = −42.3 kcal/day, P = 0.04, adjusted for age, sex, fat mass, fat free mass, spontaneous physical activity and heritage); however, this association was not observed at rs17258746 (Table2). Neither rs17258746, nor rs11120137 was associated with sleeping metabolic rate or ad libitum energy intake (Table2, analyzed as % weight maintaining energy needs: %WMEN).
Table2.
Associations of rs17258746 and rs11120137 in PFKFB2 with metabolic traits related to adiposity in non-diabetic AI
| rs17258746 (mean ± SD) |
rs11120137 (mean ± SD) |
|||||||
|---|---|---|---|---|---|---|---|---|
| N/N (T/T) |
N/R + RR (T/A + AA) |
Beta | P | N/N (C/C) |
N/R + RR (C/T + TT) |
Beta | P | |
| Body composition (n) | 432 | 96 | 422 | 114 | ||||
| Body fat (%) | 31.9 ± 8.7 | 34.3 ± 7.7 | 3.4 | 3.0 × 10⁻⁷ | 32.1 ± 8.7 | 33.2 ± 7.9 | 2.3 | 1.7× 10⁻⁴ |
| Waist (inch) | 41.6 ± 6.8 | 43.9 ± 6.7 | 2.2 | 0.002 | 41.7 ± 7.0 | 43.0 ± 6.4 | 1.5 | 0.02 |
| Thigh (inch) | 25.4 ± 3.3 | 26.8 ± 3.2 | 1.4 | 8.0 × 10⁻⁵ | 25.5 ± 3.3 | 26.4 ± 3.1 | 1.0 | 0.002 |
| Waist/Thigh | 1.63 ± 0.2 | 1.64 ± 0.2 | −0.035 | 0.03 | 1.63 ± 0.2 | 1.63 ± 0.2 | −0.021 | 0.14 |
| Respiratory chamber study (n) | 328 | 75 | 311 | 92 | ||||
| 24-h RQ | 0.85 ± 0.02 | 0.85 ± 0.02 | −0.005 | 0.12 | 0.85 ± 0.02 | 0.85 ± 0.02 | −0.004 | 0.13 |
| 24-h energy expenditure (kcal/day) | 2326 ± 389 | 2470 ± 394 | −36.3 | 0.10 | 2339 ± 399 | 2409 ± 401 | −42.3 | 0.04 |
| Sleeping metabolic rate (kcal/day) | 1650 ± 276 | 1751 ± 303 | −18.5 | 0.37 | 1660 ± 282 | 1712 ± 300 | −27.9 | 0.15 |
| ad libitum energy intake (n) | 146 | 30 | 118 | 63 | ||||
| Total energy intake (%WMEN) | 154.2 ± 46.0 | 156.0 ± 44.2 | −5.4 | 0.60 | 154.4 ± 44.8 | 154.9 ± 45.1 | −1.1 | 0.91 |
Individuals homozygous for the minor risk allele are combined with those of the heterozygotes for statistical analyses. The p values for % body fat, waist and thigh circumferences are adjusted for age, sex and heritage. The waist to thigh ratio is additionally adjusted for % body fat. The p values for 24-h EE are adjusted for age, sex, heritage, fat mass, fat free mass and SPA. The p values for 24-h RQ, sleeping metabolic rate and energy intake are adjusted for age, sex, % body fat and heritage. Data are given as unadjusted mean ± SD. The beta estimate represents the difference between the risk allele and the non-risk allele, and is adjusted for covariates. R: risk allele; N: non-risk allele; %WMEN: % weight maintaining energy needs. Bold values: P < 0.05.
In Pima Indians, the intronic tag SNP rs11120137 captures a 32 bp deletion in the 3′UTR of PFKFB2 (rs66822120) (D′ = 1, r2 = 1) and 5 other 3′UTR SNPs rs1560, rs1060287, rs6667268, rs10577264 and rs1565 (D′ ≥ 0.99, r2 ≥ 0.98). In Caucasians rs11120137 similarly tags rs6667268, rs1060287, rs1565 and rs1560 (D′ ≥ 0.98, r2 ≥ 0.95). However, in Pima Indians rs17258746 and rs11120137 are more highly concordant (r2 = 0.78) as compared with Caucasians (r2 = 0.12) although the D′ between these SNPs is high in both ethnic groups (D′ = 0.98 and 1.0 in Pima Indians and Caucasians, respectively) (Supplemental Material, Fig. S2).
Conditional analyses in AI suggested that rs17258746 and rs11120137 contribute to the same adiposity signal (i.e. conditioning on one SNP rendered the other SNP non-significant). A third tag SNP (rs6673422) which had some evidence for association with adiposity could also be explained by the stronger association of rs17258746 (D′ = 0.94, r2 = 0.76).
Associations of PFKFB2 SNPs with acute and early insulin secretion
PFKFB2 is implicated in regulation of insulin secretion in pancreatic β-cells. We therefore assessed the effect of PFKFB2 variants on β-cell function among 298 full-heritage Pima Indians with normal glucose tolerance, who had been characterized for rates of insulin secretion. Figure 1 shows the plasma insulin and glucose concentrations in response to a 25-g intravenous glucose (IVGTT) by genotypes of rs17258746 (a, b) or rs11120137 (c, d). The adiposity-increasing allele at rs17258746 (A) or rs11120137 (T) was associated with a lower acute insulin response (AIR, mean insulin increment from 3–5 min) to an intravenous glucose bolus (Fig. 1A, C: β = 0.78, P = 0.03; β = 0.81, P = 0.03, respectively, adjusted for age, sex, % body fat and rate of glucose disposal during insulin-stimulation). A consistent reduction in the early phase of glucose-stimulated insulin release (30-min) during a 75-g oral glucose tolerance test (OGTT) was also observed (Fig. 2A, β = 0.78, P = 1.1 × 10⁻⁴ for rs17258746; Fig. 2C, β = 0.78, P = 3 × 10⁻⁵ for rs11120137; additionally adjusted for 30-min glucose concentrations during an OGTT). There were no statistical differences between genotypes of 17258746 or rs11120137 in plasma glucose concentrations after an intravenous glucose bolus (Fig. 1B and D) or during an OGTT (Fig. 2B and D). Among 555 non-diabetic AI who had insulin sensitivity measured by the rate of glucose disposal during insulin-stimulation, these SNPs were not associated with insulin sensitivity (Table3). The associations of all other tag SNPs with insulin secretion and insulin sensitivity are shown in Table3.
Figure 1.

Plasma insulin and glucose concentrations in response to a 25-g intravenous glucose tolerance test (IVGTT) by genotypes of PFKFB2 SNP rs17258746 (A and B) and rs11120137 (C and D) in full-heritage Pima Indians with normal glucose tolerance. Individuals homozygous for the minor risk allele are combined with those of the heterozygotes. Data are given as adjusted mean ± SE. AIR (mean insulin increment from 3 to 5 min) is log10-transformed before analyses to approximate a normal distribution, and beta is exponentiated to obtain the effect per risk allele, expressed as a multiplier. The P values and beta for plasma insulin concentrations are adjusted for age, sex, % body fat and rate of glucose disappearance during insulin-stimulation. The P values and beta for plasma glucose concentrations are adjusted for age, sex and % body fat.
Figure 2.

Plasma insulin and glucose concentrations during a 75-g OGTT by genotypes of PFKFB2 SNP rs17258746 (A and B) and rs11120137 (C and D) in full-heritage Pima Indians with normal glucose tolerance. Individuals homozygous for the minor risk allele are combined with those of the heterozygotes. Data are given as adjusted mean ± SE. 30-min plasma insulin concentrations are log10-transformed before analyses to approximate a normal distribution, and beta is exponentiated to obtain the effect per risk allele, expressed as a multiplier. The p values and beta are adjusted for age, sex, % body fat, rate of glucose disappearance during insulin stimulation and 30-min plasma glucose concentrations during an OGTT.
Table3.
Associations of 13 tag SNPs in PFKFB2 with insulin secretion, insulin sensitivity, T2D and DN in AI
| SNP | Location | R/N | RAF | AIR n = 298 full-heritage |
30-min insulin n = 298 full-heritage |
Insulin sensitivity n = 555 |
T2D n = 3625*/7710£/10816§ |
DN n = 1610*/2452£/3316§ |
|||||
|---|---|---|---|---|---|---|---|---|---|---|---|---|---|
| Beta | P | Beta | P | Beta | P | OR (95% CI) | P | OR (95% CI) | P | ||||
| rs78357410* | 5′flanking | T/C | 0.05 | 0.96 | 0.67 | 1.02 | 0.74 | 1.06 | 0.06 | 0.94 (0.72–1.23) | 0.68 | 0.88 (0.56–1.37) | 0.56 |
| rs79168343£ | 5′flanking | C/T | 0.94 | 1.05 | 0.67 | 0.95 | 0.72 | 0.99 | 0.85 | 0.86 (0.72–1.03) | 0.11 | 0.89 (0.67–1.19) | 0.44 |
| rs12032074* | 5′flanking | A/G | 0.85 | 0.94 | 0.42 | 1.03 | 0.67 | 1.00 | 0.84 | 1.09 (0.93–1.27) | 0.31 | 0.95 (0.75–1.22) | 0.71 |
| rs2243816£ | intron | T/C | 0.22 | 0.98 | 0.89 | 0.95 | 0.47 | 1.00 | 0.82 | 0.99 (0.89–1.10) | 0.84 | 1.10 (0.91–1.33) | 0.33 |
| rs11120137§ | intron | T/C | 0.11 | 0.81 | 0.03 | 0.78 | 3.0 × 10⁻⁵ | 0.97 | 0.17 | 1.04 (0.94–1.15) | 0.49 | 1.42 (1.16–1.73) | 5.1 × 10⁻⁴ |
| rs77757597£ | 3′UTR | G/T | 0.65 | 0.95 | 0.34 | 0.98 | 0.46 | 1.00 | 0.83 | 1.01 (0.89–1.15) | 0.83 | 1.07 (0.87–1.31) | 0.51 |
| chr1:207250175* | 3′UTR | T/C | 0.04 | 1.09 | 0.37 | 1.02 | 0.76 | 1.04 | 0.20 | 0.82 (0.62–1.10) | 0.18 | 0.63 (0.38–1.03) | 0.07 |
| rs1060286£ | 3′UTR | G/A | 0.01 | 1.14 (0.88–1.48) | 0.32 | 0.90 (0.46–1.77) | 0.76 | ||||||
| rs17258746§ | 3′UTR | A/T | 0.10 | 0.78 | 0.03 | 0.78 | 1.1 × 10⁻⁴ | 0.98 | 0.31 | 1.05 (0.94–1.18) | 0.37 | 1.64 (1.32–2.02) | 5.8 × 10⁻⁶ |
| rs3748672£ | 3′UTR | A/G | 0.01 | 1.08 (0.87–1.33) | 0.50 | 0.71 (0.42–1.20) | 0.21 | ||||||
| rs6673422£ | 3′UTR | G/A | 0.12 | 0.83 | 0.04 | 0.79 | 1.0 × 10⁻⁴ | 0.99 | 0.50 | 1.10 (0.96–1.25) | 0.17 | 1.33 (1.05–1.68) | 0.02 |
| chr1:207260089* | 3′flanking | T/C | 0.91 | 0.98 | 0.82 | 1.00 | 0.98 | 1.00 | 0.85 | 1.10 (0.89–1.35) | 0.38 | 1.12 (0.79–1.59) | 0.51 |
| rs56009508* | 3′flanking | A/C | 0.84 | 0.98 | 0.66 | 0.93 | 0.24 | 0.99 | 0.46 | 1.02 (0.88–1.20) | 0.77 | 1.04 (0.80–1.35) | 0.76 |
*SNPs (n = 5) analyzed in full-heritage Pima Indians (n = 3625 for T2D; n = 1610 for DN); £: SNPs (n = 6) analyzed in combined samples of full-heritage Pima Indians and mixed-heritage AI (n = 7710 for T2D; n = 2452 for DN); §: SNPs (n = 2) analyzed in combined samples of full-heritage, mixed-heritage and a replication sample of urban AI (n = 10816 for T2D; n = 3316 for DN). SNPs (rs1060286 and rs3748672) have mAF = 0.01, and are too rare to analyze traits for AIR, 30-min plasma insulin and insulin sensitivity (measured by the rate of glucose disappearance during insulin-stimulation). The risk allele (given first) is defined as the allele with a higher risk for BMI; ORs for T2D or DN are given per copy of this allele. R: risk allele; N: non-risk allele; RAF: risk allele frequency. AIR, 30-min plasma insulin concentrations and insulin sensitivity are log10-transformed before analyses to approximate a normal distribution, and beta is exponentiated to obtain the effect per copy of the risk allele, expressed as a multiplier. Beta and P value for AIR are adjusted for age, sex, % body fat and rate of glucose disappearance during insulin-stimulation. Beta and P value for 30-min plasma insulin concentrations are additionally adjusted for 30-min plasma glucose concentrations during an OGTT. Beta and P value for insulin sensitivity are adjusted for age, sex, % body fat and heritage. Beta and P values for T2D are adjusted for age, sex, birth-year and heritage. Beta and p for DN are adjusted for duration of diabetes, sex and heritage. Bold values: P < 0.05.
Associations of PFKFB2 SNPs with T2D and DN
Tag SNPs were also analyzed for association with T2D in AI from the longitudinal study of the GRIC (Table3). None of the tags, including rs17258748 and rs11120137 had a significant association with T2D. PFKFB2 SNPs were also tested for association with DN among the T2D subjects. Variants rs17258746 and rs11120137 were associated with DN in AI [Fig. 3A and C, OR = 1.66 (1.29–2.15), P = 8.5 × 10⁻⁵; OR = 1.40 (1.10–1.78), P = 0.006, respectively, adjusted for duration of diabetes, sex and heritage]. To confirm this observation, we sought replication by genotyping a new sample of urban AI examined as part of the Family Investigation of Nephropathy and Diabetes (FIND). This independent sample (non-overlapping) of AI replicated the DN association found in the GRIC AI [Fig. 3A and C, OR = 1.57 (1.06–2.32), P = 0.02 for rs17258746; OR = 1.46 (1.03–2.06), P = 0.03 for rs11120137], but had no association with T2D. Meta-analyses of the GRIC and urban AI samples provided the strongest evidence for association of rs17258746 and rs11120137 with DN [Fig. 3A and C, n = 3316, OR = 1.64 (1.32–2.02), P = 5.8 × 10⁻⁶; OR = 1.42 (1.16–1.73), P = 5.1 × 10⁻⁴, respectively]. Figure 3 also shows the prevalence of DN in relation to diabetes duration by genotypes of rs17258746 (b) or rs11120137 (d) in combined samples of the GRIC and urban AI (n = 3316). The adiposity-increasing allele at rs17258746 (A) or rs11120137 (T) was consistently associated with higher prevalence of DN across duration of diabetes. The results suggest that PFKFB2 SNPs may impact nephropathy risk through a mechanism independent of T2D.
Figure 3.

The prevalence of DN in AI from the GRIC, urban AI and meta-analyses of all samples by genotypes of PFKFB2 SNP rs17258746 (A) or rs11120137 (C). The prevalence DN in relation to diabetes duration by genotypes of rs17258746 (B) and rs11120137 (D) in combined samples. The risk allele is defined as the allele with a higher BMI in AI; ORs are given per copy of this allele. Odds ratios (95% CI) and P values are adjusted for age, sex, birth-year and heritage. In Fig. 3B and D, individuals homozygous for the minor risk allele are combined with those of the heterozygotes.
SNP rs17258746 or rs11120137 tags a cis-eQTL for PFKFB2 in adipose and kidney glomerular tissues
To determine whether SNPs tagged by rs17258746 or rs11120137 affect adiposity and DN via a direct effect on PFKFB2, we assessed function of PFKFB2 variants as a cis-acting expression quantitative trait locus (eQTL). Tissue expression profiling showed that PFKFB2 is widely expressed in various tissues including pancreatic islet, kidney, hypothalamus, brain, adipose, liver, skeletal muscle etc. (Supplemental Material, Fig. S3). Since adipose tissue biopsies were available on 201 metabolically characterized Pima Indians genotyped for tag SNPs in PFKFB2, we first determined whether rs17258746 or rs11120137 was a cis-eQTL in adipose tissue from these subjects. Adipose PFKFB2 expression levels were determined by quantitative RT-PCR. After accounting for age, sex, Pima heritage and AI/European ancestry, the adiposity risk alleles at rs17258746 (A-allele) and rs11120137 (T-allele) were significantly associated with a reduced PFKFB2 expression (Fig. 4A, β = 0.81, as a multiplier, P = 9.4 × 10⁻⁴; Fig. 4B, β = 0.85, P = 0.003, respectively), while a lower expression of adipose PFKFB2 correlated with a higher % body fat (Fig. 5A, r = −0.16, P = 0.02) and BMI (Fig. 5B, r = −0.17, P = 0.02) among the donors.
Figure 4.

Correlations of genotypes of PFKFB2 SNP rs17258746 or rs11120137 with relative quantity of PFKFB2 RNA from adipose tissue biopsies of 201 non-diabetic Pima Indians (A and B) and kidney glomerular tissue biopsies of 61 diabetic AI (C and D). Box plot shows raw data in median, 25th and 75th percentiles, maximal and minimal values. Individuals homozygous for the minor risk allele are combined with those of the heterozygotes for statistical analyses. The relative PFKFB2 expression levels in adipose tissues are log10-transformed to approximate the normal distribution. The p value is adjusted for age, sex, % body fat and Pima heritage. The PFKFB2 expression levels in kidney tissues were batch corrected using Combat (26) from Genepattern and log2-transformed. The P value is adjusted for sex, diabetes duration and heritage.
Figure 5.
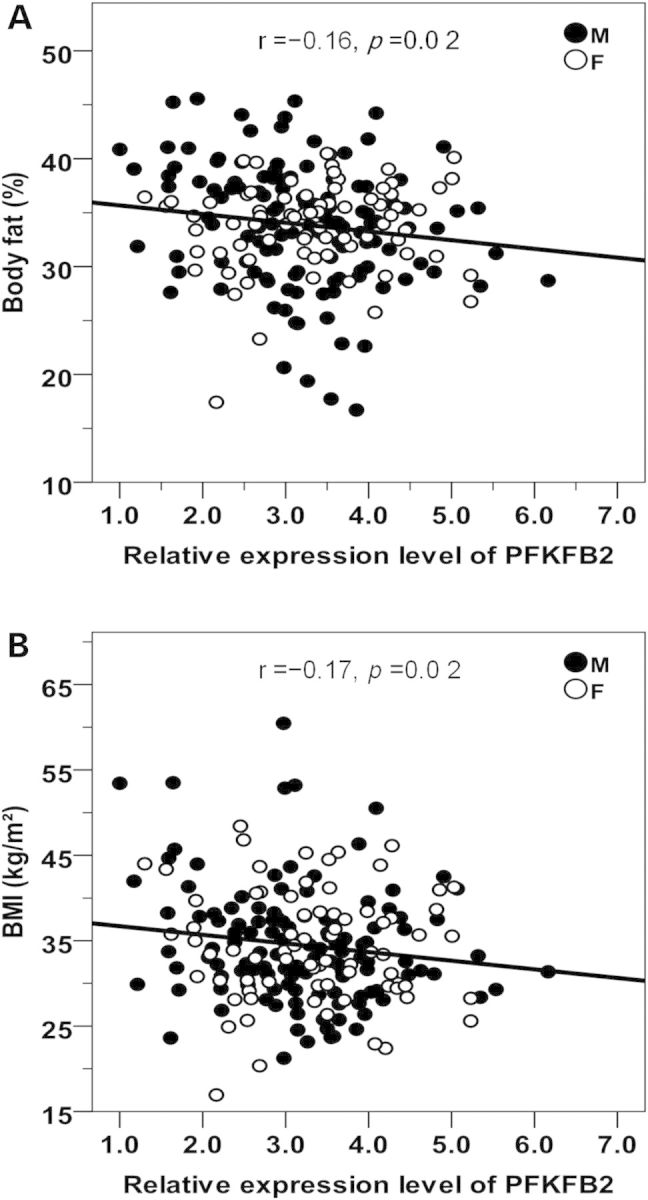
Inverse correlations between PFKFB2 expression levels in adipose tissues and % body fat (A) and BMI (B) in 201 non-diabetic Pima Indians. The relative PFKFB2 expression levels are log10-transformed to approximate the normal distribution. The P value is adjusted for age, sex and Pima heritage. M: male; F: female.
To determine whether rs17258746 or rs11120137 similarly affect PFKFB2 expression in kidney, which could be the mechanism underlying the association with DN, PFKFB2 expression (transcript: NM_001018053) in the glomerular component of 61 kidney biopsies was assessed. The adiposity/DN risk alleles at rs17258746 (A-allele) and rs11120137 (T-allele) were similarly associated with a reduced PFKFB2 expression (Fig. 4C, β = 0.88, as a multiplier, P = 0.05; Fig. 4D, β = 0.87, P = 0.03, respectively, adjusted for sex, diabetes duration and heritage). The association in the tubule-interstitial component was not statistically different.
Our data suggest that rs17258746 or rs11120137 may tag a cis-acting variant that affects PFKFB2 expression in multiple tissues that include adipose and kidney. Since the adipose biopsies were collected on individuals with a wide range of adiposity, we were able to show that PFKFB2 expression in adipose tissue correlates with % body fat and BMI, which may partially explain the observed association between PFKFB2 SNPs (rs17258746 and rs11120137) and % body fat and BMI. To further assess the potential causal relationships, we applied the causal models of Schadt et al. (12) to the correlations among genotype, expression level of PFKFB2 and clinical phenotype. In general, an ‘independent’ model in which genotype can have direct effects on both expression and phenotype provided a better fit than a simple ‘causal’ model in which the effect of genotype on phenotype is solely a direct function of its effect on expression or a ‘reverse’ model in which the genotypic effect on expression is solely a direct function of its effect on clinical phenotype. These analyses suggest that the relationships among these risk variants, PFKFB2 expression and adiposity measures may be more complex than simple causal effect of expression on adiposity. We did not have sufficient data to estimate whether lower PFKFB2 expression in kidney correlates with higher risk for DN.
Discussion
Our prior GWAS for BMI in Pima Indians identified PFKFB2 as a putative BMI locus, and the present follow-up study of tag SNPs that capture common variation across PFKFB2 in AI from the GRIC supports a role of PFKFB2 in determining adiposity (% body fat, maximum BMI in adulthood and maximum z-score in childhood). The results also indicate that individuals with the risk allele for adiposity (i.e. the A allele at rs17258746 or T allele at rs11120137) have lower PFKFB2 expression levels in adipose tissue, which is consistent with a prior report in mice where higher levels of PFK-2/FBPase-2 had a protective effect against obesity (7). While the physiologic mechanism underlying the effect of PFKFB2 on adiposity is unknown in humans, mice over-expressing hepatic PFK-2/FBPase-2 had enhanced hepatic glycolysis, increased energy expenditure and suppressed food intake via decreased hypothalamic neuropeptide Y expression (7). Evidence for control of food intake by PFK-2/FBPase-2 in mice was further supported by the study of hypothalamic neurons, where high levels of PFK-2/FBPase-2 caused increased neuronal glycolysis, which was accompanied by decreased AMPK activity and decreased mRNA levels of agouti-related protein (AgRP) and increased mRNA levels of cocaine-amphetamine-related transcript (CART) (13,14). However, our assessment of the relationship between PFKFB2 variation and energy expenditure among subjects who had data from a human respiratory chamber (n = 423) or ad libitum food intake measured over 3 days using an automated vending machine paradigm (n = 194) provides little or no evidence for energy expenditure or intake. Nevertheless, the small sample and/or effect size may reduce the statistical power for detection.
A more established role of PFK-2/FBPase-2 in mice is to regulate glucose-stimulated insulin secretion. PFK-2/FBPase-2 is a direct binding partner for GCK, which serves as a glucose sensor and catalyzes the rate-limiting step of glucose-stimulated insulin secretion in pancreatic β-cells (8–10). We found that the risk allele for adiposity was also associated with a reduction in acute insulin secretion, as assessed by two different measures (AIR and 30-min insulin concentrations during an OGTT). Variation in PFKFB2 could potentially affect insulin secretion via a cis-effect on PFKFB2 expression in β-cells, as suggested by evidence in adipose tissue, but we do not have expression data on β-cells to confirm this hypothesis. Furthermore, it's unclear why the variants in PFKFB2, associated with increased risk for adiposity and insulin secretory function, were not associated with increased risk for T2D in this study.
While mouse models predicted a role of PFKFB2 in adiposity and insulin secretory function, our finding of a reproducible association between PFKFB2 variants and DN was particularly exciting. PFK-2/FBPase-2 plays a pivotal role in glycolysis and gluconeogenesis, which are crucial for glucose homeostasis. Therefore, PFK-2/FBPase-2 could contribute to DN and other macrovascular complications via chronic dysregulation of blood glucose levels. However, we did not observe an association between PFKFB2 variants and fasting glucose concentrations or HbA1c. Nor did we find an association with blood pressure or hypertension.
PFK-2/FBPase-2 and/or F2,6P2 closely interact with AMPK to control energy metabolism in many cell types (13,15). AMPK acts as a nutrient/energy sensor (13,15) whose activity is reduced in the diabetic kidney (16,17). It is involved in proteinuria and/or proximal tubule cell apoptosis through the TGFβ and/or mTOR signaling pathways (18). AMPK could also be induced by metformin, which is associated with correction of kidney metabolic inefficiency and amelioration of podocyte injury in DN (19,20). Since variation in PFKFB2 had a significant association with DN, but had no association with T2D in AI, we propose that PFKFB2 may not be a major determinant of T2D, but its reduced level may impose risk for DN perhaps via an AMPK-mediated mechanism after the onset of T2D.
Past and present obesity was a significant risk factor for DN in a Japanese study (21). Since the adiposity-increasing allele of PFKFB2 variants was also associated with increased risk for DN, we further analyzed the DN association using maximum BMI as a covariate. After accounting for BMI, the association with DN remained the same (meta-analysis of all samples, adjusted P = 1.3 × 10⁻⁶ for rs17258745; P = 1.7 × 10⁻⁴ for rs11120137), suggesting that the PFKFB2 variants increase DN risk through a mechanism independent of BMI. Similarly, the associations of all other tag SNPs with T2D or DN remained the same after accounting for BMI (data not shown).
Although none of the association analyses achieved genome-wide significance (P < 7.2 × 10⁻⁸) (22), the role of PFKFB2 in adiposity and insulin secretory function is implicated in animal models; thus applying such stringent criteria for statistical significance in this study may be overly conservative.
There are four PFK-2/FBPase-2 isoenzymes encoded by PFKFB1-4, which are designated as liver, heart, brain and testis isoforms respectively (6); however, the tissue distribution patterns of these isoenzymes overlap (14). PFKFB2 is designated as a heart-isoform, but it is widely expressed in a number of tissues including pancreatic islet, kidney, hypothalamus, brain, adipose, liver, skeletal muscle etc. (Supplemental Material, Fig. S2). A diverse tissue distribution may result in diverse functionality, which is consistent with our observed associations with adiposity, insulin secretory function and DN. In adipose tissue, the risk allele of PFKFB2 variants had a lower PFKFB2 expression, and a lower expression of PFKFB2 correlated with a higher % body fat or BMI. The expression data in kidney tissue biopsies showed a consistent finding. However, caution is warranted given the small sample size (n = 61) and original design of the study. Further studies from other ethnic groups are required to confirm this observation. The genotypes of PFKFB2 variants only accounted for ∼5% of the variance in PFKFB2 expression levels, suggesting that other genetic or environmental factors may also influence PFKFB2 expression. According to the ENCODE database (http://www.broadinstitute.org/mammals/haploreg), rs66822120 (a 32 bp deletion), rs1565, rs1560, rs1060287 and rs10577264, all of which are in strong linkage disequilibrium (LD) in Pimas, all map to the 3′UTR region of PFKFB2 with a strong enhancer effect observed in multiple cell types and/or a DNase hypersensitive site, implicating a role in transcriptional regulation. Functional studies are required to determine the causal variant (s) in PFKFB2.
In summary, follow-up studies of a GWAS signal for BMI identified common variation in PFKFB2 (risk allele frequency = 0.10) that may act as a cis-eQTL to affect adiposity, insulin secretion and DN in AI. Although PFKFB2 was previously implicated in control of body weight and insulin secretion in mice, this is the first report in humans. The association with DN [OR = 1.64 (1.32–2.02), P = 5.8 × 10⁻⁶, n = 3316] is consistent across full-heritage Pima Indians, mixed-heritage AI and urban AI, and represents a strong signal for DN identified in this population. This finding may provide new insight into a role of PFKFB2 in diabetic complications. However, further studies in other ethnic groups are required to determine the contribution of PFKFB2 to obesity, T2D and DN in other populations.
Materials and Methods
Subjects
American Indians from the GRIC, analyses of BMI, T2D and DN
Individuals living in the GRIC in Arizona are predominately of Pima Indian or Tohono O′odham (a closely related tribe) heritage, and many participated in a longitudinal study of the etiology of T2D (1). Among the GRIC residents who participated in the present study, 3625 are full-heritage Pima Indian and the remaining 4085 are, on average, half Pima and three-quarters AI (any tribe). These participants at ages ≥5 years were invited to biennial outpatient health examinations that included measurements of BMI and a 75-g OGTT. T2D was determined according to the 1997 criteria of American Diabetes Association (23) or prior clinical diagnosis (diabetic: n = 2549, male = 39%, mean ± SD age = 46 ± 15 years, BMI = 39 ± 9 kg/m2; non-diabetic: n = 5161, male = 47%, age = 27 ± 13 years, BMI = 35 ± 9 kg/m2). Among subjects with T2D, many also had quantitative measurement of urinary albumin concentration by a nephelometric immunoassay, which has been performed since 1982 (24). Measurement of urinary creatinine concentration was also made by a modified Jaffé method (25), and the urinary albumin-to-creatinine ratio (ACR) was used to define DN. DN cases (n = 530, male = 38%, age = 53 ± 13 years, BMI = 32 ± 8 kg/m2) were defined by a urinary ACR ≥ 300 mg/g or by the presence of end-stage renal disease (ESRD), defined as the need for renal replacement therapy, at the last examination. Individuals with urinary ACR < 300 mg/g who did not have ESRD were considered unaffected (n = 1922, male = 39%, age = 45 ± 14 years, mean BMI = 36 ± 9 kg/m2). Among those with DN, 421 (79%) had ACR ≥ 300 mg/g and 109 (21%) had ESRD. For analyses of maximum BMI during adulthood, the highest BMI recorded after the age of 15 years was taken (n = 6839, males = 44%, age = 33 ± 13 years, BMI = 36 ± 9 kg/m2). For analyses of childhood obesity, Pima-specific standardized BMI z-scores were calculated by dividing BMI by its standard deviation in categories of age (1-year) and sex. The maximum sex- and age-specific BMI z-score was identified between the ages of 5 and 20 years (n = 5350, males = 45%, age = 14 ± 4 years).
Analyses of metabolic phenotypes
A subset of AI from the outpatient longitudinal study was also metabolically phenotyped as inpatients in our Clinical Research Center (CRC) when they were non-diabetic (n = 555, predominately of full-heritage Pima Indian, males = 58%, age = 27 ± 6 years, BMI = 34 ± 8 kg/m2). Body composition was estimated by underwater weighing until 1994 and by dual energy x-ray absorptiometry (DPX-1, Lunar Radiation Corp.) thereafter; a conversion equation was used to make these two methods comparable (26). Pancreatic β-cell function was assessed by the AIR after a 25-g intravenous glucose bolus and calculated as the mean increment in plasma insulin concentrations from 3 to 5 min (27). A hyperinsulinemic, euglycemic clamp was used to measure rates of insulin-stimulated glucose disappearance (27). Energy expenditure over 24 h and sleeping metabolic rate (extrapolated to 24 h) were assessed using indirect whole room calorimetry (28). Spontaneous physical activity was detected by radar sensors and expressed as percentage of time in motion over the 24-h period. Sleeping metabolic rate was defined as the average energy expenditure between 01:00 am and 5:00 am during which spontaneous physical activity was <1.5% (29) and the thermic effect of the last meal was undetected (30). The 24-h respiratory quotient (RQ) was calculated as the ratio of 24-h VCO2 to 24-h VO2. A subset of individuals (n = 194, including 48 Caucasians who were additionally genotyped, males = 60%, age = 35 ± 9 years, BMI = 33 ± 8 kg/m2) also participated in an ad libitum food intake study. Ad libitum food intake was assessed over 3 days by an automated vending machine system in our CRC (31).
American Indians from urban Phoenix, analyses of T2D and DN
A cross-sectional sample of predominately urban-dwelling AI living in or near Phoenix, Arizona has recently been recruited as part of the Phoenix extension of the FIND. Individuals were ≥50% AI (any tribal heritage) and 76% reported being full-heritage Indians. Diabetes was diagnosed by fasting plasma glucose ≥ 126 mg/dl, HbA1c ≥ 6.5% or prior clinical diagnosis (23). T2D association was analyzed in 868 diabetic subjects (male = 43%, age = 44 ± 12 years) and 2238 non-diabetic subjects (male = 52%, age = 34 ± 12 years). Among diabetic subjects, DN association was analyzed in 147 DN cases (male = 50%, age = 47 ± 12 years) and 717 DN controls (male = 42%, age = 44 ± 12 years). Diabetic nephropathy was defined in the same way as in the GRIC study described above. Body mass index data in this sample set were obtained by self-report, and thus not used in these analyses.
SNP identification across PFKFB2 and genotyping
Sequence data of a ∼127.7 kb region encompassing PFKFB2 (chr1:207176620-207304368, 50 kb flanking each side of the gene, GRCh37/hg19) were obtained from whole-genome sequence data (30–40 × coverage) of 234 AI, predominately of full-heritage Pima Indians (Complete Genomics Inc., Mountain View, CA, USA; Illumina, San Diego, CA, USA). Sequenced subjects were from different nuclear families to maximize identification of genetic variation. Linkage Disequilibrium was determined using Haploview (version 4.2). Tag SNPs were selected based on the Pima sequence data using the Tagger algorithm (Haploview) with a pair-wise r2 ≥ 0.8 taken as indicative of redundancy. Genotyping utilized the SNPlex genotyping System 48-plex (Applied BioSystems, Carlsbad, CA, USA) or BeadXpress System (Illumina, San Diego, CA, USA). Quality control for genotyping required a successful call rate of >95%, lack of deviation from Hardy Weinberg equilibrium (P > 1.0 × 10⁻³) and a discrepancy rate of <2.5% for blind duplicates (>100 for each sample set).
Analyses of PFKFB2 expression levels in adipose and kidney tissues
Percutaneous abdominal adipose tissue biopsies were obtained from 201 non-diabetic AI, predominately of full-heritage Pima Indians, who had been metabolically characterized in our CRC as described above. Subjects had undergone a 12-h overnight fast prior to the biopsy, and the specimens were immediately frozen in liquid nitrogen (32). Total RNA was extracted using TRIzol reagent (Invitrogen, Carlsbad, CA, USA) and was further purified using a RNeasy Micro Kit (Qiagen, Valencia, CA, USA). cDNA was synthesized using a RETROscript Kit (Ambion, Austin, TX, USA). PFKFB2 expression levels were quantified by real-time PCR with an ABI PRISM 7900 system (Applied Biosystems, Foster City, CA, USA) using a TaqMan probe specific for PFKFB2 (Applied Biosystems, Foster City, CA, USA). PFKFB2 expression level was normalized to reference genes beta-actin or cyclophilin (Applied Biosystems, Foster City, CA, USA); both reference genes gave comparable results. The relative expression level was determined by the ΔΔCt method and expressed as 2ΔΔCt for fold change.
Kidney biopsy specimens were procured from 61 diabetic AI enrolled in a randomized, placebo-controlled, clinical trial to evaluate the renoprotective efficacy of losartan in T2D (clinicaltrials.gov, NCT00340678) (33). Biopsy tissue specimens were microdissected as described previously (34–36). Glomerular and tubule-interstitial gene expression profiling was performed using Human Genome U133A and U133plus2 Affymetrix GeneChip arrays (34,36). Image files were processed using GenePattern analysis (http://www.genepattern.com). The Robust Multichip Analysis algorithm was used to perform background adjustment, quantile normalization and summarization of probesets (37). Adjustment for batch effects was performed with Combat (38).
Statistical analyses
Statistical analyses were performed using the software of the SAS Institute (Cary, NC, USA). A logistic regression analysis was used to assess the association of genotypes with T2D including age, sex, birth-year, self-reported Pima heritage and AI/European ancestry, estimated from ancestry informative markers, as covariates. Association with DN was also analyzed by logistic regression with duration of diabetes, sex and ancestry as covariates. The model was fitted with the generalized estimating equations (GEE) to account for dependence among siblings. Genotype was analyzed as a numeric variable representing 0, 1 or 2 copies of a given allele. The association of quantitative traits with genotypes was analyzed by linear regression using the GEE procedure to account for the correlation among siblings. Results were adjusted for covariates as indicated. The individual estimate of the proportion of European ancestry was derived by the method of Hanis et al. (39) from 45 informative markers with large differences in allele frequency between populations (40) for use as a covariate in all analyses. Meta-analyses were conducted by the inverse variance method. To evaluate potential causal relationships between genotype, expression and clinical phenotypes (such as BMI and % body fat), the causal models of Schadt et al. (12) were applied. The correlations between genotype and expression, genotype and clinical phenotype and expression and clinical phenotype were calculated, and the model parameters were estimated by path analysis of these correlations (41). Three models were fitted: a ‘causal’ model in which genotype influences expression which influences clinical phenotype, a ‘reverse’ model in which genotype influences clinical phenotype which influences expression and an ‘independent’ model in which genotype influences expression and clinical phenotype directly, along with a residual correlation, and which allows for more complex relationships. Models were compared according to Akaike's Information Criterion (42).
Supplementary material
Funding
This work was supported by the intramural research program of the National Institute of Diabetes and Digestive and Kidney Diseases, National Institutes of Health. M.K. and T.L.J. were supported by NIDDK P30DK081943 George M. O′Brien Kidney Research Core Center at the University of Michigan.
Supplementary Material
Acknowledgements
We thank the clinical staff of the Phoenix Epidemiology and Clinical Research Branch for conducting the study. We also thank all the participants from the GRIC.
Conflict of Interest statement. None declared.
References
- 1.Knowler W.C., Pettitt D.J., Saad M.F., Bennett P.H. (1990) Diabetes mellitus in the Pima Indians: incidence, risk factors and pathogenesis. Diabetes Metab. Rev., 6, 1–27. [DOI] [PubMed] [Google Scholar]
- 2.Hanson R.L., Muller Y.L., Kobes S., Guo T., Bian L., Ossowski V., Wiedrich K., Sutherland J., Wiedrich C., Mahkee D., et al. (2014) A genome-wide association study in American Indians implicates DNER as a susceptibility locus for type 2 diabetes. Diabetes, 63, 369–676. [DOI] [PMC free article] [PubMed] [Google Scholar]
- 3.Malhotra A., Kobes S., Knowler W.C., Baier L.J., Bogardus C., Hanson R.L. (2011) A genome-wide association study of BMI in American Indians. Obesity, 19, 2102–2106. [DOI] [PMC free article] [PubMed] [Google Scholar]
- 4.Bian L., Traurig M., Hanson R.L., Marinelarena A., Kobes S., Muller Y.L., Malhotra A., Huang K., Perez J., Gale A., et al. (2013) MAP2K3 is associated with body mass index in American Indians and Caucasians and may mediate hypothalamic inflammation. Hum. Mol. Genet., 22, 4438–4449. [DOI] [PMC free article] [PubMed] [Google Scholar]
- 5.Hue L., Rider M.H. (1987) Role of fructose 2,6-bisphosphate in the control of glycolysis in mammalian tissues. Biochem. J., 245, 313–324. [DOI] [PMC free article] [PubMed] [Google Scholar]
- 6.Rider M.H., Bertrand L., Vertommen D., Michels P.A., Rousseau G.G., Hue L. (2004) 6-phosphofructo-2-kinase/fructose-2,6-bisphosphatase: head-to-head with a bifunctional enzyme that controls glycolysis. Biochem. J., 381, 561–579. [DOI] [PMC free article] [PubMed] [Google Scholar]
- 7.Wu C., Kang J.E., Peng L.J., Li H., Khan S.A., Hillard C.J., Okar D.A., Lange A.J. (2005) Enhancing hepatic glycolysis reduces obesity: differential effects on lipogenesis depend on site of glycolytic modulation. Cell Metab., 2, 131–140. [DOI] [PubMed] [Google Scholar]
- 8.Arden C., Hampson L.J., Huang G.C., Shaw J.A., Aldibbiat A., Holliman G., Manas D., Khan S., Lange A.J., Agius L. (2008) A role for PFK-2/FBPase-2, as distinct from fructose 2,6-bisphosphate, in regulation of insulin secretion in pancreatic beta-cells. Biochem. J., 411, 41–51. [DOI] [PubMed] [Google Scholar]
- 9.Massa L., Baltrusch S., Okar D.A., Lange A.J., Lenzen S., Tiedge M. (2004) Interaction of 6-phosphofructo-2-kinase/fructose-2,6-bisphosphatase (PFK-2/FBPase-2) with glucokinase activates glucose phosphorylation and glucose metabolism in insulin-producing cells. Diabetes, 53, 1020–1029. [DOI] [PubMed] [Google Scholar]
- 10.Baltrusch S., Langer S., Massa L., Tiedge M., Lenzen S. (2006) Improved metabolic stimulus for glucose-induced insulin secretion through GK and PFK-2/FBPase-2 coexpression in insulin-producing RINm5F cells. Endocrinology, 147, 5768–5776. [DOI] [PubMed] [Google Scholar]
- 11.Speliotes E.K., Willer C.J., Berndt S.I., Monda K.L., Thorleifsson G., Jackson A.U., Lango A.H., Lindgren C.M., Luan J., Mägi R., et al. (2010) Association analyses of 249,796 individuals reveal 18 new loci associated with body mass index. Nat. Genet., 42, 937–948. [DOI] [PMC free article] [PubMed] [Google Scholar]
- 12.Schadt E.E., Lamb J., Yang X., Zhu J., Edwards S., GuhaThakurta D., Sieberts S.K., Monks S., Reitman M., Zhang C., et al. (2005) An integrative genomics approach to infer causal associations between gene expression and disease. Nat. Genet., 37, 710–717. [DOI] [PMC free article] [PubMed] [Google Scholar]
- 13.Lee W.J., Koh E.H., Won J.C., Kim M.S., Park J.Y., Lee K.U. (2005) Obesity: the role of hypothalamic AMP-activated protein kinase in body weight regulation. Int. J. Biochem. Cell Biol., 37, 2254–2259. [DOI] [PubMed] [Google Scholar]
- 14.Li H., Guo X., Xu H., Woo S.L., Halim V., Morgan C., Wu C. (2013) A role for inducible 6-phosphofructo-2-kinase in the control of neuronal glycolysis. J. Nutr. Biochem., 24, 1153–1158. [DOI] [PMC free article] [PubMed] [Google Scholar]
- 15.Wu C., Khan S.A., Peng L.J., Lange A.J. (2006) Roles for fructose-2,6-bisphosphate in the control of fuel metabolism: beyond its allosteric effects on glycolytic and gluconeogenic enzymes. Adv. Enzyme Regul., 46, 72–88. [DOI] [PubMed] [Google Scholar]
- 16.Lee M.J., Feliers D., Mariappan M.M., Sataranatarajan K., Mahimainathan L., Musi N., Foretz M., Viollet B., Weinberg J.M., Choudhury G.G., et al. (2007) A role for AMP-activated protein kinase in diabetes-induced renal hypertrophy. Am. J. Physiol. Renal Physiol., 292, F617–F627. [DOI] [PubMed] [Google Scholar]
- 17.Cammisotto P.G., Londono I., Gingras D., Bendayan M. (2008) Control of glycogen synthase through ADIPOR1-AMPK pathway in renal distal tubules of normal and diabetic rats. Am. J. Physiol. Renal Physiol. 294, F881–F889. [DOI] [PubMed] [Google Scholar]
- 18.Hallows K.R., Mount P.F., Pastor-Soler N.M., Power D.A. (2010) Role of the energy sensor AMP-activated protein kinase in renal physiology and disease. Am. J. Physiol. Renal Physiol., 298, F1067–F1077. [DOI] [PMC free article] [PubMed] [Google Scholar]
- 19.Nangaku M. (2013) Energy policy of the kidney: launch of AMPK as a novel therapeutic target. Am. J. Physiol. Renal Physiol., 305, F977–F978. [DOI] [PubMed] [Google Scholar]
- 20.Kim J., Shon E., Kim C.S., Kim J.S. (2012) Renal podocyte injury in a rat model of type 2 diabetes is prevented by metformin. Exp. Diabetes Res., 2012, 210821. [DOI] [PMC free article] [PubMed] [Google Scholar]
- 21.Meguro S., Kabeya Y., Tanaka K., Kawai T., Tomita M., Katsuki T., Oikawa Y., Atsumi Y., Shimada A., Tanaka M., et al. (2013) Past obesity as well as present body weight status is a risk factor for diabetic nephropathy. Int. J. Endocrinol., 2013, 590569. [DOI] [PMC free article] [PubMed] [Google Scholar]
- 22.Dudbridge F., Gusnanto A. (2008) Estimation of significance thresholds for genomewide association scans. Genet. Epidemiol., 32, 227–234. [DOI] [PMC free article] [PubMed] [Google Scholar]
- 23.The Expert Committee on the Diagnosis and Classification of Diabetes Mellitus. (1997) Report of the expert committee on the diagnosis and classification of diabetes mellitus. Diabetes Care, 20, 1183–1197. [DOI] [PubMed] [Google Scholar]
- 24.Vasquez B., Flock E.V., Savage P.J., Nagulesparan M., Bennion L.J., Baird H.R., Bennett P.H. (1984) Sustained reduction of proteinuria in type 2 (non-insulin-dependent) diabetes following diet-induced reduction of hyperglycaemia. Diabetologia, 26, 127–133. [DOI] [PubMed] [Google Scholar]
- 25.Chasson A.L., Grady H.J., Stanley M.A. (1960) Determination of creatinine by means of automatic chemical analysis. Tech. Bull. Regist. Med. Technol., 30, 207–212. [PubMed] [Google Scholar]
- 26.Tataranni P.A., Ravussin E. (1995) Use of dual-energy X-ray absorptiometry in obese individuals. Am. J. Clin. Nutr. 62, 730–734. [DOI] [PubMed] [Google Scholar]
- 27.Lillioja S., Mott D.M., Spraul M., Ferraro R., Foley J.E., Ravussin E., Knowler W.C., Bennett P.H., Bogardus C. (1993) Insulin resistance and insulin secretory dysfunction as precursors of non-insulin-dependent diabetes mellitus. Prospective studies of Pima Indians. N. Engl. J. Med., 329, 1988–1992. [DOI] [PubMed] [Google Scholar]
- 28.Ravussin E., Lillioja S., Anderson T.E., Christin L., Bogardus C. (1986) Determinants of 24-hour energy expenditure in man. Methods and results using a respiratory chamber. J. Clin. Invest., 78, 1568–1578. [DOI] [PMC free article] [PubMed] [Google Scholar]
- 29.Piaggi P., Thearle M.S., Bogardus C., Krakoff J. (2013) Lower energy expenditure predicts long-term increases in weight and fat mass. J. Clin. Endocrinol. Metab., 98, E703–E707. [DOI] [PMC free article] [PubMed] [Google Scholar]
- 30.Piaggi P., Krakoff J., Bogardus C., Thearle M.S. (2013) Lower ‘awake and fed thermogenesis’ predicts future weight gain in subjects with abdominal adiposity. Diabetes, 62, 4043–4051. [DOI] [PMC free article] [PubMed] [Google Scholar]
- 31.Pannacciulli N., Salbe A.D., Ortega E., Venti C.A., Bogardus C., Krakoff J. (2007) The 24-h carbohydrate oxidation rate in a human respiratory chamber predicts ad libitum food intake. Am. J. Clin. Nutr., 86, 625–632. [DOI] [PMC free article] [PubMed] [Google Scholar]
- 32.Majer M., Mott D.M., Mochizuki H., Rowles J.C., Pedersen O., Knowler W.C., Bogardus C., Prochazka M. (1996) Association of the glycogen synthase locus on 19q13 with NIDDM in Pima Indians. Diabetologia, 39, 314–321. [DOI] [PubMed] [Google Scholar]
- 33.Weil E.J., Fufaa G., Jones L.I., Lovato T., Lemley K.V., Hanson R.L., Knowler W.C., Bennett P.H., Yee B., Myers B.D., et al. (2013) Effect of losartan on prevention and progression of early diabetic nephropathy in American Indians with type 2 diabetes. Diabetes, 62, 3224–3231. [DOI] [PMC free article] [PubMed] [Google Scholar]
- 34.Berthier C.C., Zhang H., Schin M., Henger A., Nelson R.G., Yee B., Boucherot A., Neusser M.A., Cohen C.D., Carter-Su C., et al. (2009) Enhanced expression of Janus kinase-signal transducer and activator of transcription pathway members in human diabetic nephropathy. Diabetes, 58, 469–477. [DOI] [PMC free article] [PubMed] [Google Scholar]
- 35.Cohen C.D., Frach K., Schlöndorff D., Kretzler M. (2002) Quantitative gene expression analysis in renal biopsies: a novel protocol for a high-throughput multicenter application. Kidney Int., 61, 133–140. [DOI] [PubMed] [Google Scholar]
- 36.Lindenmeyer M.T., Kretzler M., Boucherot A., Berra S., Yasuda Y., Henger A., Eichinger F., Gaiser S., Schmid H., Rastaldi M.P., et al. (2007) Interstitial vascular rarefaction and reduced VEGF-A expression in human diabetic nephropathy. J. Am. Soc. Nephrol., 18, 1765–1776. [DOI] [PubMed] [Google Scholar]
- 37.Irizarry R.A., Hobbs B., Collin F., Beazer-Barclay Y.D., Antonellis K.J., Scherf U., Speed T.P. (2003) Exploration, normalization, and summaries of high density oligonucleotide array probe level data. Biostatistics, 4, 249–264. [DOI] [PubMed] [Google Scholar]
- 38.Johnson W.E., Li C., Rabinovic A. (2007) Adjusting batch effects in microarray expression data using empirical Bayes methods. Biostatistics, 8, 118–127. [DOI] [PubMed] [Google Scholar]
- 39.Hanis C.L., Chakraborty R., Ferrell R.E., Schull W.J. (1986) Individual admixture estimates: disease associations and individual risk of diabetes and gallbladder disease among Mexican-Americans in Starr County, Texas. Am. J. Phys. Anthropol., 70, 433–441. [DOI] [PubMed] [Google Scholar]
- 40.Tian C., Hinds D.A., Shigeta R., Adler S.G., Lee A., Pahl M.V., Silva G., Belmont J.W., Hanson R.L., Knowler W.C., et al. (2007) A genomewide single-nucleotide-polymorphism panel for Mexican American admixture mapping. Am. J. Hum. Genet., 80, 1014–1023. [DOI] [PMC free article] [PubMed] [Google Scholar]
- 41.Khoury M.J., Beaty T.H., Cohen B.H. (1993) Genetic approaches to familial aggregation: I. analysis of heritability. In Khoury M.J., Beaty T.H., Cohen B.H. (eds), Fundamentals of Genetic Epidemiology, Oxford University Press, Oxford, UK, pp. 200–232. [Google Scholar]
- 42.Akaike H. (1973) Information theory and an extension of the maximum likelihood principle. In Petrov B.N., Csaki , F. (eds), 2nd International Symposium on Information Theory, Akademiai Kiado, Budapest, pp. 267–281. [Google Scholar]
Associated Data
This section collects any data citations, data availability statements, or supplementary materials included in this article.