

Background: Rate-limiting steps in the hydrolysis of recalcitrant polysaccharides by processive enzymes are not known.
Results: The predominant molecular state of bound enzyme was revealed by the type and strength of product inhibition.
Conclusion: Complexation with the polymer chain is rate-limiting for ChiA, whereas Cel7A is limited by dissociation.
Significance: Knowledge of rate-limiting steps aids the engineering of better catalysts.
Keywords: Cellulase, Cellulose, Chitin, Chitinase, Enzyme Kinetics, Product Inhibition, Rate-limiting Step
Abstract
Processive enzymes are major components of the efficient enzyme systems that are responsible for the degradation of the recalcitrant polysaccharides cellulose and chitin. Despite intensive research, there is no consensus on which step is rate-limiting for these enzymes. Here, we performed a comparative study of two well characterized enzymes, the cellobiohydrolase Cel7A from Hypocrea jecorina and the chitinase ChiA from Serratia marcescens. Both enzymes were inhibited by their disaccharide product, namely chitobiose for ChiA and cellobiose for Cel7A. The products behaved as noncompetitive inhibitors according to studies using the 14C-labeled crystalline polymeric substrates 14C chitin nanowhiskers and 14C-labeled bacterial microcrystalline cellulose for ChiA and Cel7A, respectively. The resulting observed Ki(obs) values were 0.45 ± 0.08 mm for ChiA and 0.17 ± 0.02 mm for Cel7A. However, in contrast to ChiA, the Ki(obs) of Cel7A was an order of magnitude higher than the true Ki value governed by the thermodynamic stability of the enzyme-inhibitor complex. Theoretical analysis of product inhibition suggested that the inhibition strength and pattern can be accounted for by assuming different rate-limiting steps for ChiA and Cel7A. Measuring the population of enzymes whose active site was occupied by a polymer chain revealed that Cel7A was bound predominantly via its active site. Conversely, the active-site-mediated binding of ChiA was slow, and most ChiA exhibited a free active site, even when the substrate concentration was saturating for the activity. Collectively, our data suggest that complexation with the polymer chain is rate-limiting for ChiA, whereas Cel7A is limited by dissociation.
Introduction
The recalcitrant polysaccharides cellulose and chitin are the most abundant sources of organic carbon on earth and hence are appealing as raw materials for many biotechnological applications. Enzymatic hydrolysis is an environment-friendly method for converting polysaccharides into monomeric components for further use as precursors for biofuels or commodity products. Understanding the mechanisms and rate-limiting factors of enzymatic hydrolysis is therefore of considerable importance in enzyme engineering for the development of better catalysts. As structural polysaccharides, both polymers exhibit crystalline structures that consist of linear chains of either β-1,4-linked glucose (cellulose) or N-acetylglucosamine units (NAG,2 chitin). The similar architectures of these substrates apparently reflect the similar enzymatic machineries employed in cellulose and chitin degradation. In nature, cellulose and chitin are degraded mainly by fungi and bacteria, which secrete a set of hydrolytic and oxidative enzymes. To date, the best characterized enzyme systems for the degradation of recalcitrant polysaccharides are the cellulolytic system of the fungus Hypocrea jecorina (previously referred to in the literature as Trichoderma reesei) (1) and the chitinolytic system of the bacterium Serratia marcescens (2). The major component of both enzyme systems is a reducing end-specific processive exo-enzyme, cellobiohydrolase Cel7A and chitinase ChiA (where Cel7A is cellobiohydrolase Cel7A from Hypocrea jecorina and ChiA is chitinase A from Serratia marcescens). Cel7A and ChiA share a modular structure that includes a catalytic domain (CD) and a carbohydrate-binding module (CBM). However, the CBM and CD of Cel7A are connected by a flexible linker peptide (3, 4), whereas in ChiA, the CD and CBM are more tightly connected to form a compact, elongated structure (5). Both enzymes catalyze the hydrolysis of glycosidic bonds with the retention of configuration, resulting in a disaccharide as the predominant product, cellobiose for Cel7A and chitobiose (NAG2) for ChiA. Characteristic of processive enzymes, the active sites of both Cel7A and ChiA contain multiple monomer-unit-binding sites. The active site of Cel7A has a tunnel-shaped architecture and contains 10 glucose-unit-binding sites, 7 (−7 to −1) substrate-binding sites, and 3 (+1 to +3) product-binding sites (6). The active site of ChiA exhibits a deep, cleft-like architecture and is more open than Cel7A. The CD of ChiA contains 4 substrate (−4 to −1)- and 3 product (+1 to +3)-binding sites (7–9), although in ChiA, the substrate-binding sites extend to the CBM (10), resulting in a total of 13 substrate-binding sites (8). To ensure the directional progression of the enzyme along the polymer chain, the active sites of processive enzymes possess a binding energy gradient, with the strongest binding occurring at product-binding sites (11–13). Thus, strong product binding, and hence strong product inhibition, appears to be a price of processivity (14). Consistent with these properties, cellobiose strongly binds to Cel7A, with a Kd of 20 μm (15). Inhibition of the hydrolysis of low molecular weight model substrates such as para-nitrophenyl lactoside also has a Ki of ∼20 μm (16). However, the product inhibition of Cel7A has been shown to be more than an order of magnitude weaker if studied with cellulosic substrates such as bacterial cellulose (17–19). Even weaker cellobiose inhibition of Cel7A has been reported with amorphous cellulose (IC50 = 19 mm, see Ref. 20). The same discrepancy between inhibitory strength for low molecular weight and polymeric substrates also holds for other inhibitors of Cel7A, including oligosaccharides of xylose and glucose (21, 22). The mechanisms underlying this phenomenon are not known, although the strong binding of Cel7A to the polymer chain (17, 21) or the use of different mechanisms in hydrolysis of low molecular weight and polymeric substrates, may be responsible (18). For ChiA, the hydrolysis of low molecular weight substrates was shown to be inhibited by deacetylated chitobiose, with an IC50 value of 4.1 mm (23). The pseudotrisaccharide allosamidin binds to ChiA with a Kd of 0.17 μm (24). The hydrolysis of crystalline β-chitin by ChiA is similarly strongly inhibited by allosamidin, with an IC50 of 0.17 μm, although the hydrolysis of a water-soluble, partially deacetylated derivative of chitin, chitosan, is far more resistant to inhibition, with an IC50 value of 164 μm (24). The product, NAG2, inhibition of ChiA has yet to be studied.
The hydrolysis of recalcitrant polysaccharides by exo-processive enzymes can be divided into at least four putative steps: (i) binding to the polymer surface; (ii) recognition and capture of the chain end; (iii) formation of the productive complex and processive hydrolysis of the polymer chain; and (iv) dissociation (25). Thus, product inhibition may appear weak if the rate-limiting step is not affected by the product (18). However, there is no general agreement on which step is rate-limiting. In some studies, the dissociation of Cel7A has been proposed to be the rate-limiting step (18, 26–31), whereas others support slow complexation with the polymer chain (32, 33) or disengagement of the polymer chain from the crystal lattice during processive movement (34, 35). Activation parameters measured for ChiA with the insoluble β-chitin substrate show a large entropic activation barrier (36). These results are indicative of a bimolecular (associative) rate-determining step and suggest that complexation with the chitin chain is rate-limiting for ChiA (36). The rate-limiting step may also depend on the presence of synergistic auxiliary enzymes. The dissociation-limited rate of Cel7A has been shown to change to glycosidic bond hydrolysis-limited in the presence of endoglucanase at optimal concentrations (18). One reason for these opposing hypotheses lies with the difficulty in measuring the rate constants for separate steps of the complex reaction. For example, dissociation rate constant values on the order of 0.1, 0.01, and 0.001 s−1 have been reported for Cel7A based on high speed atomic force microscopy (HS AFM) (37, 38), global kinetic modeling of progress curves and single molecule fluorescence imaging (30, 31, 39), and substrate labeling after treatment with enzyme (27), respectively. Whether these differences reflect methodological differences or the different substrates used is not known. Attempts to distinguish between different binding modes of bound enzymes have revealed that Cel7A is predominantly bound to cellulose through its active site (18, 26, 40), although the population of bound enzyme with free active site may be significant at high enzyme-to-substrate ratios (41). At the same time, enzyme attachment to cellulose via the CBM only has been reported to be the predominant state of the processive endocellulase Cel9A from the bacterium Thermobifida fusca (42), thus supporting slow complexation.
Here, we studied the product inhibition of Cel7A from H. jecorina and ChiA from S. marcescens using both low molecular weight and polymeric substrates. The strength and pattern of product inhibition suggested differences in the predominant molecular states of polymer-bound Cel7A and ChiA. Measuring the concentration of enzyme with its active site occupied by the polymer chain revealed that Cel7A was bound to cellulose predominantly through its active site, whereas bound enzyme with its active site free was the prevalent form of ChiA. Collectively, these results suggest different rate-limiting steps in polysaccharide hydrolysis by Cel7A and ChiA.
EXPERIMENTAL PROCEDURES
Materials
Crab chitin (Sigma C7170), chitobiose (Sigma D1523), 4-methyl-umbelliferyl-β-diacetylchitobioside (MU-NAG2) hydrate (Sigma M9763), bovine serum albumin (BSA), 4-methyl-umbelliferyl-β-lactoside (MUL), and cellobiose were purchased from Sigma. [1-14C]Acetic anhydride (50 mCi mmol−1) was obtained from Hartmann Analytic GmbH, Braunschweig, Germany. The scintillation mixture was purchased from Merck. All chemicals were used as purchased.
Enzymes
The wild-type chitinase gene chia from S. marcescens strain BJL200 was expressed in Escherichia coli TOP10 (Invitrogen) by growing cells for 16–18 h at 37 °C in Luria-Bertani medium containing 50 μg ml−1 ampicillin (43). Periplasmic extracts were produced as described previously (44), and the enzymes were purified using chitin affinity column chromatography, as described previously (44, 45). Chitobiase was expressed in E. coli and purified by ammonium sulfate precipitation and ion-exchange chromatography as described (46). H. jecorina Cel7A was purified from the culture filtrate of H. jecorina QM 9414 as described previously (47). β-Glucosidase was purified from Novozyme® 188 (Sigma C6105) according to a published procedure (48). Enzyme concentrations were determined from the absorbance at 280 nm using the calculated molar extinction coefficients.
Preparation of Chitin Nanowhiskers (CNWs)
A total of 35 g of crab chitin was suspended in 312 ml of water; HCl was then added to 0.55 m, and the mixture was incubated for 15 min at room temperature with stirring. After three washes with 0.55 m HCl, the chitin was washed repeatedly with water and once with 0.3 m NaOH, followed by incubation with 0.3 m NaOH at 70 °C for 1 h. The NaOH incubation was performed three times. The NaOH-treated chitin was washed repeatedly with water and four times with ethanol, followed by two incubations with acetone for 30 min at room temperature. Finally, the purified chitin was washed thoroughly with water. To make CNWs, the purified chitin was suspended in 3 m HCl and incubated at 100 °C for 90 min with stirring. The mixture was diluted 3-fold with water, neutralized by slowly adding solid NaOH, and finally buffered with 10 mm sodium acetate, pH 6.1. CNWs were washed several times with 10 mm sodium acetate, pH 6.1, and stored at 4 °C. The total concentration of CNWs was expressed on the basis of dry weight. The degree of polymerization (DP) of CNWs was determined from the reducing-end groups on CNWs, as measured by the method of Somogyi-Nelson (49).
N-Acetylation of CNWs
Briefly, 2 g of CNWs in 10 mm sodium acetate, pH 6.1, was dialyzed against methanol three times. Then 1.86 ml of acetic anhydride was added to CNWs in 100 ml of methanol, and the mixture was incubated overnight at room temperature, with stirring. Next, O-deacetylation was carried out by adding 100 mm KOH in methanol and incubated for 3 h at room temperature, with stirring. CNWs were washed repeatedly with 47.86 mm NaOH via repeated centrifugation (3500 rpm for 5 min) and resuspension. Finally, 20% acetic acid was added to adjust the pH to 6.1, after which 0.01% NaN3 was added, and CNWs were stored at 4 °C.
Preparation of 14C-Labeled CNWs (14C-CNWs)
A total of 2 g of CNWs was dialyzed against methanol three times, after which 5 mCi of [1-14C]acetic anhydride was added, and the mixture was incubated for 24 h at room temperature, with stirring, in a total volume of 85 ml. To ensure complete N-acetylation, 1.86 ml nonradioactive acetic anhydride was added to a final concentration of 230 mm and incubated overnight with stirring. O-Deacetylation, washing, and pH adjustment were performed as described above. The specific radioactivity of the 14C-CNW preparation was 4.18 × 10⁶ dpm mg−1.
Celluloses
Bacterial microcrystalline cellulose (BMCC) and 14C-labeled BMCC were prepared by HCl hydrolysis of bacterial cellulose (Gluconobacter xylinum, ATCC 53582) as described previously (19, 50). The specific radioactivity of the 14C-labeled BMCC preparation was 4.5 × 10⁵ dpm mg−1. Total BMCC concentration was determined using the anthrone sulfuric acid method (51). The DP of BMCC was determined from the reducing end groups on BMCC, as measured using the modified bicinchoninic acid method (50, 52).
Hydrolysis of 14C-CNWs and Inhibition with NAG2
14C-CNWs (0.01–2.0 mg ml−1) were incubated with ChiA (1.0 nm) in 50 mm sodium acetate, pH 6.1, supplemented with BSA (0.1 mg ml−1) at 25 °C, without stirring. The reaction was stopped at defined times by adding NaOH to 0.2 m. For t = 0, NaOH was added before ChiA. Chitin was separated by centrifugation (5 min at 104 × g), and the amount of radioactivity in the supernatant was quantified using a liquid scintillation counter. For the product inhibition assays, a defined amount of NAG2 was added to the reaction. Before centrifugation, nonradioactive CNWs were added (3 mg ml−1) to improve the sedimentation of 14C-CNWs. 14C-CNWs formed heterogeneous suspensions, and part of the radioactivity remained in the supernatant even after 20 min of centrifugation at 104 × g. This small fraction of 14C-CNWs also passed through 0.2-μm filters. We noted that 14C-CNWs sedimented much more effectively at higher concentrations. Apparently, the dense mat that forms during the sedimentation of CNWs at high concentrations traps smaller CNW particles, and in the presence of 3 mg ml−1 CNWs, the complete sedimentation of 14C-CNWs was achieved at all 14C-CNW concentrations tested.
Measuring Soluble Reducing Groups Produced by ChiA
CNWs (0.2–2.0 mg ml−1) were incubated in 600-μl reaction with ChiA in 50 mm sodium acetate, pH 6.1, supplemented with BSA (0.1 mg ml−1) at 25 °C with magnetic stirring (300 rpm). The reaction was stopped at defined times by adding NaOH to 0.2 m. For t = 0, NaOH was added before ChiA. Chitin was separated by centrifugation (5 min at 104 × g), after which 500 μl of the supernatant was used to measure the reducing groups using the 3-methyl-2-benzothiazolinone hydrazone hydrochloride method, as described previously (53).
Hydrolysis of 4-Methyl-umbelliferyl-β-Chitobioside (MU-NAG2) and Inhibition with NAG2
MU-NAG2 (0.2–20 μm) was incubated with ChiA (0.2 nm) in 50 mm sodium acetate, pH 6.1, supplemented with BSA (0.1 mg ml−1) at 25 °C without stirring. At selected times, the reaction was stopped by the addition of ammonium hydroxide to a final concentration of 0.1 m, and the concentration of released 4-methyl-umbelliferone (MU) was determined by fluorescence. The excitation and emission wavelengths were set to 360 and 450 nm, respectively. For t = 0, the ammonium hydroxide was added before ChiA. For the inhibition studies, the reactions were supplied with NAG2 at the desired concentration.
Cellobiose Inhibition of Cel7A with MUL Substrate
MUL (5.0 μm) was incubated with Cel7A (10 nm) in 50 mm sodium acetate, pH 5.0, supplemented with BSA (0.1 mg ml−1) and cellobiose (0–300 μm) at 25 °C without stirring. After 30 min of hydrolysis, the reactions were stopped by the addition of ammonium hydroxide to a final concentration of 0.1 m, and the released MU was quantified by fluorescence.
Measuring the Concentration of ChiA with Occupied Active Sites ([ChiAOA])
[ChiAOA] was measured by following the inhibition of MU-NAG2 hydrolysis by CNWs. For hydrolysis to take place, MU-NAG2 must be bound to the binding sites −2 to +2 of ChiA. Thus, all ChiA-chitin complexes that prevent the productive binding of MU-NAG2 are considered the ChiAOA population (ChiAOA, active site occupied by chitin). Free enzymes in solution, as well as all complexes with chitin where the binding sites −2 to +2 are free, are considered the ChiAFA population (ChiAFA, active site free to hydrolyze MU-NAG2). The concentration of ChiAFA is measured from the rate of MU-NAG2 hydrolysis in the presence of chitin using rates measured without chitin for calibration (in this case, [ChiAFA] equals the total concentration of ChiA). [ChiAOA] is the difference between the total concentration of ChiA and [ChiAFA].
Two experimental setups were used depending on the incubation time with chitin. In the case of short term experiments, MU-NAG2 and chitin were mixed together before the addition of ChiA. This setup is not applicable in the case of longer term experiments because of the depletion of MU-NAG2. Therefore, ChiA was first incubated with chitin for the desired time, after which an aliquot of MU-NAG2 was added to perform the test reaction for [ChiAFA].
In short term experiments (up to 240 s), the mixture of CNWs (0.01–2.0 mg ml−1) and MU-NAG2 (5.0 μm) was incubated with ChiA (1.0 nm) in 50 mm sodium acetate, pH 6.1, supplemented with BSA (0.1 mg ml−1) at 25 °C without stirring. At selected times, the reactions were stopped by the addition of NaOH to a final concentration of 10 mm. CNWs were pelleted by centrifugation (5 min at 104 × g), and the concentration of MU in the supernatant was quantified, after a suitable dilution with 0.1 m ammonium hydroxide, by fluorescence. Before centrifugation, an additional amount of CNWs was added (3 mg ml−1) to improve the sedimentation of CNWs. In the case of long term experiments (0.5–5 h), CNWs (0.25–1.0 mg ml−1) were incubated with ChiA (1.0 nm) in 50 mm sodium acetate, pH 6.1, supplemented with BSA (0.1 mg ml−1) at 25 °C without stirring. At selected times, 0.189-ml aliquots of the reaction mixture were added to 11.1 μl of 90 μm MU-NAG2 (final concentration, 5.0 μm) and incubated for 5 min before quenching with NaOH (final concentration, 10 mm). The remainder of the procedure was the same as described for the short term experiment.
Hydrolysis of 14C-Labeled BMCC and Inhibition with Cellobiose
14C-Labeled BMCC (0.05–1.0 mg ml−1) was incubated with Cel7A (10 nm) in 50 mm sodium acetate, pH 5.0, supplemented with BSA (0.1 mg ml−1) and β-glucosidase (10 nm) at 25 °C without stirring. At defined times, the reaction was stopped by adding NaOH to a final concentration of 0.1 m. Cellulose was pelleted by centrifugation (2 min at 104 × g), and the amount of radioactivity in the supernatant was quantified using a liquid scintillation counter. For t = 0, NaOH was added before Cel7A. For the inhibition studies, the reactions were supplied with cellobiose at the desired concentration, and β-glucosidase was omitted.
Measuring the Concentration of Cel7A with Occupied Active Sites ([Cel7AOA])
[Cel7AOA] was measured by following the inhibition of MUL hydrolysis by BMCC. Productive MUL binding occurs at binding sites −2 to +2 of Cel7A, and the rationale for measuring [Cel7AOA] is the same as described for ChiA with MU-NAG2. Because the hydrolysis of MUL by Cel7A is slow, only the experimental setup in which MUL and BMCC were mixed together before the addition of Cel7A was used. The mixture of MUL and BMCC (0.05–2.0 mg ml−1) was incubated with Cel7A (10 nm) in 50 mm sodium acetate, pH 5.0, supplemented with BSA (0.1 mg ml−1) and β-glucosidase (10 nm) at 25 °C without stirring. The concentration of MUL was 5.0 μm (in the case of 0.5–5 h experiments) or 20 μm (in the case of short term experiments up to 180 s). At selected times, the reactions were stopped by the addition of ammonium hydroxide to a final concentration of 0.1 m. BMCC was pelleted by centrifugation (2 min at 104 × g), and the concentration of MU in the supernatant was quantified by fluorescence. The concentration of Cel7A with free active sites ([Cel7AFA]) was determined from the rates of MUL hydrolysis in the presence of BMCC using calibration curves generated without BMCC. [Cel7AOA] was calculated as the difference between the total concentration of Cel7A and [Cel7AFA].
Isothermal Titration Calorimetry (ITC) Experiments
ITC experiments were performed using a VP-ITC system from Microcal, Inc. (Northampton, MA) (54). Solutions were thoroughly degassed prior to the experiments to avoid air bubbles in the calorimeter. Typically, 15 μm ChiA in 20 mm potassium phosphate buffer, pH 6.0, was placed in the reaction cell with a volume of 1.42 ml, and a 3 mm solution of NAG2 in the buffer as the protein solution was placed in the ITC syringe. Aliquots of 5 μl were injected into the reaction cell at 140-s intervals, with a stirring speed of 260 rpm. The titrations were complete after 55 injections. The shape of the ITC binding curve is determined by the so-called Wiseman c-value, which can be expressed as: c = nKa[M]t, where n is the stoichiometry of the reaction; Ka is the equilibrium binding association constant; and [M]t is the protein concentration. Normally, ITC experiments should be optimized to produce c-values in the range of 10 < c < 1000. This ensures that Ka can be determined from the Wiseman binding isotherm. Titrating NAG2 into ChiA yielded a c-value of 0.04. Binding thermodynamics can be obtained using ITC even if c is in the range of 0.01 < c < 10, provided a sufficient portion of the binding isotherm is used for analysis (55). This is achieved by ensuring a high molar ratio of ligand versus protein at the end of the titration, accurate knowledge of the concentrations of both ligand and receptor, an adequate level of signal-to-noise in the data, and known stoichiometry. All of these conditions were met, with the possible exception of stoichiometry. Previously, ChiA has been shown to bind more than one ligand at the same time (56, 57). Because of this, the experimental data were fitted to theoretical data using both the “One Set of Sites Model” as well as the “Two Sets of Sites Model” using the Microcal Origin version 7.0 software accompanying the VP-ITC system. Both models yielded identical binding association constants.
RESULTS
Preparation of 14C-Labeled Chitin
Studies of product inhibition of enzymes are complicated by the difficulty of determining product formation rates in the presence of high concentrations of product added as inhibitor. This problem can be overcome by using radioactively labeled substrates. For example, uniformly 14C-labeled cellulose substrates have proven invaluable for studies of product inhibition of cellulases (19). To study the product inhibition of chitinase, we prepared 14C-labeled microcrystalline chitin, or [14C]chitin nanowhiskers (14C-CNWs). CNWs were prepared by heterogeneous acid hydrolysis of commercially available crab chitin. 14C labeling of CNWs using [14C]acetic anhydride requires the presence of free amino groups in CNW preparation. Although chitin is a polymer of NAG units, chitin preparations always contain a small amount of deacetylated glucosamine units. The degree of acetylation of CNWs prepared from crab chitin was previously estimated to be 81% (58). CNWs were acetylated using [14C]acetic anhydride under heterogeneous conditions to preserve the crystalline nature of the CNWs. Acetylation of CNWs resulted in an ∼3-fold increase in the activity of ChiA (Fig. 1A), suggesting a negative effect of the glucosamine units. Because the CNWs were acetylated under heterogeneous conditions, the 14C label is not expected to be distributed equally within the CNW microcrystals. Therefore, the relationship between the released radioactivity and the total degradation of 14C-CNWs upon hydrolysis by ChiA must be determined before the substrate can be used in kinetic studies. To perform this calibration, 14C-CNWs were hydrolyzed by ChiA, and the formation of reducing groups was measured using a chemical method (53) in parallel with measurements of released radioactivity. As shown in Fig. 1B, all data points obtained at different enzyme-to-substrate ratios and times fell along the same line. Because NAG2 is the predominant product of ChiA, the concentration of reducing groups was taken to be equal to the concentration of NAG2 when calculating the degree of 14C-CNW conversion on the basis of released reducing groups. At low degrees of conversion (below 1% on the reducing-groups basis), there was a near linear correlation between the radioactivity and reducing groups released, with ∼3-fold more radioactivity released than reducing groups. At higher degrees of conversion, however, the line curved upward (Fig. 1B). This behavior is consistent with the heterogeneous acetylation of CNWs, with more acetyl groups being introduced to the chitin chains on the surface layers of CNW microcrystals (58). For the subsequent studies, an exponential function was used to calibrate 14C-CNW hydrolysis (Equation 1).
RG% and 14C% represent the degree of 14C-CNW conversion on the basis of released reducing groups and radioactivity, respectively, and a and b are constants.
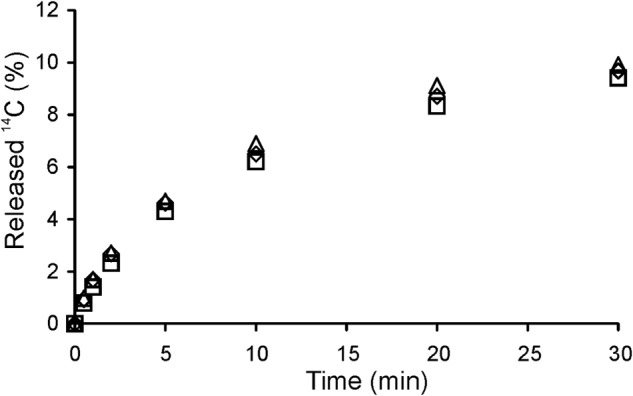
FIGURE 1.
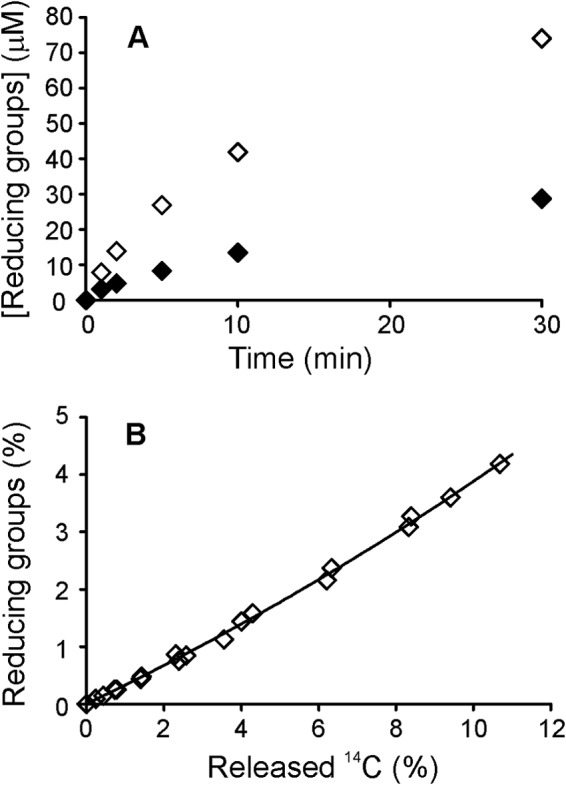
14C-Labeled chitin nanowhiskers (14C-CNWs) as a substrate for ChiA. A, release of soluble reducing groups (in NAG2 equivalents) during the hydrolysis of original CNWs (♦) and heterogeneously acetylated CNWs (♢), both at 1.0 mg ml−1, by 10 nm ChiA. B, release of radioactivity and soluble reducing groups (in NAG2 equivalents) during the hydrolysis of 14C-CNW prepared by heterogeneous acetylation of original CNWs with [14C]acetic anhydride. The concentrations of ChiA and 14C-CNWs, as well as hydrolysis time, were varied between 10–20 nm, 0.5–2.0 mg ml−1, and 0.5–20 min. The solid line represents the best fit according to Equation 1.
Hydrolysis of CNWs by ChiA and Product Inhibition with NAG2
First, the hydrolysis of nonlabeled CNWs by ChiA was followed. Characteristic of the hydrolysis of recalcitrant polysaccharides, the time curves were already nonlinear at a very low degree of CNW conversion. Different enzyme- and substrate-related factors have been proposed as being responsible for the rapid decrease in hydrolysis rates (59). The most common explanation is that heterogeneous substrates contain multiple sub-substrates that are differentially accessible to enzymes. The initial rapid degradation of the “good” substrate results in decreased hydrolysis rates. In this case, the rates measured at low CNW concentrations are expected to drop faster than those measured at high CNW concentrations. However, the rate of CNW hydrolysis decreased similarly at both high and low CNW concentrations, suggesting that substrate heterogeneity is not the sole cause of the rate retardation. Another possible factor contributing to rate retardation is strong product inhibition of ChiA. To elucidate the role of product inhibition, 14C-CNWs were hydrolyzed by ChiA in the presence of chitobiase, an enzyme that splits NAG2 into two molecules of NAG. The presence of excess chitobiase activity had no effect on the activity of ChiA toward 14C-CNWs (Fig. 2) ruling out product inhibition as a contributor to rate retardation under our study conditions. Studies of cellulose hydrolysis have shown that decreases in hydrolysis rates seem to correlate with hydrolysis time, and hence, the progress curves have been described using the equations of fractal-like kinetics (60, 61). Short hydrolysis times and very low ChiA concentrations (1.0 nm) revealed linear progress curves, with a short lag phase observed at higher 14C-CNW concentrations (Fig. 3A). The slopes of the linear regions were used to measure the “initial rates” (“v0”). The term initial rate is placed in quotation marks because it relies solely on the linearity of the progress curves and does not imply that the reaction has reached a true steady state. Initial rates measured at different 14C-CNW concentrations were consistent with the Michaelis-Menten equation, with a limiting v0/E0 value of 12.0 ± 0.3 s−1 and a Km value of 0.10 ± 0.01 mg ml−1 (Fig. 3B). To study the product inhibition of ChiA, the initial rates were measured in the presence of added NAG2. The hydrolysis of 14C-CNWs in the presence of NAG2 (Fig. 3B) was consistent with the Michaelis-Menten equation, and the data were analyzed according to Equation 2.
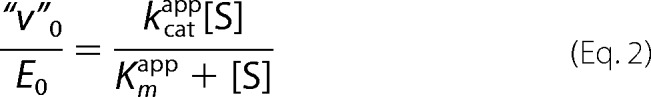 |
[S] is the concentration of 14C-CNWs (mg ml−1); E0 is the total concentration of enzyme; and kcatapp (s−1) and Kmapp (mg ml−1) are the apparent catalytic constant and Michaelis constant, respectively. Plotting the parameter values against the NAG2 concentration (Fig. 3, C and D) reveals a pattern characteristic of noncompetitive inhibition, as kcatapp decreases with increasing NAG2 concentrations (Ki(obs) = 0.50 ± 0.22 mm), whereas Kmapp seems independent of NAG2. The influence of the inhibitor on the parameter values was analyzed according to Equation 3.
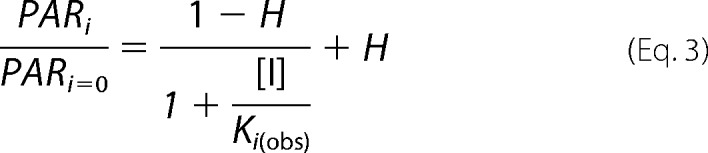 |
PARi and PARi = 0 are parameter values measured in the presence and absence of the inhibitor (I), respectively; [I] is the concentration of inhibitor; Ki(obs) is the observed inhibition constant; and H is the noninhibited fraction of the parameter value. As in studies of the inhibition of cellulases (17–19), the parameter H was introduced to improve the fit, and it suggests partial inhibition. The reasons for this apparent partial inhibition are not known. Setting H = 0 in analyses resulted in Ki(obs) values that were 56% higher on average. NAG2 inhibition was also studied at higher degrees of chitin conversion using longer incubation times. Because of the nonlinearity of the progress curves (Fig. 3E), the average product concentrations at fixed times were first used for the analysis. The product formation after fixed time measured at different 14C-CNW concentrations was consistent with the Michaelis-Menten equation, although the observed Km value increased with the hydrolysis time (Fig. 3C). Supplementing the reactions with NAG2 decreased the maximum product concentration released after fixed time (Pmax) (Fig. 3D), whereas the observed Km value was not affected (Fig. 3C). The inhibition of Pmax was independent of the hydrolysis time, with an average Ki(obs) value of 0.36 ± 0.02 mm. We also analyzed the NAG2 inhibition using the time-dependent rates (vt) of product (P) formation. For this analysis, the progress curves were fitted to a simple two-parameter equation (61). The values of the empirical parameters a and b obtained by fitting were used to calculate the rate at different hydrolysis times (Equation 4).
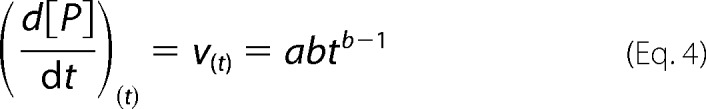 |
The rates-based analysis was also consistent with the Michaelis-Menten equation (Fig. 3F), and the results were similar to those obtained using the simple average product concentration-based analysis. Km value seemed unaffected by NAG2, whereas Vmax value was inhibited with a Ki(obs) value of 0.47 ± 0.21 mm (Fig. 3D). Comparing the effect of NAG2 on kcat, Pmax, and Vmax values revealed no differences in Ki(obs) values within error limits (Fig. 3D). The inhibition of polysaccharide hydrolysis is often studied at a single substrate concentration, with the results expressed as IC50 values. Therefore, we also tested whether the IC50 values obtained using this simplified approach are consistent with the Ki(obs) values. Within error limits, the IC50 values seemed to be independent of the hydrolysis time and the 14C-CNW concentration. An average IC50 value of 0.42 ± 0.18 mm was determined using data points measured at different hydrolysis times and 14C-CNW concentrations. This figure is consistent with the Ki(obs) values, demonstrating that the use of this simplified approach is justified under our study conditions.
FIGURE 2.
Influence of stirring and supplementation with chitobiase on the hydrolysis of 14C-CNWs by ChiA. 14C-CNWs (0.5 mg ml−1) were incubated with 10 nm ChiA, and the release of radioactivity was followed over time. Reactions were performed in 50 mm sodium acetate, pH 6.1 (BSA 0.1 mg ml−1), at 25 °C without stirring and chitobiase (♢), with stirring (300 rpm) but without chitobiase (□), and without stirring but in the presence of 20 nm chitobiase (trio).
FIGURE 3.
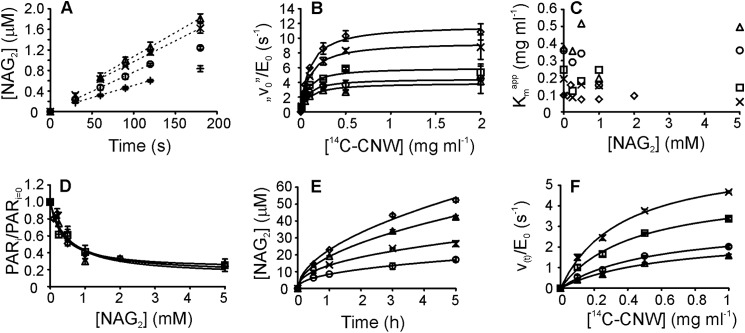
Hydrolysis of 14C-CNWs by ChiA and product inhibition with NAG2. A, short term hydrolysis of 14C-CNWs by 1.0 nm ChiA. The concentration of 14C-CNWs was 0.05 (+), 0.1 (○), 0.25 (×), and 0.5 (trio) mg ml−1. The slopes of the linear regions (dashed lines) of the progress curves were used to calculate the initial rates (v0). B, dependence of the observed rate constant v0/[E]0 on the concentration of 14C-CNWs at different concentrations of added NAG2. The concentration of added NAG2 was 0 (♢), 0.1 (×), 0.5 (□), 1.0 (○), and 2.0 (trio) mm. Solid lines represent the best fit according to Equation 2. C, dependence of the apparent Michaelis constant (Kmapp), based on the average product concentration at different hydrolysis times, on the inhibitor (NAG2) concentration. Hydrolysis time was initial rate (♢), 0.5 (×), 1.0 (□), 3.0 (○), and 5.0 (trio) h. D, dependence of the enzyme kinetics parameter (PAR) on the inhibitor (NAG2) concentration. PAR(i) and PAR(i = 0) are parameter values measured in the presence and absence of inhibitor, respectively. PAR was the initial rates-based kcat value (♢), the time-dependent rates-based Vmax value (trio), or the average product formation-based [P]max value (□). Solid lines represent the best fit according to Equation 3. E, longer term hydrolysis of 14C-CNWs by 1.0 nm ChiA. The concentration of 14C-CNWs was 0.1 (○), 0.25 (×), 0.5 (trio), and 1.0 (♢) mg ml−1. Solid lines represent the best fit according to Equation 4. F, time-dependent hydrolysis rate, v(t)/[E]0, as a function of the 14C-CNW concentration. v(t)/[E]0 values were found after 0.5 (×), 1.0 (□), 3.0 (○), and 5.0 (trio) h of hydrolysis. Solid lines represent the best fit according to Equation 2.
The Ki(obs) and IC50 values for 14C-CNW hydrolysis by ChiA were on the same order as the IC50 values measured for cellobiose inhibition of H. jecorina Cel7A with cellulose substrates (18, 19). However, a common feature of product inhibition of glycoside hydrolase family 7 cellobiohydrolases is that the inhibition studied using cellulosic substrates appears much weaker than that studied using low molecular weight model substrates such as MUL (19). This prompted us to study the NAG2 inhibition of ChiA using a low molecular weight substrate, MU-NAG2. The hydrolysis of MU-NAG2 by ChiA displays complex nonhyperbolic kinetics, with apparent positive cooperativity at low MU-NAG2 concentrations (Fig. 4A) and apparent substrate inhibition at high MU-NAG2 concentrations (44, 62), thus preventing the determination of kcat and Km values. The hydrolysis of MU-NAG2 in the presence of NAG2 showed partial inhibition with higher residual activities observed at lower MU-NAG2 concentrations (Fig. 4B). Measurements made at various low concentrations of MU-NAG2 yielded an IC50 value of 0.32 ± 0.11 mm. This figure is almost an order of magnitude lower than the IC50 values measured for the inhibition of ChiA by deacetylated NAG2 (23), indicating a positive effect of acetyl groups on the binding of NAG2 to ChiA. The hydrolysis of MUL by Cel7A is consistent with Michaelis-Menten kinetics (15, 63). Therefore, the value of the true inhibition constant (Ki) measured using the MUL substrate is expected to represent the value of the equilibrium dissociation constant of the enzyme-inhibitor complex (Kd). Because of the complex kinetics of MU-NAG2 hydrolysis by ChiA, the binding of NAG2 to ChiA was also studied using ITC. The ITC experiments produced a Kd value of 0.40 ± 0.1 mm for the binding of NAG2 to ChiA. This figure is in the same range as the IC50 value measured for ChiA using MU-NAG2 as the substrate. Most interestingly, both the IC50 value measured for ChiA with MU-NAG2 and the Kd value from ITC are close to the Ki(obs) values measured with 14C-CNWs as the substrate. This finding differs from previous observations made with processive cellulases and implies different mechanisms or rate-limiting steps in the hydrolysis of insoluble substrate by these enzymes.
FIGURE 4.
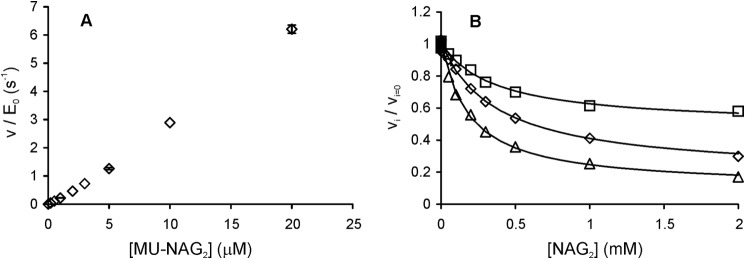
Hydrolysis of MU-NAG2 by ChiA (0.2 nm) and inhibition with NAG2. Reactions were performed in 50 mm sodium acetate, pH 6.1 (BSA 0.1 mg ml−1), at 25 °C. A, ratio of the initial rate of MU-NAG2 hydrolysis (v) and the total concentration of ChiA (E0) as a function of the substrate concentration. B, initial rates of MU-NAG2 hydrolysis measured in the presence (vi) and absence (vi = 0) of added inhibitor NAG2. The concentration of MU-NAG2 was 1.0 (□), 5.0 (♢), and 20 (trio) μm. Solid lines represent the best fit according to Equation 3. An average IC50 value of 0.32 ± 0.11 mm was calculated from the inhibition at different MU-NAG2 concentrations.
Hydrolysis of Bacterial Microcrystalline Cellulose by Cel7A and Product Inhibition with Cellobiose
The weaker product inhibition of Cel7A with cellulosic substrates relative to that measured with low molecular weight substrates is well documented (19). Inhibition studies are usually performed at one substrate concentration, with the results expressed as IC50 values (17, 19, 20). Therefore, one possible explanation is that competitive inhibition is studied under conditions in which the substrate concentration is much higher than the Km value (17, 21). Another complication may be associated with the relatively high enzyme concentrations used in cellulase inhibition studies (usually between 0.1 and 1.0 μm). Because the number of enzyme-accessible polymer chain ends is low, the assumption of excess substrate may not hold. Because of the multimode binding and possible traffic jams on the cellulose surface, it has been suggested that the performance of Cel7A should be measured at low nanomolar enzyme concentrations (38, 41). Therefore, we studied the cellobiose inhibition of Cel7A (10 nm) with 14C-labeled BMCC (0.05–1.0 mg ml−1). Given that the amount of reducing groups in our 14C-labeled BMCC preparation is 26.3 μmol g−1, the substrate was expected to be in excess at all 14C-labeled BMCC concentrations used. As in case of ChiA and 14C-CNWs, the time curves of 14C-labeled BMCC hydrolysis were nonlinear (Fig. 5A). However, the values of the observed rate constants (v(t)/E0) for Cel7A and 14C-labeled BMCC (Fig. 5B) were more than an order of magnitude lower than the corresponding values for ChiA (Fig. 3F). An average Km value of 0.10 ± 0.02 mg ml−1 was measured for Cel7A with 14C-labeled BMCC, although Km values slightly decreased with hydrolysis time regardless of whether it was determined on an average product concentration or rate basis. The cellobiose inhibition of Cel7A revealed no significant differences in IC50 values measured at different 14C-labeled BMCC concentrations (Fig. 5C). The low activity of Cel7A and the moderate specific radioactivity of 14C-labeled BMCC resulted in high measurement errors and did not permit precise analysis of the influence of cellobiose on kcat and Km values. However, the fact that the IC50 was independent of the 14C-labeled BMCC concentration (varying between 0.5 Km and 10 Km) suggests noncompetitive inhibition. This rules out the possibility that the weak inhibition of Cel7A observed with cellulosic substrates is due to the experimental conditions under which competitive inhibition is studied, with substrate concentrations much higher than the Km values. An average IC50 value of 0.17 ± 0.02 mm was measured for the cellobiose inhibition of Cel7A with 14C-labeled BMCC as the substrate. We also measured the cellobiose inhibition of Cel7A with MUL as the substrate, and the resulting IC50 value was 18 ± 3 μm. Given the competitive inhibition and assay conditions, wherein [MUL] ≪ Km(MUL), this IC50 value represents the value of the true Ki. Thus, contrary to ChiA, the IC50 value found for Cel7A with 14C-labeled BMCC was about an order of magnitude higher than the value of the true Ki.
FIGURE 5.
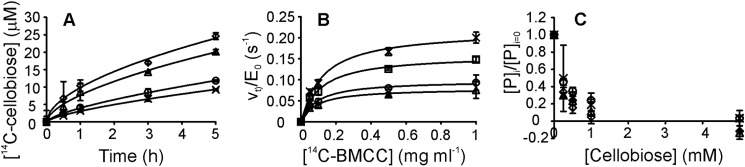
Hydrolysis of 14C-labeled BMCC by Cel7A and product inhibition with cellobiose. A, formation of 14C-labeled soluble sugars (in cellobiose equivalents) during the hydrolysis of 14C-labeled BMCC by 10 nm Cel7A. The concentration of 14C-labeled BMCC was 0.05 (×), 0.1 (○), 0.5 (trio), and 1.0 (♢) mg ml−1. Solid lines represent the best fit according to Equation 4. B, time-dependent hydrolysis rate, v(t)/[E]0, as a function of the 14C-labeled BMCC concentration. v(t)/[E]0 values were found after 0.5 (×), 1.0 (□), 3.0 (○), and 5.0 (trio) h of hydrolysis. Solid lines represent the best fit according to Equation 2. C, influence of added inhibitor (cellobiose) on product formation in the hydrolysis of 14C-labeled BMCC by Cel7A. [P](i) and [P](i = 0) are product concentrations measured in the presence and absence of added inhibitor, respectively. [P](i)/[P](i = 0) ratios are averages after 3 and 5 h of hydrolysis. The concentration of 14C-labeled BMCC was 0.05 (×), 0.1 (○), 0.5 (trio), and 1.0 (♢) mg ml−1.
Theoretical Analysis of Product Inhibition
The catalytic cycle that underlies the hydrolysis of an insoluble polysaccharide by a processive exo-enzyme can be divided into at least four putative steps as follows: (i) binding to the polymer surface; (ii) recognition and capture of the chain end; (iii) formation of the productive complex and the processive hydrolysis of the polymer chain; and (iv) dissociation (25). The simplest scheme accounting for these four steps is illustrated in Fig. 6. Free enzyme binds to the polymer surface to form a nonproductive enzyme-substrate complex (E*S). Both ChiA and Cel7A are reducing end-specific exo-enzymes; thus, the next step in catalysis is to find and capture the reducing end of the polymer chain. The initial capture of the chain end is followed by the sliding of the enzyme toward the nonreducing end of the polymer until the formation of a productive complex (ES), with the reducing end in product binding site +2. Because the initial capture of the chain end by the lateral diffusion of the enzyme along the polymer surface and the stepwise progression of the chain in the active site tunnel are both first-order reactions, they cannot be distinguished in steady-state experiments and are thus collectively referred to as nonproductive complexes (Fig. 6C). The distribution of enzyme between the ES and the pre-slide complex, E*S(−1) (Fig. 6C), can be characterized by the partition coefficient Kp = k5/k−5. To ensure processive movement, the binding energy gradient in the active-site tunnel favors the formation of the productive complex, such that Kp is expected to be high (11, 12). However, if both k6 and k−4 are much higher than k−5, E*S(−1) may dominate over ES despite the high Kp value (Fig. 6). Upon hydrolysis of the glycosidic bond (k6), an E*SI complex is formed in which the polymer chain end is located in binding site −1. Thus, in the case of product inhibition, the E*SI complex is an intrinsic part of the catalytic cycle. In Fig. 6, k6 is a lumped rate constant that includes the rate constants for the breakage of the glycosidic bond and the hydrolysis of the covalent glycosyl-enzyme or the noncovalent oxazolinium ion intermediate in Cel7A or ChiA, respectively. In Fig. 6, the hydrolysis of the intermediate is assumed to take place before product dissociation (k−4). Although there is no experimental evidence to support this sequence, molecular dynamics simulations have suggested that the cellobiose product contributes to coordinate the water molecule in the hydrolysis step of the glycosyl-enzyme intermediate in Cel7A and thus does not leave the enzyme before the hydrolysis of the intermediate (64). Product formation by the ES complex is given by the lumped rate constant k9. In Fig. 6, it is also assumed that there is no enzyme release from the ES complex after product formation. This assumption is supported by the fact that the measured values of processivity for Cel7A (18, 27) and ChiA (65, 66) are much lower than the degree of polymerization of the substrate, meaning that the release of enzyme by complete hydrolysis of the polymer chain is unlikely. The trapped-enzyme complex (E*ST) (Fig. 6B) is not a prerequisite complex in the catalytic cycle of processive enzymes. However, many studies of Cel7A (26–29, 67), as well as of other cellulases (68), have lead to the hypothesis that the processive movement of an enzyme is limited by steric obstacles on the polymer surface. A recent study of the processivity of ChiA also supports this model (66). Assuming that the dissociation of the enzyme is much slower than the processive run, the rate constant k7 represents the rate constant for passing through one processive run and is related to the catalytic constant (kcat) and the apparent processivity (Papp) according to k7 = kcat/Papp (18). Steady-state treatment of the mechanisms in Fig. 6 using software for the King Altman procedure (69) resulted in complex equations containing squared terms for the inhibitor and substrate concentrations (supplemental Equations S1 and S2). Therefore, the influence of product inhibition on enzyme kinetics was analyzed numerically. First, we analyzed product inhibition using a simpler mechanism that lacks the E*ST complex (Fig. 6A). The type of product inhibition was dependent on the prevalent form of bound enzyme in the absence of inhibitor. If the prevalent complex is productive (high Kp), we observe competitive inhibition, whereas enzymes with low Kp values show mixed inhibition (or noncompetitive inhibition if the two Ki values are equal). The same conclusions have been reached regarding the inhibition of cellulases (17, 70). However, the simpler mechanism failed to account for the weaker product inhibition with polymeric substrate relative to the that measured with low molecular weight substrate, i.e. Ki(obs) > Ki, where Ki is the true inhibition constant governed by the thermodynamic stability of the enzyme-inhibitor complex. Introducing the E*ST complex (Fig. 6B) resulted in Ki(obs) > Ki, with more prominent effects observed at lower off rates (lower k−1, k−2, and k−8) (Fig. 6B). Thus, the product inhibition of Cel7A can be accounted for by a mechanism in which the prevalent complex is the E*ST complex. The noncompetitive inhibition of ChiA implies that the prevalent complex is the E*S complex. Because the inhibition strength for ChiA was similar with both chitin and MU-NAG2 (suggesting Ki(obs) ≈ Ki), it is not strictly necessary to assume the E*ST complex, although its presence cannot be excluded (scenario with high off rate in Fig. 6B). It must also be noted that both Cel7A and ChiA have been shown to use endo-mode initiation (27, 71). In the case of both exo- and endo-mode initiation, the substrate-dependent binding from solution results in the formation of a nonproductive complex. Also in both cases the inhibitor does not compete with binding from solution but with the formation of the productive complex from the nonproductive complex. Therefore, the mode of initiation can be expected to have no influence on the type and strength of product inhibition modeled in Fig. 6.
FIGURE 6.

Theoretical analysis of product inhibition. A, simplest scheme describing the hydrolysis of a polymeric substrate by a processive enzyme. Free enzyme (E) binds to the polymer to form a nonproductive enzyme-substrate complex (E*S). Only the E*S complex in which the polymer chain end is in substrate-binding site −1 is shown in the scheme, although E*S includes a number of nonproductive complexes that are linked to each other through first-order reactions (C). The productive complex (ES) is formed from E*S through the sliding of the enzyme along the polymer chain by two monomer units (k5). Product (P) formation is given by the rate constant k9, which is a lumped rate constant that includes the rate constants for glycosidic bond hydrolysis (k6), the expulsion of the disaccharide product (k−4), and sliding (k5). Note that there is no enzyme release from the polymer after product formation. Product inhibition was analyzed according to supplemental Equation S1. The influence of the value of the partition coefficient, Kp, on product inhibition was assessed by varying the value of the rate constant for sliding (k5). The values of the other rate constants were fixed to the values of k1 = k2 = 0.1 ml mg−1 s−1; k−1 = k−2 = 0.01 s−1; k3 = k4 = 106 m−1 s−1; k−3 = k−4 = 103 s−1, k−5 = 100 s−1; and k6 = 10 s−1. In separate analyses, the value of k5 was set to 10, 100, and 1000 s−1, resulting in Kp values of 0.1, 1.0, and 10, respectively. Because k−5 = 10 k6, the distribution of enzyme between ES and E*S is governed by the Kp value. The values of both the true competitive inhibition constant Kic = k−3/k3 and the true uncompetitive inhibition constant Kiu = k−4/k4 were set to 10−3 m. The values of the observed competitive (Kic(obs)) and uncompetitive (Kiu(obs)) inhibition constants were found by numerical analysis of the effect of inhibitor on kcat/Km and kcat, respectively. B, scheme for the hydrolysis of a polymeric substrate by a processive enzyme with a trapped-enzyme complex (E*ST). The progressive hydrolysis of polymer chain continues until the enzyme encounters an obstacle and gets stuck in the E*ST complex. The average length of a processive run is given by the average length of the obstacle-free path on the polymer (18). The enzyme is assumed to be unable to remove an obstacle; thus, the only way to escape from the E*ST is through dissociation (k−8). The remaining complexes are as in A. Product inhibition was analyzed according to supplemental Equation S2. The influence of the off-rate (koff) on product inhibition was assessed by varying the values of the dissociation rate constants, koff = k−1 = k−2 = k−8. The values of k5 (Kp = 0.1) and k7 were fixed to 10 and 0.02 s−1, respectively. The formation of E*ST by direct binding from solution was assumed to be negligible; thus, the value of k8 was set to 0. The values of the other rate constants and true inhibition constants were fixed to the values given, and the values of the observed inhibition constants were determined as described in A. C, nonproductive enzyme-substrate complexes form through sequential first-order reactions, starting from the enzyme-bound via the CBM only (E*SCBM). Upon the location and capture of a reducing end of the polymer chain, a complex with the chain end in binding site −7 (E*S−7) is formed, followed by the progression of the chain in the active site tunnel until the eventual formation of E*S−1 (E*S in A and B). Note that complexes E*SCBM through E*S−3 appear as a population of enzymes with a free active site (EFA) for the hydrolysis of low molecular weight model substrates (MU-NAG2 and MUL) in the presence of polymer, whereas complexes E*S−2 and E*S−1 appear, along with the productive ES and trapped E*ST complexes, as the population whose active site is occupied (EOA).
Measuring the Concentration of Enzyme with the Active Site Occupied by Polymer Chain
The concentration of bound enzyme with the active site occupied by the polymer chain can be measured by following the inhibition of the hydrolysis of a low molecular weight model substrate (reporter molecule) by the polymer (26, 40, 72). Cel7A is well known to bind cellulose predominantly through the active site (26, 40), although at high enzyme-to-substrate ratios, the population of bound enzyme with its active site free may be significant (41). The noncompetitive inhibition of ChiA suggested that ChiA exists predominantly in the nonproductive E*S complex. The E*S complex includes a number of nonproductive complexes, starting from ChiA bound to chitin through the CBM, followed by complexes with the chitin chain progressing through the active-site cleft until the formation of the complex with the reducing end of the chitin chain in substrate-binding site −1 (Fig. 6C). The distribution of ChiA between these different complexes can be at least partly resolved by following the inhibition of MU-NAG2 hydrolysis by chitin. To permit the hydrolysis of MU-NAG2, binding sites −2 to +2 must be free from the chitin chain. Thus, aside from the free enzyme in solution, all complexes up to that with the chitin chain end in the substrate-binding site −3 (E*S(−3) in Fig. 6C) are accessible to MU-NAG2 and are collectively referred to as ChiA with a free active site (ChiAFA, active site free to hydrolyze MU-NAG2). All other complexes exclude the hydrolysis of MU-NAG2 and are collectively referred to as ChiA with an occupied active site (ChiAOA, active site occupied by chitin). In this experiment, [ChiAFA] was measured by following the hydrolysis of MU-NAG2 (5.0 μm) in the presence of chitin, and [ChiAOA] was determined as a difference between the total ChiA concentration and [ChiAFA]. Incubation times were selected such that the rates of MU-NAG2 hydrolysis correspond to the initial rates (vMU). Experiments performed in the absence of chitin revealed a linear relationship between vMU and the concentration of ChiA, and the slope of the line was used for calibration (Fig. 7A). Control experiments demonstrated that 5.0 μm MU-NAG2 had no effect on the hydrolysis of 14C-CNWs by ChiA (data not shown). The hydrolysis of MU-NAG2 by ChiA was moderately inhibited by CNWs, indicating the presence of a population of ChiAOA (Fig. 7B). In the initial stage (first 180 s) of CNW hydrolysis, the concentration of ChiAOA increased with time; however, the majority of ChiA remained in the form of ChiAFA even in the case of saturating CNW concentrations (Fig. 7C). The concentration of ChiAOA was also measured after more extended hydrolysis of CNW and revealed an apparent leveling off after 1 h of hydrolysis, although a slight decrease in [ChiAOA] with increasing hydrolysis time can be seen at lower CNW concentrations (Fig. 7D). The fraction of ChiA bound to CNWs through the active site ([ChiAOA]/E0) at different CNW concentrations and hydrolysis times followed the Michaelis-Menten equation, with the values of observed parameters Km and [ChiAOA]max/E0 both increasing with hydrolysis time (Fig. 7E). Plotting the observed rate constant of CNW hydrolysis (v(t)/[ChiAOA]) as a function of time reveals its rapid decrease in time, with somewhat higher activity of active-site-bound enzyme retained at higher CNW concentrations (Fig. 7F).
FIGURE 7.

Measuring the concentration of enzyme bound to polymer via the active site (EOA). A, dependence of the initial rates of MU-NAG2 hydrolysis on ChiA concentration in the absence of chitin. The solid line represents the best fit of linear regression. The slope of the line was used to calculate the concentration of ChiA with a free active site (ChiAFA) from the rate of MU-NAG2 hydrolysis in the presence of chitin. B, hydrolysis of MU-NAG2 (5.0 μm) by ChiA (1.0 nm) in the absence (♦) and presence of CNWs at 0.1 (○), 0.5 (trio), and 2.0 (♢) mg ml−1. Time-dependent rates of MU formation were determined from the progress curves of MU formation (solid lines) according to Equation 4. C, initial formation of EOA during the hydrolysis of CNW and BMCC by ChiA and Cel7A, respectively. The concentrations of ChiA and Cel7A were 1.0 and 10 nm, respectively. The concentration of BMCC (♦) was 2.0 mg ml−1 and that of CNWs was 0.01 (×), 0.1 (○), 0.5 (trio), and 2.0 (♢) mg ml−1. EOA was calculated as the difference between the total enzyme concentration and the concentration of enzyme with a free active site. D, profiles of ChiAOA in long term hydrolysis of CNWs by 1.0 nm ChiA. The concentration of CNWs was 0.1 (○), 0.25 (□), 0.5 (trio), and 1.0 (♢) mg ml−1. E, fraction of active site-bound enzyme (EOA/E0) at different substrate concentrations and hydrolysis times. Average values over hydrolysis times (0.5–5 h (♦) or 30–180 s (▴)) for Cel7A with BMCC. ChiA with CNWs at hydrolysis times of 30 (×), 60 (□), 120 (○), and 240 (trio) s, and average values over 0.5–5 h (♢). Solid lines represent the best fit according to Equation 2. F, observed rate constant (v(t)/[ChiAOA]) in the hydrolysis of CNW by 1.0 nm ChiA. The concentration of CNWs was 0.1 (○), 0.25 (□), 0.5 (trio), and 1.0 (♢) mg ml−1. G, hydrolysis of MUL (5.0 μm) by Cel7A (10 nm) in the absence (♦) and presence of BMCC at 2.0 (♢) mg ml−1. The time-dependent rates of MU formation were determined from the progress curves of MU formation (solid lines) according to Equation 4. H, profiles of Cel7AOA in the long term hydrolysis of BMCC by 10 nm Cel7A. The concentration of BMCC was 0.05 (×), 0.25 (○), 0.5 (trio), and 1.0 (♢) mg ml−1 I, observed rate constant (v(t)/[Cel7A]OA) for the hydrolysis of BMCC by 10 nm Cel7A. The concentration of BMCC was 0.05 (×), 0.25 (○), 0.5 (trio), and 1.0 (♢) mg ml−1.
We also tested the active-site-mediated binding of Cel7A (10 nm) to BMCC using MUL as a reporter molecule. The initial binding was measured at a high BMCC concentration (2.0 mg ml−1). In contrast to ChiA, the hydrolysis of MUL was strongly inhibited by BMCC (Fig. 7G). The formation of Cel7AOA was fast and leveled off after only 30 s, the shortest time tested (Fig. 7C). The initial activity of Cel7A measured after 30 s of 14C-labeled BMCC (2.0 mg ml−1) hydrolysis resulted in an estimated v0/E0 of 10 ± 8 s−1. The concentration of Cel7AOA measured at longer hydrolysis times and different BMCC concentrations revealed no significant changes in time (Fig. 7H). Similar to ChiA, the observed rate constant for BMCC hydrolysis (v(t)/[Cel7AOA]) decreased with hydrolysis time. However, for Cel7A, the decrease in v(t)/[Cel7AOA] with hydrolysis time seemed independent of the BMCC concentration (Fig. 7I).
DISCUSSION
The hydrolysis of recalcitrant polysaccharides by processive enzymes is a complex process that consists of multiple elementary steps. Identifying the rate-limiting step in this process is essential for knowledge-based enzyme engineering. However, to date there is no consensus on which particular step is rate-limiting, even for the most well studied enzyme, H. jecorina Cel7A. Here, we performed a comparative study of two processive exo-enzymes, cellobiohydrolase Cel7A from H. jecorina and chitinase ChiA from S. marcescens. To allow a more straightforward comparison, both enzymes were studied using crystalline substrates with similar properties as follows: CNW for ChiA and BMCC for Cel7A. Both substrates were prepared by heterogeneous acid hydrolysis of high DP parent substrates, namely bacterial cellulose and crab chitin in the case of BMCC and CNW, respectively. Our BMCC and CNW preparations had DP values of 235 and 135 monomer units, respectively. Crystallinity indexes of 86 and 92% have been reported for CNW (58) and BMCC (73), respectively. The parameters of the enzyme kinetics of ChiA and Cel7A are listed in Table 1. The most remarkable difference between ChiA and Cel7A is in the initial formation of the enzyme complex with the active site occupied by polymer chain. The formation of ChiAOA was slow (Fig. 7C), and after 30 s, only ∼10% of ChiA molecules had occupied active sites ([EOA]max/E0 in Table 1) under conditions in which the CNW concentration was saturating for activity. By contrast, the concentration of Cel7AOA had already leveled off after the first 30 s of BMCC hydrolysis, constituting ∼90% of the total enzyme concentration (Fig. 7C and Table 1). At low enzyme-to-substrate ratios, Cel7A has been shown to bind exclusively via the active site (41). Unfortunately, the suspension properties of CNWs did not allow for measurements of the concentration of ChiA free in solution. However, because binding from solution is an overall second-order reaction, one would expect to have all of the enzyme bound at saturating substrate concentrations. Thus, we speculate that the population of ChiA whose active site is free, ChiAFA, represents the enzyme that is bound to CNW through the CBM (E*SCBM in Fig. 6C), although the presence of active-site-bound complexes E*S−7 to E*S−3 cannot be excluded. In trying to determine the kcat value from the “initial” rates, one needs first to define kcat. If kcat is defined as the rate constant of product formation by the productive ES complex or, including sliding by two NAG units, by the E*S−1 complex (Fig. 6), the kcat value must be calculated based on [EOA]max. Using the [EOA]max/E0 value of 0.11 ± 0.01 measured after 30 s of hydrolysis and the initial-rates-based Vmax/E0 value of 12.0 ± 0.3 s−1 (Table 1) results in an estimated kcat value of 105 ± 10 s−1 for ChiA. This value is in reasonable agreement with the kcat value of 70.5 ± 25.2 s−1 derived from the average speed of the movement of ChiA along β-chitin in a recent single -molecule tracking HS-AFM study (65). The consistency between the kcat values found from HS-AFM measurements and Vmax/[EOA]max is expected because HS-AFM tracks only the actively moving complexes. Using a conventional definition of kcat as the slowest first-order rate constant in the forward reaction pathway, complexation with the chitin chain on the surface of the chitin microfibril must be included. In this case, we consider product release as starting from the E*SCBM complex (Fig. 6C), and kcat must be found as a limiting v0/E0 value, which was 12.0 ± 0.3 s−1 in our study (Table 1). This figure is much higher than the initial-rates-based kcat estimate of 0.54 ± 0.04 s−1 (37 °C) reported for ChiA with crystalline β-chitin (36). This discrepancy suggests that the chain ends on β-chitin are less accessible for ChiA than those on CNWs, resulting in a decreased rate of complexation. The kcat values measured for ChiA on partially acetylated chitosan, a soluble chitin derivative, are in the range of 20–40 s−1. Corresponding figures for mutants with decreased processivity (W167A and W275A) are in the range of 80–230 s−1 (37 °C) (36, 45). The latter figures are comparable with the Vmax/[EOA]max-based kcat value found here (Table 1), given the temperature difference of 12 °C, and suggests that the initial Vmax/[EOA]max-based kcat value measured with CNWs may represent the rate constant for glycosidic bond hydrolysis by ChiA. Despite the large measurement error, the kcat value measured here for Cel7A (Table 1) is also in accord with the kcat values of 5–10 s−1 measured for Cel7A using HS-AFM (37, 38, 74). Characteristic of the hydrolysis of recalcitrant polysaccharides, the observed kcat values of both Cel7A and ChiA rapidly decreased with hydrolysis time. This decrease was more pronounced with Cel7A, especially if the observed kcat value was found on the basis of Vmax/E0 (Table 1). For Cel7A, the rapid decrease in the hydrolysis rate has been explained by the rapid accumulation of nonproductive trapped-enzyme complexes (ES*T in Fig. 6B) (26, 28). The predominance of the ES*T complex and the rate limitation by its dissociation is also consistent with the type and strength of cellobiose inhibition. Whereas noncompetitive inhibition indicates the predominance of nonproductive complexes over productive ones (Fig. 6A), the weaker inhibition with polymeric substrates compared with that given by the Kd value of the enzyme-inhibitor complex (true Ki) could only be accounted for by a mechanism in which the rate is limited by the dissociation of ES*T (Fig. 6B). In more general terms, the cellobiose inhibition of Cel7A suggests that the rate-limiting step of cellulose hydrolysis is not affected by the inhibitor. NAG2 was also a noncompetitive inhibitor of ChiA with CNW, but contrary to Cel7A, the inhibition strength of ChiA measured with CNW was similar to that given by the Kd value for the binding of NAG2 to ChiA (Table 1). This observation is in accord with the complexation-limited rate of CNW hydrolysis, because in this case the rate-limiting step is affected by the inhibitor. The slow accumulation of ChiAOA over time (Table 1) indicates the increasing contribution of ES*T, although the dissociation of this complex may not be rate-limiting, as judged by the constant strength of NAG2 inhibition over time. The latter scenario can be accounted for by changes in chitin structure upon hydrolysis, as the accumulation of enzyme-generated “inactive” substrate (S* in Fig. 6B) will bind ChiA and compete with the “active” substrate. Although this scenario was not accounted for in the simulations (the k8 in Fig. 6B was set to zero), one may deduce that the addition of a second “substrate” with the same affinity for the enzyme will not change the type or strength of product inhibition but will simply decrease the effective enzyme concentration.
TABLE 1.
Values of kinetic parameters for ChiA and Cel7A measured at different times of hydrolysis
The following abbreviations are used: ND, not determined; NA, not applicable.
| Parameter | ChiAa |
Cel7Ac |
||||
|---|---|---|---|---|---|---|
| Initialb | 0.5 h | 5 h | Initialb | 0.5 h | 5 h | |
| Vmax/E0 (s−1) | 12.0 ± 0.3 | 6.4 ± 0.3 | 2.6 ± 0.3 | 10 ± 8 | 0.22 ± 0.01 | 0.08 ± 0.004 |
| Km(v) (mg ml−1)d | 0.10 ± 0.01 | 0.36 ± 0.05 | 0.62 ± 0.14 | ND | 0.12 ± 0.02 | 0.09 ± 0.02 |
| [EOA]max/E0e | 0.11 ± 0.01 | 0.63 ± 0.01 | 0.92 ± 0.04 | 0.87 ± 0.02 | 0.90 ± 0.01 | 0.84 ± 0.05 |
| Km(OA) (mg ml−1)f | 0.06 ± 0.03 | 0.13 ± 0.01 | 0.28 ± 0.03 | ND | 0.09 ± 0.01 | 0.07 ± 0.01 |
| Vmax/[EOA]max (s−1) | 105 ± 10 | 10.2 ± 0.5 | 2.8 ± 0.3 | 11.5 ± 9.2 | 0.25 ± 0.01 | 0.10 ± 0.01 |
| Ki(obs) (mm)g | 0.50 ± 0.22 | 0.36 ± 0.02 (average)h | ND | ND | 0.17 ± 0.02i | |
| Ki (mm)j | 0.32 ± 0.11 | NA | NA | 0.018 ± 0.003 | NA | NA |
| Kd (mm)k | 0.40 ± 0.10 | NA | NA | 0.0185 ± 0.0024 | NA | NA |
a Kinetic parameters were measured with CNWs or 14C-CNWs as the substrate in 50 mm sodium acetate, pH 6.1 (BSA 0.1 mg ml−1), at 25 °C using a total enzyme concentration (E0) of 1.0 nm.
b Initial parameter values represent the values measured after 30 s of hydrolysis.
c Kinetic parameters were measured with BMCC or 14C-labeled BMCC as the substrate in 50 mm sodium acetate, pH 5.0 (BSA 0.1 mg ml−1), at 25 °C using a total enzyme concentration (E0) of 10 nm.
d Km(v) represents the half-saturating substrate concentration for activity.
e [EOA]max represents the concentration of enzyme with its active site occupied by polymer chain at saturating substrate concentrations, and E0 is the total enzyme concentration.
f Km(OA) represents the half-saturating substrate concentration for the enzyme with its active site occupied by polymer chain.
g Observed noncompetitive inhibition constant for the inhibition of ChiA (with 14C-CNW substrate) by NAG2 or Cel7A (with 14C-labeled BMCC substrate) by cellobiose.
h Given that no time dependence was observed, this is an average value over 0.5–5 h of hydrolysis.
i Averages from the values measured after 3 and 5 h of hydrolysis are given.
j Competitive inhibition constant measured as the IC50 value for the inhibition of ChiA (with MU-NAG2 substrate) by NAG2 or Cel7A (with MUL substrate) by cellobiose. Because of the experimental conditions, in which [S] ≪ Km, the IC50 value is expected to correspond to the value of the true inhibition constant.
k For ChiA, the Kd for NAG2 binding was measured using ITC (this study). For Cel7A, the Kd for cellobiose binding, measured using protein difference spectroscopy, was obtained from Claeyssens et al. (15). Using ITC, a Kd of 7.7 ± 0.5 μm has been reported for the binding of cellobiose to Cel7A (at 10 °C) (12).
Collectively, our data suggest that the predominant molecular state of ChiA is bound enzyme with a free active site, and the rate of chitin hydrolysis is limited by complexation with the polymer chain. Conversely, Cel7A is bound to cellulose predominantly through the active site, and the rate of cellulose hydrolysis is limited by the slow dissociation of the trapped-enzyme complex. It must be noted that we studied only the performance of enzymes acting in isolation. However, the rate-limiting step was shown to differ for Cel7A acting in isolation and in the presence of endoglucanase (18). Therefore, the rate-limiting step of ChiA may also be different in the presence of synergistic auxiliary enzymes such as endochitinase or lytic polysaccharide monooxygenase. The molecular states of bound enzymes have thus far been measured for two fungal cellobiohydrolases, H. jecorina Cel7A and Cel7D from Phanerochaete chrysosporium, and one bacterial cellulase, the processive endo-cellulase Cel9A from T. fusca (42). Bound enzymes with their active sites occupied by cellulose chains have been shown to be the predominant states of both Cel7A and Cel7D (26), whereas bound enzyme with a free active site is the predominant molecular state of Cel9A (42). The active site of both Cel7A and Cel7D exhibits a tunnel-shaped architecture, and the catalytic module is connected to the CBM through a flexible linker peptide. It is interesting to note that the structure of Cel9A (75) is similar to ChiA, in that the CBM is rigidly connected to the catalytic module, and the active site resides in the open cleft. Whether the rate-limiting step in the degradation of recalcitrant polysaccharides reflects the domain interactions and active site architecture of these enzymes remains to be studied.
Supplementary Material
Acknowledgments
Riin Kont from the University of Tartu is acknowledged for measuring the cellobiose inhibition of Cel7A with MUL substrate and Ragnar Sepp from the University of Tartu for measuring the DP of CNWs.
This work was supported by Norwegian Financial Mechanism Grant EMP171 and Estonian Science Foundation Grant 9227.

This article contains supplemental Equations S1 and S2.
- NAG
- N-acetylglucosamine
- BMCC
- bacterial microcrystalline cellulose
- CBM
- carbohydrate-binding module
- CD
- catalytic domain
- CNW
- chitin nanowhisker
- DP
- degree of polymerization
- HS-AFM
- high speed atomic force microscopy
- MU
- 4-methyl-umbelliferone
- MUL
- 4-methyl-umbelliferyl-β-d-lactoside
- MU-NAG2
- 4-methyl-umbelliferyl-β-d-N,N′-diacetylchitobioside
- NAG2
- N,N′-diacetylchitobiose
- ITC
- isothermal titration calorimetry.
REFERENCES
- 1. Payne C. M., Knott B. C., Mayes H. B., Hansson H., Himmel M. E., Sandgren M., Ståhlberg J., Beckham G. T. (2015) Fungal cellulases. Chem. Rev. 115, 1308–1448 [DOI] [PubMed] [Google Scholar]
- 2. Vaaje-Kolstad G., Horn S. J., Sørlie M., Eijsink V. G. (2013) The chitinolytic machinery of Serratia marcescens–a model system for enzymatic degradation of recalcitrant polysaccharides. FEBS J. 280, 3028–3049 [DOI] [PubMed] [Google Scholar]
- 3. Srisodsuk M., Reinikainen T., Penttilä M., Teeri T. T. (1993) Role of the interdomain linker peptide of Trichoderma reesei cellobiohydrolase I in its interaction with crystalline cellulose. J. Biol. Chem. 268, 20756–20761 [PubMed] [Google Scholar]
- 4. Sammond D. W., Payne C. M., Brunecky R., Himmel M. E., Crowley M. F., Beckham G. T. (2012) Cellulase linkers are optimized based on domain type and function: insights from sequence analysis, biophysical measurements, and molecular simulation. PLoS One 7, e48615. [DOI] [PMC free article] [PubMed] [Google Scholar]
- 5. Perrakis A., Tews I., Dauter Z., Oppenheim A. B., Chet I., Wilson K. S., Vorgias C. E. (1994) Crystal structure of a bacterial chitinase at 2.3 Å resolution. Structure 2, 1169–1180 [DOI] [PubMed] [Google Scholar]
- 6. Divne C., Ståhlberg J., Teeri T. T., Jones T. A. (1998) High-resolution crystal structures reveal how a cellulose chain is bound in the 50 Å long tunnel of cellobiohydrolase I from Trichoderma reesei. J. Mol. Biol. 275, 309–325 [DOI] [PubMed] [Google Scholar]
- 7. Papanikolau Y., Prag G., Tavlas G., Vorgias C. E., Oppenheim A. B., Petratos K. (2001) High resolution structural analyses of mutant chitinase A complexes with substrate provide new insight into the mechanism of catalysis. Biochemistry 40, 11338–11443 [DOI] [PubMed] [Google Scholar]
- 8. Aronson N. N., Jr., Halloran B. A., Alexyev M. F., Amable L., Madura J. D., Pasupulati L., Worth C., Van Roey P. (2003) Family 18 chitinase-oligosaccharide substrate interaction: subsite preference and anomer selectivity of Serratia marcescens chitinase A. Biochem. J. 376, 87–95 [DOI] [PMC free article] [PubMed] [Google Scholar]
- 9. Norberg A. L., Dybvik A. I., Zakariassen H., Mormann M., Peter-Katalinić J., Eijsink V. G., Sørlie M. (2011) Substrate positioning in chitinase A, a processive chito-biohydrolase from Serratia marcescens. FEBS Lett. 585, 2339–2344 [DOI] [PubMed] [Google Scholar]
- 10. Uchiyama T., Katouno F., Nikaidou N., Nonaka T., Sugiyama J., Watanabe T. (2001) Roles of exposed aromatic residues in crystalline chitin hydrolysis by chitinase A from Serratia marcescens 2170. J. Biol. Chem. 276, 41343–41349 [DOI] [PubMed] [Google Scholar]
- 11. Payne C. M., Jiang W., Shirts M. R., Himmel M. E., Crowley M. F., Beckham G. T. (2013) Glycoside hydrolase processivity is directly related to oligosaccharide binding free energy. J. Am. Chem. Soc. 135, 18831–18839 [DOI] [PubMed] [Google Scholar]
- 12. Colussi F., Sørensen T. H., Alasepp K., Kari J., Cruys-Bagger N., Windahl M. S., Olsen J. P., Borch K., Westh P. (2015) Probing substrate interactions in the active tunnel of a catalytically deficient cellobiohydrolase (Cel7). J. Biol. Chem. 290, 2444–2454 [DOI] [PMC free article] [PubMed] [Google Scholar]
- 13. Knott B. C., Crowley M. F., Himmel M. E., Ståhlberg J., Beckham G. T. (2014) Carbohydrate-protein interactions that drive processive polysaccharide translocation in enzymes revealed from a computational study of cellobiohydrolase processivity. J. Am. Chem. Soc. 136, 8810–8819 [DOI] [PubMed] [Google Scholar]
- 14. Bu L., Nimlos M. R., Shirts M. R., Ståhlberg J., Himmel M. E., Crowley M. F., Beckham G. T. (2012) Product binding varies dramatically between processive and nonprocessive cellulase enzymes. J. Biol. Chem. 287, 24807–24813 [DOI] [PMC free article] [PubMed] [Google Scholar]
- 15. Claeyssens M., Van Tilbeurgh H., Tomme P., Wood T. M. (1989) Fungal cellulase systems. Comparison of the specificities of the cellobiohydrolases isolated from Penicillium pinophilum and Trichoderma reesei. Biochem. J. 261, 819–825 [DOI] [PMC free article] [PubMed] [Google Scholar]
- 16. von Ossowski I., Ståhlberg J., Koivula A., Piens K., Becker D., Boer H., Harle R., Harris M., Divne C., Mahdi S., Zhao Y., Driguez H., Claeyssens M., Sinnott M. L., Teeri T. T. (2003) Engineering the exo-loop of Trichoderma reesei cellobiohydrolase, Cel7A. A comparison with Phanerochaete chrysosporium Cel7D. J. Mol. Biol. 333, 817–829 [DOI] [PubMed] [Google Scholar]
- 17. Gruno M., Väljamäe P., Pettersson G., Johansson G. (2004) Inhibition of the Trichoderma reesei cellulases by cellobiose is strongly dependent on the nature of the substrate. Biotechnol. Bioeng. 86, 503–511 [DOI] [PubMed] [Google Scholar]
- 18. Jalak J., Kurašin M., Teugjas H., Väljamäe P. (2012) Endo-exo synergism in cellulose hydrolysis revisited. J. Biol. Chem. 287, 28802–28815 [DOI] [PMC free article] [PubMed] [Google Scholar]
- 19. Teugjas H., Väljamäe P. (2013) Product inhibition of cellulases studied with 14C-labeled cellulose substrates. Biotechnol. Biofuels 6, 104. [DOI] [PMC free article] [PubMed] [Google Scholar]
- 20. Murphy L., Bohlin C., Baumann M. J., Olsen S. N., Sørensen T. H., Anderson L., Borch K., Westh P. (2013) Product inhibition of five Hypocrea jecorina cellulases. Enzyme Microb. Technol. 52, 163–169 [DOI] [PubMed] [Google Scholar]
- 21. Baumann M.J., Borch K., Westh P. (2011) Xylan oligosaccharides and cellobiohydrolase I (TrCel7A) interaction and effect on activity. Biotechnol. Biofuels 4, 45. [DOI] [PMC free article] [PubMed] [Google Scholar]
- 22. Kont R., Kurašin M., Teugjas H., Väljamäe P. (2013) Strong cellulase inhibitors from the hydrothermal pretreatment of wheat straw. Biotechnol. Biofuels 6, 135. [DOI] [PMC free article] [PubMed] [Google Scholar]
- 23. Chen L., Zhou Y., Qu M., Zhao Y., Yang Q. (2014) Fully deacetylated chitooligosaccharides act as efficient glycoside hydrolase family 18 chitinase inhibitors. J. Biol. Chem. 289, 17932–17940 [DOI] [PMC free article] [PubMed] [Google Scholar]
- 24. Zakariassen H., Klemetsen L., Sakuda S., Vaaje-Kolstad G., Vårum K. M., Sørlie M., Eijsink V. G. (2010) Effect of enzyme processivity on the efficacy of a competitive chitinase inhibitor. Carbohydr. Polym. 82, 779–785 [Google Scholar]
- 25. Beckham G. T., Ståhlberg J., Knott B. C., Himmel M. E., Crowley M. F., Sandgren M., Sørlie M., Payne C. M. (2014) Towards a molecular-level theory of processivity in glycoside hydrolases. Curr. Opin. Biotechnol. 27, 96–106 [DOI] [PubMed] [Google Scholar]
- 26. Jalak J., Väljamäe P. (2010) Mechanism of initial rapid rate retardation in cellobiohydrolase catalyzed cellulose hydrolysis. Biotechnol. Bioeng. 106, 871–883 [DOI] [PubMed] [Google Scholar]
- 27. Kurašin M., Väljamäe P. (2011) Processivity of cellobiohydrolases is limited by the substrate. J. Biol. Chem. 286, 169–177 [DOI] [PMC free article] [PubMed] [Google Scholar]
- 28. Praestgaard E., Elmerdahl J., Murphy L., Nymand S., McFarland K. C., Borch K., Westh P. (2011) A kinetic model for the burst phase of processive cellulases. FEBS J. 278, 1547–1560 [DOI] [PubMed] [Google Scholar]
- 29. Cruys-Bagger N., Elmerdahl J., Praestgaard E., Tatsumi H., Spodsberg N., Borch K., Westh P. (2012) Pre-steady state kinetics for the hydrolysis of insoluble cellulose by cellobiohydrolase Cel7A. J. Biol. Chem. 287, 18451–18458 [DOI] [PMC free article] [PubMed] [Google Scholar]
- 30. Cruys-Bagger N., Tatsumi H., Ren G. R., Borch K., Westh P. (2013) Transient kinetics and rate-limiting steps for the processive cellobiohydrolase Cel7A: effects of substrate structure and carbohydrate binding domain. Biochemistry 52, 8938–8948 [DOI] [PubMed] [Google Scholar]
- 31. Kari J., Olsen J., Borch K., Cruys-Bagger N., Jensen K., Westh P. (2014) Kinetics of cellobiohydrolase (Cel7A) variants with lowered substrate affinity. J. Biol. Chem. 289, 32459–32468 [DOI] [PMC free article] [PubMed] [Google Scholar]
- 32. Fox J. M., Levine S. E., Clark D. S., Blanch H. W. (2012) Initial- and processive-cut products reveal cellobiohydrolase rate limitations and the role of companion enzymes. Biochemistry 51, 442–452 [DOI] [PubMed] [Google Scholar]
- 33. Shang B. Z., Chang R., Chu J.-W. (2013) Systems-level modeling with molecular resolution elucidates the rate-limiting mechanisms of cellulose decomposition by cellobiohydrolases. J. Biol. Chem. 288, 29081–29089 [DOI] [PMC free article] [PubMed] [Google Scholar]
- 34. Chundawat S. P., Bellesia G., Uppugundla N., da Costa Sousa L., Gao D., Cheh A. M., Agarwal U. P., Bianchetti C. M., Phillips G. N., Jr., Langan P., Balan V., Gnanakaran S., Dale B. E. (2011) Restructuring the crystalline cellulose hydrogen bond network enhances its depolymerization rate. J. Am. Chem. Soc. 133, 11163–11174 [DOI] [PubMed] [Google Scholar]
- 35. Gao D., Chundawat S. P., Sethi A., Balan V., Gnanakaran S., Dale B. E. (2013) Increased enzyme binding to substrate is not necessary for more efficient cellulose hydrolysis. Proc. Natl. Acad. Sci. U.S.A. 110, 10922–10927 [DOI] [PMC free article] [PubMed] [Google Scholar]
- 36. Zakariassen H., Eijsink V. G., Sørlie M. (2010) Signatures of activation parameters reveal substrate-dependent rate determining steps in polysaccharide turnover by a family 18 chitinase. Carbohydr. Polym. 81, 14–20 [Google Scholar]
- 37. Nakamura A., Watanabe H., Ishida T., Uchihashi T., Wada M., Ando T., Igarashi K., Samejima M. (2014) Trade-off between processivity and hydrolytic velocity of cellobiohydrolases at the surface of crystalline cellulose. J. Am. Chem. Soc. 136, 4584–4592 [DOI] [PubMed] [Google Scholar]
- 38. Shibafuji Y., Nakamura A., Uchihashi T., Sugimoto N., Fukuda S., Watanabe H., Samejima M., Ando T., Noji H., Koivula A., Igarashi K., Iino R. (2014) Single-molecule imaging analysis of elementary reaction steps of Trichoderma reesei cellobiohydrolase I (Cel7A) hydrolyzing crystalline cellulose Iα and IIII. J. Biol. Chem. 289, 14056–14065 [DOI] [PMC free article] [PubMed] [Google Scholar]
- 39. Jung J., Sethi A., Gaiotto T., Han J. J., Jeoh T., Gnanakaran S., Goodwin P. M. (2013) Binding and movement of individual Cel7A cellobiohydrolases on crystalline cellulose surfaces revealed by single-molecule fluorescence imaging. J. Biol. Chem. 288, 24164–24172 [DOI] [PMC free article] [PubMed] [Google Scholar]
- 40. Cruys-Bagger N., Tatsumi H., Borch K., Westh P. (2014) A graphene screen-printed carbon electrode for real-time measurements of unoccupied active sites in a cellulase. Anal. Biochem. 447, 162–168 [DOI] [PubMed] [Google Scholar]
- 41. Jalak J., Väljamäe P. (2014) Multi-mode binding of cellobiohydrolase Cel7A from Trichoderma reesei to cellulose. PLoS One 9, e108181. [DOI] [PMC free article] [PubMed] [Google Scholar]
- 42. Kostylev M., Moran-Mirabal J. M., Walker L. P., Wilson D. B. (2012) Determination of the molecular states of the processive endocellulase Thermobifida fusca Cel9A during crystalline cellulose depolymerization. Biotechnol. Bioeng. 109, 295–299 [DOI] [PubMed] [Google Scholar]
- 43. Brurberg M. B., Eijsink V. G., Nes I. F. (1994) Characterization of a chitinase gene (chiA) from Serratia marcescens BJL200 and one-step purification of the gene product. FEMS Microbiol. Lett. 124, 399–404 [DOI] [PubMed] [Google Scholar]
- 44. Brurberg M. B., Nes I. F., Eijsink V. G. (1996) Comparative studies of chitinases A and B from Serratia marcescens. Microbiology 142, 1581–1589 [DOI] [PubMed] [Google Scholar]
- 45. Zakariassen H., Aam B. B., Horn S. J., Vårum K. M., Sørlie M., Eijsink V. G. (2009) Aromatic residues in the catalytic center of chitinase A from Serratia marcescens affect processivity, enzyme activity, and biomass converting efficiency. J. Biol. Chem. 284, 10610–10617 [DOI] [PMC free article] [PubMed] [Google Scholar]
- 46. Tews I., Perrakis A., Oppenheim A., Dauter Z., Wilson K. S., Vorgias C. E. (1996) Bacterial chitobiase structure provides insight into catalytic mechanism and the basis of Tay-Sachs disease. Nat. Struct. Biol. 3, 638–648 [DOI] [PubMed] [Google Scholar]
- 47. Bhikhabhai R., Johansson G., Pettersson G. (1984) Isolation of cellulolytic enzymes from Trichoderma reesei QM 9414. J. Appl. Biochem. 6, 336–345 [PubMed] [Google Scholar]
- 48. Sipos B., Benko Z., Dienes D., Réczey K., Viikari L., Siika-aho M. (2010) Characterisation of specific activities and hydrolytic properties of cell-wall-degrading enzymes produced by Trichoderma reesei Rut C30 on different carbon sources. Appl. Biochem. Biotechnol. 161, 347–364 [DOI] [PubMed] [Google Scholar]
- 49. Nelson N. (1944) A photometric adaptation of the Somogyi method for the determination of glucose. J. Biol. Chem. 153, 375–380 [Google Scholar]
- 50. Velleste R., Teugjas H., Väljamäe P. (2010) Reducing end-specific fluorescence labeled celluloses for cellulase mode of action. Cellulose 17, 125–138 [Google Scholar]
- 51. Hörmann H., Gollwitzer R. (1962) Bestimmung von hexosen in tryptophan-haltigen eiwisserkörpern. Ann. Chem. 655, 178–188 [Google Scholar]
- 52. Zhang Y.-H., Lynd L. R. (2005) Determination of the number average degree of polymerization of cellodextrins and cellulose with application to enzymatic cellulose hydrolysis. Biomacromolecules 6, 1510–1515 [DOI] [PubMed] [Google Scholar]
- 53. Horn S. J., Eijsink V. G. (2004) A reliable reducing end assay for chito-oligosaccharides. Carbohydr. Polym. 56, 35–39 [Google Scholar]
- 54. Wiseman T., Williston S., Brandts J. F., Lin L. N. (1989) Rapid measurement of binding constants and heats of binding using a new titration calorimeter. Anal. Biochem. 179, 131–137 [DOI] [PubMed] [Google Scholar]
- 55. Turnbull W. B., Daranas A. H. (2003) On the value of c: can low affinity systems be studied by isothermal titration calorimetry? J. Am. Chem. Soc. 125, 14859–14866 [DOI] [PubMed] [Google Scholar]
- 56. Macdonald J. M., Tarling C. A., Taylor E. J., Dennis R. J., Myers D. S., Knapp S., Davies G. J., Withers S. G. (2010) Chitinase inhibition by chitobiose and chitotriose thiazolines. Angew. Chem. Int. Ed. Engl. 49, 2599–2602 [DOI] [PubMed] [Google Scholar]
- 57. Dybvik A. I., Norberg A. L., Schute V., Soltwisch J., Peter-Katalinić J., Vårum K. M., Eijsink V. G., Dreisewerd K., Mormann M., Sørlie M. (2011) Analysis of noncovalent chitinase-chito-oligosaccharide complexes by infrared-matrix assisted laser desorption ionization and nanoelectrospray ionization mass spectrometry. Anal. Chem. 83, 4030–4036 [DOI] [PubMed] [Google Scholar]
- 58. Pereira A. G., Muniz E. C., Hsieh Y.-L. (2014) Chitosan-sheath and chitin-core nanowhiskers. Carbohydr. Polym. 107, 158–166 [DOI] [PubMed] [Google Scholar]
- 59. Bansal P., Hall M., Realff M. J., Lee J. H., Bommarius A. S. (2009) Modeling cellulase kinetics on lignocellulosic substrates. Biotechnol. Adv. 27, 833–848 [DOI] [PubMed] [Google Scholar]
- 60. Väljamäe P., Kipper K., Pettersson G., Johansson G. (2003) Synergistic cellulose hydrolysis can be described in terms of fractal-like kinetics. Biotechnol. Bioeng. 84, 254–257 [DOI] [PubMed] [Google Scholar]
- 61. Kostylev M., Wilson D. (2013) Two-parameter kinetic model based on a time-dependent activity coefficient accurately describes enzymatic cellulose digestion. Biochemistry 52, 5656–5664 [DOI] [PMC free article] [PubMed] [Google Scholar]
- 62. Honda Y., Kitaoka M., Tokuyasu K., Sasaki C., Fukamizo T., Hayashi K. (2003) Kinetic studies on the hydrolysis of N-acetylated and N-deacetylated derivatives of 4-methylumbelliferyl chitobioside by the family 18 chitinases ChiA and ChiB from Serratia marcescens. J. Biochem. 133, 253–258 [DOI] [PubMed] [Google Scholar]
- 63. Voutilainen S. P., Puranen T., Siika-Aho M., Lappalainen A., Alapuranen M., Kallio J., Hooman S., Viikari L., Vehmaanperä J., Koivula A. (2008) Cloning, expression, and characterization of novel thermostable family 7 cellobiohydrolases. Biotechnol. Bioeng. 101, 515–528 [DOI] [PubMed] [Google Scholar]
- 64. Knott B. C., Haddad M., Crowley M. F., Mackenzie L. F., Götz A. W., Sandgren M., Withers S. G., Ståhlberg J., Beckham G. T. (2014) The mechanism of cellulose hydrolysis by a two-step, retaining cellobiohydrolase elucidated by structural and transition path sampling studies. J. Am. Chem. Soc. 136, 321–329 [DOI] [PubMed] [Google Scholar]
- 65. Igarashi K., Uchihashi T., Uchiyama T., Sugimoto H., Wada M., Suzuki K., Sakuda S., Ando T., Watanabe T., Samejima M. (2014) Two-way traffic of glycoside hydrolase family 18 processive chitinases on crystalline chitin. Nat. Commun. 5, 3975. [DOI] [PubMed] [Google Scholar]
- 66. Hamre A. G., Lorentzen S. B., Väljamäe P., Sørlie M. (2014) Enzyme processivity changes with the extent of recalcitrant polysaccharide degradation. FEBS Lett. 588, 4620–4624 [DOI] [PubMed] [Google Scholar]
- 67. Shang B. Z., Chang R., Chu J.-W. (2014) Kinetic modeling at single-molecule resolution elucidates the mechanisms of cellulase synergy. ACS Catal. 4, 2216–2225 [Google Scholar]
- 68. Murphy L., Cruys-Bagger N., Damgaard H. D., Baumann M. J., Olsen S. N., Borch K., Lassen S. F., Sweeney M., Tatsumi H., Westh P. (2012) Origin of initial burst in activity for Trichoderma reesei endo-glucanases hydrolyzing insoluble cellulose. J. Biol. Chem. 287, 1252–1260 [DOI] [PMC free article] [PubMed] [Google Scholar]
- 69. Qi F., Dash R. K., Han Y., Beard D. A. (2009) Generating rate equations for complex enzyme systems by a computer-assisted systematic method. BMC Bioinformatics 10, 238. [DOI] [PMC free article] [PubMed] [Google Scholar]
- 70. Holtzapple M., Cognata M., Shu Y., Hendrickson C. (1990) Inhibition of Trichoderma reesei cellulase by sugars and solvents. Biotechnol. Bioeng. 36, 275–287 [DOI] [PubMed] [Google Scholar]
- 71. Sikorski P., Sørbotten A., Horn S. J., Eijsink V. G., Vårum K. M. (2006) Serratia marcescens chitinases with tunnel-shaped substrate-binding grooves show endo activity and different degrees of processivity during enzymatic hydrolysis of chitosan. Biochemistry 45, 9566–9574 [DOI] [PubMed] [Google Scholar]
- 72. Horn S. J., Sørlie M., Vårum K. M., Väljamäe P., Eijsink V. G. (2012) Measuring processivity. Methods Enzymol. 510, 69–95 [DOI] [PubMed] [Google Scholar]
- 73. Väljamäe P., Sild V., Nutt A., Pettersson G., Johansson G. (1999) Acid hydrolysis of bacterial cellulose reveals different modes of synergistic action between cellobiohydrolase I and endoglucanase I. Eur. J. Biochem. 266, 327–334 [DOI] [PubMed] [Google Scholar]
- 74. Igarashi K., Uchihashi T., Koivula A., Wada M., Kimura S., Okamoto T., Penttilä M., Ando T., Samejima M. (2011) Traffic jams reduce hydrolytic efficiency of cellulase on cellulose surface. Science 333, 1279–1282 [DOI] [PubMed] [Google Scholar]
- 75. Sakon J., Irwin D., Wilson D. B., Karplus P. A. (1997) Structure and mechanism of endo/exocellulase E4 from Thermomonospora fusca. Nat. Struct. Biol. 4, 810–818 [DOI] [PubMed] [Google Scholar]
Associated Data
This section collects any data citations, data availability statements, or supplementary materials included in this article.