

Abstract
Noise in gene expression is a main determinant of phenotypic variability. Increasing experimental evidence suggests that genome-wide cellular constraints largely contribute to the heterogeneity observed in gene products. It is still unclear, however, which global factors affect gene expression noise and to what extent. Since eukaryotic gene expression is an energy demanding process, differences in the energy budget of each cell could determine gene expression differences. Here, we quantify the contribution of mitochondrial variability (a natural source of ATP variation) to global variability in gene expression. We find that changes in mitochondrial content can account for ∼50% of the variability observed in protein levels. This is the combined result of the effect of mitochondria dosage on transcription and translation apparatus content and activities. Moreover, we find that mitochondrial levels have a large impact on alternative splicing, thus modulating both the abundance and type of mRNAs. A simple mathematical model in which mitochondrial content simultaneously affects transcription rate and splicing site choice can explain the alternative splicing data. The results of this study show that mitochondrial content (and/or probably function) influences mRNA abundance, translation, and alternative splicing, which ultimately affects cellular phenotype.
Cellular heterogeneity can result from noise generated during gene expression and plays an essential role in fundamental processes such as development, cell differentiation, and cancer (Raj and van Oudenaarden 2008; Eldar and Elowitz 2010; Balázsi et al. 2011). Gene expression noise may originate from stochasticity in the biochemical reactions at an individual gene (intrinsic noise) or from fluctuations in cellular components inducing a global effect (extrinsic noise) (Elowitz et al. 2002; Maheshri and O'Shea 2007). Extrinsic noise is often a dominant source of variation both in prokaryotes (Taniguchi et al. 2010) and eukaryotes (Raser and O'Shea 2004; Newman et al. 2006). Despite this, the origins of extrinsic fluctuations are mostly unknown, although random protein partitioning from cell growth and division (Rosenfeld et al. 2005; Volfson et al. 2006), upstream transcription factors (Volfson et al. 2006), or cell cycle stage (Zopf et al. 2013) have been shown to contribute to variability in protein levels. A common constraint across eukaryotic gene expression is its high energy cost (with ∼75% of the ATP cellular energy budget invested into mRNA and protein polymerization) (Forster et al. 2003; Wagner 2005; Lane and Martin 2010), where every step, from chromatin remodeling to transcription elongation, assembly of splicing factors, and translation, depends on energy (Fig. 1A). Since most of the energy required in normal cells is supplied by mitochondrial oxidative phosphorylation (Vander Heiden et al. 2009), variability in the number and/or functionality of mitochondria is a natural source of variability in ATP content, and thus a possible global factor modulating gene expression.
Figure 1.
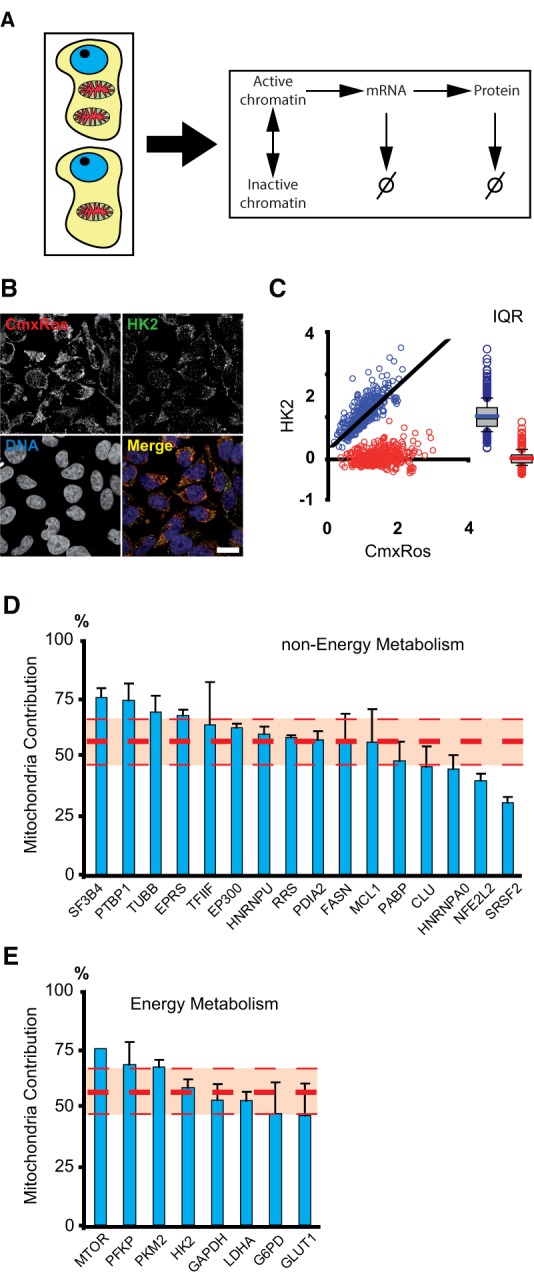
Mitochondrial contribution to protein variability. (A) Differences in the mitochondrial content of isogenic cells can act as a global factor generating variability in all steps of gene expression (chromatin remodeling, transcription, and translation) as well as affecting mRNA and protein stabilities. (B) Mitochondrial content (CMXRos) and protein levels (the enzyme Hexokinase 2 is shown here) are simultaneously quantified in single cells by fluorescence microscopy. (C) Dependence of HK2 protein levels as a function of mitochondrial content in a population of clonal cells (blue dots, r2= 0.62). CMXRos and protein values are normalized by their average levels. We decorrelate protein levels from mitochondria by rotating the distribution around the best-fit line (red dots). The box plots of both distributions are shown on the right. From the ratio of interquartile ranges (IQR) of the normal and detrended distributions, we can calculate the mitochondrial contribution to protein variability in the population. (D) Mitochondrial contribution to global variability (MCV) in protein levels from 16 housekeeping genes, none related to energy metabolism. (E) MCV in protein content from eight genes involved in energy metabolism. The thick red dashed line is the average contribution of all proteins. Thin lines are standard deviations. Error bars are standard deviations of three independent biological replicates (with 200–400 cells per experiment).
We have previously shown that the number of mitochondria transmitted to daughter cells at mitosis presents broad fluctuations (das Neves et al. 2010; Johnston et al. 2012) and identified heterogeneity in mitochondrial content as a source of variability in transcription rate (das Neves et al. 2010). We found that RNA Pol II transcription elongation was variable from cell to cell, mainly due to the high sensitivity of this activity to the concentration of ATP, which is directly linked to mitochondrial levels in individual cells (das Neves et al. 2010). Here we quantify the influence of mitochondrial heterogeneity on gene expression at a global scale, covering different steps of the gene expression cycle and genome-wide changes in transcription.
Results
Mitochondrial variability impacts on protein content heterogeneity
Since proteins are the ultimate products of gene expression, we first explore how mitochondrial content affects cellular protein content. Traditionally, mitochondrial mass is measured by quantification of the mitochondrial staining with MitoTracker Green (MG) (das Neves et al. 2010). MG faithfully reflects the mitochondrial mass (as compared by mtDNA quantification) (Supplemental Fig. S1A). A problem associated with MG staining is its incompatibility with the immunostaining of intracellular proteins. For that reason, we use instead a probe compatible with the experimental procedure (CMXRos). Although CMXRos is a potentiometric probe (and thus a marker of mitochondrial function), in our conditions it is also a suitable reporter of mitochondrial mass (as shown by its high correlation with MG and several mitochondrial proteins) (Supplemental Fig. S1B–F).
To quantify the influence of mitochondrial content on protein variability, we simultaneously measure mitochondrial and protein levels using quantitative microscopy in individual HeLa cells (Fig. 1B; Iborra and Buckle 2008).
Mitochondrial and protein contents showed an appreciable correlation (see Fig. 1C for an example of the protein HK2, all the proteins analyzed gave Pearson correlation coefficients in the range 0.5–0.8). To calculate how much of the total protein variance is due to covariation with mitochondrial content, we find by linear regression the best-fit line (corresponding to the axis of reporter covariation) (Fig. 1C, black line) and then rotate the data points onto the horizontal axis (Fig. 1C, red circles) to obtain the protein distribution with the correlation removed. We then calculate the mitochondrial contribution to variability (MCV) from the spread of the original and decorrelated distributions as MCV = [1 − (IQRrot/IQR)] × 100, where IQR is the interquartile range of the original distribution normalized by its mean value (this gives a measure of the distribution spread relative to its average value, similar to the coefficient of variation), and IQRrot is the normalized interquartile range of the detrended distribution (Fig. 1C, right). This method provides an intuitive way to separate the mitochondrial contribution from other sources of variability, analogous to the decomposition of total protein variability in intrinsic and extrinsic contributions (Elowitz et al. 2002). Other statistical measures of contribution to variance, such as the fraction of variance explained by the coefficient of determination, R2, or the F-statistics, yield very similar estimates (Supplemental Text; Supplemental Fig. S2).
We chose a set of 24 proteins from housekeeping genes to sample a typical global expression state into normal physiological conditions (Fig. 1D,E). To distinguish possible biases due to energy metabolism, we separated the proteins into two groups: proteins nonrelated to energy metabolism (Fig. 1D) and proteins involved in energy metabolism (Fig. 1E). In both groups we found that mitochondria accounts for ∼50% of protein variability (Fig. 1D,E, thick red dashed lines) with a standard deviation of ∼10%.
Because mitochondrial content varies along the cell cycle (das Neves et al. 2010), and so does protein, we asked whether the correlation observed between mitochondria and protein is a true association or, on the other hand, is due to covariation with cell cycle stage. We thus simultaneously stained cells with DAPI (a reporter of cell cycle state), CMXRos, and different protein antibodies. Causal correlation analysis of these experiments showed that cell cycle, per se, contributes minimally to protein variability (Supplemental Text; Supplemental Fig. S3).
Mitochondrial variability affects different steps of the gene expression cycle
The data from the previous section show that mitochondrial variability can explain part of the protein noise. To trace back the origins of this influence in protein heterogeneity, we analyzed the effect of mitochondria dosage on different steps of the gene expression cycle.
The transcription process involves many different steps subjected to control: one is the epigenetic modification of chromatin (Fig. 1A). Among the possible chromatin modifications, H4K16 acetylation is important because it is linked to transcription activation (Canals-Hamann et al. 2013). This modification shows single-cell heterogeneity covarying with mitochondrial content; and applying the same procedure of the previous section, we find an elevated mitochondrial contribution to H4K16 acetylation variation (Fig. 2A). Other modifications associated with chromatin activation are histone H3 dimethylated at lysine 36 (H3K36me2) and histone H3 trimethylated at lysine 4 (H3K4me3)—the first associated with transcription elongation and the latter to promoter activation (Henikoff and Shilatifard 2011). Both H3K36me2 and H3K4me3 behave in a similar manner to H4K16 acetylation, showing variability highly dependent on mitochondrial content (Fig. 2A). However, variability in H4K20me2 and H3K27me3, both linked to chromatin repression (Gaydos et al. 2014), shows little dependency on mitochondria (Fig. 2A). This suggests that mitochondria have a positive impact on chromatin activation globally.
Figure 2.
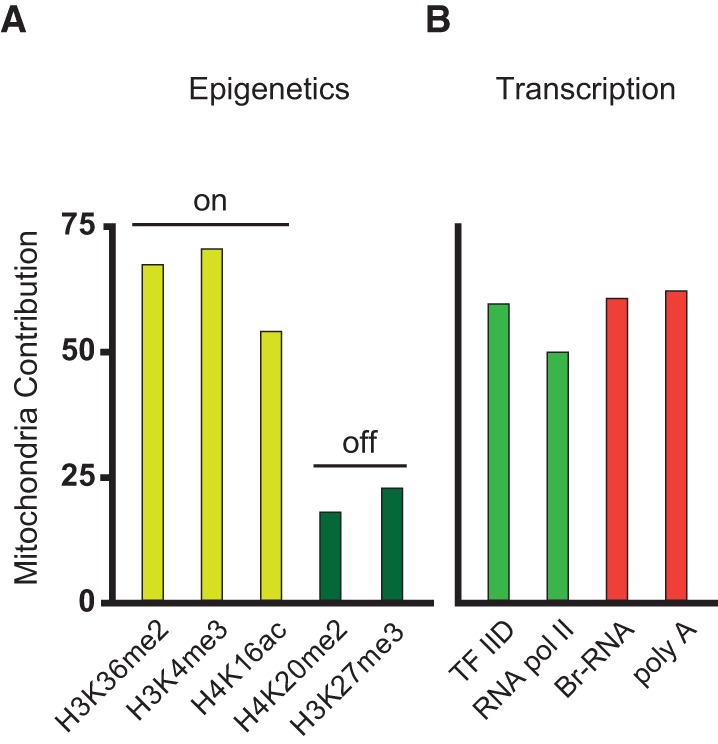
Mitochondrial contribution to variability in chromatin remodeling and transcription. Changes in mitochondrial content affect different molecular factors and biosynthetic processes involved in gene expression. (A) Mitochondrial contribution to variability in different epigenetic marks on histones associated with chromatin activation (yellow bars, “On” label) and chromatin repression (dark green bars, “Off” label). (B) Mitochondrial contribution to variability of factors responsible for transcription (green bars) and of transcriptional activities (measured as the amount of nascent RNA, Br-RNA, and total mRNA, poly[A], red bars).
A second level of gene expression control is the regulation of the transcription machinery. In order to study the influence of mitochondria on the transcription apparatus content, we focus on RNA Pol II and the general transcription initiation complex TFIID. Both molecules covary with mitochondria (Fig. 2B) in amounts comparable to protein variability (Fig. 1D). Finally, we monitor transcriptional activity as a function of mitochondrial content using both RNA Pol II transcription elongation (reported by the amount of the immediate transcription precursor BrU) (Methods) and mRNA accumulation (by staining poly[A] RNA), showing again an ∼50% contribution (Fig. 2B, red bars).
Finally, we explored the contribution of mitochondrial mass variability to protein synthesis. Cells were pulsed with CMXRos and the translation precursor AHA (Methods), which gets incorporated into nascent polypeptides. Our data show that cells with high mitochondrial content are also more active in protein synthesis (Fig. 3C). This finding was also supported by the high dependency of translation elongation factors (Fig. 3A) and the synthetic ribosome machinery (Fig. 3B) on mitochondria.
Figure 3.
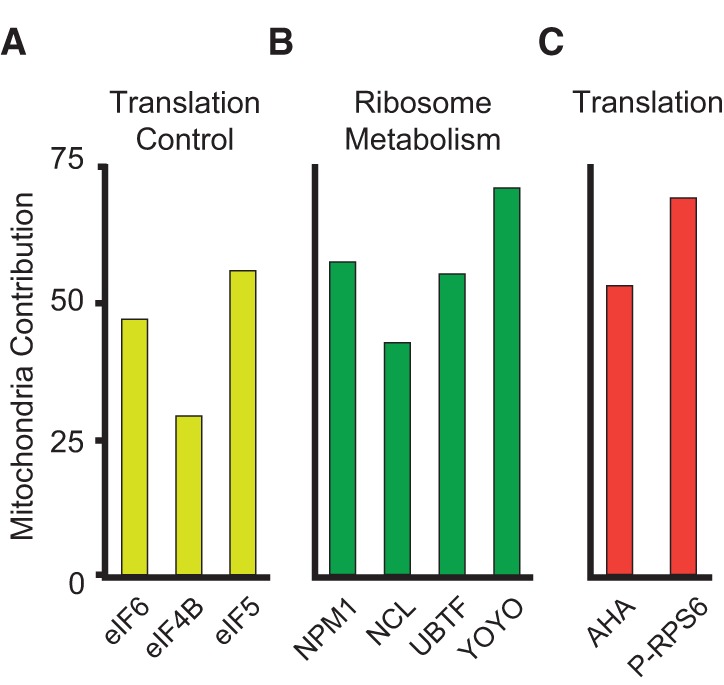
Mitochondrial contribution to variability in translation. Mitochondrial contribution to variability in translation factors. (A) Yellow bars are elongation translation factors. (B) Heterogeneity in ribosomes and ribosome apparatus synthesis. YOYO-1 stain is specific for double-stranded RNA, which is almost exclusive of ribosomes. UBTF evidences ribosome biosynthesis, and NCL and NPM1 are involved in ribosome maturation. (C) Variability induced by mitochondria in protein synthesis: (red bars) nascent protein as measured by the precursor AHA, and activated protein synthesis, P-RPS6.
Analysis of RNA Pol II dynamics reveals increased genome-wide transcriptional activity at high mitochondrial content
Our data indicate that mitochondrial content correlates with chromatin activation and RNA Pol II activity. At the molecular level this can be translated in different phenomena. Regarding chromatin activation, one possibility is that mitochondrial content has no impact on the number of genes active and only acts by increasing the degree of epigenetic modifications in genes that are already active; alternatively, cells with high mitochondrial content could contain a higher number of genes active than cells with low mitochondrial content. With respect to RNA Pol II we have three possibilities: The first one is that cells with many mitochondria contain more molecules of RNA Pol II per active gene. The second possibility is that the number of RNA Pol II molecules per active gene remains constant and only changes the number of genes active. The third possibility is a combination of both: more genes active with more RNA Pol II per gene in cells with high mitochondrial content.
To test these possibilities, we analyze the dynamic properties of RNA Pol II-GFP in individual cells. The transcription cycle by RNA Pol II can be understood as follows: Free RNA Pol II molecules interact with DNA, making a complex that can be abortive (binding to DNA and not transcribing or transcribing a very short transcript) or that can proceed into elongation mode after being modified (Fig. 4A). Once RNA Pol II elongating molecules complete the transcription cycle, they become free and diffuse throughout the nucleoplasm. This simple model involves several steps with different kinetic properties (Hieda et al. 2005). To study RNA Pol II kinetics, we used a cell line (C23) carrying fluorescent molecules of RNA Pol II (Sugaya et al. 2000; Kimura et al. 2002). With these cells, we performed FLIP (fluorescence loss in photobleaching) experiments of the RNA Pol II-GFP (Methods; Supplemental Fig. S4).
Figure 4.
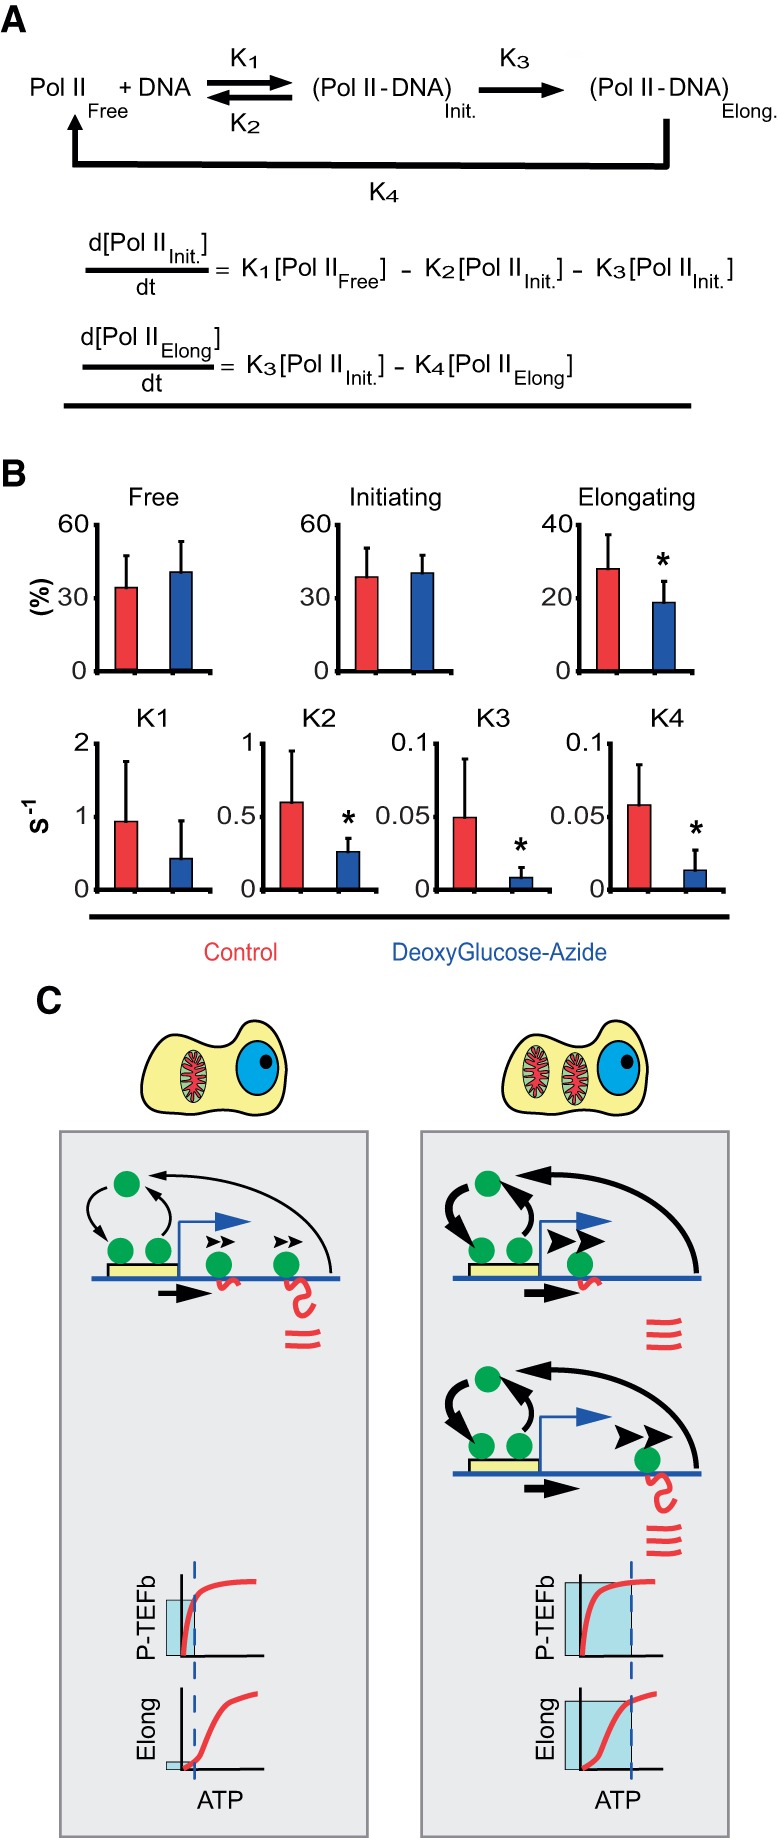
ATP dependence of RNA Pol II transcription kinetics. (A) Kinetic model for RNA Pol II transcription cycle (arrows with rate constants represent transitions) and the corresponding mass-action equations for the amount of initiating and elongating RNA Pol II. (B) Quantification of the fraction of free, initiating and elongating polymerase (first row) and the different rate constants (second row) by FLIP analysis of RNA Pol II-GFP (Supplemental Fig. S4; Supplemental Text). Red bars are values in control cells, and blue bars values in ATP-depleted cells (treated with deoxyglucose and azide). Error bars are SD. For each data point, at least 50 cells were used. (C) Cartoon of the different kinetic modes of RNA Pol II in cells with low (left) and high (right) ATP content. The cartoon exemplifies a typical gene with the promoter (yellow box) and RNA Pol II molecules (green circles), DNA (blue line), and RNA (red line). In cells with low mitochondrial content (left), RNA Pol II binds and detaches continuously at the promoter (arrow thickness illustrates the magnitude of the effect). A fraction of the RNA Pol II molecules are able to commit into elongation (arrow under the DNA). Then elongating RNA Pol II molecules track on the DNA at slow speed (illustrated by the arrowheads over RNA Pol II), which determines the speed of production of RNA (red lines). Once RNA Pol II finish the elongation phase, it detaches from DNA and RNA accumulates. At the bottom of the panel we show the dependency on ATP of the P-TEFb complex (kinase responsible for conversion of RNA Pol II into elongation mode) (hyperbolic kinetics, KM ∼30 μM). “Elong” stands for the elongating phase of RNA Pol II transcription cycle. This phase shows a sigmoidal dependency on ATP with a S0.5 ∼900 μM. Under low mitochondria (low ATP), the process of transition from initiation to elongation works near to full speed, but the speed of elongation is strongly diminished by the low ATP concentration. These two effects result in the accumulation of RNA Pol II molecules in the body of the gene due to the mismatch between entry and exit of RNA Pol II on the gene. In the right panel we illustrate the case of a cell with high mitochondrial mass. In these cells, more genes are active. The dynamic exchange of RNA Pol II molecules on the promoter is not affected: Although K1 and K2 are lower in cells with low mitochondria, the ratio between these constants is maintained (for this reason both arrows are thicker). The fraction of the RNA Pol II molecules that are able to commit to elongation (arrow under the DNA) is higher than in low mitochondria conditions. Then, RNA Pol II molecules elongate at high speed (thick arrowheads over elongating RNA Pol II). Therefore, more RNA molecules are produced per unit of time in high mitochondria conditions. As the speed of elongation is high, the speed of RNA Pol II detachment is higher than in low mitochondrial content cells (thicker arrow). At the bottom of the panel, we explain why the loading of RNA Pol II on DNA is higher in cells with high mitochondrial content. Under high ATP conditions, the complex P-TEFb is working at full speed and likewise the elongation phase of the transcription cycle. As both kinetic processes are balanced, the entry and exit of RNA Pol II on the gene are also balanced.
Analysis of experimental FLIP data revealed at least three populations of RNA Pol II molecules (Supplemental Fig. S4B), as previously described: one freely diffusible, another bound to DNA but not engaged in productive transcription elongation, and a third population engaged in transcription (Kimura et al. 2002; Hieda et al. 2005). This, in combination with the steady-state solution of the kinetic model in Figure 4A, allows us to obtain values for the different rate constants (Supplemental Text). Unfortunately, we could not stain mitochondria in these cells because it affects fluorescent RNA Pol II-GFP, hampering its analysis. This makes it impossible to assess in a direct manner the contribution of mitochondrial mass to any variability of RNA Pol II-GFP. Instead, we adopted another strategy based on the fact that differences in mitochondrial content imply differences in ATP levels (das Neves et al. 2010). To assess that most ATP in our cells is provided by mitochondria, we grew HeLa cells in the absence of glucose and presence of galactose, which did not affect ATP concentrations (Supplemental Fig. S4C). This means that the contribution of glycolysis to ATP production is minimal in our cell line. Therefore, we manipulate ATP levels to mimic differences in mitochondrial content. ATP was depleted by incubation with deoxyglucose plus azide (DG-A); this treatment reduced ATP levels by ∼95% (Supplemental Fig. S4C). ATP depletion resulted in moderate decrease in both K1 and K2 (DNA entry and abortive rate constants, respectively) after 30 min of DG-A exposure (Fig. 4B); moreover, the fraction of initiating molecules was not affected (Fig. 4B). These results suggest that although both constants have been affected by ATP, the ratio that determines the proportion of initiating polymerase remains unchanged.
We next studied the effect of DG-A treatment on the fraction of RNA Pol II initiating molecules that were able to proceed to elongation (K3/K1). In DG-A treated cells, this is only 2.9% compared to 8.2% in control cells, very similar to the 8.6% reported in Darzacq et al. (2007). This is probably due to the fact that K3 is mediated by the activity of the kinases responsible for the phosphorylation of RNA Pol II C-terminal domain (CTD) at Ser2 (Chao et al. 2000). Estimating the concentration of ATP in the control cells as 1 mM (Traut 1994), DG-A treated cells must contain a concentration of ATP ∼30 μM, which is close to the Michaelis-Menten constant KM of the kinases responsible for phosphorylation of Ser2 on RNA Pol II, i.e., 36 μM for P-TEFb (Chao et al. 2000); 27 μM for CTDK I (Fig. 4C; Lee and Greenleaf 1989).
Energy depletion reduced mostly the elongating fraction of RNA Pol II and the elongation rate constant K4 (Fig. 4B). Consistently, cells transcribing at a low rate (low K4) have a lower fraction of RNA Pol II molecules engaged in elongation (Supplemental Fig. S4F). The number of molecules of RNA Pol II elongating depends on the ratio K3/K4. K4 strongly depends on the concentration of ATP and thus K3, but differentially: One is hyperbolic and the other is sigmoidal (Fig. 4C; das Neves et al. 2010). This implies that at low ATP levels, K3 is near KM, and K4 is far below the half-saturation value. However, under high ATP levels, both kinetic processes will be working at maximum speed.
The analysis of the number of RNA Pol II-engaged molecules on active genes (K3/K4) showed an average of 1.2 and 2.2 molecules in the control versus DG-A treated cells, respectively, consistent with the numbers reported in other studies (Jackson et al. 1998; Darzacq et al. 2007; Canals-Hamann et al. 2013).
Taken together, our results show that cells with more mitochondria contain more copies of RNA Pol II active molecules on average and a larger proportion of active chromatin but a lower number of elongating RNA Pol II molecules per gene than cells with low mitochondrial content. The way to conciliate all these data is that cells with high mitochondrial content transcribe a higher number of genes than cells with low mitochondrial mass.
Mitochondrial content affects genome-wide transcript abundance
The global trends described in the previous sections show that cells with more mitochondria possess more biosynthetic capabilities, suggesting that marked differences in the cellular mitochondrial/energy content may also entail pronounced differences in gene expression. It is however unclear if these trends will similarly affect mRNA and protein levels of all genes, or whether there will be a larger impact on specific genes.
To address this question, we sought to analyze genome-wide RNA expression in cells with marked differences in mitochondrial levels. To maximize cell-to-cell differences in mitochondrial content, we first sorted HeLa cells according to mitochondrial mass in two populations (Low and High regions in Fig. 5A) with around fivefold changes in mitochondria. We then sequenced mRNA extracted from both populations (RNA-seq). We found more than 59,500 mRNA species with at least twofold changes between the two populations. Relative expression differences between Low and High populations were validated by qPCR (Supplemental Fig. S5). The analysis of gene ontology functions for these genes showed that genes involved in macromolecular homeostasis (synthesis and degradation of RNA and proteins) were overrepresented (Supplemental Table S1).
Figure 5.
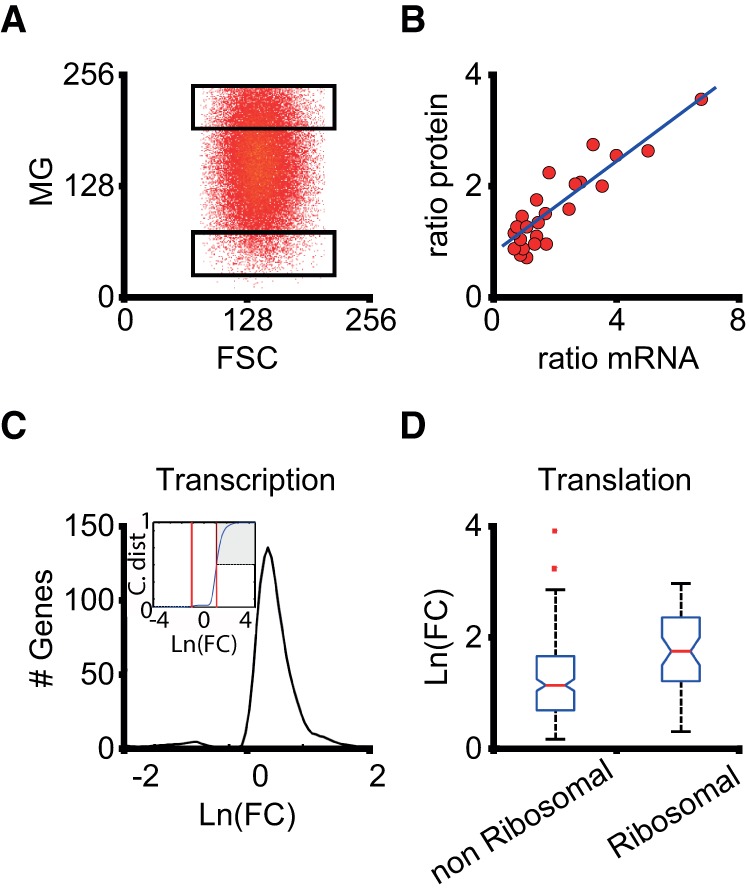
Genome-wide influence of mitochondrial content on gene expression. (A) HeLa cells were sorted according to the mitochondrial content after staining with MitoTracker Green FM. Two populations of cells were split for RNA-seq analysis, with a difference in average mitochondrial content of around fivefold (High and Low regions). (B) Correspondence between mRNA and protein content of 24 selected genes (Methods). The plot of the ratio (High level/Low level) of mRNA from RNA-seq experiments and the cognate protein from inmunostaining assays for equivalent cell populations is shown (correlation: r2= 0.8; slope: 0.36). (C) Distribution of logarithmic fold change (High/Low) ratios for all the genes belonging to the “transcription” family according to the gene ontology classification (Supplemental Table S1). The cumulative distribution (inset) shows that ∼50% of the transcription genes present differences in fold change larger than three (shaded area), which means approximately doubling protein content according to B. There is a small fraction of genes (∼3%) that are down-regulated, showing a threefold decrease in the High condition. (D) Box plot of the distributions of logarithmic fold changes for genes in the “translation” family, separating those coding for ribosomal proteins. These genes are specially affected by mitochondrial content.
Although changes in mRNA levels are expected to have an impact on protein levels, steady-state transcript abundances only partially predict protein abundances (Vogel and Marcotte 2012). Thus, we first determined the correlation between mRNA and protein levels in our system. We chose 24 genes from the RNA-seq data and used single cell quantitative immunostaining to select cells on Low and High fractions of the population and determine the amount of protein product in those fractions. We plotted the ratio (High level/Low level) of RNA (taken from the RNA-seq experiment) and protein (from single cell microscopy) for each gene (Fig. 5B). This shows a good correlation (r2 = 0.8, Pearson correlation) between changes in mRNA and protein, validating the data obtained with RNA-seq. However, the slope was 0.36, which means that doubling the abundance of a specific mRNA roughly represents a 36% increase in the corresponding protein. Our estimation is consistent with genome-wide studies in mouse fibroblasts (Schwanhäusser et al. 2011).
Since genes involved in transcription/translation processes appeared as specially affected by mitochondrial content (Supplemental Table S1), we analyzed expression differences (as quantified by logarithmic fold changes) (see Methods) in these gene families. In Figure 5C, we show the distribution of logarithmic fold changes (LFCs) for genes labeled as belonging to the “transcription” family (∼1200 genes). Most of the genes show elevated expression in the High population (positive LFC), with only a few (around 3%) with inverted expression (negative LFC). Moreover, taking into account the correlation between mRNA and protein levels (Fig. 5B), it is expected that genes with FC > 3 in their mRNA will approximately double the corresponding protein content. We found that ∼50% of the transcription genes fall above this threshold (Fig. 5C, inset). Genes belonging to the “translation” family display similar trends (not shown), with ∼60% of them above the threshold for protein doubling. Notably, most of the genes coding for ribosomal proteins are among those with larger differential expression between High and Low populations (Fig. 5D). Because ribosomal synthesis is tightly controlled (Lempiainen and Shore 2009), our data suggest that cells in the High population have a greater number of ribosomes than Low cells. We further tested this possibility by costaining cells with CMXRos and YOYO-1 (an indicator of the amount of ribosomal RNA) (Calabuig et al. 2005). As expected, ribosomal RNA content scaled with mitochondrial mass (Supplemental Fig. S6A). In agreement with this evidence, we found from our RNA-seq data that expression of MYC, a regulator of ribosomal gene transcription initiation (van Riggelen et al. 2010), was increased 3.4 times on High cells.
Interestingly, the variation in macromolecular biosynthesis comes together with an alteration in degradation. This was pointed out in the analysis of gene ontology functions, which highlighted “protein catabolic process” as being significantly altered by mitochondrial content (Supplemental Table S1). Indeed, mitochondria affect RNA and protein stabilities. mRNA stability showed a moderate global dependence on mitochondrial content (average half-life ∼46 min for High versus ∼65 min for Low conditions) (Supplemental Fig. S7A) and so did protein stability (average half-life ∼15.8 h for High versus ∼18.4 h for Low conditions) (Supplemental Fig. S7B).
Variability in alternative splicing
Fold changes in total mRNA expression from a given gene may not be indicative of the impact on the gene function, since alternatively spliced mRNAs may have different functional implications. Alternative splicing is a major source of proteome diversity (Nilsen and Graveley 2010), with important consequences in processes such as development (Kalsotra and Cooper 2011) and disease (Cooper et al. 2009). Moreover, the number and relative abundance of mRNA isoforms can be highly variable, suggesting that much of the alternative splicing (AS) may be a consequence of noise in the splicing machinery (Melamud and Moult 2009; Pickrell et al. 2010). Previous studies of cell-to-cell variability in the mRNA isoform ratios for two endogenous genes have indeed shown that this variability can be considerably large and originated by fluctuations in the regulatory splicing machinery (Waks et al. 2011). High heterogeneity in single-cell alternative splicing has also been observed in immune cells in response to lipopolysaccharide stimulation (Shalek et al. 2013).
Heterogeneity in mitochondrial content will likely have an impact on AS through different processes, either directly as a modulator of energy supply (required for the majority of steps, from the molecular assembly of the spliceosomal complex to intron removal) or indirectly through its influence on other gene expression or regulatory processes that are coupled to AS (Braunschweig et al. 2013): For instance, RNA Pol II elongation is known to play a role in AS regulation (Kornblihtt 2007). Therefore, we analyzed the changes in abundance of all mRNA forms between the High and Low populations. The first observation is that global variability in mRNA isoforms is much larger than variability in the joint expression levels of genes. The proportion of genes differentially expressed (those with FC differences between subpopulations larger than three) is ∼50%, whereas the proportion of individual isoforms increases up to 80% (Fig. 6A). Notably, there is an appreciable fraction of isoforms (∼13%) that are much more abundant in the Low population (Fig. 6A, “Down” red bar). This suggests that mitochondria modulates the outcome of AS in a complex way, since the amount of many mRNA forms is not just proportional to the transcriptional activity (RNA Pol II and poly[A]) (Supplemental Fig. S6B,C). This is vividly illustrated in Figure 6B, where we show the expression levels and fold changes of all the isoforms for a few representative genes. These genes show “inversions” of isoform levels (some isoforms are more abundant in the High population and others in the Low population, seen as intermingled red and green colors in the FC column) (Fig. 6B).
Figure 6.
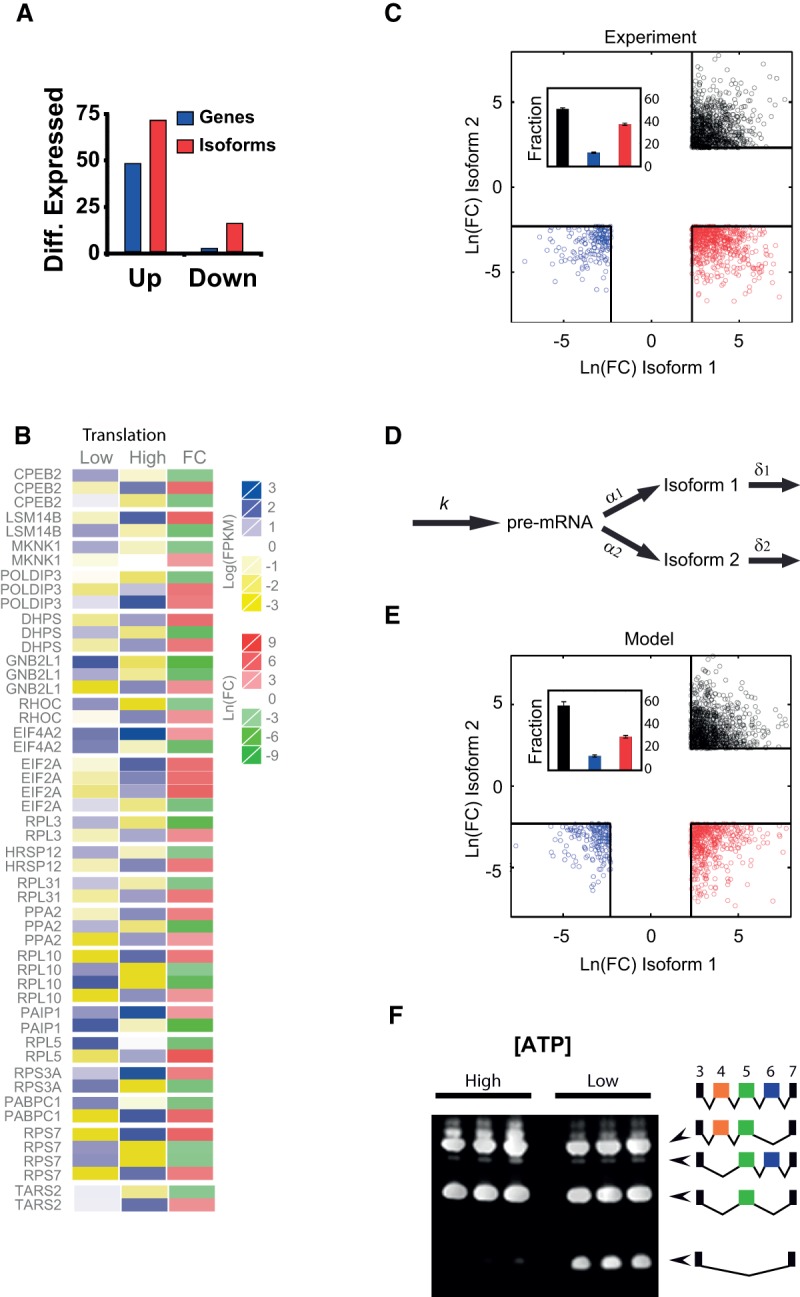
Effect of mitochondrial content on alternative splicing. (A) Variability in mRNA isoform expression is larger than variability in average gene expression. We show the fraction of isoforms up-regulated (FC > 3) or down-regulated (FC < 1/3, red bars) by mitochondrial content compared with the fraction of genes up- or down-regulated (blue bars). (B) Heat map displaying the levels of expression in High and Low cells (blue to yellow) and the logarithmic FC (red to green). This panel shows a group of genes in which alternative mRNA types are inverted in High versus Low cells. (C) Scatter plot of logarithmic FCs for pairs of alternatively spliced transcripts with FC > 10(FC < 1/10). The threshold value of FC (black squares) defines three domains in which AS is drastically altered by mitochondrial content: (black) both AS forms are overexpressed in mito-high conditions; (blue) both forms are down-regulated; (red) one form is overexpressed and the other is underexpressed. The inset shows the quantification of the fraction of dots in each domain. (D) Schematic representation of the two-step model involving pre-mRNA formation (with transcription rate k) and conversion to alternatively spliced forms with splicing rates α1 and α2. These mature mRNA forms can be degraded with rates δ1 and δ2, respectively. (E) Scatter plot of logarithmic fold changes for pairs of alternatively spliced forms simulated from the two-step model (see Supplemental Text for details). The threshold in FC and color code is the same as in B. (F) Changes in ATP affect alternative splicing. Jurkat cells treated for 12 h with deoxyglucose, which affects the splicing of PTPRC. Under low ATP conditions, the spliced form of PTPRC lacking exons 4, 5, and 6 is overexpressed. For both treatments, each line is a biological replicate.
To make an amenable analysis of the variability in AS, we constructed a differential expression map of AS by randomly selecting isoform pairs within all genes and plotting the relative abundance of those pairs with larger FCs (Fig. 6C) (we show all isoforms with FC > 10 [<1/10]). The three regions in this map correspond to three different situations of altered AS due to mitochondrial content: In the upper right quadrant (black circles), both isoforms showed much larger levels in the High population (UP case). In the bottom left quadrant (blue symbols), the two isoforms were much more abundant in the Low cells (DOWN case). In the bottom right quadrant (red symbols), the abundance of both isoforms was inverted (one isoform much more expressed in High and the other in Low, INV situation). These inversions, that qualitatively change the pattern of AS, represented a considerable fraction of all differentially expressed genes (inset of Fig. 6C).
How can AS be altered in such a way by mitochondria? Probably this is not the result of a single factor, since through modulation of ATP content, mitochondria can affect almost every individual step in mature mRNA formation. To test whether the observed variability in isoforms could be explained by noise in the splicing machinery/alternative site choice (Melamud and Moult 2009; Pickrell et al. 2010) or could be attributed to changes in the transcription processes coupled to splicing, such as RNA Pol II elongation speed (Eperon et al. 1988; de la Mata et al. 2003), we simulated our RNA-seq data with a simple kinetic model (Fig. 6D). In this model, we summarize in two steps (pre-mRNA production with rate k and conversion to isoforms 1 and 2 with rates α1 and α2, respectively) each alternative splicing event. Each isoform abundance can be obtained from the steady-state levels as , , where N1 = α1/(α1 + α2 is the fraction of pre-mRNA converted to isoform M1. We generated values of transcription rate k and degradation rates (δ1, δ2) sampling from distributions of mRNA synthesis rates and half-lives (Supplemental Fig. S8) obtained in a recent genome-wide study (Schwanhäusser et al. 2011) and included gene-specific and global variability through changes in the different parameters (details are provided in Supplemental Text). Extrinsic variability due to differences in mitochondrial content is taken into account in the transcription and degradation rates according to our experimental measures of RNA Pol II elongation and mRNA decay (Supplemental Figs. S6B, S7A; Supplemental Text). Allowing variations of model parameters independently or in groups (Supplemental Text; Supplemental Fig. S9), we found that the experimental pattern could be reproduced within this condensed two-step model (Fig. 6E), only when allowing for both high gene-specific noise in transcription and AS splicing rates, and global noise induced by mitochondrial variability. On one hand, we find that inversions in the relative abundance of alternatively spliced isoforms (Fig. 6C,E, red circles) were associated with drastic gene-specific changes in AS conversion rates (Supplemental Fig. S9C). On the other hand, UP and DOWN regions (black and blue circles, respectively) were caused by large differences in pre-mRNA production rate between the Low and High conditions (Supplemental Fig. S9B). Extrinsic variability in transcription elongation and mRNA decay alone failed to account for the largest differences in isoform levels between Low and High populations (Supplemental Fig. S9A).
It is difficult to ascertain whether the large gene-specific changes required to reproduce the variability in the experimental data can be attributed only to mitochondrial differences. One possible way in which mitochondria can drastically influence transcription rate and modify the outcome of alternative splicing is by changing the choice of promoter. We then investigated the use of alternative promoters for all expressed genes in the Low and High populations in our RNA-seq data. We found (Supplemental Fig. S10A) that alternative promoter choice accounts for ∼70% of the differentially expressed splicing variants. Furthermore, changes in alternative promoter usage or transcription elongation may also have an influence on isoform conversion rates through coupling between transcriptional events and AS (Braunschweig et al. 2013). This finding is not surprising given the fact that mitochondria affects the expression of epigenetic markers associated with activation of promoters H3K4me3 (Fig. 2) and the number of active genes. Mitochondria can also have an impact on the rate of isoform conversion by affecting the genes involved in the production of the splicing machinery. Analyzing the expression of these genes in the two populations, we find that ∼47% of these genes are up-regulated (FC > 3) in the High population (Supplemental Fig. S10B).
These results hint of the possibility that mitochondrial levels can be modulating, directly or indirectly, many layers of AS regulation. To test whether this could be mediated by differences in ATP, we studied how changing the concentration of ATP affects the splicing of PTPRC (also known as CD45), a paradigmatic gene where AS is well known (Lynch 2004). We analyzed the spliced variants produced by this gene in control cells and cells incubated overnight with deoxyglucose (reducing ATP levels to 55% of those in control cells). We found that ATP depletion resulted in the increase of the PTPRC splice form lacking exons 4, 5, and 6 (Fig. 6F).
Discussion
No two cells in a clonal population are identical. This nongenetic variability may play important roles at the functional level (Brock et al. 2009; Spencer et al. 2009; Altschuler and Wu 2010; Snijder and Pelkmans 2011), and recent years have seen a considerable effort to trace back and understand its origins. Noise during gene expression (the random outcome of gene products due to unpredictable processes) is a fundamental source of cell-to-cell variability and may come from the inherently probabilistic and discrete nature of biochemical reactions (intrinsic noise) or from upstream influences (extrinsic noise). We have a fairly good idea of the mechanisms responsible for intrinsic noise, due to approaches combining theoretical insights and single molecule techniques (Raj and van Oudenaarden 2009; Sanchez and Golding 2013). On the other hand, it is difficult to ascertain which upstream processes have a larger impact on gene expression variability: Extrinsic noise is probably the combination of several factors, reflecting both stochastic and deterministic influences (Snijder and Pelkmans 2011). We reasoned that, gene expression being a process with high energy demands, cell-to-cell variability in mitochondrial content could be a fundamental source of global heterogeneity in gene expression.
We have shown here that natural variability in mitochondrial content may account for roughly half the variability in protein levels, and this is likely due to the energetic modulation of many different layers of the biosynthetic activity, affecting gene expression outcome.
The first layer of gene regulation is chromatin modification. We find that mitochondria influence epigenetic chromatin modifications, notably those activating transcription.
It is not surprising to associate histone acetylation and methylation to mitochondrial content, since they modulate the concentration of precursors for these reactions (Supplemental Fig. S11). For instance, mitochondrial abundance highly correlates with levels of Pyruvate Dehydrogenase (PDP1) (Supplemental Fig. S1E), which is essential for the production of acetyl-CoA (a precursor of histone acetylation driving histone hyper-acetylation (Gut and Verdin 2013)). Likewise, histone methylation is catalyzed by histone methyl transferases and the substrate S-adenosyl-L-methionine (SAM), whose production depends on ATP. Moreover, H3K36me2 and H3K4me3 (Fig. 2) are demethylated by the action of lysine specific demethylases (KDM2A/B), which are activated by 2-oxoglutarate, whose concentration depends on ADP/ATP among others (Salminen et al. 2014).
Another layer of gene expression affected by mitochondrial heterogeneity is the regulation of the transcriptional machinery (general transcription factors and RNA Pol II). Mitochondria influence both the content of RNA Pol II and its function. The impact, however, is not the same for all the steps of the transcription cycle because there may be many biochemical reactions for which ATP is not a limiting factor. We investigated this by in vivo monitoring the transcriptional dynamics of RNA Pol II, similar to previous studies (Darzacq et al. 2007). A simple kinetic model of the polymerase transcriptional cycle allows extracting the relevant rates using time-dependent FLIP experiments, and we compared these rates in normal and ATP-depleted cells. Our analysis showed that ATP mostly influences transcription elongation rates and the fraction of polymerases per gene committed to elongation, which is consistent with previous measurements of the ATP dependence of the elongation rate (das Neves et al. 2010).
The final step of gene expression is translation, which strongly depends on mitochondrial content. This is expected because translation is the most energy demanding process in the cell (Lane and Martin 2010). Mitochondrial levels affect both the content of translation machinery and its activity, particularly ribosome biosynthesis. This is confirmed both by the strong covariation in individual cells of mitochondria and ribosome metabolism proteins and by our RNA-seq data highlighting the large influence of mitochondria on genes coding for ribosomal proteins.
Consistent with that, ATP modulation by retrograde signaling experiments resulted in a large effect on translation apparatus gene expression (Chae et al. 2013; Guha et al. 2014). However, retrograde signaling experiments, although informative, do not reflect the physiological role of the natural variation of mitochondrial content on gene expression regulation. Mitochondrial DNA depletion causes, among others, increased reactive oxygen species (ROS) production and perturbation of cytosolic Ca2+, which both signal to the cell nucleus (Chae et al. 2013; Guha et al. 2014), affecting processes like alternative splicing (Vivarelli et al. 2013). We have analyzed the contribution of ROS to RNA Pol II transcription and ATP production, and we have seen that both processes are very sensitive to ROS (Supplemental Fig. S12). Therefore, it is difficult to distinguish the genuine effects of ROS from those of ATP in gene expression.
Another main finding of this study is the influence of mitochondrial content on AS. AS regulation is a complex process involving many different steps. For instance, several histone modifications are known to regulate AS and have been shown to be associated with changes in relative isoform abundance (Luco et al. 2011; Podlaha et al. 2014). This has led to the proposal of two models of epigenetic regulation of splicing: the kinetic model and the chromatin-adaptor model.
According to the kinetic model proposed by Kornblihtt and colleagues (Luco et al. 2011), the chromatin structure affects RNA polymerase elongation rate, which influences the competition between weak and strong splice sites for the recruitment of splicing factors (Luco et al. 2011). On the other hand, in the chromatin-adaptor model, histone modifications along the gene determine the binding of an adaptor protein that recruits specific splicing factors. Our results show that mitochondrial content affects epigenetic markers involved in transcription activity like H3K36me3, associated with transcription elongation (Fig. 2), and also RNA Pol II elongation per se (das Neves et al. 2010). Thus, the effect of mitochondria on transcription elongation could be enough to explain the changes in AS proposed by the kinetic model, although we cannot exclude the possibility that the impact of mitochondrial content on AS is the combination of both models.
Another way to control AS is by specific splicing factors that bind to RNA and help to resolve exon–exon junction choice. Recently, a new role for these factors on RNA Pol II elongation has emerged. For instance, the splicing factor SF1 interacts with the positive elongation complex P-TEFb, which phosphorylates the Ser2 residues of the CTD to increase Pol II processivity. It has been proposed that the assembly of splicing complexes on nascent RNA may facilitate Pol II elongation across a gene (Fong and Zhou 2001). Further evidence for the role of splicing factors in RNA Pol II elongation has been reported in experiments in which the SRSF2 factor was depleted and resulted in RNA Pol II pausing, possibly as a consequence of defective recruitment of the P-TEFb complex, reducing Ser2 CTD phosphorylation (Lin et al. 2008). This combined evidence suggests that AS is mostly controlled through a kinetic mechanism. Then, mitochondria might influence AS through its direct impact on RNA Pol II kinetics.
AS drives proteome diversity, and it is estimated that up to 94% of genes are alternatively spliced in humans (Pan et al. 2008). Moreover, AS is more widespread in multicellular than unicellular eukaryote (Kornblihtt et al. 2013), suggesting a possible role defining cellular identity. For instance, AS is known to regulate cell lineage choice (Xu et al. 2006; Gabut et al. 2011; Folmes et al. 2012; Liu et al. 2012; Han et al. 2013). Mitochondria have been also involved in cell differentiation (Folmes et al. 2012; Romero-Moya et al. 2013). These facts make it tempting to think that mitochondria might influence cell differentiation through AS.
If mitochondrial content/function modulates AS, both are likely to be associated in pathological situations. AS impacts on cancer biology through its effect on genes affecting cell cycle control, signal transduction pathways, apoptosis, angiogenesis, invasion and motility, and metastasis (Venables 2006). Cancer could be the paradigm in which mitochondria dysfunction and AS are linked (Hanahan and Weinberg 2011): For instance, mitochondrial DNA copy number reduction has been associated with breast cancer (Tseng et al. 2006) and shown to modulate the expression of the epithelial splicing regulatory protein (ESRP1) within this context.
Methods
Cell culture, immunocytochemistry, and mitochondrial content analysis
Cells were culture immunolabeled, imaged, and signal analyzed as described in Iborra and Buckle (2008). Mitochondrial mass was measured as the integrated signal of CMXRos (Molecular Probes) incorporated by individual cells. For experiments using Galactose instead of glucose, cells were adapted for 2 wk to grow in DMEM deprived of glucose (Invitrogen) supplemented with 10 mM galactose, 2 mM glutamine 25 mM HEPES, 10% FBS, 1 mM sodium pyruvate, and penicillin-streptomycin.
Transcription and translation activities
Transcriptional activity was monitored in CMXRos stained cells (∼200–500 cells) by BrU incorporation after 30 min as described in das Neves et al. (2010). Controls were performed by incubation for 1 h with 100 µM DRB or for 1 h with 1 µg/mL actinomycin D prior to BrU incubation, abolishing BrU incorporation completely (data not shown).
Translational activity in CMXRos-incorporated cells was monitored after 30 min of incorporation of the methionine analogous L-homopropargylglycine (AHA) and the Click-iT HPG Alexa Fluor 488 Protein Synthesis Assay Kit, following manufacturer guidelines. Controls were performed by incubation for 30 min with 1 mM Cycloheximide, which abolished AHA incorporation into nascent proteins (data not shown).
FLIP analysis
Briefly, in FLIP experiments a nuclear area is continuously photobleached (Supplemental Fig. S4A), and the fluorescence intensity is a measure of the amount of RNA Pol II-GFP molecules in the unbleached area. The decay in fluorescence is then due to the free RNA Pol II-GFP molecules entering the bleached area. Different dynamic regimes in the fluorescence decay thus indicate the presence of different dissociation kinetics (Hieda et al. 2005). The simple kinetic model shown in Figure 4 can be used to estimate the reaction rate constants. Further details are provided in Supplemental Text and Supplemental Figure S4.
ATP determination
ATP concentration was determined using the ATP Bioluminescence Assay Kit HS II (Roche), following manufacturer instructions.
Cell sorting
Trypsinized HeLa cells were stained with MitoTracker Green FM dye (Molecular Probes) for 15 min in DMEM, following manufacturer guidelines. Then, cells were sorted on a fluorescence-activated cell sorter (MoFlo; DakoCytomation) to purify populations of cells with different mitochondrial content as described in das Neves et al. (2010).
Poly(A) RNA FISH and RNA extraction
HeLa cells were sorted as described in das Neves et al. (2010). We used RNA-FISH methods described in Brown et al. (2008) to detect poly(A) using Cy5-d(T)30 from Sigma-Aldrich. Total RNA from sorted cells was extracted using RNeasy Mini Kit from Qiagen using manufacturer guidelines.
Primary processing of Illumina RNA-seq reads
One lane per sample was used in a 50-bp paired-end run on an Illumina Genome Analyzer IIx. RNA-seq reads were obtained using Bustard (Illumina Pipeline, version 1.3) and quality-filtered using the standard Illumina process. The number of sequences obtained was 24,688,385 sequences for the low mitochondria sample and 29,809,072 sequences for the high mitochondria sample.
Mapping of RNA-seq reads and transcript assembly
Obtained reads from the two samples were aligned to the NCBI H. sapiens reference genome (build GRCh37) using TopHat v1.1.4 (Trapnell et al. 2009, 2010) with default parameters, which incorporates the Bowtie v0.12.7 algorithm for the alignment (Langmead et al. 2009). The aligned read files from TopHat were assembled into transcripts with Cufflinks v0.9.3 (Trapnell et al. 2009) using the Ensembl GRCh37.60 gene annotations file as reference (Flicek et al. 2012). Cufflinks estimated the relative abundance of each transcript using the normalized RNA-seq fragment counts. The unit of measurement is fragments per kilobase of exon per million (FPKM) fragments mapped.
Functional analysis
mRNAs with an expression difference of twofold or higher were split into two lists: mRNAs overrepresented in the mito-high sample or in the mito-low sample. These lists of mRNAs were supplied to the FatiGO scan tool (Babelomics4 suite) (Medina et al. 2010) to study the functional enrichment profile and to Gene Ontology (GO). GO terms with a high score were grouped by related functions, and the genes associated with them were split using in-house perl scripts. Gene expression values were log10 transformed, and fold change was calculated as mentioned below.
RNA-seq post-assembly analysis
We first checked the average mRNA content per cell in the two populations by poly(A) mRNA FISH. This showed an mRNA ratio (Low/High) of 0.34. In order to properly calculate relative differences in expression, the mRNA/gene expression levels calculated by Cufflinks were corrected in the Low sample by a 0.34 factor. mRNA/genes with expression values lower than 0.1 FPKM in both samples were filtered out. Fold change was calculated as the natural logarithm of the ratio High FPKM/Low FPKM. To avoid logical errors and to reduce the significance of low expression mRNA genes, we introduced a cutoff of 0.8 FPKM to calculate fold changes for mRNA isoforms/genes expressed below this value. We checked that using other cutoff values (0.1–2) did not alter the statistical differences in variability between the Low and High populations.
For visualization of the differential expression map (Fig. 6C), we calculated fold changes with a cutoff of 0.1 FPKM for all isoforms with lower values (we applied the same cutoff value to calculate FCs from model simulations). We found 6491 genes and 16,306 isoforms with FC > 10 (FC < 0.1) between Low and High conditions. After removing genes with only one RNA form, we randomly sampled pairs of isoforms to construct scatter plots as in Figure 6C. The error bars in the inset are standard deviations obtained with 100 independent scatter plots (genes with more than two isoforms above threshold were resampled).
Protein expression quantification
Cells were sorted, seeded on coverslips, fixed, immunostained, and the intensity quantified as described in Iborra and Buckle (2008).
In Figures 1, 2, and 3, the protein antibodies used were MTOR(2983), PFKP(12746), FASN(3180), HK2(2867), LDHA(2012), PRPS6(4858) (Cell Signaling); SF3B4(AB66659), HNRNPU(AB20666), NFE2L2(AB31163), EPRS(AB31531), RRS(AB31537), HK4me3(AB8580) (Abcam); HNRNPA0(SC-16509), EP300(SC-584), TBP(SC-56794), GTF2F(SC-235), PKM2(SC-365684), UBTF(SC-13125), RNA Pol II(RPB1)(SC-9001) (Santa Cruz Biotechnologies); CLU(HPA000572), SRSF2(HPA049905), MCL1(HPA008455), TUBB(T8328), G6PD(HPA000834), PDIA2(HPA051692), GAPDH(G9545), PTBP1(WH0005725M1) (Sigma-Aldrich); GLUT1(AB1340) (Chemicon); BrU(MD5010) (Caltag); H4K20me2(39173), H3K36me2(39255), H4K16(39929), H3K27me3(61017) (Active Motifs); and PABP (kindly provided by Dr. Amelia Nieto).
For Figure 5B, the 24 antibodies used for protein quantification were HK2(2867), HDAC1(5356), LDHA(2012), RPS6(2217), EIF4B(13088), VDAC(4866), PFKP(12746) (Cell Signaling); G6PD(HPA000834), MCL1(HPA008455), TOMM22(HPA003037), CLU(HPA000572), PTBP1(WH0005725M1) (Sigma-Aldrich); NPM1(SC-6013), NCL(SC-8031), UBTF(SC-13125), PKM2(SC-365684), GTF2F(SC-235), BCL2(SC-492) (Santa Cruz Biotechnology); NFE2L2(AB31163), SF3B4(AB66659), IMMT(AB110329) (Abcam); GLUT1(AB1340) (Chemicon); EIF5(611976), EIF6(611120) (BD).
Global mRNA and protein half-lives
For RNA half-life calculation, cells were pulsed with 1 mM BrU for 1 h, then transferred to media without BrU and supplemented with 1 mM U and chased at different times. Then, Br-RNA was detected as above.
For protein half-life calculation, cells were labeled with AHA for 1 h in order to be incorporated into nascent proteins, and then cells were transferred to media without AHA and supplemented with 1 mM leucine and chased at different times. Then, proteins that incorporated AHA were detected following manufacturer guidelines.
PTPRC alternative splicing
Jurkat cells grown in RPMI were treated for 12 h with 25 mM deoxyglucose which reduced the concentration of ATP to 55% of control values measured as previously described (das Neves et al. 2010). After RNA extraction, PTPRC alternative splicing variants were analyzed as described in a previous study (ten Dam et al. 2000).
Data access
RNA sequencing data from this study have been submitted to the European Nucleotide Archive (ENA; http://www.ebi.ac.uk/ena/) under accession numbers ERS327027 (High mitochondrial condition) and ERS327026 (Low mitochondrial condition).
Supplementary Material
Acknowledgments
The authors would like to thank the Ministerio de Economia y Competitividad (Spain) (Grant numbers BFU2009-10792 and BFU2013-45918-R) and The Medical Research Council (U.K.) for supporting this work. We thank the Fundação Ciência e Tecnologia (Portugal) for funding R.P.N. A.R. held a postgraduate fellowship (FPU) from the Ministerio de Educación y Ciencia. We acknowledge Fernando Almazán and Silvia Márquez for mitochondrial DNA quantification. We thank Joanna Poulton for the qPCR probes for mitochondrial and nuclear DNA determination. We also thank Ugo Bastolla, Juan Ortín, Fernando Carrasco, Antonio Alcamí, and Carlos Martinez for critical reading. We thank the anonymous referees for useful suggestions that improved the manuscript. The CBMSO receives an institutional grant from Fundación Ramón Areces.
Author contributions: F.J.I. designed and performed experiments, analyzed data, and wrote the paper; R.N. sorted cells according to mitochondrial content and extracted RNAs and performed some of the FLIP experiments; A.L. performed RT-PCRs; A.R. and B.A. analyzed RNA-seq data; and R.G. analyzed data, developed analysis tools, performed the mathematical modeling, and wrote the paper. All authors discussed the results and implications and commented on the manuscript at all stages.
Footnotes
[Supplemental material is available for this article.]
Article published online before print. Article, supplemental material, and publication date are at http://www.genome.org/cgi/doi/10.1101/gr.178426.114.
References
- Altschuler SJ, Wu LF. 2010. Cellular heterogeneity: do differences make a difference? Cell 141: 559–563. [DOI] [PMC free article] [PubMed] [Google Scholar]
- Balázsi G, van Oudenaarden A, Collins JJ. 2011. Cellular decision making and biological noise: from microbes to mammals. Cell 144: 910–925. [DOI] [PMC free article] [PubMed] [Google Scholar]
- Braunschweig U, Gueroussov S, Plocik AM, Graveley BR, Blencowe BJ. 2013. Dynamic integration of splicing within gene regulatory pathways. Cell 152: 1252–1269. [DOI] [PMC free article] [PubMed] [Google Scholar]
- Brock A, Chang H, Huang S. 2009. Non-genetic heterogeneity—a mutation-independent driving force for the somatic evolution of tumours. Nat Rev Genet 10: 336–342. [DOI] [PubMed] [Google Scholar]
- Brown JM, Green J, das Neves RP, Wallace HA, Smith AJ, Hughes J, Gray N, Taylor S, Wood WG, Higgs DR, et al. 2008. Association between active genes occurs at nuclear speckles and is modulated by chromatin environment. J Cell Biol 182: 1083–1097. [DOI] [PMC free article] [PubMed] [Google Scholar]
- Calabuig J, de Juan J, Iborra FJ. 2005. Specific detection of RNA on ultra-thin sections. J Struct Biol 152: 146–148. [DOI] [PubMed] [Google Scholar]
- Canals-Hamann AZ, das Neves RP, Reittie JE, Iñiguez C, Soneji S, Enver T, Buckle VJ, Iborra FJ. 2013. A biophysical model for transcription factories. BMC Biophys 6: 2. [DOI] [PMC free article] [PubMed] [Google Scholar]
- Chae S, Ahn BY, Byun K, Cho YM, Yu MH, Lee B, Hwang D, Park KS. 2013. A systems approach for decoding mitochondrial retrograde signaling pathways. Sci Signal 6: rs4. [DOI] [PubMed] [Google Scholar]
- Chao SH, Fujinaga K, Marion JE, Taube R, Sausville EA, Senderowicz AM, Peterlin BM, Price DH. 2000. Flavopiridol inhibits P-TEFb and blocks HIV-1 replication. J Biol Chem 275: 28345–28348. [DOI] [PubMed] [Google Scholar]
- Cooper TA, Wan L, Dreyfuss G. 2009. RNA and disease. Cell 136: 777–793. [DOI] [PMC free article] [PubMed] [Google Scholar]
- Darzacq X, Shav-Tal Y, de Turris V, Brody Y, Shenoy SM, Phair RD, Singer RH. 2007. In vivo dynamics of RNA polymerase II transcription. Nat Struct Mol Biol 14: 796–806. [DOI] [PMC free article] [PubMed] [Google Scholar]
- das Neves RP, Jones NS, Andreu L, Gupta R, Enver T, Iborra FJ. 2010. Connecting variability in global transcription rate to mitochondrial variability. PLoS Biol 8: e1000560. [DOI] [PMC free article] [PubMed] [Google Scholar]
- de la Mata M, Alonso CR, Kadener S, Fededa JP, Blaustein M, Pelisch F, Cramer P, Bentley D, Kornblihtt AR. 2003. A slow RNA polymerase II affects alternative splicing in vivo. Mol Cell 12: 525–532. [DOI] [PubMed] [Google Scholar]
- Eldar A, Elowitz MB. 2010. Functional roles for noise in genetic circuits. Nature 467: 167–173. [DOI] [PMC free article] [PubMed] [Google Scholar]
- Elowitz MB, Levine AJ, Siggia ED, Swain PS. 2002. Stochastic gene expression in a single cell. Science 297: 1183–1186. [DOI] [PubMed] [Google Scholar]
- Eperon LP, Graham IR, Griffiths AD, Eperon IC. 1988. Effects of RNA secondary structure on alternative splicing of pre-mRNA: is folding limited to a region behind the transcribing RNA polymerase? Cell 54: 393–401. [DOI] [PubMed] [Google Scholar]
- Flicek P, Amode MR, Barrell D, Beal K, Brent S, Carvalho-Silva D, Clapham P, Coates G, Fairley S, Fitzgerald S, et al. 2012. Ensembl 2012. Nucleic Acids Res 40: D84–D90. [DOI] [PMC free article] [PubMed] [Google Scholar]
- Folmes CD, Dzeja PP, Nelson TJ, Terzic A. 2012. Metabolic plasticity in stem cell homeostasis and differentiation. Cell Stem Cell 11: 596–606. [DOI] [PMC free article] [PubMed] [Google Scholar]
- Fong YW, Zhou Q. 2001. Stimulatory effect of splicing factors on transcriptional elongation. Nature 414: 929–933. [DOI] [PubMed] [Google Scholar]
- Forster J, Famili I, Fu P, Palsson BO, Nielsen J. 2003. Genome-scale reconstruction of the Saccharomyces cerevisiae metabolic network. Genome Res 13: 244–253. [DOI] [PMC free article] [PubMed] [Google Scholar]
- Gabut M, Samavarchi-Tehrani P, Wang X, Slobodeniuc V, O'Hanlon D, Sung HK, Alvarez M, Talukder S, Pan Q, Mazzoni EO, et al. 2011. An alternative splicing switch regulates embryonic stem cell pluripotency and reprogramming. Cell 147: 132–146. [DOI] [PubMed] [Google Scholar]
- Gaydos LJ, Wang W, Strome S. 2014. Gene repression. H3K27me and PRC2 transmit a memory of repression across generations and during development. Science 345: 1515–1518. [DOI] [PMC free article] [PubMed] [Google Scholar]
- Guha M, Srinivasan S, Ruthel G, Kashina AK, Carstens RP, Mendoza A, Khanna C, Van Winkle T, Avadhani NG. 2014. Mitochondrial retrograde signaling induces epithelial-mesenchymal transition and generates breast cancer stem cells. Oncogene 33: 5238–5250. [DOI] [PMC free article] [PubMed] [Google Scholar]
- Gut P, Verdin E. 2013. The nexus of chromatin regulation and intermediary metabolism. Nature 502: 489–498. [DOI] [PubMed] [Google Scholar]
- Han H, Irimia M, Ross PJ, Sung HK, Alipanahi B, David L, Golipour A, Gabut M, Michael IP, Nachman EN, et al. 2013. MBNL proteins repress ES-cell-specific alternative splicing and reprogramming. Nature 498: 241–245. [DOI] [PMC free article] [PubMed] [Google Scholar]
- Hanahan D, Weinberg RA. 2011. Hallmarks of cancer: the next generation. Cell 144: 646–674. [DOI] [PubMed] [Google Scholar]
- Henikoff S, Shilatifard A. 2011. Histone modification: cause or cog? Trends Genet 27: 389–396. [DOI] [PubMed] [Google Scholar]
- Hieda M, Winstanley H, Maini P, Iborra FJ, Cook PR. 2005. Different populations of RNA polymerase II in living mammalian cells. Chromosome Res 13: 135–144. [DOI] [PubMed] [Google Scholar]
- Iborra FJ, Buckle V. 2008. Wide confocal cytometry: a new approach to study proteomic and structural changes in the cell nucleus during the cell cycle. Histochem Cell Biol 129: 45–53. [DOI] [PubMed] [Google Scholar]
- Jackson DA, Iborra FJ, Manders EM, Cook PR. 1998. Numbers and organization of RNA polymerases, nascent transcripts, and transcription units in HeLa nuclei. Mol Biol Cell 9: 1523–1536. [DOI] [PMC free article] [PubMed] [Google Scholar]
- Johnston IG, Gaal B, Neves RP, Enver T, Iborra FJ, Jones NS. 2012. Mitochondrial variability as a source of extrinsic cellular noise. PLoS Comput Biol 8: e1002416. [DOI] [PMC free article] [PubMed] [Google Scholar]
- Kalsotra A, Cooper TA. 2011. Functional consequences of developmentally regulated alternative splicing. Nat Rev Genet 12: 715–729. [DOI] [PMC free article] [PubMed] [Google Scholar]
- Kimura H, Sugaya K, Cook PR. 2002. The transcription cycle of RNA polymerase II in living cells. J Cell Biol 159: 777–782. [DOI] [PMC free article] [PubMed] [Google Scholar]
- Kornblihtt AR. 2007. Coupling transcription and alternative splicing. Adv Exp Med Biol 623: 175–189. [DOI] [PubMed] [Google Scholar]
- Kornblihtt AR, Schor IE, Alló M, Dujardin G, Petrillo E, Muñoz MJ. 2013. Alternative splicing: a pivotal step between eukaryotic transcription and translation. Nat Rev Mol Cell Biol 14: 153–165. [DOI] [PubMed] [Google Scholar]
- Lane N, Martin W. 2010. The energetics of genome complexity. Nature 467: 929–934. [DOI] [PubMed] [Google Scholar]
- Langmead B, Trapnell C, Pop M, Salzberg SL. 2009. Ultrafast and memory-efficient alignment of short DNA sequences to the human genome. Genome Biol 10: R25. [DOI] [PMC free article] [PubMed] [Google Scholar]
- Lee JM, Greenleaf AL. 1989. A protein kinase that phosphorylates the C-terminal repeat domain of the largest subunit of RNA polymerase II. Proc Natl Acad Sci 86: 3624–3628. [DOI] [PMC free article] [PubMed] [Google Scholar]
- Lempiainen H, Shore D. 2009. Growth control and ribosome biogenesis. Curr Opin Cell Biol 21: 855–863. [DOI] [PubMed] [Google Scholar]
- Lin S, Coutinho-Mansfield G, Wang D, Pandit S, Fu XD. 2008. The splicing factor SC35 has an active role in transcriptional elongation. Nat Struct Mol Biol 15: 819–826. [DOI] [PMC free article] [PubMed] [Google Scholar]
- Liu H, He L, Tang L. 2012. Alternative splicing regulation and cell lineage differentiation. Curr Stem Cell Res Ther 7: 400–406. [DOI] [PubMed] [Google Scholar]
- Luco RF, Allo M, Schor IE, Kornblihtt AR, Misteli T. 2011. Epigenetics in alternative pre-mRNA splicing. Cell 144: 16–26. [DOI] [PMC free article] [PubMed] [Google Scholar]
- Lynch KW. 2004. Consequences of regulated pre-mRNA splicing in the immune system. Nat Rev Immunol 4: 931–940. [DOI] [PubMed] [Google Scholar]
- Maheshri N, O'Shea EK. 2007. Living with noisy genes: how cells function reliably with inherent variability in gene expression. Annu Rev Biophys Biomol Struct 36: 413–434. [DOI] [PubMed] [Google Scholar]
- Medina I, Carbonell J, Pulido L, Madeira SC, Goetz S, Conesa A, Tárraga J, Pascual-Montano A, Nogales-Cadenas R, Santoyo J, et al. 2010. Babelomics: an integrative platform for the analysis of transcriptomics, proteomics and genomic data with advanced functional profiling. Nucleic Acids Res 38: W210–W213. [DOI] [PMC free article] [PubMed] [Google Scholar]
- Melamud E, Moult J. 2009. Stochastic noise in splicing machinery. Nucleic Acids Res 37: 4873–4886. [DOI] [PMC free article] [PubMed] [Google Scholar]
- Newman JR, Ghaemmaghami S, Ihmels J, Breslow DK, Noble M, DeRisi JL, Weissman JS. 2006. Single-cell proteomic analysis of S. cerevisiae reveals the architecture of biological noise. Nature 441: 840–846. [DOI] [PubMed] [Google Scholar]
- Nilsen TW, Graveley BR. 2010. Expansion of the eukaryotic proteome by alternative splicing. Nature 463: 457–463. [DOI] [PMC free article] [PubMed] [Google Scholar]
- Pan Q, Shai O, Lee LJ, Frey BJ, Blencowe BJ. 2008. Deep surveying of alternative splicing complexity in the human transcriptome by high-throughput sequencing. Nat Genet 40: 1413–1415. [DOI] [PubMed] [Google Scholar]
- Pickrell JK, Pai AA, Gilad Y, Pritchard JK. 2010. Noisy splicing drives mRNA isoform diversity in human cells. PLoS Genet 6: e1001236. [DOI] [PMC free article] [PubMed] [Google Scholar]
- Podlaha O, De S, Gonen M, Michor F. 2014. Histone modifications are associated with transcript isoform diversity in normal and cancer cells. PLoS Comput Biol 10: e1003611. [DOI] [PMC free article] [PubMed] [Google Scholar]
- Raj A, van Oudenaarden A. 2008. Nature, nurture, or chance: stochastic gene expression and its consequences. Cell 135: 216–226. [DOI] [PMC free article] [PubMed] [Google Scholar]
- Raj A, van Oudenaarden A. 2009. Single-molecule approaches to stochastic gene expression. Annu Rev Biophys 38: 255–270. [DOI] [PMC free article] [PubMed] [Google Scholar]
- Raser JM, O'Shea EK. 2004. Control of stochasticity in eukaryotic gene expression. Science 304: 1811–1814. [DOI] [PMC free article] [PubMed] [Google Scholar]
- Romero-Moya D, Bueno C, Montes R, Navarro-Montero O, Iborra FJ, López LC, Martin M, Menendez P. 2013. Cord blood-derived CD34+ hematopoietic cells with low mitochondrial mass are enriched in hematopoietic repopulating stem cell function. Haematologica 98: 1022–1029. [DOI] [PMC free article] [PubMed] [Google Scholar]
- Rosenfeld N, Young JW, Alon U, Swain PS, Elowitz MB. 2005. Gene regulation at the single-cell level. Science 307: 1962–1965. [DOI] [PubMed] [Google Scholar]
- Salminen A, Kaarniranta K, Hiltunen M, Kauppinen A. 2014. Krebs cycle dysfunction shapes epigenetic landscape of chromatin: novel insights into mitochondrial regulation of aging process. Cell Signal 26: 1598–1603. [DOI] [PubMed] [Google Scholar]
- Sanchez A, Golding I. 2013. Genetic determinants and cellular constraints in noisy gene expression. Science 342: 1188–1193. [DOI] [PMC free article] [PubMed] [Google Scholar]
- Schwanhäusser B, Busse D, Li N, Dittmar G, Schuchhardt J, Wolf J, Chen W, Selbach M. 2011. Global quantification of mammalian gene expression control. Nature 473: 337–342. [DOI] [PubMed] [Google Scholar]
- Shalek AK, Satija R, Adiconis X, Gertner RS, Gaublomme JT, Raychowdhury R, Schwartz S, Yosef N, Malboeuf C, Lu D, et al. 2013. Single-cell transcriptomics reveals bimodality in expression and splicing in immune cells. Nature 498: 236–240. [DOI] [PMC free article] [PubMed] [Google Scholar]
- Snijder B, Pelkmans L. 2011. Origins of regulated cell-to-cell variability. Nat Rev Mol Cell Biol 12: 119–125. [DOI] [PubMed] [Google Scholar]
- Spencer SL, Gaudet S, Albeck JG, Burke JM, Sorger PK. 2009. Non-genetic origins of cell-to-cell variability in TRAIL-induced apoptosis. Nature 459: 428–432. [DOI] [PMC free article] [PubMed] [Google Scholar]
- Sugaya K, Vigneron M, Cook PR. 2000. Mammalian cell lines expressing functional RNA polymerase II tagged with the green fluorescent protein. J Cell Sci 113: 2679–2683. [DOI] [PubMed] [Google Scholar]
- Taniguchi Y, Choi PJ, Li GW, Chen H, Babu M, Hearn J, Emili A, Xie XS. 2010. Quantifying E. coli proteome and transcriptome with single-molecule sensitivity in single cells. Science 329: 533–538. [DOI] [PMC free article] [PubMed] [Google Scholar]
- ten Dam GB, Zilch CF, Wallace D, Wieringa B, Beverley PC, Poels LG, Screaton GR. 2000. Regulation of alternative splicing of CD45 by antagonistic effects of SR protein splicing factors. J Immunol 164: 5287–5295. [DOI] [PubMed] [Google Scholar]
- Trapnell C, Pachter L, Salzberg SL. 2009. TopHat: discovering splice junctions with RNA-Seq. Bioinformatics 25: 1105–1111. [DOI] [PMC free article] [PubMed] [Google Scholar]
- Trapnell C, Williams BA, Pertea G, Mortazavi A, Kwan G, van Baren MJ, Salzberg SL, Wold BJ, Pachter L. 2010. Transcript assembly and quantification by RNA-Seq reveals unannotated transcripts and isoform switching during cell differentiation. Nat Biotechnol 28: 511–515. [DOI] [PMC free article] [PubMed] [Google Scholar]
- Traut TW. 1994. Physiological concentrations of purines and pyrimidines. Mol Cell Biochem 140: 1–22. [DOI] [PubMed] [Google Scholar]
- Tseng LM, Yin PH, Chi CW, Hsu CY, Wu CW, Lee LM, Wei YH, Lee HC. 2006. Mitochondrial DNA mutations and mitochondrial DNA depletion in breast cancer. Genes Chromosomes Cancer 45: 629–638. [DOI] [PubMed] [Google Scholar]
- van Riggelen J, Yetil A, Felsher DW. 2010. MYC as a regulator of ribosome biogenesis and protein synthesis. Nat Rev Cancer 10: 301–309. [DOI] [PubMed] [Google Scholar]
- Vander Heiden MG, Cantley LC, Thompson CB. 2009. Understanding the Warburg effect: the metabolic requirements of cell proliferation. Science 324: 1029–1033. [DOI] [PMC free article] [PubMed] [Google Scholar]
- Venables JP. 2006. Unbalanced alternative splicing and its significance in cancer. Bioessays 28: 378–386. [DOI] [PubMed] [Google Scholar]
- Vivarelli S, Lenzken SC, Ruepp MD, Ranzini F, Maffioletti A, Alvarez R, Mühlemann O, Barabino SM. 2013. Paraquat modulates alternative pre-mRNA splicing by modifying the intracellular distribution of SRPK2. PLoS One 8: e61980. [DOI] [PMC free article] [PubMed] [Google Scholar]
- Vogel C, Marcotte EM. 2012. Insights into the regulation of protein abundance from proteomic and transcriptomic analyses. Nat Rev Genet 13: 227–232. [DOI] [PMC free article] [PubMed] [Google Scholar]
- Volfson D, Marciniak J, Blake WJ, Ostroff N, Tsimring LS, Hasty J. 2006. Origins of extrinsic variability in eukaryotic gene expression. Nature 439: 861–864. [DOI] [PubMed] [Google Scholar]
- Wagner A. 2005. Energy constraints on the evolution of gene expression. Mol Biol Evol 22: 1365–1374. [DOI] [PubMed] [Google Scholar]
- Waks Z, Klein AM, Silver PA. 2011. Cell-to-cell variability of alternative RNA splicing. Mol Syst Biol 7: 506. [DOI] [PMC free article] [PubMed] [Google Scholar]
- Xu EY, Zawadzki KA, Broach JR. 2006. Single-cell observations reveal intermediate transcriptional silencing states. Mol Cell 23: 219–229. [DOI] [PubMed] [Google Scholar]
- Zopf CJ, Quinn K, Zeidman J, Maheshri N. 2013. Cell-cycle dependence of transcription dominates noise in gene expression. PLoS Comput Biol 9: e1003161. [DOI] [PMC free article] [PubMed] [Google Scholar]
Associated Data
This section collects any data citations, data availability statements, or supplementary materials included in this article.