

Abstract
Key steps in understanding a biological process include identifying genes that are involved and determining how they are regulated. We developed a novel method for identifying transcription factors (TFs) involved in a specific process and used it to map regulation of the key virulence factor of a deadly fungus—its capsule. The map, built from expression profiles of 41 TF mutants, includes 20 TFs not previously known to regulate virulence attributes. It also reveals a hierarchy comprising executive, midlevel, and “foreman” TFs. When grouped by temporal expression pattern, these TFs explain much of the transcriptional dynamics of capsule induction. Phenotypic analysis of TF deletion mutants revealed complex relationships among virulence factors and virulence in mice. These resources and analyses provide the first integrated, systems-level view of capsule regulation and biosynthesis. Our methods dramatically improve the efficiency with which transcriptional networks can be analyzed, making genomic approaches accessible to laboratories focused on specific physiological processes.
In this paper we present an efficient means of comprehensively mapping the network of transcription factors (TFs) that regulate a particular physiological process. Our approach cycles through deletion of TFs, expression profiling of TF mutants, model construction, and model-directed selection of TFs for the next round of deletion. This predictive genetics approach identifies TFs that affect the process of interest, providing a valuable complement to undirected mutagenesis and screening. Simultaneously, it builds a network model that explains how the TFs affect the process, yielding novel insights into the biological system under study.
Mapping the network that regulates a specific process requires knowing which TFs affect that process. One way to identify such TFs is to screen comprehensive mutant libraries, but generating such libraries is not always feasible. Furthermore, genome-scale screening assays must be fast and scalable; such assays may not exist for the process of interest or may be less sensitive than other, more laborious assays. An alternative approach is to map the targets of all TFs encoded in a genome by using methods such as chromatin-immunoprecipitation (ChIP) or large-scale TF deletion and expression analysis. However, undirected, genome-wide approaches are costly and inefficient for probing a specific biological process in detail. We report a model-guided approach that addresses all of these problems by focusing experimental effort on the TFs most likely to be involved in the process of interest. Furthermore, our approach generates a network that provides mechanistic explanations for the phenotypes of TF deletion mutants.
Our approach alternates network building by using an algorithm we call NetProphet with identifying relevant TFs by using an algorithm we call PhenoProphet. NetProphet is a validated method for mapping direct, functional regulation that significantly outperforms other network mapping methods (Haynes et al. 2013). It requires only gene expression profiles of strains in which TF expression has been perturbed (by gene deletion, mutation, over-expression, or RNAi) and wild-type controls, data that can be gathered in a reliable, scalable way by most molecular biology laboratories. It therefore offers significant advantages over alternatives such as ChIP-seq, which requires reoptimization for every TF studied (Landt et al. 2012) and follow-up experiments to determine which binding events lead to functional regulation. NetProphet works by combining differential expression (DE) analysis with coexpression analysis. In the DE analysis, genes that are strongly differentially expressed between a TF-deletion strain and a wild-type (WT) strain are considered potential targets of the TF. In the coexpression analysis, genes whose expression is strongly correlated with that of a TF (either positively or negatively) across the expression profiles are considered potential targets of the TF, enabling NetProphet to identify targets for TFs that have not been directly perturbed (see Haynes et al. 2013). PhenoProphet, described here for the first time, assigns each TF a score representing its confidence that deletion of that TF will yield some phenotypic change of interest. The score of each TF is based on the degree to which its NetProphet-predicted targets are enriched for genes associated with the phenotype of interest.
We demonstrate the power of combining NetProphet and PhenoProphet by mapping the network that regulates the major virulence factor of a pathogenic yeast, Cryptococcus neoformans. C. neoformans is a basidiomycetous yeast, with a 19-Mb genome encoding ∼7000 genes (Janbon et al. 2014), that diverged from ascomycetes like S. cerevisiae roughly 1 billion years ago (Hedges et al. 2004). It is also an opportunistic pathogen that is responsible for more than 600,000 deaths per year worldwide (Park et al. 2009). Multiple factors influence cryptococcal virulence (Srikanta et al. 2014), including the production of protective structures like melanin and its major virulence factor, a polysaccharide capsule. Capsule polysaccharides are both displayed on the cell surface and shed from the cell. The capsule grows large upon entry into a mammalian host, a process that can be recapitulated by a variety of host-like conditions in vitro (Zaragoza and Casadevall 2004).
Several TFs involved in capsule regulation have been identified and various signaling pathways are known to act upstream to influence capsule growth (O'Meara and Alspaugh 2012; Kwon-Chung et al. 2014). However, most of the downstream capsule biosynthetic machinery remains to be discovered, and current knowledge of capsule regulation is incomplete and fragmented. This offers an ideal opportunity to apply model-guided network mapping. In this paper, we present the first integrated, systems-level view of capsule regulation and biosynthesis, which in turn produces unexpected insights into cryptococcal virulence.
Results
Expression-based network mapping predicts TFs involved in capsule regulation
We have developed a novel, predictive approach to identifying TFs related to a physiological process of interest and mapping their regulatory targets. This approach consists of a cycle (Fig. 1) in which TF deletion strains are subjected to phenotyping and expression profiling, and network models are constructed from the expression profiles by using NetProphet. PhenoProphet is then used to predict additional TF genes which, when deleted, will influence the process of interest. These genes are then deleted, and the phenotypes and expression profiles of the resulting mutants are fed back into the cycle. The genome-wide network models resulting from this process can be analyzed in multiple ways, including modeling TF binding specificity and predicting TF function based on target gene sets.
Figure 1.
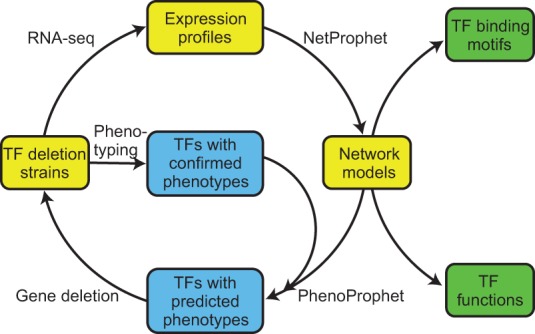
NetProphet–PhenoProphet workflow. (Yellow) Steps involved in network modeling; (blue) steps involved in network refinement to elucidate a specific process of interest; (green) products of genome-wide network analysis.
We selected deletion strains to make and profile in several stages. First, we deleted genes encoding 11 regulators previously reported to participate in capsule synthesis: eight DNA-binding TFs and three signaling proteins (Supplemental Table S1, “Literature”). In the second stage, we deleted 17 genes encoding putative DNA binding proteins based on the correlation of their expression levels with capsule size in various conditions (Supplemental Table S1, “Correlation”; Haynes et al. 2011). We grew these 28 deletion mutants and three others (Supplemental Table S1, “Other”) in capsule-inducing conditions and assayed them for capsule size. We developed custom software to facilitate precise measurement of capsule thicknesses, enabling statistical analysis of thickness distributions. We further subjected all the mutant strains to expression profiling by RNA-seq in biological triplicate after a shift to capsule-inducing conditions. We used the expression profiles of these strains and WT controls as input for NetProphet to map the capsule regulation network (Fig. 1).
To select the final group of genes to delete, we applied PhenoProphet to the NetProphet-generated network along with 68 genes that have been reported to play a role in capsule production (Supplemental Table S2, Tab A). These genes encode a variety of enzymes, transporters, signaling factors, and proteins of unknown function. When we rank-ordered all TFs by their PhenoProphet scores, we found that 14 of the 21 highest-scoring TFs had already been deleted; 12 of these 14 had altered capsule phenotypes. We deleted an additional 10 top-ranked TFs and assayed their gene expression profiles and capsule sizes. Eight of these 10 had altered capsule phenotypes (80%). For comparison, a traditional screen of mutants that included 64 regulator deletions identified only three required for normal capsule regulation (<5%) (Liu et al. 2008).
Ten of our deletion strains had increased capsule thickness and 17 had reduced capsule thickness (Fig. 2). Only 11 of the 27 had been previously reported to influence capsule thickness. (The phenotype of cells lacking MBS1, which we studied because of its PhenoProphet score, was reported while our analysis was in progress [Song et al. 2012].) Figure 3A shows the altered capsule thicknesses of 17 mutants lacking TF-encoding genes that we selected based only on expression data, analyzed by either capsule size correlation or PhenoProphet. Almost half of our new mutants were hypercapsular, a phenotype that has been relatively rarely reported (D'Souza et al. 2001; Bahn et al. 2005; Lee et al. 2009). Many of the mutants with altered capsule size also showed significantly increased capsule size variability. Interestingly, two mutants, ssn801 and clr2, showed a substantial increase in capsule size variability (2.9-fold, P < 10−78 and 1.6-fold, P < 10−18, respectively) with no change in mean capsule size.
Figure 2.
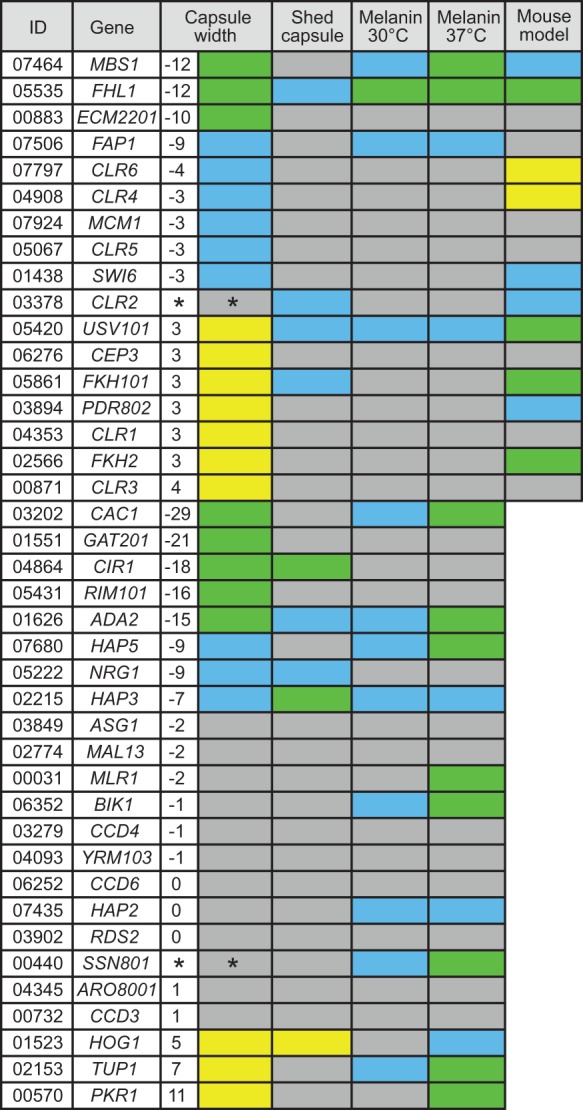
TF mutants have significant virulence-related phenotypes. For capsule, the difference in thickness from WT (in pixels) is tabulated and also color-coded: (green) a decrease of ≥10 pixels compared to wild type; (blue) a decrease of 3–9 pixels; (yellow) an increase of ≥3 pixels; (*) denotes strains with WT mean capsule thickness but significantly increased variance. For melanin formation, green indicates colonies that were white (no melanin) to beige, and blue indicates colonies that were brown but lighter than WT. For capsule shedding, green indicates that the 3-h culture supernatant concentration of GXM was ≥8-fold lower than WT; blue, two- to fourfold lower; and yellow, twofold higher. For short-term infectivity, fold-change in colony-forming units (CFU) in 1 wk was calculated (tested only for strains with newly discovered capsule phenotypes): (green) >10 times lower than WT; (blue) 2–10 times lower; (yellow) >2 times higher. In all columns gray indicates no significant change in phenotype.
Figure 3.
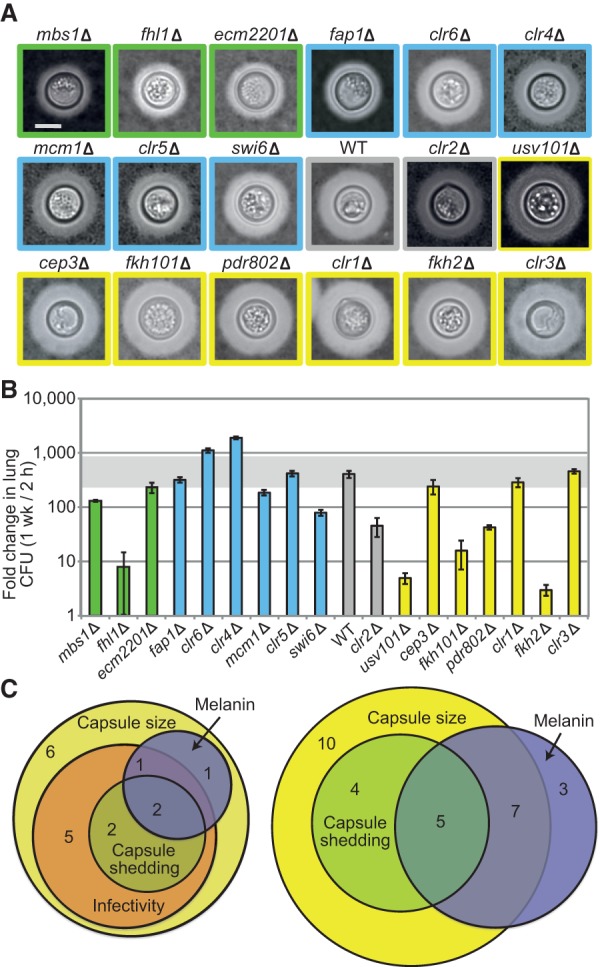
Virulence attributes of new regulatory mutants. (A) Representative cells of our new mutant strains, selected so all have similar cell wall diameter and each has capsule thickness very close to the average determined for that mutant. Images are all to the same scale and ordered by capsule size: (bar) 5 μm. Colors indicate capsule size groups as in Figure 2. (B) Mean ± SEM of infectivity results; horizontal gray bar denotes fold-increase values from 0.5 to twofold that of WT. All strains grew like WT on rich medium except for fhl1, which had a 2.5-fold higher doubling time. (C) Aberrant phenotypes of new mutants (left) and of all the mutants in Figure 2 (right). Melanin was scored for 37°C phenotype.
We also assessed other virulence-related phenotypes in our uniform collection of 41 mutants. In addition to displaying capsule polysaccharide on its surface, C. neoformans sheds this material into the environment, with adverse effects on the host immune response (Coelho et al. 2014). We used a cryptococcal antigen latex agglutination test to assess capsule shedding in our strain set. Interestingly, both hyper- and hypocapsular strains showed alterations in capsule shedding (Fig. 2). Many of our new mutants also had defects in melanin production, a virulence factor (Fig. 2; Supplemental Fig. S1; Eisenman and Casadevall 2012). Finally, we tested our new mutants for their ability to grow in the mouse lung; 11 showed a significant change in this characteristic (Fig. 3B).
About two-thirds of the new mutants with abnormal capsules also showed defects in at least one other virulence-related trait (Fig. 3C, left). Several showed defects in all traits measured, including usv101, a novel virulence regulator (Fig. 2). We also identified three novel factors, Hap2, Bik1, and Mlr1, that are not involved in regulating capsule, but do yield isolated melanin defects (Fig. 3C, right); Mlr1 further has no S. cerevisiae ortholog. Notably, all four TF mutants with reduced capsule shedding that we tested in mice had an infectivity defect. This suggests that capsule shedding is critical for infectivity, regardless of whether the surface capsule is reduced or enlarged.
PhenoProphet accurately predicts which TFs will have altered capsule thickness
A remarkably large fraction of the TFs identified by PhenoProphet were involved in capsule regulation (Supplemental Table S1). We compared this result to our previous strategy of using the correlation of gene expression with capsule thicknesses to predict TF capsule involvement by using our previously published correlation scores (Haynes et al. 2011). Of the 17 TFs we selected for deletion by the correlation method, eight had altered capsule thickness (47%); of the 10 we selected by PhenoProphet, eight had aberrant or hypervariable capsule thickness (80%). To further compare capsule-size correlation and PhenoProphet to one another and to other methods of phenotype prediction, we applied each method to a set of TFs for which the capsule phenotype of the corresponding deletion was known. These genes had primarily been deleted because they were suspected to have a role in capsule regulation (Supplemental Table S2, Tab B). To simulate prospective phenotype prediction, we used leave-one-out cross validation, in which each mutant phenotype is predicted without using any data derived from that mutant. As a simple, baseline prediction method, we considered the hypothesis that TF genes that display significant expression changes upon capsule induction are more likely to be required for normal capsule induction than those that do not. The data did not support this hypothesis (Fig. 4A, green). Next, we considered the possibility that genes whose expression is significantly correlated with capsule thickness would be more likely to encode TFs regulating capsule than genes whose expression is not correlated with capsule thickness. The data did not support this hypothesis, either (Fig. 4A, red).
Figure 4.
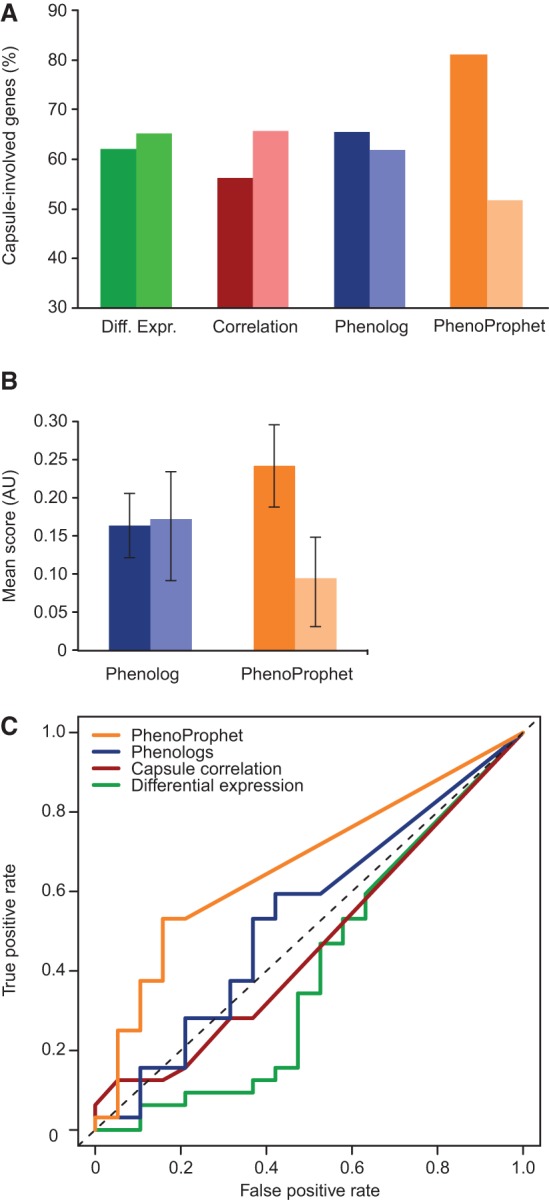
Methods comparison shows the power of PhenoProphet in predicting which TFs regulate a process of interest. (A) Four expression-based methods (x-axis) were used to predict whether cryptococcal regulators are involved with capsule formation (i.e., mutants show abnormal capsule; dark bars) or not (light bars). The set of genes in each category was then assessed for the fraction that actually does influence capsule (y-axis). (B) Mean and SEM of Phenolog and PhenoProphet scores for genes that are capsule involved (dark bars) or not (light bars). (C) Receiver operating characteristic analysis comparing the indicated methods for phenotype prediction to random expectation (dotted line).
We next tried a phenotype prediction method called Phenologs, which is based on the observation that genes sharing a phenotype in one organism often share phenotypes in another organism, even when the phenotypes themselves appear to be unrelated (McGary et al. 2010). However, TFs with positive Phenolog scores were not significantly enriched for those that affect capsule thickness (Fisher's exact P = 0.43) (Fig. 4A, blue), nor were the Phenolog scores of TFs that do affect capsule thickness greater, on average, than those of TFs that do not (Mann-Whitney U-test P = 0.33) (Fig. 4B, blue). Thus, Phenolog scores do not have discriminative value in this application. In contrast to all of these methods, TFs with positive PhenoProphet scores were significantly enriched for those that affect capsule thickness (Fisher's exact P < 0.03) (Fig. 4A, orange). Furthermore, the mean of PhenoProphet scores for TFs that affect capsule thickness was significantly greater than the mean score for TFs that do not affect capsule thickness (Mann-Whitney U-test P < 0.02) (Fig. 4B, orange). The predictive power of PhenoProphet relative to the other methods is confirmed by receiver operating characteristic analyses (Fig. 4C).
Next, we investigated the effect of the number of expression-profiled TF deletion strains on the accuracy of PhenoProphet. The results showed that the predictive accuracy of PhenoProphet exceeded chance (and the accuracy of Phenologs) even when the number of profiled TF-deletion strains given to NetProphet was reduced to 25% of the total (11 TFs deleted) (Supplemental Fig. S2A). Providing profiles of more TF-deletion strains increased accuracy, confirming that PhenoProphet depends on the NetProphet network for its accuracy. In applications in which no TF network is available and the number of TF-deletion strains that can be profiled is less than 10, another method (such as Phenolog analysis) may be most useful. We also investigated the effect of the number of known capsule-involved genes, with results similar to those described above for deletion-strain profiles (Supplemental Fig. S2B.)
NetProphet predicts functional, direct binding of TFs to their targets
We previously validated NetProphet in S. cerevisiae using data from ChIP-chip and protein-binding microarrays (Haynes et al. 2013). To validate NetProphet in C. neoformans, we focused on Gat201, the only cryptococcal TF for which ChIP data was available (Chun et al. 2011); Nrg1, a well-studied capsule regulator (Cramer et al. 2006); and Usv101, a capsule regulator described here for the first time. We epitope-tagged the last two and carried out ChIP-seq. We then tested the NetProphet-predicted targets of Usv101, Gat201, and Nrg1 for significant overlap with their ChIP-positive targets. NetProphet assigns a confidence score to each potential target of a TF, so we tested top-scoring target groups of various sizes, from 40 to 200. For all three TFs, the 40 most confident NetProphet predictions were highly enriched for ChIP-positive targets, as compared to the number that would be expected if 40 genes were chosen at random (Fig. 5A–C). For Usv101 and Gat201, enrichment remained strong for the 200 most confident targets.
Figure 5.

Validation of the NetProphet network. (A–C) ChIP enrichment of NetProphet predicted targets: (colored bars) cumulative fold-enrichment of the top NetProphet-predicted targets of each TF for ChIP-positive targets, relative to the fraction of ChIP-positive targets among all genes; (square symbols) significance of the enrichment (pval). The horizontal axis indicates the number of top-ranked NetProphet-predicted targets considered. (D–F) Binding motifs. For the indicated TFs, C. neoformans binding motifs derived from the promoters of NetProphet-predicted targets (top) or from the regions around ChIP-seq peaks (middle) are compared to S. cerevisiae binding motifs (bottom). (G) Network diagram showing the three validated TFs with targets supported by both NetProphet and ChIP analysis that are relevant to cryptococcal virulence: (round nodes) TFs; (square nodes) target genes or gene ontology biological process terms for which the targets of the indicated TF are enriched; (blue nodes) mutants are hypocapsular; (yellow nodes) mutants are hypercapsular; (gray nodes) mutants are defective in capsule-independent phagocytosis. Edges with arrowheads indicate activation, whereas those with T-heads indicate repression. ChIP evidence suggests that Usv101 binds to its own promoter, but expression evidence cannot determine whether this binding results in activation, repression, or no effect.
To further test our predictions, we compared models of TF binding specificity inferred from the NetProphet-predicted targets to specificity models derived from ChIP (Fig. 5D–F, top two logos). For both Usv101 and Gat201, the Cryptococcus motifs derived from NetProphet predictions and from ChIP data were highly similar, whereas for Nrg1, there were significant differences between the two. For comparison, we extracted a motif for the closest homolog of each TF in S. cerevisiae from the ScerTF database (Fig. 5D–F, bottom logo; Spivak and Stormo 2012). The motif of C. neoformans Usv101 (confirmed independently by NetProphet and ChIP) has diverged substantially from the motif of S. cerevisiae Usv1 on one side. No motif is available for Gat2, the ortholog of Gat201, but the motif of Ecm23, the next best homolog, shows the expected GATA family resemblance. The motif for S. cerevisiae Nrg1 supports the ChIP-derived Cryptococcus motif over the NetProphet-derived motif; this is likely because the NetProphet-predicted Nrg1 targets include some indirect targets regulated by TFs downstream from Nrg1 (see Supplemental Table S4, targets of Nrg1 and Mbs1).
We then attempted to infer binding specificity models (PWMs) for all other Cryptococcus TFs from their NetProphet-predicted target sets (Elemento and Tavazoie 2005). We tested these PWMs for significant conservation in the genome of a related species (JEC21, serotype D). We also tested each TF to determine whether there was a highly homologous TF in S. cerevisiae with highly similar binding specificity, as in Figure 5D,E. In total, 18 PWMs showed both types of conservation and were therefore deemed reliable models (Supplemental Fig. S3; Supplemental File 5). Previously, binding specificity was known for only 2 TFs in Cryptococcus (Chun et al. 2011; O'Meara et al. 2014), both of which strongly support our independently derived PWMs.
We also used the NetProphet-predicted target sets of 223 regulators encoded in the C. neoformans genome (including 188 DNA-binding TFs) to predict regulator functions. Supplemental Table S3 reports GO term enrichment for each regulator.
ChIP-experiments validate NetProphet predictions
We combined NetProphet and ChIP results from Usv101, Gat201, and Nrg1 to produce a high-confidence core for our model of the network regulating virulence in C. neoformans (Fig. 5G). This reveals a highly interconnected subnetwork in which Usv101 represses GAT201, consistent with their opposite capsule phenotypes (large versus small). Usv101 also represses several sugar transporters while activating HXT1, a hexose transporter that has a hypercapsular phenotype (Chikamori and Fukushima 2005). Usv101 represses, and Gat201 activates, BLP1, which is involved in a capsule-independent anti-phagocytic mechanism (Chun et al. 2011). The opposing effects of Usv101 and Gat201 on BLP1, which promotes fungal survival during infection, are consistent with their generally opposing roles in regulating virulence and their opposite capsule phenotypes. Usv101 represses BLP1 both directly and via its repression of GAT201, forming a coherent feed-forward loop.
Our data support a previous report (Chun et al. 2011) that Gat201 activates ECM2201, encoding a TF, and we report for the first time that the ecm2201 mutant is hypocapsular (Fig. 2). Gat201 has the same effect on capsule size as Nrg1 and works with Nrg1 to stimulate expression of GAT204, which encodes a second TF involved in the capsule-independent anti-phagocytic mechanism (Chun et al. 2011). Both Gat201 and Nrg1 repress some genes involved in cell wall synthesis, but Nrg1 also activates other genes involved in cell wall synthesis, consistent with cell wall remodeling during capsule induction. Nrg1, which is activated by cAMP signaling in Cryptococcus (Cramer et al. 2006), also activates PDE2, encoding a phosphodiesterase that reduces cAMP levels (Zaman et al. 2008), thus adding a slow, transcriptionally mediated negative feedback loop in cAMP signaling to the fast, post-translational negative feedback loops that have been reported (Hicks et al. 2005; Kronstad et al. 2011).
Nrg1 further activates UGD1, MAN1, and UXS1, which encode glycoactive proteins (Fig. 5G), as well as CLC-A and CPL1, which encode proteins involved in maintaining ion balance (Zhu and Williamson 2003; unpubl.). Deletion of any of these five genes results in a hypocapsular phenotype. Thus the hypocapsular phenotype of the nrg1 mutant may be caused by its failure to activate expression of these five genes. Broadly speaking, the TFs in Figure 5 have the same phenotypes as the targets they activate. Furthermore, TFs whose absence affects capsule thickness in opposite directions (Usv101 versus Gat201 and Nrg1) regulate their common targets in opposite directions, whereas TFs whose absence affects capsule in the same direction (Gat201 and Nrg1) also regulate their common targets in the same direction.
NetProphet illuminates transcriptional dynamics
To gain insight into the transcriptional dynamics of cryptococcal capsule induction, we performed RNA-seq on WT cells immediately before transfer from rich media into capsule-inducing conditions and at 1.5, 3, 8, and 24 h after transfer. Considering all genes across the time course (Fig. 6A), one pattern that emerged was repression of genes involved in ribosome biogenesis, tRNA synthesis and processing, amino acid biosynthesis, and protein transport, along with induction of genes involved in specific amino acid degradation and protein degradation; this is consistent with the cells accommodating to scarcer nutrients and slower growth. Expression of some nuclear genes encoding cytochrome-C oxidase (COX) components declined, whereas expression of mitochondrial genes encoding COX components increased. Expression of all 13 mitochondrial genes increased significantly (mean fold-change 57, median 20).
Figure 6.

The dynamics of gene regulation over 24 h of capsule induction. (A) Heat map of genome-wide expression profiling: (blue) low expression; (yellow) high expression. Examples of functional annotations of genes in each cluster are indicated. (B) Regulatory relations among groups of capsule-involved genes clustered by temporal expression pattern: (circles) groups of regulators clustered by their temporal expression patterns (insets); text denotes representative functions of their activated (green) or repressed (red) targets; (boxes) capsule-involved target genes clustered by their temporal expression patterns (insets); text provides examples of target gene functions; (green arrows) activation of designated targets; (red T-heads) repression of designated targets. Regulator Group 1 is Clr1, Hap5, Nrg1, Pkr1, and Ssn801; Regulator Group 2 is Cac1, Cep3, Cir1, Clr2, Fap1, Fhl1, Fkh2, Gat1, Mcm1, Pdr802, Sp1, Swi6, and Usv101; Regulator Group 3 is Clr6, Hog1, Mbs1, Ste12alpha, and Tup1; Regulator Group 4 is Ada2, Clr3, Clr4, Clr5, Ecm2201, Fkh101, Gat201, Hap3, and Rim101. (NSS) Nucleotide sugar synthesis; (NST) nucleotide sugar transport; (ROS) reactive oxygen species.
To map the transcriptional dynamics onto our network, we divided TFs whose deletions alter capsule thickness into four groups based on their temporal expression patterns (Fig. 6B, circles). The most “upstream” acting TFs in the network form a group with slightly increased expression at 90 min followed by sharply decreased expression over the next 24 h (Fig. 6B, Regulator Group 1). This group includes activators of ribosome biogenesis genes and repressors of mitochondrially encoded respiration genes. It also contains repressors of a cluster of capsule-involved genes whose expression increases steadily through capsule induction (Fig. 6B, Box a). This target group includes genes encoding proteins involved in nucleotide sugar synthesis and transport, polysaccharide synthesis, and maintenance of inorganic ion and osmotic balances. Group 1 includes activators of a set of capsule-involved genes that decreases steadily after the first few hours of capsule induction (Fig. 6B, Box b). These declining genes include four that encode proteins that promote cAMP/PKA signaling, reinforcing the transcriptionally mediated negative feedback on cAMP/PKA signaling noted above.
Group 2 is the opposite sign partner of Group 1 and cooperates with it in nearly every way: Its expression pattern is opposite that of Group 1, and it regulates mitochondrially encoded respiration genes as well as each cluster of capsule-involved non-TFs in the opposite way from Group 1. Since Group 2 is repressed by Group 1, the indirect effects of Group 1 via Group 2 are consistent with the direct effects of Group 1.
As with Group 2, the expression of regulators in Group 3 decreases from time 0 to 90 min, then reverses course and increases from 90 min to 24 h. The difference is that Group 2 regulators rapidly recover to well beyond their initial levels, whereas Group 3 regulators never recover their initial levels. This difference may result from the tendency of Group 2 regulators to activate each other, forming positive feedback loops. Group 3 regulators activate genes involved in the response to reactive oxygen species (ROS) while repressing certain carbohydrate and amino acid transporters. Group 3 regulates a set of capsule-involved genes that has an L-shaped expression pattern (Fig. 6B, Box c) and includes genes involved in amino acid biosynthesis and other growth-related processes.
Group 4 regulators are regulated by all of the other groups, but they do not regulate other groups, putting them at the bottom of the hierarchy. Their expression increases steadily through induction and they include activators of genes involved in metal ion transport and synthesis of chitin, a component of the cell wall.
Taken together, these analyses show a hierarchy of TFs (circles), with those expressed in an “inverted check-mark” (Group 1) at the top, those that first decrease and then increase in the middle, and those that increase steadily at the bottom. Capsule-involved, non-TF genes (boxes) are expressed in temporal patterns that are generally consistent with those of their regulators—the same pattern for activators and the opposite for repressors. These observations suggest that the temporal patterns of downstream genes can in many cases be explained by the patterns of their regulators shown in Figure 6B. For example, Group 1 and Group 2 regulators that are connected by an edge in the underlying network show an average temporal correlation of −0.84. For Group 1 and Group 3, the average correlation is −0.16, and for Group 2 and Group 4 it is +0.60.
The fact that we do not see any delay between the changes in upstream regulators and those in downstream targets is consistent with the expectation that the translation of TF-encoding mRNAs and the initial response by target genes should occur on a faster time scale (<0.5 h) than the interval between samples in our time course (1.5–16.0 h).
The hierarchical relationships among these four regulator groups were confirmed by comparing the number of factors regulating each regulator to the number of its targets (Supplemental Fig. S4). This analysis shows that the regulators in Group 1 have more targets than regulators, those in Groups 2 and 3 have about the same number of targets and regulators, and those in Group 4 have more targets than regulators.
Network analysis reveals mechanisms of capsule biosynthesis regulation
Although little is known about the glycosyltransferase reactions that generate capsule polysaccharides, the upstream pathways that form precursors for this process are well defined. Nucleotide sugar donors of mannose, galactose, glucuronic acid, and xylose are synthesized in the cytosol and transported into the Golgi for use in capsule synthesis (Fig. 7A). We analyzed our network to gain insight into the regulation of these key metabolic processes. PSA101 is the most heavily regulated of the genes we analyzed, suggesting that it is a key point at which transcriptional regulation affects biosynthesis. Of the two genes encoding GDP-mannose transporters, GMT1, which has a much greater effect on capsule size (Wang et al. 2014), is regulated by the major capsule regulators Cir1 (Jung et al. 2006), Rim101 (O'Meara et al. 2014), and Ada2 (Haynes et al. 2011). GMT2, whose deletion shows a phenotype only when GMT1 is also inactivated (Wang et al. 2014), is repressed by Usv101 and activated by Rds2, a TF without a significant capsule thickness phenotype. The degree of regulation by capsule-involved TFs thus highlights the transporter that is more heavily involved in capsule synthesis.
Figure 7.

Regulation of upstream capsule biosynthetic pathways. (A) Network-derived regulatory relationships between TFs and the pathways that make and localize sugar donors for capsule synthesis, considering the top 10,000 NetProphet edges: (large labeled arrows) synthetic steps; (ovals) TFs; (cylinders) nucleotide sugar transporters in the Golgi membrane. Shapes are labeled with the corresponding gene name and filled blue if the mutants are hypocapsular, yellow if the mutants are hypercapsular, and white if the gene has not been deleted (PMM1) or the mutants have normal capsule thickness (all others). Arrowheads indicate activation and T-heads repression; edge colors reflect the phenotype of the regulator. ASG1 + 2 represents three genes that are normocapsular when deleted: ASG1, CCD6, and MAL13; HAP3,5 represents HAP3 and HAP5, both hypocapsular when deleted. (Man) mannose; (Xyl) xylose; (GlcA) glucuronic acid; (Glc) glucose; (Man1) phosphomannose isomerase; (Pmm1) phosphomannomutase; (Psa1) GDP-mannose pyrophosphorylase; (Uxs1) UDP-Xyl synthase (Bar-Peled et al. 2001); (Ugd1) UDP-Glc dehydrogenase (Bar-Peled et al. 2004; Moyrand and Janbon 2004); (Uge1) UDP-Glc epimerase. Gmt1 and Gmt2 are GDP-Man transporters (Cottrell et al. 2007; Wang et al. 2014), and Ugt1 is a UDP-Gal transporter (Moyrand et al. 2007); transporters for the other precursors have not been identified. (B) Network-derived regulatory relationships between the TFs shown in A, using the same colors and symbols except that TFs are circles. For clarity, only the top 10,000 NetProphet edges were used.
The TFs that regulate the largest number of genes involved in upstream capsule biosynthetic processes are Nrg1, whose mutant is severely hypocapsular, closely followed by Usv101, whose hypercapsular deletion phenotype is reported here for the first time, Cir1, Rim101, and Ada2. Regulation of capsule biosynthetic enzymes and transporters is sufficient to explain the phenotypes of mutants lacking Cir1, Nrg1, Usv1, and Ada2: Usv101 (hypercapsular) primarily represses these pathways, whereas the others (hypocapsular) primarily activate them. The hypocapsular phenotype of rim101 is less well explained, as Rim101 appears to repress UXS1 and GMT1 while activating PMM1 and PSA1. Likewise, the phenotypes of mbs1 and fkh2 are not explained by the relationships we have identified, suggesting that some of their other targets may have as-yet-unknown roles in capsule synthesis.
The TFs that regulate the metabolic pathways shown in Figure 7A also regulate one another in what is largely a feed-forward hierarchy (Fig. 7B). Cir1, Nrg1, and Usv101 sit at the top of the hierarchy, each regulating multiple other TFs. The other regulator at the top of the pathway is Ccd3, which interestingly does not have a capsule size phenotype despite activating four TFs with hypocapsular phenotypes. Clr2, Mbs1, Fkh2, Hap5, and Bik1 form an intermediate layer; and Hap3, Rds2, Rim101, and Ada2 appear at the bottom of the cascade, because they regulate enzymes and transporters directly but do not regulate other TFs in this context. Of the seven TFs that regulate only one or two biosynthetic genes in Figure 7A and do not regulate other TFs in Figure 7B, only one is required for normal capsule thickness. In contrast, all five of the TFs that regulate three or more genes in Figure 7A are required.
Discussion
NetProphet and PhenoProphet enable individual laboratories lacking the resources of a genome center to systematically and efficiently study the transcriptional regulation of a specific physiological process. Currently, the TFs that regulate a process of interest are typically discovered by large-scale mutant screens, and TF-target relations are mapped in big-science projects that do not focus on TFs with specific biological functions (Harbison et al. 2004; Hu et al. 2007; Kemmeren et al. 2014). Our approach brings TF discovery and mapping together through focused, iterative network construction and analysis. We demonstrated this approach by mapping the network that regulates the major virulence factor of Cryptococcus neoformans, a deadly human pathogen. Key to the success of this effort was PhenoProphet's accuracy in identifying TFs that are required for normal capsule growth. This enrichment for TFs involved in capsule regulation enabled us to perform quantitative capsule-size assays that are more sensitive, but also more labor-intensive, than those used in traditional screens. Our approach enables TF networks to be mapped using only gene perturbation and expression profiling, both of which are straightforward in most experimental systems. Indeed, the number of TF-perturbation expression profiles for mammalian systems is growing rapidly, facilitating the application of our approach to mammals. No single approach has perfect sensitivity and specificity, so large-scale mutant screens and ChIP-seq remain important complementary methods. Nonetheless, we have filled a significant methodological gap between single-gene approaches and undirected genomic approaches.
Using the NetProphet–PhenoProphet approach, we produced a comprehensive map of the TF network that regulates cryptococcal capsule size, increased the number of TFs known to regulate capsule from 11 to 28, and increased the number of C. neoformans TFs with known sequence specificity from two to 18. In the course of this work, we generated a rich resource for systems biology of fungal virulence. We increased the number of publically available RNA-seq profiles from C. neoformans TF-deletion studies 20-fold, more than doubled the total number of Cryptococcus expression profiles (including microarrays), presented the first time course of expression during capsule induction, and generated virulence-related phenotypes for 41 regulator deletion mutants under identical conditions, including all known TF mutants that affect capsule size. Taken together, our data sets form the most comprehensive resource for regulatory systems biology available for any fungal pathogen. We expect that this data set, like large-scale data sets for S. cerevisiae (Harbison et al. 2004; Hu et al. 2007), will catalyze the development of powerful new network analysis and phenotype prediction algorithms.
Our kinetic evaluation of gene expression during capsule induction (Fig. 6) allowed us to cluster major regulators based on their temporal expression patterns. We found that the TFs comprising Group 1 decrease in expression during capsule induction, releasing repression of Group 2 TFs, which correspondingly increase in expression. Groups 1 and 2 have strikingly similar net effects through opposite expression patterns and opposite effects on target expression, forming coherent feed forward loops. Our dynamic analysis also revealed how regulators interact to influence general cellular processes as well as capsule synthetic pathways. For example, the Group 1 and 2 regulators cooperate to induce mitochondrially encoded respiration genes, resulting in massive up-regulation of these genes (mean, 57-fold; median, 20-fold). This is interesting because host conditions are hypoxic (Erecinska and Silver 2001), and the virulence of Cryptococcus gatii, which can cause fatal infections in immunocompetent individuals, is closely associated with up-regulation of mitochondrial gene expression (Ma et al. 2009). We also integrated our broad analysis of transcriptional dynamics with our focused analysis of nucleotide sugar regulation. Both analyses highlight hierarchies of transcription factors that are largely consistent with one another. They agree that Nrg1 is at the top, as it regulates many capsule-involved TFs but is not itself transcriptionally regulated. They further agree that Hap3, Rim101, and Ada2 are at the bottom, regulated by many TFs and regulating relatively few, and Usv101, Mbs1, and Fkh2 play both roles, integrating signals from master regulators and distributing them to lower level regulators.
Much of the downstream machinery required for capsule polysaccharide synthesis has not yet been identified. We expect that the NetProphet network, in addition to efficiently identifying novel capsule regulators, will address this gap. For example, we noticed that CNAG_03320 (the more diverged of two cryptococcal homologs of the S. cerevisiae GDP-mannose pyrophosphorylase Psa1) was regulated by large numbers of capsule-involved TFs, suggesting that it might have a role in synthesizing capsule precursors. When we tested this idea by deleting the gene, now named PSA101, the mutants were indeed severely hypocapsular. Another way in which the network can highlight relevant biosynthetic machinery is illustrated by Ecm2201, a TF that is required for normal capsule growth but does not regulate any other genes known to be required for normal capsule. We anticipate that the targets of Ecm2201 and other TFs with unexplained phenotypes include missing elements of capsule biosynthetic pathways. Filling in these gaps in knowledge about synthesis of a major virulence factor that has no parallel in human cells may help identify targets for future antifungal therapy.
In addition to capsule size, we assayed our matched set of mutants for other virulence-related phenotypes, including capsule shedding, melanization, and infectivity in a short-term mouse model. This revealed some surprising relationships among phenotypes. Many of our novel TF mutants that affected capsule thickness also affected infectivity, with both hypercapsular and hypocapsular mutants showing reduced infectivity. Hypercapsular mutants were particularly impaired in this regard. This is consistent with a recent report that virulence in C. neoformans is positively correlated with rate of uptake by macrophages, which is negatively correlated with capsule size (Sabiiti et al. 2014). Reduced capsule shedding was a strong and significant predictor of reduced infectivity (P < 0.03). Thickness and shedding were not clearly related, suggesting that these processes are independently regulated and that enlarged capsules might result from increased production in some cases and reduced shedding in others. We also observed that deletion of TFs frequently increases capsule size variability, showing that variability is controlled by TFs, probably through negative feedback loops.
In this paper, we report a significant advance in the efficiency with which TFs that regulate a specific biological process can be identified and their regulatory networks mapped. We used that technical advance to gain significant insights into fungal virulence regulation. In the process, we produced a valuable resource for regulatory systems biology of fungal pathogens, comprising high quality gene expression and phenotype data produced by a single laboratory using a consistent strain background. We expect that our methodological advances will have a broad impact in systems biology and that our discoveries and data resources will transform our understanding of fungal virulence.
Methods
Materials, strains, and cell growth
Cell culture media (i.e., Dulbecco's Modified Eagle's Medium, D6429), chemicals (i.e., L-DOPA for melanization, D9628), and PCR primers were from Sigma-Aldrich; PCR purification (28106) and gel extraction (28706) kits from Qiagen; and reagents used for RNA-seq, such as the SuperScript III Kit (18080) and the mRNA Catcher Plus Kit (K1570), from Life Technologies. Strains were made in C. neoformans KN99α (Nielsen et al. 2005) with standard growth at 30°C in yeast peptone dextrose (YPD) medium. For capsule induction, an overnight culture in YPD was washed, resuspended in DMEM, and grown at 37°C in 5% CO2.
Gene manipulation and naming
A split-marker strategy (Fu et al. 2006) was used to replace specific genomic targets with drug resistance cassettes as in Haynes et al. (2011) and to incorporate HA tags; see Supplemental Methods for details and our gene naming protocol. New gene names were CLR, capsule-linked regulator; MLR, melanin-linked regulator; and CCD, capsule-correlated DNA-binding protein.
Phenotyping
Growth in vitro was assessed by cell counts, melanization by colony color on L-DOPA agar, and shed capsule polysaccharide by the Cryptococcal Antigen Latex Agglutination System (CALAS, Meridian Bioscience). To assess capsule thickness, duplicate cultures of cells grown for 24 h in inducing conditions were washed and mixed 3:1 (v/v) with India ink for imaging. The cell wall and capsule edge of each cell were manually annotated (≥10 images per culture) using custom software, and the capsule thickness (outer capsule edge diameter minus cell wall diameter) of mutants relative to WT cells grown in parallel was calculated. Only significant differences (P < 10−7) of more than 2.5 pixels were reported as altered capsule thickness. Additional details are provided in Supplemental Methods section “Phenotyping.”
RNA isolation, RNA-seq, and ChIP-seq
RNA was isolated by standard methods from ≥3 biological replicates for each strain grown for 90 min in capsule-inducing conditions. Libraries for RNA-seq were prepared as in Haynes et al. (2011), barcoded, and pooled in equimolar ratios for multiplex sequencing. ChIP studies were performed as in Haynes et al. (2011), using WT and HA-tagged strains and comparing samples subjected to immunoprecipitation (IP) to input material and mock precipitated samples. Additional details are provided in Supplemental Methods sections “RNA Isolation,” “RNA-seq,” and “ChIP-seq.”
Animal studies
All animal studies were reviewed and approved by the Animal Studies Committee of Washington University School of Medicine and conducted according to NIH guidelines. Groups of six 6-wk-old female C57BL/6 mice were inoculated intranasally with 1.25 × 10⁴ cryptococci, and lung CFU were determined at 2 h and 7 d post-infection; details are in the Supplemental Material.
Comparison of phenotype prediction methods
The accuracy of each method was assessed by comparing its predictions to the phenotypes of 50 single-regulator deletion strains that have been analyzed for capsule thickness either by us or in published works (Supplemental Table S2, Tab B). Most of these genes were deleted because they were thought likely to have capsule phenotypes—they are not a random sample of all cryptococcal TFs, and 32 of them had altered capsule thickness. Differential expression was assessed using standard methods. Capsule size correlation was assessed as in Haynes et al. (2011). Phenologs were assessed as in McGary et al. (2010). The PhenoProphet score of a TF for capsule thickness is −log P-value from the hypergeometric test for enrichment of its NetProphet-predicted targets for genes that are known to have capsule thickness phenotypes. Specifically, the PhenoProphet score is the maximum −log P-value over all networks consisting of the top n NetProphet predictions, with n ranging from 500 to 40,000 in increments of 500. To compute the NetProphet and PhenoProphet scores of a TF, we did not use any information about the phenotype or expression profile of the corresponding deletion mutant. Additional details are provided in Supplemental Methods section “Comparison of phenotype prediction methods.”
Network validation
For Gat201 (CNAG_01551), we used published ChIP data (Chun et al. 2011). For Nrg1 (CNAG_05222) and Usv101 (CNAG_05420), we carried out ChIP-seq as above. For each TF, a ChIP-based sequence-specific binding motif was inferred using BioProspector (Liu et al. 2001). Promoter regions were defined as the 1000 bp upstream of the start codon. A NetProphet-based binding motif was also inferred by inputting NetProphet's target confidence scores for each TF to FIRE (Elemento et al. 2007). The motifs of orthologous TFs from S. cerevisiae were obtained from ScerTF (Spivak and Stormo 2012). If the motif for the best S. cerevisiae match was unknown, the next best match was used. A network of interactions that were supported by both ChIP and NetProphet was constructed using the top 10,000 NetProphet predictions. Additional details are provided in Supplemental Methods section “Network validation.”
Transcriptional dynamics of capsule induction
Triplicate cultures of WT cells were sampled for RNA-seq at 0, 1.5, 3, 8, and 24 h after a shift to capsule-inducing conditions. For each gene, a temporal expression signature was constructed from its median expression level at each time point. For each pair of genes, the correlation between their temporal signatures was converted to a dissimilarity (see Supplemental Material). Gene clusters were formed by applying hierarchical agglomerative clustering and cutting the resulting dendrogram at the 10-branch level. For each cluster, GO and KEGG functional enrichment analysis were performed, overrepresented terms were examined in detail, and relevant terms were selected. The heatmap was created by scaling the expression of each gene to span the range from 0 to 1.
Temporal expression signatures for capsule-involved regulators and capsule-involved nonregulators were clustered separately into four groups each (Fig. 6, circles and boxes, respectively). One of the groups of nonregulators is not shown, as we had no comment on it. A combined signature was generated for each cluster by taking the median expression level of all genes in the cluster at each time point. If the number of NetProphet-predicted activating (repressing) edges from one regulator group to another was enriched 1.5-fold relative to an even distribution of the activating (repressing) edges among regulator groups, then the corresponding activating (repressing) edge was shown in Figure 6B. The analogous calculations were made for edges from regulator groups to nonregulator groups.
Data access
All generated RNA-seq and ChIP-seq data have been submitted to the NCBI Gene Expression Omnibus (GEO; http://www.ncbi.nlm.nih.gov/geo/) under accession number GSE60398. A software package that implements PhenoProphet is available as Supplemental File 6.
Supplementary Material
Acknowledgments
We thank Matt Williams for help with mouse studies. This work was supported by NIH grant AI087794 to T.L.D. and M.R.B. B.C.H. and Z.A.W. were supported in part by NIH T32 grant HG000045 and an Alexander and Gertrude Berg fellowship, respectively.
Author contributions: E.J.M. carried out all computational analyses. B.C.H. conceived of and implemented NetProphet and PhenoProphet. S.R.G., Z.A.W., M.L.S., and A.L.M. participated in data generation. M.R.B. and T.L.D. conceived of and directed this project together. M.R.B. took primary responsibility for computational methods and related analysis, and T.L.D. took primary responsibility for C. neoformans experimentation and related analysis.
Footnotes
[Supplemental material is available for this article.]
Article published online before print. Article, supplemental material, and publication date are at http://www.genome.org/cgi/doi/10.1101/gr.184101.114.
References
- Bahn YS, Kojima K, Cox GM, Heitman J. 2005. Specialization of the HOG pathway and its impact on differentiation and virulence of Cryptococcus neoformans. Mol Biol Cell 16: 2285–2300. [DOI] [PMC free article] [PubMed] [Google Scholar]
- Bar-Peled M, Griffith CL, Doering TL. 2001. Functional cloning and characterization of a UDP-glucuronic acid decarboxylase: the pathogenic fungus Cryptococcus neoformans elucidates UDP-xylose synthesis. Proc Natl Acad Sci 98: 12003–12008. [DOI] [PMC free article] [PubMed] [Google Scholar]
- Bar-Peled M, Griffith CL, Ory JJ, Doering TL. 2004. Biosynthesis of UDP-GlcA, a key metabolite for capsular polysaccharide synthesis in the pathogenic fungus Cryptococcus neoformans. Biochem J 381: 131–136. [DOI] [PMC free article] [PubMed] [Google Scholar]
- Chikamori M, Fukushima K. 2005. A new hexose transporter from Cryptococcus neoformans: molecular cloning and structural and functional characterization. Fungal Genet Biol 42: 646–655. [DOI] [PubMed] [Google Scholar]
- Chun CD, Brown JC, Madhani HD. 2011. A major role for capsule-independent phagocytosis-inhibitory mechanisms in mammalian infection by Cryptococcus neoformans. Cell Host Microbe 9: 243–251. [DOI] [PMC free article] [PubMed] [Google Scholar]
- Coelho C, Bocca AL, Casadevall A. 2014. The tools for virulence of Cryptococcus neoformans. Adv Appl Microbiol 87: 1–41. [DOI] [PubMed] [Google Scholar]
- Cottrell TR, Griffith CL, Liu H, Nenninger AA, Doering TL. 2007. The pathogenic fungus Cryptococcus neoformans expresses two functional GDP-mannose transporters with distinct expression patterns and roles in capsule synthesis. Eukaryot Cell 6: 776–785. [DOI] [PMC free article] [PubMed] [Google Scholar]
- Cramer KL, Gerrald QD, Nichols CB, Price MS, Alspaugh JA. 2006. Transcription factor Nrg1 mediates capsule formation, stress response, and pathogenesis in Cryptococcus neoformans. Eukaryot Cell 5: 1147–1156. [DOI] [PMC free article] [PubMed] [Google Scholar]
- D'Souza CA, Alspaugh JA, Yue C, Harashima T, Cox GM, Perfect JR, Heitman J. 2001. Cyclic AMP-dependent protein kinase controls virulence of the fungal pathogen Cryptococcus neoformans. Mol Cell Biol 21: 3179–3191. [DOI] [PMC free article] [PubMed] [Google Scholar]
- Eisenman HC, Casadevall A. 2012. Synthesis and assembly of fungal melanin. Appl Microbiol Biotechnol 93: 931–940. [DOI] [PMC free article] [PubMed] [Google Scholar]
- Elemento O, Tavazoie S. 2005. Fast and systematic genome-wide discovery of conserved regulatory elements using a non-alignment based approach. Genome Biol 6: R18. [DOI] [PMC free article] [PubMed] [Google Scholar]
- Erecinska M, Silver IA. 2001. Tissue oxygen tension and brain sensitivity to hypoxia. Respir Physiol 128: 263–276. [DOI] [PubMed] [Google Scholar]
- Fu J, Hettler E, Wickes BL. 2006. Split marker transformation increases homologous integration frequency in Cryptococcus neoformans. Fungal Genet Biol 43: 200–212. [DOI] [PubMed] [Google Scholar]
- Harbison CT, Gordon DB, Lee TI, Rinaldi NJ, Macisaac KD, Danford TW, Hannett NM, Tagne JB, Reynolds DB, Yoo J, et al. 2004. Transcriptional regulatory code of a eukaryotic genome. Nature 431: 99–104. [DOI] [PMC free article] [PubMed] [Google Scholar]
- Haynes BC, Skowyra ML, Spencer SJ, Gish SR, Williams M, Held EP, Brent MR, Doering TL. 2011. Toward an integrated model of capsule regulation in Cryptococcus neoformans. PLoS Pathog 7: e1002411. [DOI] [PMC free article] [PubMed] [Google Scholar]
- Haynes BC, Maier EJ, Kramer MH, Wang PI, Brown H, Brent MR. 2013. Mapping functional transcription factor networks from gene expression data. Genome Res 23: 1319–1328. [DOI] [PMC free article] [PubMed] [Google Scholar]
- Hedges SB, Blair JE, Venturi ML, Shoe JL. 2004. A molecular timescale of eukaryote evolution and the rise of complex multicellular life. BMC Evol Biol 4: 2. [DOI] [PMC free article] [PubMed] [Google Scholar]
- Hicks JK, Bahn YS, Heitman J. 2005. Pde1 phosphodiesterase modulates cyclic AMP levels through a protein kinase A-mediated negative feedback loop in Cryptococcus neoformans. Eukaryot Cell 4: 1971–1981. [DOI] [PMC free article] [PubMed] [Google Scholar]
- Hu Z, Killion PJ, Iyer VR. 2007. Genetic reconstruction of a functional transcriptional regulatory network. Nat Genet 39: 683–687. [DOI] [PubMed] [Google Scholar]
- Janbon G, Ormerod KL, Paulet D, Byrnes EJ III, Yadav V, Chatterjee G, Mullapudi N, Hon CC, Billmyre RB, Brunel F, et al. 2014. Analysis of the genome and transcriptome of Cryptococcus neoformans var. grubii reveals complex RNA expression and microevolution leading to virulence attenuation. PLoS Genet 10: e1004261. [DOI] [PMC free article] [PubMed] [Google Scholar]
- Jung WH, Sham A, White R, Kronstad JW. 2006. Iron regulation of the major virulence factors in the AIDS-associated pathogen Cryptococcus neoformans. PLoS Biol 4: e410. [DOI] [PMC free article] [PubMed] [Google Scholar]
- Kemmeren P, Sameith K, van de Pasch LA, Benschop JJ, Lenstra TL, Margaritis T, O'Duibhir E, Apweiler E, van Wageningen S, Ko CW, et al. 2014. Large-scale genetic perturbations reveal regulatory networks and an abundance of gene-specific repressors. Cell 157: 740–752. [DOI] [PubMed] [Google Scholar]
- Kronstad JW, Hu G, Choi J. 2011. The cAMP/protein kinase a pathway and virulence in Cryptococcus neoformans. Mycobiology 39: 143–150. [DOI] [PMC free article] [PubMed] [Google Scholar]
- Kwon-Chung KJ, Fraser JA, Doering TL, Wang Z, Janbon G, Idnurm A, Bahn YS. 2014. Cryptococcus neoformans and Cryptococcus gattii, the etiologic agents of cryptococcosis. Cold Spring Harb Perspect Med 4: a019760. [DOI] [PMC free article] [PubMed] [Google Scholar]
- Landt SG, Marinov GK, Kundaje A, Kheradpour P, Pauli F, Batzoglou S, Bernstein BE, Bickel P, Brown JB, Cayting P, et al. 2012. ChIP-seq guidelines and practices of the ENCODE and modENCODE consortia. Genome Res 22: 1813–1831. [DOI] [PMC free article] [PubMed] [Google Scholar]
- Lee H, Chang YC, Varma A, Kwon-Chung KJ. 2009. Regulatory diversity of TUP1 in Cryptococcus neoformans. Eukaryot Cell 8: 1901–1908. [DOI] [PMC free article] [PubMed] [Google Scholar]
- Liu X, Brutlag DL, Liu JS. 2001. BioProspector: discovering conserved DNA motifs in upstream regulatory regions of co-expressed genes. Pac Symp Biocomput 127–138. [PubMed] [Google Scholar]
- Liu OW, Chun CD, Chow ED, Chen C, Madhani HD, Noble SM. 2008. Systematic genetic analysis of virulence in the human fungal pathogen Cryptococcus neoformans. Cell 135: 174–188. [DOI] [PMC free article] [PubMed] [Google Scholar]
- Ma H, Hagen F, Stekel DJ, Johnston SA, Sionov E, Falk R, Polacheck I, Boekhout T, May RC. 2009. The fatal fungal outbreak on Vancouver Island is characterized by enhanced intracellular parasitism driven by mitochondrial regulation. Proc Natl Acad Sci 106: 12980–12985. [DOI] [PMC free article] [PubMed] [Google Scholar]
- McGary KL, Park TJ, Woods JO, Cha HJ, Wallingford JB, Marcotte EM. 2010. Systematic discovery of nonobvious human disease models through orthologous phenotypes. Proc Natl Acad Sci 107: 6544–6549. [DOI] [PMC free article] [PubMed] [Google Scholar]
- Moyrand F, Janbon G. 2004. UGD1, encoding the Cryptococcus neoformans UDP-glucose dehydrogenase, is essential for growth at 37°C and for capsule biosynthesis. Eukaryot Cell 3: 1601–1608. [DOI] [PMC free article] [PubMed] [Google Scholar]
- Moyrand F, Fontaine T, Janbon G. 2007. Systematic capsule gene disruption reveals the central role of galactose metabolism on Cryptococcus neoformans virulence. Mol Microbiol 64: 771–781. [DOI] [PubMed] [Google Scholar]
- Nielsen K, Cox GM, Litvintseva AP, Mylonakis E, Malliaris SD, Benjamin DK Jr, Giles SS, Mitchell TG, Casadevall A, Perfect JR, et al. 2005. Cryptococcus neoformans α strains preferentially disseminate to the central nervous system during coinfection. Infect Immun 73: 4922–4933. [DOI] [PMC free article] [PubMed] [Google Scholar]
- O'Meara TR, Alspaugh JA. 2012. The Cryptococcus neoformans capsule: a sword and a shield. Clin Microbiol Rev 25: 387–408. [DOI] [PMC free article] [PubMed] [Google Scholar]
- O'Meara TR, Xu W, Selvig KM, O'Meara MJ, Mitchell AP, Alspaugh JA. 2014. The Cryptococcus neoformans Rim101 transcription factor directly regulates genes required for adaptation to the host. Mol Cell Biol 34: 673–684. [DOI] [PMC free article] [PubMed] [Google Scholar]
- Park BJ, Wannemuehler KA, Marston BJ, Govender N, Pappas PG, Chiller TM. 2009. Estimation of the current global burden of cryptococcal meningitis among persons living with HIV/AIDS. AIDS 23: 525–530. [DOI] [PubMed] [Google Scholar]
- Sabiiti W, Robertson E, Beale MA, Johnston SA, Brouwer AE, Loyse A, Jarvis JN, Gilbert AS, Fisher MC, Harrison TS, et al. 2014. Efficient phagocytosis and laccase activity affect the outcome of HIV-associated cryptococcosis. J Clin Invest 124: 2000–2008. [DOI] [PMC free article] [PubMed] [Google Scholar]
- Song MH, Lee JW, Kim MS, Yoon JK, White TC, Floyd A, Heitman J, Strain AK, Nielsen JN, Nielsen K, et al. 2012. A flucytosine-responsive Mbp1/Swi4-like protein, Mbs1, plays pleiotropic roles in antifungal drug resistance, stress response, and virulence of Cryptococcus neoformans. Eukaryot Cell 11: 53–67. [DOI] [PMC free article] [PubMed] [Google Scholar]
- Spivak AT, Stormo GD. 2012. ScerTF: a comprehensive database of benchmarked position weight matrices for Saccharomyces species. Nucleic Acids Res 40: D162–D168. [DOI] [PMC free article] [PubMed] [Google Scholar]
- Srikanta D, Santiago-Tirado FH, Doering TL. 2014. Cryptococcus neoformans: historical curiosity to modern pathogen. Yeast 31: 47–60. [DOI] [PMC free article] [PubMed] [Google Scholar]
- Wang ZA, Griffith CL, Skowyra ML, Salinas N, Williams M, Maier EJ, Gish SR, Liu H, Brent MR, Doering TL. 2014. Cryptococcus neoformans dual GDP-mannose transporters and their role in biology and virulence. Eukaryot Cell 13: 832–842. [DOI] [PMC free article] [PubMed] [Google Scholar]
- Zaman S, Lippman SI, Zhao X, Broach JR. 2008. How Saccharomyces responds to nutrients. Annu Rev Genet 42: 27–81. [DOI] [PubMed] [Google Scholar]
- Zaragoza O, Casadevall A. 2004. Experimental modulation of capsule size in Cryptococcus neoformans. Biol Proced Online 6: 10–15. [DOI] [PMC free article] [PubMed] [Google Scholar]
- Zhu X, Williamson PR. 2003. A CLC-type chloride channel gene is required for laccase activity and virulence in Cryptococcus neoformans. Mol Microbiol 50: 1271–1281. [DOI] [PubMed] [Google Scholar]
Associated Data
This section collects any data citations, data availability statements, or supplementary materials included in this article.