

Abstract
The mammalian/mechanistic target of rapamycin (mTOR) is a key integrative kinase that functions in two independent complexes, mTOR complex (mTORC) 1 and mTORC2. In contrast to the well-defined role of mTORC1 in dendritic cells (DC), little is known about the function of mTORC2. Here, we demonstrate for the first time an enhanced ability of mTORC2-deficient myeloid DC to stimulate and polarize allogeneic T cells. We show that activated bone marrow-derived DC from conditional Rictor−/− mice exhibit lower co-inhibitory B7-H1 molecule expression independently of the stimulus and enhanced IL-6, TNFα, IL-12p70 and IL-23 production following TLR4 ligation. Accordingly, TLR4-activated Rictor−/− DC display augmented allogeneic T cell stimulatory ability, expanding IFN-γ+ and IL-17+, but not IL-10+ or CD4+Foxp3+ regulatory T cells in vitro. A similar DC profile was obtained by stimulating Dectin-1 (C-type lectin family member) on Rictor−/− DC. Using novel CD11c-specific Rictor−/− mice, we confirm the alloreactive Th1 and Th17 cell-polarizing ability of endogenous mTORC2-deficient DC after TLR4 ligation in vivo. Furthermore, we demonstrate that pro-inflammatory cytokines produced by Rictor−/− DC after LPS stimulation are key in promoting Th1/Th17 responses. These data establish that mTORC2 activity restrains conventional DC pro-inflammatory capacity and their ability to polarize T cells following TLR and non-TLR stimulation. Our findings provide new insight into the role of mTORC2 in regulating DC function and may have implications for emerging therapeutic strategies that target mTOR in cancer, infectious diseases, and transplantation.
Keywords: Dendritic cells, T cells, knockout mice, cytokines, lipopolysaccharide, cell activation
Introduction
The mammalian/mechanistic target of rapamycin (mTOR) is an evolutionarily conserved integrative serine-threonine kinase. It regulates cell growth, metabolism and proliferation [1], and immune cell function [2, 3] in response to environmental cues [4]. mTOR performs its catalytic function in at least two independent complexes: mTORC1 and mTORC2 [5] (Figure 1A). In mTORC1, mTOR binds to Raptor, mLST8 and PRAS40, and phosphorylates the translational factors S6K-1 and 4E-BP1 [6], regulating different cell processes in response to nutrients and/or growth factors [7]. In mTORC2, mTOR binds to Rictor, mLST8, mSIN1, and Protor, and phosphorylates Akt, protein-kinase Cα and SGK1, leading to regulation of the actin cytoskeleton [5]. The stability and function of mTORC2 is dependent on the presence of the subunits Rictor and mSIN1 [8]. While the immunosuppressant rapamycin (RAPA) potently inhibits mTORC1, it has little effect on mTORC2 [5, 9]. Recently, assessment of novel ATP-competitive dual mTOR inhibitors has revealed RAPA-resistant functions of both complexes [10, 11]. Several ATP-competitive mTOR inhibitors are currently being studied pre-clinically and clinically as potential antitumor agents [12], and as inhibitors of transplant rejection [13].
FIGURE 1. Rictor−/− DC show absence of mTORC2 signaling while maintaining mTORC1 signaling.

(A) Functions of mTORC1 and mTORC2 in relation to DC activation via TLR, Dectin-1 and CD40. Upon TLR, Dectin-1 or CD40 activation, PI3K or different TRAFs are recruited, leading to Akt activation, which is effected by mTORC2-mediated Ser473 phosphorylation. Active Akt inhibits the TCS2/1 complex, allowing activation of mTORC1, which in turn phosphorylates and activates S6K and 4E-BP1. Active Akt also inhibits GSK-3 and FoxO1 function, which translates to regulation of cytokine transcription. Dectin-1 and CD40 signal through different TRAFs, which can activate Akt, and regulate cytokine transcription via NFAT and NFκB. TSC1/2 = tuberous sclerosis 1/2; Rheb = Ras homolog enriched in brain; S6K = ribosomal protein S6 kinase; 4E-BP1 = eukaryotic initiation factor 4E-binding protein 1; SGK1 = glucocorticoid inducible kinase-1; PKC = protein kinase C; FOXO1 = forkhead box O 1; GSK3 = glycogen-synthase-kinase-3; TRAF = TNF receptor-associated factor. (B) BM-DC were generated from WT or Rictor−/− mice and cultured in the absence (non-stimulated; ns) or presence of LPS (TLR4), LTA (TLR2), CD40 ligand (CD40) or Curdlan (Dectin 1; Dt1) for 18h, then re-stimulated with the same agents for 30 min before obtaining cell lysates. Total lysates were immunoblotted for the indicated protein. Data are representative of n = 3 to 4 independent experiments. (C) All proteins shown were quantified relative to non-stimulated control DC and normalized to β-actin. (D) Phosphorylation levels of Akt S473 and S6K T398 (open profiles) were determined in DCs by flow cytometric analysis following CD11c+ cell purification and LPS stimulation for 1h. Filled profiles denote samples stained with secondary Ab only. Mean fluorescence intensity (MFI) for pAkt or pS6K is indicated in the top right corners. Plots are representative of n = 5 independent experiments. (E) Mean expression of pAkt and pS6K MFI across n = 5 experiments. * P < 0.05, ** P < 0.01, *** P < 0.001 compared to control DC, and # P < 0.05 compared to the respective non-stimulated condition.
Recent studies focused on the role of specific mTOR complexes in T cells have shown some contradictory results. Delgoffe et al [14] found that mTORC1 inhibition in CD4+ T cells impairs Th1 and Th17 cell differentiation without affecting Th2 cell generation while, conversely, mTORC2-deficient T cells fail to differentiate into Th2 cells, but retain ability to become Th1 and Th17 cells. However, Kurebayashi et al. [15] demonstrated that mTORC1 is critical for Th17 but not Th1 differentiation and Lee et al. [16] showed mTORC2 is crucial for Th1 and Th2 differentiation. Additionally, mTORC1/2 links immune signaling and metabolic programming to establish regulatory T cell (Treg) function [17] and expansion [18], as well as modulating CD8+ memory T cell differentiation [19]. There is also recent evidence that Rictor regulates the survival of B cells, their balance of pro- versus anti-apoptotic gene expression, and their maturation and function [20]. Much has been learned about the role of mTORC1 in APC, including DC, as the result of their exposure to RAPA. Hence, mTORC1 inhibition hampers DC maturation [21], endocytosis [22] and Ag uptake [23], while increasing apoptosis [24]. Inhibition of mTORC1 in DC can also exert paradoxical effects: while it promotes DC tolerogenicity (as seen by low costimulatory molecule expression, poor T cell stimulatory ability, and Treg expansion [25]), it can also promote DC pro-inflammatory effects, including enhanced IL-12p70 and impaired IL-10 production [26–29], mediated via augmentation of NF-κB and reduction of STAT-3 activity [26, 27]. In contrast, little is known about the function of mTORC2 in APCs. Recently, Brown et al [30] reported that mTORC2 in mouse DC negatively regulates the inflammatory response through phosphorylation of Akt and cytoplasmic retention of the transcription factor FoxO1 following LPS stimulation. Here we have examined the role of mTORC2 in DC in response to different stimuli and in shaping T cell responses.
We report that, compared with control myeloid DC, those lacking mTORC2 exhibit elevated pro-inflammatory cytokine production, T cell allostimulatory ability and enhanced capacity to expand IFN-γ- and IL-17-producing T cells without Treg expansion, following TLR4 or Dectin-1 but not TLR2 or CD40 stimulation. Using novel CD11c-specific Rictor−/− mice, we have also demonstrated the Th1 and Th17 cell-polarizing ability of endogenous mTORC2-deficient DC after TLR4 ligation. These novel findings enhance the current understanding of the immunomodulatory function of mTORC2 in DC.
Materials and Methods
Mice
Male C57BL/6J (B6; H-2b), BALB/c (H-2d) and B6.Cg-Tg(Tcra, Tcrb)3Ayr/J (referred to as 1H3.1) mice were from The Jackson Laboratory. Conditional Rictor gene disruption was accomplished by crossing floxed rictor mice [16] (generously provided by Drs. Keunwook Lee and Mark Boothby, Vanderbilt University School of Medicine) with B6 mice expressing tamoxifen-inducible Cre under the ROSA26 promoter (ROSA26-CreERT2). As described [11], 7- to 12-wk-old rictorfl/fl ROSA26-CreERT2 mice or ROSA26-wild-type (WT) were given tamoxifen (82 mg/kg i.p.; Sigma-Aldrich, T5648). The genetic background of crossed mice was verified by PCR genotyping, and littermates used as negative controls. CD11c-specific Rictor−/− were made by crossing floxed Rictor mice with B6 mice expressing CD11c-Cre. All studies were performed according to an Institutional Animal Care and Use Committee-approved protocol in accordance with NIH guidelines.
DC differentiation
Bone marrow (BM) cells were harvested 7d after the last tamoxifen dose and cultured to generate DC as described [31], using mouse rGM-CSF and rIL-4 (both 1000 U/ml; R&D Systems). On d7 of culture, DC were purified using anti-CD11c immunomagnetic beads (Miltenyi Biotec). Where indicated, the TLR4 ligand LPS (100 ng/ml; Salmonella minnesota R595; Alexis Biochemicals), the TLR2 ligand lipoteichoic acid (LTA, 10μg/ml; Staphylococcus aureus; InvivoGen), CD40 ligand (5μg/ml; clone HM40-3; eBioscience), or the Dectin-1 ligand Curdlan (100μg/ml; Alcaligenes faecalis; InvivoGen) were used to stimulate DC for 16–18h. DC were washed before staining or co-culture with T cells.
Western blots
Immunoblots were performed as described [27]. Briefly, DCs were lysed in CelLytic M (Sigma-Aldrich) containing a protease inhibitor cocktail (Mini-Tablets; Roche Diagnostics). Debris was removed by centrifugation and protein separated on a 4–20% SDS-polyacrylamide electrophoresis gel before membrane transfer. Immunoblotting was performed with primary Abs from Cell Signaling Technology, directed against mTOR (#2983), Raptor (#2280), Rictor (#2114), p70S6K (#9202), p-p70S6K (T389) (#9234), Akt (#9272), p-Akt (S473) (#9271), FoxO1 (#2880), p-FoxO1 (S256) (#9461), p-GSK-3α/β (S21/9) (#9327), p-GSK-3β (S9) (#9336), NF-κB p65 (#4764), or p-NF-κB p65 (S563) (#3033). In addition, mAbs to GAPDH or β-actin (Novus Biologicals) were used. After washing, membranes were incubated with horseradish peroxidase-conjugated Abs (Cell Signaling Technology). Band visualization was achieved with SuperSignal West Pico Substrate (Pierce Chemical) and exposure to film. The intensity of individual bands was quantified using ImageJ (NIH) relative to the loading control (β-actin or GAPDH) and represented as relative expression compared to the non-stimulated control band.
DC-T cell co-cultures
Allogeneic MLR were performed using γ-irradiated (20 Gy) DC as stimulators and normal CD3+ BALB/c T cells as responders (1:20 DC:T cell ratio). Splenic T cells were isolated by negative selection [11] and labeled with CFSE (Vibrant CFDASE Cell Tracer Kit; Invitrogen). Proliferation was analyzed at d4 by flow cytometry and T cell phenotype determined at d6. For blocking experiments, anti-mouse IL-23R (10 μg/ml, clone 21A4, Merck) or IL-6 Ab (50 μg/mL, clone MP5–20F3, BD) was added to the MLR at d0. Ag-specific T cell stimulation was performed using WT or Rictor−/− DC loaded with BALB/c-derived I-Eα(52–68) allopeptide for 16h and TCR-transgenic (tg) T cells specific for this peptide for 3d. T cell proliferation was analysed as described [27].
Stimulation of naive T cells with CD3/CD28 beads
Normal BALB/c T cells were plated in round-bottom 96-well plates (8×10⁴ cells per well) in either RPMI-1640 complete medium supplemented with rIL-2 (30 U/ml, R&D Systems) or in LPS-stimulated control or Rictor−/− DC supernatant (collected 18–20h post-stimulation), in the presence or absence of Dynabeads® mouse T-activator CD3/CD28 (1:1 bead-to-cell ratio; Gibco). After 6d, T cells were restimulated for 4h with PMA/ionomycin (Sigma-Aldrich) in the presence of Golgi Plug (BD Biosciences), followed by surface and intracellular staining.
Flow cytometric analyses
For assessment of intracellular cytokine expression, Golgi Plug and LPS were added to DC for 4–5h, followed by surface staining for CD11c, treatment with fixation/permeabilization buffer (eBioscience) and intracellular staining. T cells were examined after 4–5h restimulation with PMA/ionomycin in the presence of Golgi Plug, performing surface staining, fixation/permeabilization, and intracellular staining with appropriate Ab. DC subsets in spleen were identified by differential expression of CD11c, CD11b, CD8α, B220 and PDCA1. Fluorochrome-conjugated mAbs were purchased from eBioscience, BD Bioscience, Biolegend or Miltenyi Biotec. Appropriately-conjugated, isotype-matched IgGs served as controls. For phospho-flow analysis, DC were stimulated with LPS (100 ng/ml, Sigma) for 30 min, fixed with 2% paraformaldehyde for 10 min and permeabilized overnight. Staining was performed with rabbit anti-mouse pAkt S473 or pS6K T389 (Cell Signaling) and donkey anti-rabbit IgG (AF647, Invitrogen). Data were acquired with a LSR II or Fortessa flow cytometer (BD Biosciences) and analyzed using FlowJo (TreeStar).
Cytokine quantitation
Cytokines in DC or MLR culture supernatants were quantified by ELISA (eBiosciences) and/or cytometric bead array (CBA; BD) where indicated, following the manufacturer’s instructions.
Adoptive transfer of 1H3.1 TCR tg CD4 T cells
1H3.1 TCR-tg CD4+ T cells (CD90.1+Vβ6+) were purified from lymph nodes and spleens of 1H3.1 mice by negative depletion and 3×10⁶ cells were administered i.v. to CD11c-specific Rictor−/− mice, 1d after i.p. injection of BALB/c I-Eα-derived allopeptide (IEα52–68, 500μg/kg mice) alone or with LPS (100μg/kg mice, Sigma). After 5d, isolated splenocytes were restimulated for 4h with PMA/ionomycin in the presence of GolgiPlug, followed by surface and intracellular staining.
Statistical analyses
Results are expressed as means ± 1SD. Significant differences between means were determined using the Student ‘t’ test or One-way Anova test (GraphPad Prism), with P < 0.05 considered significant.
Results
Rictor−/− DC display absence of mTORC2 signaling but intact mTORC1 signaling
We evaluated activation/inhibition of the mTORC1/2 pathway in WT and Rictor−/− DC by immunoblot and phosphoflow analysis. We verified deletion of Rictor in our Rictor−/− DC under different activating conditions (TLR4/2, CD40 or Dectin-1 ligation; Fig. 1A–B), whereas total Raptor and mTOR expression remained intact (Fig. 1B). Relative quantification of western blots showed a slight increase in Raptor expression by Rictor−/− DC after CD40 stimulation, compared to the non-stimulated condition (Fig. 1C). Interestingly, mTOR expression levels were augmented in non-stimulated (ns) and TLR2-stimulated Rictor−/− DC compared with control DC (Fig. 1C). We also analyzed total and phosphorylated Akt and S6K as markers of mTORC1 and 2 activation, respectively. Rictor−/− DC displayed marked reduction of S473-Akt phosphorylation as expected, whereas T389 phosphorylation of S6K remained active (Fig. 1B–E), and was slightly increased compared with control DC, although this was not statistically significant (Fig. 1C). These results indicate specific inhibition of mTORC2 in Rictor−/− DC.
Rictor−/− DC exhibit reduced size, diminished B7-H1 expression and increased pro-inflammatory cytokine production
We found that DC lacking mTORC2 were smaller than WT control DC (Fig. 2A–B), suggesting that mTORC2 may play a role in regulating DC growth. Also, the yield of DC generated from BM cells in 7d culture was significantly lower for Rictor−/− compared with control cells (Fig. 2C), indicating that mTORC2 may regulate DC differentiation. Interestingly, expression of MHC class II (I-Ab) was increased slightly in Rictor−/− DC compared to control DC and especially after Dectin-1 stimulation (3-fold increase) (Fig. 2D). Unstimulated Rictor−/− DC also showed a modest increase in CD86 (Fig. 2D) and CD80 (data not shown), but significantly diminished levels of CD40 when unstimulated or after CD40 ligation (Fig. 2D). More strikingly, co-inhibitory B7-H1 expression was reduced significantly, irrespective of the nature of the stimulus (Fig. 2D). Given that B7-H1 on DC negatively regulates activated T cells and induces Treg [32], this observation suggests that mTORC2-lacking DC have reduced ability to negatively regulate T cell responses.
FIGURE 2. Rictor−/− DC display reduced size and yield, diminished B7-H1 expression and increased pro-inflammatory cytokine production.

(A) Representative plots of side (SSC) vs. forward (FSC) scatter of BM-DC and (B) their MFI quantified across n=7 experiments. (C) DC yield normalized to number of initial cultured BM cells. (D) CD11c+-gated cells were analyzed for I-Ab, CD86, CD40 and B7-H1 expression by flow cytometry in non-stimulated (ns) cultures or those stimulated with LPS (TLR4), LTA (TLR2), CD40 ligand (CD40) or Curdlan (Dectin-1) on d6 for 18h. Bars are means + 1SD of n = 5–8 independent experiments; data normalized to the ns normal DC condition. (E) Cytokine levels in supernatants were assessed by cytokine bead array (IL-6, IL-10, TNFα) or ELISA (IL-12p70 and IL-23). (F) LPS-stimulated DCs were stained for intracellular cytokines after 5h culture with LPS and GolgiPlug. Plots show the percentages of CD11c+-gated cells positive for each cytokine in a representative experiment. Data are from n = 4 experiments. * P < 0.05, ** P < 0.01, *** P < 0.001.
The accompanying DC cytokine secretion profiles showed significantly increased IL-6, TNFα, IL-12p70 and IL-23 after TLR4 stimulation compared with control DC (Fig. 2E). These results were confirmed by intracellular staining for each cytokine in DC following TLR4 ligation (Fig. 2F). Rictor−/− DC showed a similar cytokine profile to control DC after TLR2 and CD40 ligation, that resembled the non-stimulated condition (Fig. 2E), except for the significant IL-6 increase after CD40 ligation. In contrast, Dectin-1 stimulation enhanced cytokine secretion in both control and Rictor−/− DC, but only a significant increase in IL-12p70 and IL-23 production by Rictor−/− DC compared with control DC was observed (Fig. 2E).
Rictor−/− DC pro-inflammatory profile is partially regulated by GSK-3
Next we wanted to investigate the molecules involved on the regulation of the Rictor−/− DC pro-inflammatory profile. Several authors [30, 33, 34] have reported that Akt is important for downregulation of pro-inflammatory cytokine production by monocytes/DC. As Brown et al [30] suggested that mTORC2 in DC reduces the inflammatory response through phosphorylation of Akt and subsequent reduction of phosphorylation/nuclear translocation of the transcription factor FoxO1, we investigated FoxO1 phosphorylation in our experimental setting. As shown in Fig. 3A, S256 phosphorylation of FoxO1 was only slightly inhibited in Rictor−/− DC compared to control DC, mainly following TLR2 stimulation, while total FoxO1 was very similar between Rictor−/− DC and control DC. This suggests that FoxO1 may differentially regulate the pro-inflammatory profile of Rictor−/− DC depending on the stimulus received, and that additional molecules are involved in this regulation. Active Akt has also been shown to be responsible for inducing Ser9 phosphorylation (inhibition) of GSK3-β, which regulates inflammatory responses through CREB and NF-κB [33]. Taking these data into consideration, we tested phosphorylation of GSK3 in control and Rictor−/− DC. The results showed (Fig. 3B) that Ser9 phosphorylation of GSK3-β is reduced in Rictor−/− DC for all stimuli compared with control DC (Fig. 3B). These data demonstrate that GSK3-β is less inhibited (more activated) in Rictor−/− DC than in control DC. Since GSK3-β regulates cytokine production [33], these results suggest that Rictor−/− DC pro-inflammatory response is partially regulated by GSK3-β.
FIGURE 3. Rictor−/− DC pro-inflammatory profile is partially regulated by GSK-3.
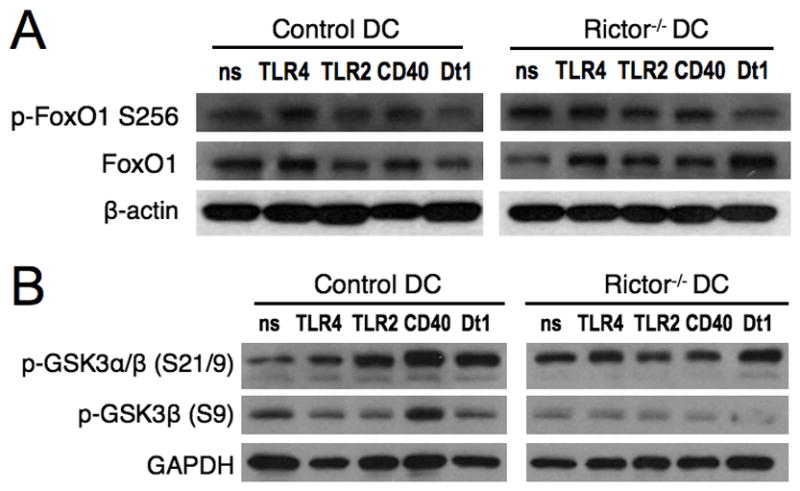
BM-DC were generated from WT or Rictor−/− mice and cultured in the absence (non-stimulated; ns) or presence of LPS (TLR4), LTA (TLR2), CD40 ligand (CD40) or Curdlan (Dectin 1; Dt1) for 30min before obtaining cell lysates. Total lysates were immuno-blotted for (A) total and phosphorylated (Ser256) FoxO1, and for (B) phosphorylated GSK-3α/β (S21/9) or GAPDH. Data are representative of n = 2 to 3 independent experiments.
TLR4- or Dectin-1-stimulated Rictor−/− DC promote enhanced Th1/Th17 responses, without expanding Treg
The ability of mTORC2 to differentially regulate distinct costimulatory molecules and cytokine production by DC suggested a potential impact on T cell activation. We therefore assessed the capacity of mTORC2-deficient DC to regulate T cell responses. Rictor−/− DC exhibited greater bulk T cell allostimulatory ability in MLR following TLR4 ligation (Fig. 4A and Supp. Fig. 1A), but not after TLR2, CD40 or Dectin-1 stimulation compared with control DC (Fig. 4A). These results were confirmed in an alloantigen-specific setting, where TLR4-activated Rictor−/− DC induced 2-fold enhanced proliferation of Ag-specific TCR-tg T cells as compared with control DC (Fig. 4B).
FIGURE 4. TLR4- or Dectin-1-stimulated Rictor−/− DC promote enhanced Th1/Th17 responses, without expanding Treg.

(A) Non-stimulated (ns), TLR4/2-, CD40- or Dectin1-stimulated DC from WT or Rictor−/− mice were used as stimulators of CD3+ BALB/c T cells in 4d CFSE-MLR. Bars are means + 1SD of dividing cells of n=6 independent experiments. (B) Ag-specific proliferation of 1H3.1 TCR-tg CD4 T cells stimulated by WT or Rictor−/− DC loaded with I-Eα(52–68) peptide, measured at d3 of culture. (C) Allogeneic MLR were performed as in A to evaluate absolute numbers of CD25+Foxp3+ cells and IL-10-, IL-6-, IFNγ-, and IL-17-producing CD4+ T cells. Bars are means + 1SD of n = 3–6 independent experiments. (D) Cytokines in MLR supernatants were quantified by cytokine bead array. Data (means + 1SD) are from n = 3–4 independent experiments. * P < 0.05, *** P < 0.001.
Next, we investigated T cell subset differentiation in response to Rictor−/− DC stimulation in conventional MLR. Although control DC increased absolute numbers of CD4+CD25+Foxp3+ Treg following TLR2 or Dectin-1 ligation, neither unstimulated nor activated Rictor−/− DC increased alloreactive Treg or T regulatory type-1 (Tr1) cells (CD4+IL-10+) (Fig. 4C). Accordingly, IL-10 levels in MLR supernatants were reduced in the presence of unstimulated or TLR2-stimulated Rictor−/− DC compared with control DC (Fig. 4D). Interestingly, TLR4-activated Rictor−/− DC increased the incidence of IL-6-, IFN-γ- and IL-17-producing CD4+ T cells (Fig. 4C), compared with those primed by control DC. In consistence with these results, secretion of IFN-γ and IL-17 was augmented significantly when TLR4-stimulated Rictor−/− DC were used as stimulators (Fig. 4D). We also observed a significant increase in IL-6- and IFN-γ-producing T cells by Dectin-1-stimulated Rictor−/− DC (Fig. 4C) with a significant augmentation of secreted IL-17 levels, compared with control DC (Fig. 4D). These results demonstrate an expansion in IFN-γ- and IL-17-secreting T cells by Rictor−/− DC after TLR4 or Dectin-1 stimulation. Th2 cytokines were also examined and a slight reduction in IL-5-producing T cells after co-culture with Rictor−/− DC compared with control DC was observed (Supp. Fig. 1B). No differences were observed in IL-4 or TNFα levels in the culture supernatants (Supp. Fig. 1C) between control and Rictor−/− DC. Taken together, these results demonstrate that Rictor−/− DC promote enhanced Th1 and Th17 responses in vitro, without expanding Treg, after TLR4 or Dectin-1 stimulation. Thus, mTORC2 negatively regulates the ability of DC to prime Th1 and Th17 cell responses.
Rictor−/− DC-secreted pro-inflammatory cytokines, principally IL-6 and IL-23, are key to promotion of Th1/Th17 responses
Next, we assessed the mechanism underlying the ability of Rictor−/− DC to induce Th1/Th17 cells. We hypothesized that pro-inflammatory cytokines produced by Rictor−/− DC (Fig. 2E–F) were more likely to promote Th1/Th17 responses than enhanced co-stimulatory molecule expression by these cells (Fig. 2D). Previously, IL-23 and IL-6 dependence of Th17 differentiation in vivo and its influence on Th1 differentiation has been reported [35–40]. Therefore we investigated the role of Rictor−/− DC-secreted IL-23 and IL-6 in the promotion of Th1 and Th17 cells. Blockade of IL-6, IL-23R or both molecules in allogeneic MLR markedly reduced the incidence of IFNγ+ and IL-17+ CD4+ T cells induced by TLR4-activated Rictor−/− DC (Fig. 5A). Quantification of cytokines secreted during the MLR showed a significant reduction in IFNγ, IL-17 and IL-6 when the blocking Abs were present in the cultures (Fig. 5B). These data suggest that IL-23 and IL-6 secretion by Rictor−/− DC plays a key role in enhancing the Th1/Th17 response, although it is likely that other pro-inflammatory cytokines are also important. To verify the relevance of pro-inflammatory cytokines secreted by Rictor−/− DC in the priming of Th1/Th17 responses, normal T cells were cultured with Rictor−/− DC or control DC supernatant, or with exogenous IL-2, in the presence or absence of anti-CD3/CD28 beads. After 6d, intracellular cytokine staining revealed an increase in IFNγ- and IL-17-secreting CD4+ T cells cultured with Rictor−/− DC supernatant compared with exogenous IL-2 or control DC supernatant (Fig. 5C). This observation demonstrates the importance of Rictor−/− DC-produced pro-inflammatory cytokines in promoting Th1/Th17 responses.
FIGURE 5. Rictor−/− DC-secreted pro-inflammatory cytokines, principally IL-6 and IL-23, are key to promotion of Th1/Th17 responses.
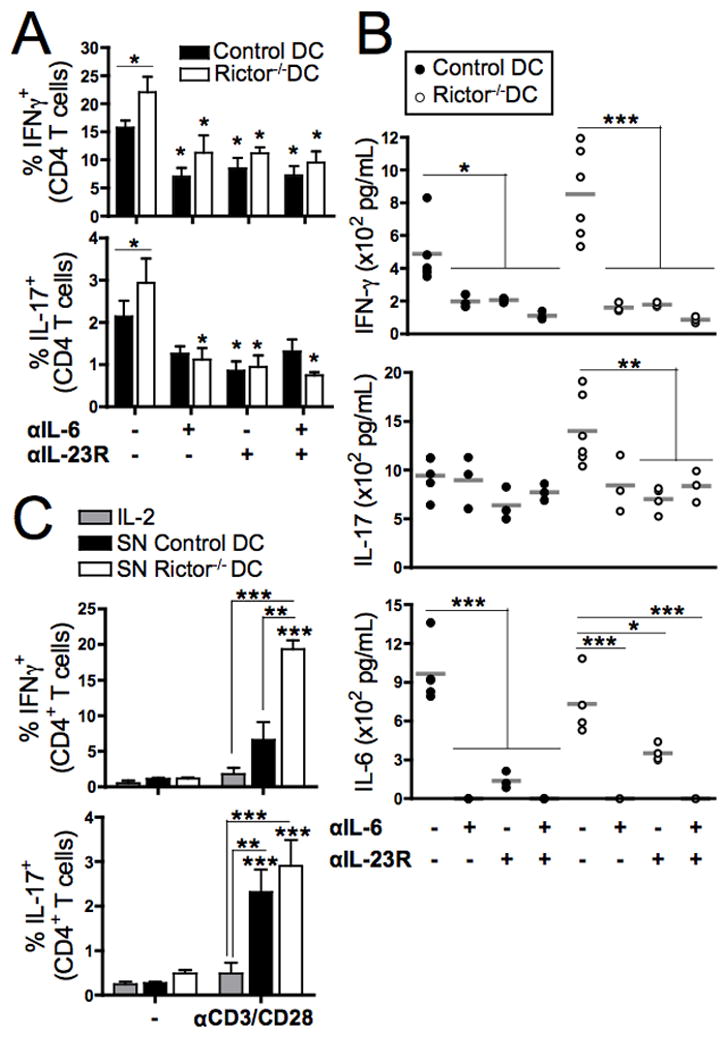
(A) LPS-stimulated control or Rictor−/− DC were used as stimulators of CD3+ BALB/c T cells in 6d MLR, in the presence of blocking mAb against IL-6, IL-23R or both. The CD4+ T cells were then re-stimulated with PMA/Io and stained intracellularly for IFN-γ and IL-17. Bars indicate means + 1SD of n = 3–5 independent experiments, and symbols indicate differences relative to the non-blocked condition. (B) Cytokines in the MLR supernatants were quantified by cytokine bead array on 6d. (C) CD3+ BALB/c T cells were cultured with either IL-2 or DC supernatants, and stimulated with CD3/CD28 beads or left unstimulated (−) for 5d. T cells were re-stimulated with PMA/Io and CD4+ stained intracellularly for IFN-γ or IL-17. Bars are means + 1SD of n = 3–5 independent experiments. Statistical significances are shown compared to the non-stimulated condition. * P < 0.05, ** P < 0.01, *** P < 0.001.
Endogenous Rictor−/− DC show increased IL-12p70 and IL-23, and promote T cell proliferation and Th1/Th17 responses after TLR4 stimulation in vivo
Finally, we examined whether endogenous mTORC2-deficient DC could similarly regulate T cell responses in vivo. To address this question, CD11c-specific Rictor−/− or control mice were adoptively transferred with 1H3.1 TCR-tg T cells and 2d later were injected with I-Eα(52–68) peptide, with or without LPS. After 6d, splenic DC from each group showed similar expression of I-Ab and CD86, but a significant reduction in B7-H1 expression was observed in mice with Rictor−/− DC that received peptide alone, compared with control DC (Fig. 6A). This difference was not observed after administration of peptide and LPS, revealing a difference between splenic DC and in vitro-generated BMDCs. We investigated which types of splenic Rictor−/− DC showed reduced B7-H1 expression in vivo. Our data show (Fig. 6B and 6C) that only conventional myeloid CD11b+ DC but not the other DC populations exhibited reduced B7-H1 expression compared with controls, after the in vivo administration of peptide alone. In agreement with BMDC results, splenic Rictor−/− DC from animals injected with the allopeptide and LPS exhibited increased production of IL-12p70 and IL-23, compared with controls (Fig. 6D). Splenic 1H3.1 T cells (both percentage and absolute numbers) were expanded significantly in CD11c-specific Rictor−/− mice compared with controls (Fig. 7A–B), consistent with our in vitro finding of increased T cell proliferation by TLR4-stimulated Rictor−/− DC (Fig. 4A–B). Splenic 1H3.1 T cells showed significant expansion of IFN-γ- and IL-17-producing T cells, but not IL-10+, IL-5+ or Foxp3+ T cells after activation by Rictor−/− DC in presence of LPS (Fig. 7C–D). These results confirm our in vitro data (Fig. 2D–F, Fig. 4A,C) and establish that endogenous mTORC2-deficient DC generate augmented Th1/Th17 responses, while failing to impact Treg, thus supporting a central regulatory role of mTORC2 in DC under inflammatory conditions.
FIGURE 6. Endogenous Rictor−/− DC show decreased B7-H1 expression and increased IL-12p70 and IL-23 production.
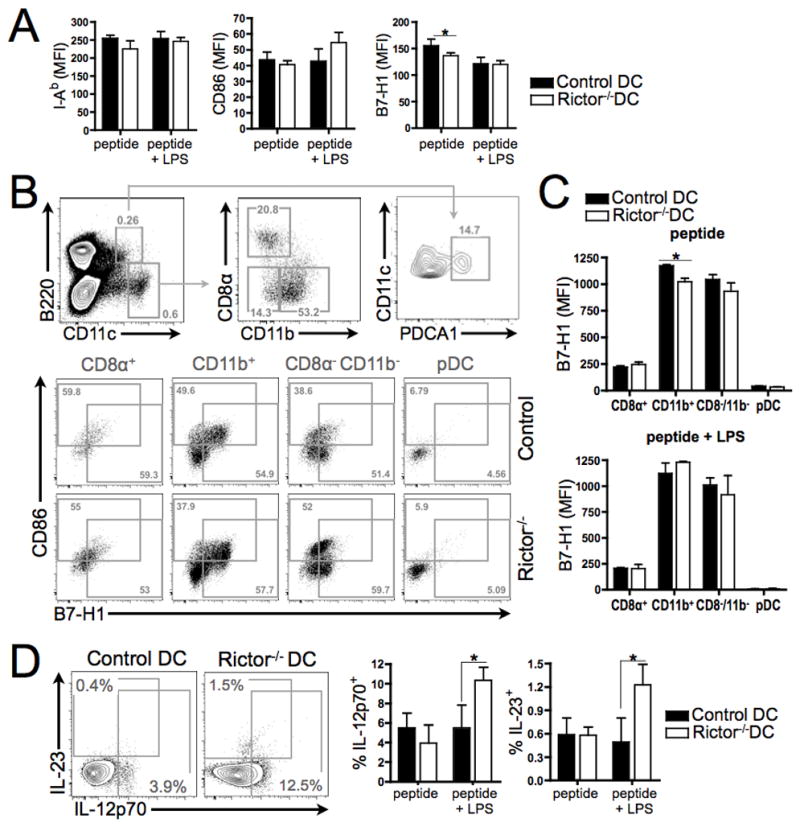
CD11c-specific Rictor−/− mice were adoptively transferred (i.v.) with 1H3.1 TCR-tg CD4+ T cells and 2d later injected i.p. with I-Eα(52–68) peptide, with or without LPS. After 6d, splenic DC were harvested and stained. (A) Expression of I-Ab, CD86 and B7-H1 by bulk CD11c+ cells. (B) Discrimination of splenic DC subsets on the basis of differential B220, CD11c, CD11b, CD8α and PDCA1 expression. Representative plots show percentages in mice injected with peptide alone, together with surface markers (CD86, B7-H1). (C) Expression of B7-H1 by splenic DC subsets following peptide or peptide + LPS injection. (D) Intracellular IL-12p70 and IL-23 expression (representative plots showing percentages of positive cells following peptide + LPS administration). Means +1SD are from 4–5 animals per condition and n = 3 experiments were performed. * P < 0.05.
FIGURE 7. Endogenous Rictor−/− DC promote alloreactive T cell proliferation and Th1/Th17 responses after TLR4 stimulation.

CD11c-specific Rictor−/− mice were adoptively transferred (i.v.) with 1H3.1 TCR-tg CD4+ T cells, and 2d later received I-Eα(52–68) peptide, with or without LPS (i.p.). After 6d, splenic T cells were harvested and stained for Vβ6-TCR and CD90.1, as well as intracellular cytokines. (A) Representative plots show the percentages of 1H3.1 TCR-tg CD4+ T cells, and (B) their total numbers. (C) Representative plots showing the percentages of positive cells for each cytokine and Foxp3 (FSC on the Y-axis), and (D) their total numbers. Data are from 3–5 animals per condition and n = 2 independent experiments. * P < 0.05.
Discussion
Recently, using rapamycin and ATP-competitive inhibitors, we defined an immunoregulatory pathway in which RAPA-sensitive mTORC1 in DCs promotes effector T cell expansion and RAPA-insensitive mTORC1 restrains Treg induction [11]. Here, using Rictor−/− mice, we investigated the function of mTORC2 in DC under different activating stimuli and also their T cell-polarizing ability. We used both TLR and Dectin-1 ligands, as well as stimulation via CD40 (Figure 1A) to activate Rictor−/− DC and for comparison control DC. We analyzed both TLR4 and TLR2 ligands, which induce signaling through MyD88-TRIF or MyD88 respectively [41]. Curdlan is a bacterial product (β-(1,3)-glucan polymer) that acts as a selective Dectin-1 agonist and fully activates DCs, even in the absence of MyD88 and TRIF [42]. CD40 is one of the best-studied examples of TNF superfamily receptors involved in T cell-DC crosstalk [43]. Ligation of CD40 induces the recruitment of multiple TNF receptor-associated factors (TRAFs) and kinases (p38, AKT, PKC and JNK) to activate different pathways including NF-κB [43] (Figure 1A). Our data show that BMDC lacking mTORC2 exhibit lower co-inhibitory B7-H1 expression independent of the stimulus used, but elevated pro-inflammatory cytokine production and increased ability to expand IFN-γ- and IL-17-producing T cells, without Treg expansion, following TLR4 or Dectin-1 but not TLR2 or CD40 ligation. In vivo, endogenous LPS-stimulated Rictor−/− DC also showed increased IL-12p70 and IL-23 production and Th1/Th17-cell polarizing potency. Furthermore, we observed that pro-inflammatory cytokines produced by Rictor−/− DC after LPS stimulation were key to promotion of these Th1 and Th17 responses.
As reported for DC exposed to either RAPA [11, 44] or Torin1 (an ATP-competitive dual mTOR inhibitor) [11], mTORC2-deficient DC were smaller and were recovered in reduced yield compared with control DC when propagated from BM cells, suggesting that both mTOR complexes play a role in positively regulating DC generation. By contrast, Wang et al [45] have reported that Rictor deficiency does not exert strong effects on either DC development or size. These differences may reflect different methods used to generate the DC. While the latter authors used Flt3L, we used GM-CSF and IL-4 to generate DC from mouse BM. DC specifically lacking mTORC2 expressed MHC class II (I-Ab) and co-stimulatory molecules at similar levels to WT controls, but CD86 and co-inhibitory B7-H1 expression were increased and reduced respectively. Previously, we reported diminished B7-H1 expression by both unstimulated and LPS-stimulated Rictor−/− DC in vitro [11], and we have now extended these findings to show that reduced B7-H1 expression is also observed after TLR2, CD40 or Dectin-1 stimulation. Furthermore, endogenous Rictor−/− CD11b+ myeloid DC showed reduced B7-H1 expression compared with WT controls after Ag stimulation in vivo. These findings clearly suggest that B7-H1 expression in these DC populations is positively regulated by mTORC2 activation.
Given that B7-H1 expression on myeloid DC negatively regulates T cell activation and induces Treg [32], our finding that Rictor−/− DC express reduced levels of B7-H1 is consistent with their enhanced T cell allostimulatory ability. However, we found that while Rictor−/− DC displayed increased T cell stimulatory ability following TLR4 ligation, this was not apparent after exposure to TLR2, CD40 or Dectin-1 stimulants despite reduced B7-H1 expression. Although there are some contradictory results regarding the T cell stimulatory ability of RAPA treated-DC [11, 46, 47], we have shown [11] that dual mTORC1/2-inhibition (Torin1) in DC reduces their ability to induce T cell proliferation. Thus, our results indicate that mTORC2 expression in DC negatively regulates T cell expansion after TLR4 ligation.
Our data shows that Rictor−/− DC display different cytokine signatures, depending on the activation signal they receive and, accordingly, exhibit T cell differentiating abilities. When Rictor−/− DC were stimulated by CD40 ligation they behaved similarly to unstimulated cells, producing small amounts of cytokines (slight increase in IL-6) and, although promoting IL-2 secretion in allogeneic MLR, T cell responses did not differ from those in control DC-stimulated cultures. When stimulated via TLR2, Rictor−/− DC produced similar amounts of cytokines compared with CD40 ligation, and in allogeneic MLR, decreased Treg and IL-5-producing T cells, and increased IL-2 production compared with controls, suggesting activation but not skewing of T cells. After TLR4 stimulation, Rictor−/− DC produced higher levels of IL-12p70, IL-23, IL-6 and TNFα compared with control DC, consistent with the findings of Brown et al [30], and expanded T cells that produced IL-6, IFNγ and IL-17. We confirmed these observations in vivo by stimulating CD11c-specific Rictor−/− mice with LPS in an allopeptide-specific setting. DC from these mice produced increased levels of IL-23 and IL-12p70, and expanded Th1 and Th17 cells after LPS stimulation in vivo. In contrast, Dectin1 stimulation of both Rictor−/− and control DC promoted augmented secretion of all tested cytokines, but only IL-12p70 and IL-23 were significantly increased in Rictor−/− DC compared to control DC. In MLR, Dectin1-stimulated Rictor−/− DC expanded IL-6- and IFNγ-producing T cells, while diminishing Treg. It is known that Dectin-1 stimulation of human DC promotes a Th17 response [48]. Accordingly, we observed increased IL-17 production in MLR with Rictor−/− DC, and expansion of IL-17+ T cells after allogeneic cocultures with both control and Rictor−/− DC. Taken together, these findings suggest that mTORC2 plays an important role in regulating the inflammatory response after pattern recognition receptor stimulation of DCs. Despite the significant overlap in TLR signaling pathways, Th1/Th17-cell polarizing ability seems to be restricted to TLR4 and Dectin-1 ligation of Rictor−/− DC.
Our findings led us to investigate the molecules involved in the regulation of the Rictor−/− DC pro-inflammatory profile. Akt has been reported to downregulate DC pro-inflammatory cytokine production [30, 33, 34]. In fact, Brown et al [30] suggest that mTORC2 in DC reduces the inflammatory response through phosphorylation of Akt and cytoplasmic retention of the transcription factor FoxO1 (diminished S256 phosphorylation). We show that, although S473 phosphorylation of Akt is inhibited in Rictor−/− DC (Fig. 1B–E), S256 phosphorylation of FoxO1 is only slightly inhibited in Rictor−/− DC (Fig. 3A). This difference between Brown et al and our results could be due to the different models used. Brown et al analyzed p-FoxO1 (S256) 6h after knocking down Rictor by siRNA transfection in DC, whereas we analyzed p-FoxO1 (S256) in DC generated from Rictor−/− mice BM cells after 7d of culture. Therefore, it is feasible that, if FoxO1 phosphorylation is important for maintaining DC homeostasis (as has been shown recently for B cells [50]), an alternative compensatory mechanism could exist that allows S256 phosphorylation (inactivation) of FoxO1 when mTORC2 (or Akt) is inactive. Another molecule that is regulated by Akt is GSK3-β, which has been reported to positively regulate IL-12 production by RAPA-treated DC [27, 33, 49]. In accordance, we found that Rictor−/− DC show a reduced inhibition (or enhanced activation) of GSK3-β compared with control DC (Fig. 3B), suggesting that Rictor−/− DC pro-inflammatory response is partially regulated by GSK3-β. While GSK3-β may partially regulate this response, there are many other potential molecules that may allow mTOR to regulate the pro-inflammatory profile of myeloid DC.
Our finding that the cytokine profile of Rictor−/− DC under different stimulatory conditions is consistent with the T cell fate they promote, suggests that the cytokines secreted by these DC play an important role in the observed T cell differentiation. This was verified by culturing T cells with DC supernatants, and showing an increase in Th1/Th17 cells under the influence of Rictor−/− DC-secreted cytokines. Many cytokines have been associated with promotion of Th1 and Th17 cells, in particular IL-6, IL-23 [35, 37, 38] and IL-12p70 [51, 52]. Blocking two of the cytokines produced by Rictor−/− DC (IL-23, IL-6 or both) in MLR, confirmed their relevance to promotion of Th1/Th17 cells. However, because other signals apart from IL-6 may also induce IL-23R expression by T cells, our data do not exclude the role of other cytokines in driving T cell differentiation.
These novel findings establish that mTORC2 in conventional DC is important in negatively regulating their pro-inflammatory activity and ability to promote Th1/Th17 cell responses after TLR4 or Dectin-1 ligation. Our findings provide new insight into the role of mTOR in DC and raise the question of potential therapeutic application. Therefore, mTORC2 selective agonists might be useful in the treatment of immune-mediated inflammation, whereas antagonists might find a place in vaccine development or anti-tumor therapy.
Supplementary Material
Acknowledgments
This work was supported by National Institutes of Health grant R01 AI60994 (AWT). DR-R was supported by a European Society of Organ Transplantation/American Society of Transplantation Joint Research award and by a non-concurrent Thomas E. Starzl Postdoctoral Fellowship in Transplantation Biology. BRR was supported by an American Heart Association pre-doctoral fellowship (11PRE7070020), and BRR and ARW by NIH T32 AI74490 (AWT). HRT was supported by NIH grant R00 HL97155.
Non-standard abbreviations used in this article
- DC
dendritic cells
- KO
knock-out
- mTOR(C)
mammalian target of rapamycin (complex)
- RAPA
rapamycin
- Treg(s)
regulatory T cell(s)
- WT
wild-type
References
- 1.Yang Q, Guan KL. Expanding mTOR signaling. Cell Res. 2007;17:666–681. doi: 10.1038/cr.2007.64. [DOI] [PubMed] [Google Scholar]
- 2.Thomson AW, Turnquist HR, Raimondi G. Immunoregulatory functions of mTOR inhibition. Nat Rev Immunol. 2009;9:324–337. doi: 10.1038/nri2546. [DOI] [PMC free article] [PubMed] [Google Scholar]
- 3.Powell JD, Delgoffe GM. The mammalian target of rapamycin: linking T cell differentiation, function, and metabolism. Immunity. 2010;33:301–311. doi: 10.1016/j.immuni.2010.09.002. [DOI] [PMC free article] [PubMed] [Google Scholar]
- 4.Wullschleger S, Loewith R, Hall MN. TOR signaling in growth and metabolism. Cell. 2006;124:471–484. doi: 10.1016/j.cell.2006.01.016. [DOI] [PubMed] [Google Scholar]
- 5.Sarbassov DD, Ali SM, Kim DH, Guertin DA, Latek RR, Erdjument-Bromage H, Tempst P, Sabatini DM. Rictor, a novel binding partner of mTOR, defines a rapamycin-insensitive and raptor-independent pathway that regulates the cytoskeleton. Curr Biol. 2004;14:1296–1302. doi: 10.1016/j.cub.2004.06.054. [DOI] [PubMed] [Google Scholar]
- 6.Guertin DA, Sabatini DM. The pharmacology of mTOR inhibition. Science signaling. 2009;2:pe24. doi: 10.1126/scisignal.267pe24. [DOI] [PubMed] [Google Scholar]
- 7.Laplante M, Sabatini DM. mTOR signaling in growth control and disease. Cell. 2012;149:274–293. doi: 10.1016/j.cell.2012.03.017. [DOI] [PMC free article] [PubMed] [Google Scholar]
- 8.Yang Q, Inoki K, Ikenoue T, Guan KL. Identification of Sin1 as an essential TORC2 component required for complex formation and kinase activity. Genes Dev. 2006;20:2820–2832. doi: 10.1101/gad.1461206. [DOI] [PMC free article] [PubMed] [Google Scholar]
- 9.Jacinto E, Loewith R, Schmidt A, Lin S, Ruegg MA, Hall A, Hall MN. Mammalian TOR complex 2 controls the actin cytoskeleton and is rapamycin insensitive. Nat Cell Biol. 2004;6:1122–1128. doi: 10.1038/ncb1183. [DOI] [PubMed] [Google Scholar]
- 10.Thoreen CC, Kang SA, Chang JW, Liu Q, Zhang J, Gao Y, Reichling LJ, Sim T, Sabatini DM, Gray NS. An ATP-competitive mammalian target of rapamycin inhibitor reveals rapamycin-resistant functions of mTORC1. J Biol Chem. 2009;284:8023–8032. doi: 10.1074/jbc.M900301200. [DOI] [PMC free article] [PubMed] [Google Scholar]
- 11.Rosborough BR, Raich-Regue D, Matta BM, Lee K, Gan B, DePinho RA, Hackstein H, Boothby M, Turnquist HR, Thomson AW. Murine dendritic cell rapamycin-resistant and rictor-independent mTOR controls IL-10, B7-H1, and regulatory T-cell induction. Blood. 2013;121:3619–3630. doi: 10.1182/blood-2012-08-448290. [DOI] [PMC free article] [PubMed] [Google Scholar]
- 12.Sun SY. mTOR kinase inhibitors as potential cancer therapeutic drugs. Cancer Lett. 2013;340:1–8. doi: 10.1016/j.canlet.2013.06.017. [DOI] [PMC free article] [PubMed] [Google Scholar]
- 13.Rosborough BR, Raich-Regue D, Liu Q, Venkataramanan V, Turnquist HR, Thomson AW. Adenosine triphosphate-competitive mTOR inhibitors: a new class of immunosuppressive agents that inhibit allograft rejection. Am J Transplant. 2014;14:2173–2180. doi: 10.1111/ajt.12799. [DOI] [PMC free article] [PubMed] [Google Scholar]
- 14.Delgoffe GM, Pollizzi KN, Waickman AT, Heikamp E, Meyers DJ, Horton MR, Xiao B, Worley PF, Powell JD. The kinase mTOR regulates the differentiation of helper T cells through the selective activation of signaling by mTORC1 and mTORC2. Nat Immunol. 2011;12:295–303. doi: 10.1038/ni.2005. [DOI] [PMC free article] [PubMed] [Google Scholar]
- 15.Kurebayashi Y, Nagai S, Ikejiri A, Ohtani M, Ichiyama K, Baba Y, Yamada T, Egami S, Hoshii T, Hirao A, Matsuda S, Koyasu S. PI3K-Akt-mTORC1-S6K1/2 axis controls Th17 differentiation by regulating Gfi1 expression and nuclear translocation of RORgamma. Cell reports. 2012;1:360–373. doi: 10.1016/j.celrep.2012.02.007. [DOI] [PubMed] [Google Scholar]
- 16.Lee K, Gudapati P, Dragovic S, Spencer C, Joyce S, Killeen N, Magnuson MA, Boothby M. Mammalian target of rapamycin protein complex 2 regulates differentiation of Th1 and Th2 cell subsets via distinct signaling pathways. Immunity. 2010;32:743–753. doi: 10.1016/j.immuni.2010.06.002. [DOI] [PMC free article] [PubMed] [Google Scholar]
- 17.Zeng H, Yang K, Cloer C, Neale G, Vogel P, Chi H. mTORC1 couples immune signals and metabolic programming to establish T(reg)-cell function. Nature. 2013;499:485–490. doi: 10.1038/nature12297. [DOI] [PMC free article] [PubMed] [Google Scholar]
- 18.Delgoffe GM, Kole TP, Zheng Y, Zarek PE, Matthews KL, Xiao B, Worley PF, Kozma SC, Powell JD. The mTOR kinase differentially regulates effector and regulatory T cell lineage commitment. Immunity. 2009;30:832–844. doi: 10.1016/j.immuni.2009.04.014. [DOI] [PMC free article] [PubMed] [Google Scholar]
- 19.Araki K, Turner AP, Shaffer VO, Gangappa S, Keller SA, Bachmann MF, Larsen CP, Ahmed R. mTOR regulates memory CD8 T-cell differentiation. Nature. 2009;460:108–112. doi: 10.1038/nature08155. [DOI] [PMC free article] [PubMed] [Google Scholar]
- 20.Lee K, Heffington L, Jellusova J, Nam KT, Raybuck A, Cho SH, Thomas JW, Rickert RC, Boothby M. Requirement for Rictor in homeostasis and function of mature B lymphoid cells. Blood. 2013;122:2369–2379. doi: 10.1182/blood-2013-01-477505. [DOI] [PMC free article] [PubMed] [Google Scholar]
- 21.Hackstein H, Taner T, Zahorchak AF, Morelli AE, Logar AJ, Gessner A, Thomson AW. Rapamycin inhibits IL-4-induced dendritic cell maturation in vitro and dendritic cell mobilization and function in vivo. Blood. 2003;101:4457–4463. doi: 10.1182/blood-2002-11-3370. [DOI] [PubMed] [Google Scholar]
- 22.Hackstein H, Taner T, Logar AJ, Thomson AW. Rapamycin inhibits macropinocytosis and mannose receptor-mediated endocytosis by bone marrow-derived dendritic cells. Blood. 2002;100:1084–1087. doi: 10.1182/blood.v100.3.1084. [DOI] [PubMed] [Google Scholar]
- 23.Monti P, Mercalli A, Leone BE, Valerio DC, Allavena P, Piemonti L. Rapamycin impairs antigen uptake of human dendritic cells. Transplantation. 2003;75:137–145. doi: 10.1097/00007890-200301150-00025. [DOI] [PubMed] [Google Scholar]
- 24.Woltman AM, de Fijter JW, Kamerling SW, van Der Kooij SW, Paul LC, Daha MR, van Kooten C. Rapamycin induces apoptosis in monocyte- and CD34-derived dendritic cells but not in monocytes and macrophages. Blood. 2001;98:174–180. doi: 10.1182/blood.v98.1.174. [DOI] [PubMed] [Google Scholar]
- 25.Turnquist H, Raimondi G, Zahorchak AF, Fischer RT, Wang Z, Thomson AW. Rapamycin-conditioned dendritic cells are poor stimulators of allogeneic CD4+ T cells, but enrich for antigen-specific Foxp3+ T regulatory cells and promote organ transplant tolerance. J Immunol. 2007;178:7018–7031. doi: 10.4049/jimmunol.178.11.7018. [DOI] [PubMed] [Google Scholar]
- 26.Weichhart T, Costantino G, Poglitsch M, Rosner M, Zeyda M, Stuhlmeier KM, Kolbe T, Stulnig TM, Horl WH, Hengstschlager M, Muller M, Saemann MD. The TSC-mTOR signaling pathway regulates the innate inflammatory response. Immunity. 2008;29:565–577. doi: 10.1016/j.immuni.2008.08.012. [DOI] [PubMed] [Google Scholar]
- 27.Turnquist HR, Cardinal J, Macedo C, Rosborough BR, Sumpter TL, Geller DA, Metes D, Thomson AW. mTOR and GSK-3 shape the CD4+ T cell stimulatory and differentiation capacity of myeloid DC following exposure to LPS. Blood. 2010;115:4758–4769. doi: 10.1182/blood-2009-10-251488. [DOI] [PMC free article] [PubMed] [Google Scholar]
- 28.Macedo C, Turnquist HR, Castillo-Rama M, Zahorchak AF, Shapiro R, Thomson AW, Metes D. Rapamycin Augments Human DC IL-12p70 and IL-27 Secretion to Promote Allogeneic Type1 Polarization Modulated by NK Cells. Am J Transplant. 2013;13:2322–2333. doi: 10.1111/ajt.12351. [DOI] [PMC free article] [PubMed] [Google Scholar]
- 29.Ohtani M, Hoshii T, Fujii H, Koyasu S, Hirao A, Matsuda S. Cutting edge: mTORC1 in intestinal CD11c+ CD11b+ dendritic cells regulates intestinal homeostasis by promoting IL-10 production. J Immunol. 2012;188:4736–4740. doi: 10.4049/jimmunol.1200069. [DOI] [PubMed] [Google Scholar]
- 30.Brown J, Wang H, Suttles J, Graves DT, Martin M. Mammalian target of rapamycin complex 2 (mTORC2) negatively regulates Toll-like receptor 4-mediated inflammatory response via FoxO1. J Biol Chem. 2011;286:44295–44305. doi: 10.1074/jbc.M111.258053. [DOI] [PMC free article] [PubMed] [Google Scholar]
- 31.Morelli AE, Zahorchak AF, Larregina AT, Colvin BL, Logar AJ, Takayama T, Falo LD, Thomson AW. Cytokine production by mouse myeloid dendritic cells in relation to differentiation and terminal maturation induced by lipopolysaccharide or CD40 ligation. Blood. 2001;98:1512–1523. doi: 10.1182/blood.v98.5.1512. [DOI] [PubMed] [Google Scholar]
- 32.Latchman YE, Liang SC, Wu Y, Chernova T, Sobel RA, Klemm M, Kuchroo VK, Freeman GJ, Sharpe AH. PD-L1-deficient mice show that PD-L1 on T cells, antigen-presenting cells, and host tissues negatively regulates T cells. Proc Natl Acad Sci U S A. 2004;101:10691–10696. doi: 10.1073/pnas.0307252101. [DOI] [PMC free article] [PubMed] [Google Scholar]
- 33.Martin M, Rehani K, Jope RS, Michalek SM. Toll-like receptor-mediated cytokine production is differentially regulated by glycogen synthase kinase 3. Nat Immunol. 2005;6:777–784. doi: 10.1038/ni1221. [DOI] [PMC free article] [PubMed] [Google Scholar]
- 34.Androulidaki A, Iliopoulos D, Arranz A, Doxaki C, Schworer S, Zacharioudaki V, Margioris AN, Tsichlis PN, Tsatsanis C. The kinase Akt1 controls macrophage response to lipopolysaccharide by regulating microRNAs. Immunity. 2009;31:220–231. doi: 10.1016/j.immuni.2009.06.024. [DOI] [PMC free article] [PubMed] [Google Scholar]
- 35.McGeachy MJ, Chen Y, Tato CM, Laurence A, Joyce-Shaikh B, Blumenschein WM, McClanahan TK, O’Shea JJ, Cua DJ. The interleukin 23 receptor is essential for the terminal differentiation of interleukin 17-producing effector T helper cells in vivo. Nat Immunol. 2009;10:314–324. doi: 10.1038/ni.1698. [DOI] [PMC free article] [PubMed] [Google Scholar]
- 36.Gopal R, Lin Y, Obermajer N, Slight S, Nuthalapati N, Ahmed M, Kalinski P, Khader SA. IL-23-dependent IL-17 drives Th1-cell responses following Mycobacterium bovis BCG vaccination. Eur J Immunol. 2012;42:364–373. doi: 10.1002/eji.201141569. [DOI] [PMC free article] [PubMed] [Google Scholar]
- 37.Harrington LE, Mangan PR, Weaver CT. Expanding the effector CD4 T-cell repertoire: the Th17 lineage. Curr Opin Immunol. 2006;18:349–356. doi: 10.1016/j.coi.2006.03.017. [DOI] [PubMed] [Google Scholar]
- 38.Lee Y, Awasthi A, Yosef N, Quintana FJ, Xiao S, Peters A, Wu C, Kleinewietfeld M, Kunder S, Hafler DA, Sobel RA, Regev A, Kuchroo VK. Induction and molecular signature of pathogenic TH17 cells. Nat Immunol. 2012;13:991–999. doi: 10.1038/ni.2416. [DOI] [PMC free article] [PubMed] [Google Scholar]
- 39.Lin Y, Ritchea S, Logar A, Slight S, Messmer M, Rangel-Moreno J, Guglani L, Alcorn JF, Strawbridge H, Park SM, Onishi R, Nyugen N, Walter MJ, Pociask D, Randall TD, Gaffen SL, Iwakura Y, Kolls JK, Khader SA. Interleukin-17 is required for T helper 1 cell immunity and host resistance to the intracellular pathogen Francisella tularensis. Immunity. 2009;31:799–810. doi: 10.1016/j.immuni.2009.08.025. [DOI] [PMC free article] [PubMed] [Google Scholar]
- 40.Palma C, Schiavoni G, Abalsamo L, Mattei F, Piccaro G, Sanchez M, Fernandez C, Singh M, Gabriele L. Mycobacterium tuberculosis PstS1 amplifies IFN-gamma and induces IL-17/IL-22 responses by unrelated memory CD4+ T cells via dendritic cell activation. Eur J Immunol. 2013;43:2386–2397. doi: 10.1002/eji.201243245. [DOI] [PubMed] [Google Scholar]
- 41.Brown J, Wang H, Hajishengallis GN, Martin M. TLR-signaling networks: an integration of adaptor molecules, kinases, and cross-talk. J Dent Res. 2011;90:417–427. doi: 10.1177/0022034510381264. [DOI] [PMC free article] [PubMed] [Google Scholar]
- 42.LeibundGut-Landmann S, Gross O, Robinson MJ, Osorio F, Slack EC, Tsoni SV, Schweighoffer E, Tybulewicz V, Brown GD, Ruland J, Reis e Sousa C. Syk- and CARD9-dependent coupling of innate immunity to the induction of T helper cells that produce interleukin 17. Nat Immunol. 2007;8:630–638. doi: 10.1038/ni1460. [DOI] [PubMed] [Google Scholar]
- 43.Summers deLuca L, Gommerman JL. Fine-tuning of dendritic cell biology by the TNF superfamily. Nat Rev Immunol. 2012;12:339–351. doi: 10.1038/nri3193. [DOI] [PubMed] [Google Scholar]
- 44.Turnquist HR, Sumpter TL, Tsung A, Zahorchak AF, Nakao A, Nau GJ, Liew FY, Geller DA, Thomson AW. IL-1beta-driven ST2L expression promotes maturation resistance in rapamycin-conditioned dendritic cells. J Immunol. 2008;181:62–72. doi: 10.4049/jimmunol.181.1.62. [DOI] [PMC free article] [PubMed] [Google Scholar]
- 45.Wang Y, Huang G, Zeng H, Yang K, Lamb RF, Chi H. Tuberous sclerosis 1 (Tsc1)-dependent metabolic checkpoint controls development of dendritic cells. Proc Natl Acad Sci U S A. 2013;110:E4894–4903. doi: 10.1073/pnas.1308905110. [DOI] [PMC free article] [PubMed] [Google Scholar]
- 46.Haidinger M, Poglitsch M, Geyeregger R, Kasturi S, Zeyda M, Zlabinger GJ, Pulendran B, Horl WH, Saemann MD, Weichhart T. A versatile role of mammalian target of rapamycin in human dendritic cell function and differentiation. J Immunol. 2010;185:3919–3931. doi: 10.4049/jimmunol.1000296. [DOI] [PubMed] [Google Scholar]
- 47.Jagannath C, Lindsey DR, Dhandayuthapani S, Xu Y, Hunter RL, Jr, Eissa NT. Autophagy enhances the efficacy of BCG vaccine by increasing peptide presentation in mouse dendritic cells. Nat Med. 2009;15:267–276. doi: 10.1038/nm.1928. [DOI] [PubMed] [Google Scholar]
- 48.Agrawal S, Gupta S, Agrawal A. Human dendritic cells activated via dectin-1 are efficient at priming Th17, cytotoxic CD8 T and B cell responses. PloS one. 2010;5:e13418. doi: 10.1371/journal.pone.0013418. [DOI] [PMC free article] [PubMed] [Google Scholar]
- 49.Ohtani M, Nagai S, Kondo S, Mizuno S, Nakamura K, Tanabe M, Takeuchi T, Matsuda S, Koyasu S. Mammalian target of rapamycin and glycogen synthase kinase 3 differentially regulate lipopolysaccharide-induced interleukin-12 production in dendritic cells. Blood. 2008;112:635–643. doi: 10.1182/blood-2008-02-137430. [DOI] [PMC free article] [PubMed] [Google Scholar]
- 50.Szydlowski M, Jablonska E, Juszczynski P. FOXO1 transcription factor: a critical effector of the PI3K-AKT axis in B-cell development. Int Rev Immunol. 2014;33:146–157. doi: 10.3109/08830185.2014.885022. [DOI] [PubMed] [Google Scholar]
- 51.O’Garra A, Murphy KM. From IL-10 to IL-12: how pathogens and their products stimulate APCs to induce T(H)1 development. Nat Immunol. 2009;10:929–932. doi: 10.1038/ni0909-929. [DOI] [PubMed] [Google Scholar]
- 52.Yoshitomi H, Sakaguchi N, Kobayashi K, Brown GD, Tagami T, Sakihama T, Hirota K, Tanaka S, Nomura T, Miki I, Gordon S, Akira S, Nakamura T, Sakaguchi S. A role for fungal {beta}-glucans and their receptor Dectin-1 in the induction of autoimmune arthritis in genetically susceptible mice. J Exp Med. 2005;201:949–960. doi: 10.1084/jem.20041758. [DOI] [PMC free article] [PubMed] [Google Scholar]
Associated Data
This section collects any data citations, data availability statements, or supplementary materials included in this article.