

Abstract
Oxygen status and tissue dimensionality are critical determinants of tumor angiogenesis, a hallmark of cancer and an enduring target for therapeutic intervention. However, it is unclear how these microenvironmental conditions interact to promote neovascularization, due in part to a lack of comprehensive, unbiased data sets describing tumor cell gene expression as a function of oxygen levels within three-dimensional (3D) culture. Here, we utilized alginate-based, oxygen-controlled 3D tumor models to study the interdependence of culture context and the hypoxia response. Microarray gene expression analysis of tumor cells cultured in 2D versus 3D under ambient or hypoxic conditions revealed striking interdependence between culture dimensionality and hypoxia response, which was mediated in part by pro-inflammatory signaling pathways. In particular, interleukin-8 (IL-8) emerged as a major player in the microenvironmental regulation of the hypoxia program. Notably, this interaction between dimensionality and oxygen status via IL-8 increased angiogenic sprouting in a 3D endothelial invasion assay. Taken together, our data suggest that pro-inflammatory pathways are critical regulators of tumor hypoxia response within 3D environments that ultimately impact tumor angiogenesis, potentially providing important therapeutic targets. Furthermore, these results highlight the importance of pathologically relevant tissue culture models to study the complex physical and chemical processes by which the cancer microenvironment mediates new vessel formation.
1. Introduction
In tumors, spatiotemporal depletion of oxygen (hypoxia) due to excessive cell proliferation and dysfunctional vasculature elevates angiogenic signaling and tumor angiogenesis [1]. More specifically, hypoxia activates a response program largely controlled by the stabilization of the transcription factor hypoxia inducible factor-1 (HIF-1) [2]. As a consequence of HIF signaling, the up-regulation of pro-angiogenic morphogens, including vascular endothelial growth factor (VEGF), basic fibroblast growth factor (bFGF), and interleukin-8 (IL-8), activates the ‘angiogenic switch’ necessary for new vessel growth [3, 4]. However, microenvironmental conditions other than hypoxia also modulate the pro-angiogenic capability of tumors [5–7]. For example, changes in tissue dimensionality and integrin engagement can activate nuclear factor-κB (NF-κB) and activator protein-1 (AP-1) transcription factors, which regulate the expression of IL-8 and VEGF [8, 9]. Additionally, varied matrix architecture, cell morphology, and substrate mechanics broadly affect tumor cell phenotype as thoroughly reviewed elsewhere [10–12]. Nevertheless, how interactions between hypoxia and tissue dimensionality regulate tumor vascularization is poorly understood, due in part to a lack of comprehensive, unbiased data sets describing tumor cell gene expression as a function of these individual and combined parameters.
To generate such data sets, it will be critical to separate the effects of hypoxia and tissue dimensionality in 3D tumor models. Given that growth in conventional 3D culture systems inevitably leads to heterogeneous oxygen distributions and resulting cellular phenotypes, it is challenging to distinguish these parameters [13, 14]. Because gene expression changes are typically determined as population averages, most 3D models preclude the association of culture context-dependent expression profiles to a specific oxygen level. Conventional studies in 2D monolayer culture are not subject to transport challenges, and oxygen levels can be readily manipulated by placing cultures in oxygen-controlled incubators. Yet, this approach does not recapitulate the 3D microenvironmental conditions that may alter tumor cell phenotypes. For example, hypoxia and the resulting oxidative stress is necessary to stimulate IL-8/NF-κB signaling in 2D culture, whereas this signaling axis is constitutively active in 3D [15]. Accordingly, we have previously shown that hypoxia upregulates secretion of IL-8 in 2D, while causing an opposite effect in 3D culture [15]. Hence, pathologically relevant culture conditions that allow independent control of oxygen levels in relevant 3D culture contexts may provide new insights regarding the role of tissue dimensionality in guiding hypoxia-related tumor cell responses.
Biomaterials-based in vitro models are increasingly employed to study the role of tissue dimensionality in tumorigenesis [16–23]. We recently developed an alginate-based oxygen-controlled, 3D culture system with which we circumvented the challenges of diffusion-limited mass transport to control oxygen concentrations [15]. Fabrication of thin (200 μm) hydrogel-based scaffolds relieved interior oxygen depletion, allowing us to create homogeneous O2 levels within the 3D matrix [15]. Here, we used this model to distinguish the independent and co-dependent effects of dimensionality and oxygen tension in regulating the tumor hypoxia response and angiogenesis. More specifically, we determined gene expression profiles of tumor cells cultured in 2D and 3D under uniform hypoxic or normoxic conditions via microarray analysis. We validated the results for molecules of interest by RT-PCR and ELISA, and we confirmed their relevance across multiple tumor cell lines and with patient data. Finally, using a 3D model of endothelial cell invasion, we evaluated the functional consequences of 3D culture and oxygen conditions on sprouting angiogenesis. Insights gained from these studies may advance our understanding of tumor angiogenesis and identify routes toward more effective therapy.
2. Materials and Methods
Cell Culture
Cell lines used in this study included human oral squamous cell carcinoma (OSCC)-3 (gift from Peter Polverini, University of Michigan), A549 lung carcinoma, KATO-III gastric signet ring carcinoma, and MDA-MB231 breast cancer cells (all from ATCC). Tumor cells were cultured in Dulbecco’s modified eagle medium (DMEM, Gibco), supplemented with 10% fetal bovine serum (20% for KATO-III), and 1% penicillin-streptomycin (P/S). In addition, human umbilical vein endothelial cells (HUVEC, Lonza) at low passage (p < 6) were cultured in Bio-Whittaker medium 199 (M199, Lonza), supplemented with endothelial cell growth supplement (ECGS, Millipore, Billerica, MA), 20% FBS, 1% P/S, 2 mM Glutamax, and 5 U/mL heparin.
Preparation of Alginate Discs
Microfabricated alginate hydrogels (4% wt/vol) were used for 3D tumor cell culture, as previously described [15]. Briefly, cells were suspended in alginate (Protanal LF, FMC Biopolymer, Philadelphia, PA) at 20 × 106 cells/mL. The cell-laden gel was cast in a Plexiglass mold (4 mm diameter, 200 μm deep to ensure uniform O2 concentration) and cross-linked with 60 mM calcium chloride (CaCl2) solution for 15 minutes. Alginate disks were cultured in 24-well plates (one disk per well) on an orbital shaker for 6 days in the appropriate media at 37° C and 5% CO2. Oxygen levels were set to either hypoxic (1%) or ambient (17 %) O2 in a controlled atmosphere incubator (ThermoFisher Scientific, Inc., Waltham, MA). Media was changed every 48 hours.
Endothelial Invasion Assays
Collagen-based microwell invasion assays were fabricated as previously described [24]. Briefly, PDMS microwells (200 μm deep, 4 mm diameter; Dow Corning, Midland, MI) were fabricated by soft-lithography against an SU-8 mold. The PDMS surface was pre-treated with 1% poly(ethyleneimine) (PEI; Aldrich Chemical, St. Louis, MO) and 0.1% glutaraldehyde (GA; Fischer Scientific, Fair Lawn, NJ) for 10 minutes and 20 minutes, respectively, and washed thoroughly with sterile water. Stock solutions of 1.5% (wt/vol) type I rat tail collagen in 0.1% acetic acid were osmotically balanced (9:1) with 10x concentrated M199 media, neutralized with 1N sodium hydroxide (NaOH), and diluted to 0.8% (wt/vol) for mono-culture assays. For co-culture invasion assays, tumor cells were suspended in 0.68% collagen gel at a density of 10 million cells/mL. The collagen gel was then cast onto the PDMS microwell mold and cross-linked for 15 minutes at 4 °C, followed by 15 minutes at 37°C. HUVECs were seeded at 300 cells/mm2 on the collagen surface and cultured in HUVEC invasion media at ambient O2, 5% CO2, and 37°C. For invasion assays, HUVEC growth media was spiked with 1% [v/v] L-ascorbic acid (50 μg/mL; Acros Organics, Morris Plains, NJ), and 0.16% [v/v] tetradecanoyl phorbol acetate (TPA; 50 ng/mL; Cell Signaling Technology Inc., Danvers, MA) to sensitize endothelial cells. In mono-culture experiments, recombinant human IL-8 (GenScript, Piscataway, NJ) and VEGF (R&D Systems, Minneapolis, MN) was added at 40 ng/mL, and their respective inhibitors were added at 200 ng/mL in co-culture experiments (both from R&D Systems). Co-culture invasion assay media also contained 40 ng/mL basic fibroblast growth factor (bFGF, Invitrogen, Carlsbad, CA). After three days, gels were fixed in 10% formalin and stained with 4′,6-diamidino-2-phenylindole (DAPI), phalloidin (Alexa Fluor 568; Invitrogen), and a combination of mouse anti-human CD31 (BD Biosciences, San Jose, CA) with goat anti-mouse IgG (Alexafluor 488, Invitrogen). Imaging was performed by confocal microscopy (Zeiss 710, Carl Zeiss, Inc., Thornwood, NY) at 250x magnification for a 0.46 mm2 area and z-slices up to 40 μm depth. Images were analyzed using ImageJ software by counting the number of CD31+ cell invasions extending beyond 12 μm (~3 slices) from the surface.
Microarray Processing
Total RNA from cells was isolated by using TRIzol (Invitrogen) according to manufacturer’s instructions. A one-round in vitro transcription (IVT) RNA Amplification Kit was used to amplify 1.5 micrograms of total RNA. The cDNA was synthesized with a primer containing oligo (dT) and T7 RNA polymerase promoter sequences. Double-stranded cDNA was then purified and used as a template to generate biotinylated cRNA. The quantity and quality of the amplified cRNA was assessed using NanoDrop ND-1000 Spectrophotometer (Thermo Scientific, Wilmington, DE) and Agilent Bioanalyzer (Santa Clara, CA). The biotin labeled cRNA was fragmented and hybridized to the Affymetrix ChIP kit (Genechip Human Genome U133 plus 2.0) (Santa Clara, CA) for analysis of over 39,000 transcripts on a single array. After hybridization, GeneChip arrays were washed, stained, and scanned by GeneChip Scanner 3000 7G according to the Affymetrix Expression Analysis Technical Manual.
Affymetrix GeneChip Operating Software was used for image acquisition. The target signal intensity from each chip was scaled to 500. The data normalization, statistical analysis, and pattern study were performed with GeneSpring GX 12.6.1 software. Pathway and functional analyses were generated through the use of IPA (Ingenuity® Systems, www.ingenuity.com).
Confirmation of Microarray Results by ELISA and qRT-PCR
Secreted protein levels were measured by ELISA (R&D Systems) following 24 hours of culture in serum-free media, according to the manufacturer instructions. Cells were released by dissolving alginate disks with ethylenediaminetetraacetic acid (EDTA) and lysed in Caron’s buffer. DNA content of cell lysates was fluormetrically measured with Quant-iT PicoGreen dsDNA reagent (Invitrogen) and used to normalize secretion levels. To determine changes at the transcriptional level, total RNA was harvested from isolated cells using TRIzol. Reverse-transcription of 1 μg to cDNA (qScript cDNA supermix, Quanta BioSciences, Gaithersburg, MD) was performed with random hexamer and IL-8 specific oligo(dt) primers, followed by qRT-PCR using SYBR green detection (Quanta Biosciences) and an Applied Biosystems 7500 system. Quantification was normalized relative to β-actin using the ΔΔCt method.
Statistical Analysis
Chip data raw intensity files (.cel) that were processed using the RMA algorithm were imported into the GeneSpring GX 12.6.1 program (Agilent Technologies, Foster City, CA). Signal values <0.01 were set to 0.01, arrays were normalized to the 20th percentile, and individual genes normalized to the median. A one-way analysis of variance (ANOVA) with a corrected asymptotic p-value of <0.05 for significant differential gene expression and a p-value of < 0.0001 for pathway analysis was performed comparing OSCC3 cells grown under the following conditions: 3D matrix in 1% O2, 2D matrix in 1% O2, 3D matrix in 17% O2, and 2D matrix in 17% O2. Multiple Testing Correction (Benjamini-Hochberg) was performed and a threshold of greater than 2.0-fold differences was applied to determine potential differential expression. A post-hoc test using the Student-Newman Keuls (SNK) method was also applied. Data were imported into Ingenuity Pathway Analysis software (Ingenuity Systems, Redwood City, CA) for molecular pathway analysis using a 2.5 fold change filter.
ELISA, RT-PCR, and invasion assays were compared using Fisher’s T-test. All experiments were performed in triplicate (N=3). Results are presented as mean +/− the standard deviation.
Clinical Gene Expression Analysis
Oncomine® Research Edition (Thermo Fisher Scientific; www.oncomine.org) was used to identify clinical microarray data sets comparing gene expression in cancer versus normal tissue. A search for IL-8 (CXCL8) by mRNA data type with a p-value threshold of 0.001 and fold change cut-off of 2.0 was applied, with no filter for gene rank. Differential expression was evaluated by a two-sample t-Test of log2-transformed median-centered intensity values.
3. Results
Dimensionality and oxygen status interdependently regulate tumor cell gene expression
In order to determine the interdependent effect of hypoxia and dimensionality on gene expression, microarray analysis of 46803 gene transcripts was performed on OSCC3 cells cultured in a 2D monolayer on conventional tissue culture polystyrene or encapsulated within microfabricated alginate discs after 6 days. OSCC-3 cells were chosen as representative of an aggressive tumor whose highly vascular nature may result from a latent relationship between oxygen depletion and dimensionality. The 3D discs were microfabricated at 200 μm thickness (Fig 1A), allowing uniform control of intra-scaffold oxygen concentration by incubation at either hypoxic (1% O2) or ambient (normoxic, 17% O2) conditions. Homogeneous oxygen transport was previously predicted by finite element models incorporating oxygen diffusion and cellular consumption and confirmed by histological analysis [15]. Principle component analysis of gene expression assays performed on 2D and 3D samples from normoxic or hypoxic cultures (Fig 1B) showed a consistent clustering of samples within each treatment, as well as maximum disparity between groups along each axis (Fig 2A). This data distribution affirms that cells in each condition exhibited a unique and reproducible expression profile.
Figure 1. Experimental design to compare 2D versus 3D hypoxic response.

A) Schematic illustrating the fabrication of microscale alginate scaffolds. Cells were suspended within alginate and cast onto an array of 200 μm-deep × 4 mm-diameter wells. CaCl2 solution was applied through a filtration membrane to crosslink the gels. Scaffolds were removed from the mold and cultured in suspension.
B) Experimental design comprised culturing OSCC-3 cells on conventional tissue culture polystyrene (2D) or embedded within microfabricated alginate discs (3D) inside ambient (17% O2) or hypoxic (1% O2) incubators for 6 days. Subsequently, total RNA was isolated and transcriptional changes analyzed by Affymetrix GeneChip microarray.
Figure 2. Global changes in gene expression induced by hypoxia or dimensionality.

A) Principle component analysis of the microarray data was performed using GeneSpring GX 12.6.1 software. Clustering of each substrate and oxygen level indicated the reliability of each treatment to generate independent and self-consistent gene expression profiles.
B) The Venn diagram displays genes that were associated with changes in dimensionality and/or oxygen status. Intersections between various groups indicate populations of genes that are significantly altered (fold-change > 2, corrected p-value < 0.05) in multiple comparisons of oxygen treatment or substrate dimension. Most of the changes in expression were linked with both dimensionality and oxygen status (sum of regions denoted “a”), indicating an intimate interdependence in gene regulation associated with these conditions.
C) The scatterplot of the 3D hypoxia vs normoxia (y-axis) and 2D hypoxia vs normoxia (x-axis) shows the magnitude (FC: fold change) and direction (↑ and ↓: up- and down-regulation, respectively) of gene expression changes. This plot depicts a large cluster of genes (2563 genes, blue) for which the hypoxic response is differentially regulated (greater than 2-fold change) depending on substrate dimension.
In total, 29866 genes satisfied the corrected p-value criteria (p < 0.05), and 8637 genes were identified based on a response to hypoxia and/or dimensionality by a relative fold-change greater than 2. The populations of genes associated with each comparison are provided in the Venn diagram in Fig 2B. We begin by noting that interaction between oxygen status and dimension played a role in the transcription of 77% of genes (6653 genes, denoted “a”). Only one fifth of oxygen-sensitive genes were independent of dimensionality: the expression of 19% of genes (1592 genes, denoted “b”) occupy the intersection of the blue (1% vs. 17% in 3D) and green (1% vs. 17% in 2D) ovals, but were unaffected by changes in dimensionality at either hypoxic (red oval) or normoxic (orange oval) conditions. Furthermore, merely 5.6% (392 genes, denoted “c”, intersection of red and orange ovals) of dimension-associated genes were not also affected by oxygen concentration. Surprisingly, the majority (66%, 4558 genes, denoted “x”) of hypoxia-associated genes were unique to either 2D or 3D culture; only 34% (2316 genes, denoted “y”) were similarly regulated by hypoxia in both substrate conditions. Likewise, only 19% (838 genes, denoted “z”) of genes regulated by substrate dimension were shared in both low- and high-oxygen conditions. Notably, dimensionality affected a larger number of genes in hypoxia (3093 genes, sum of red oval) than in normoxia (2230 genes, sum of orange oval), suggesting that the hypoxia response depended strongly on whether cells were cultured under 2D or 3D conditions. Specifically, hypoxia may have sensitized cells to respond to changes in dimensionality, or conversely, changes in dimensionality may have sensitized cells to hypoxia. Altogether, this data suggests a strong interdependence between oxygen status and dimensionality at the gene expression level.
Although the Venn diagram identified populations of genes that respond to 3D context and oxygen concentration, the direction and magnitude of regulation are also important. In order to more clearly define these parameters, we generated a scatter plot of the relative fold change (FC) expression levels in response to hypoxia in 2D and 3D culture (Fig 2C). Changes in gene expression were ranked by the magnitude of the residual (3D FC/2D FC), and a total of 2563 genes were identified that exhibited a differential response to hypoxia greater than 2-fold in 2D versus 3D culture (blue data points). Of the genes that responded differently in 2D versus 3D hypoxia, 12% (317 genes, purple quadrants) exhibited an inversion of expression, 28% (714 genes, yellow quadrants) produced an exaggerated up- or down-regulation, and the remaining 60% (1536 genes, grey background) were regulated by hypoxia in one context but not the other. The subset of genes displaying a differential regulation of hypoxia response based on 2D or 3D substrate became the subject of subsequent analysis in the link between hypoxia and dimensionality.
Interactions between hypoxia and dimensionality regulate pro-inflammatory response pathways
Ingenuity Pathways Analysis software was used to identify biofunctional signaling networks that were associated with the differential changes in gene expression for the 3D versus 2D hypoxia response. Data for this analysis used a gene list of 11,828 entities satisfying a p-value < 0.0001 and a FC cut-off of 2.0; data was further filtered in IPA to a FC threshold of 2.5. In order to identify divergence between the 2D and 3D hypoxia response, we performed an analysis of the changes in gene expression in response to both oxygen status and substrate dimension. Not surprisingly, top ranked networks were associated with traditional cancer motifs, which are known to depend on hypoxia and 3D, including cell cycle, DNA replication, cell death and survival, cell signaling, cell growth and proliferation, and cancer (Fig 3A). Top ranked networks from the individual comparisons are listed in Supplementary Table 1. In most cases, these networks were also highly ranked in the individual comparisons between each of the four conditions (2D 1% vs 17%; 3D 1% vs 17%; 1% 2D vs 3D; 17% 2D vs 3D; supplementary table 1). Interestingly, the pro-inflammatory response was highly ranked in the meta-comparison (Fig 3A), and also emerged among the top biofunctions in the 3D 17% vs 2D 17% and the 3D 1% vs 3D 17% comparisons (Supplementary Table 1). This result suggests that pro-inflammatory signaling is one of the top functions linked to both substrate dimension and oxygen status.
Figure 3. Inflammatory signaling may underlie the differential hypoxic response in 3D.

A) Ingenuity’s Global Functional Analysis was used to evaluate functional networks from the gene expression data. Top ranked networks were identified based on the connectivity of focus genes in the Global Molecular Network in the Ingenuity Pathways Knowledge Base, and the score, calculated as the -log10(p-value) of the network emerging by chance, indicates the statistical improbability of a false positive result.
B) Ingenuity’s Global Canonical Pathways tool was used to associate changes in gene expression with known signaling processes. The p-value was calculated based on the number of focus genes compared to a reference set for each pathway, and the ratio represents the fraction of focus genes identified in each pathway. Top ranked canonical pathways were largely linked to inflammatory processes, suggesting that these pathways are differentially regulated by the culture environment.
C) When ranked by fold change in expression, five of the top ten genes were associated with inflammatory signaling (outlined in red). The fold-change value represents the difference in the hypoxia-induced expression in 3D versus 2D.
Next, we identified the top signaling pathways associated with each treatment by comparing the expression profiles to canonical responses; several metabolic and cell cycle signaling cascades emerged as prominent features of this analysis (Fig 3B, Supplementary Table 2). Looking at the divergence between the 2D and 3D hypoxia response, we observed that leukocyte trafficking signaling, as well as interferon signaling and pattern recognition receptor (PRR) activity, emerged as top ranked pathways (Fig 3B). The differential regulation of these pro-inflammatory pathways in 3D versus 2D is consistent with the network analysis described above.
Finally, we investigated the integrated effects of culture dimensionality and hypoxia on the transcription of individual genes (Fig 3C, Supplementary Tables 3–4). In accord with the network and pathways analyses, we observed that several of the top regulated genes (PLAT, IL-8, CXCL1, and TFAIP6) were associated with pro-inflammatory signaling (Fig 3C, red boxes). Taken together, this analysis suggests that the differential regulation of hypoxic signaling in 2D versus 3D culture has significant consequences for pro-inflammatory signaling at the network, pathway, and molecular level.
Validation of IL-8 expression and secretion confirms regulation of pro-inflammatory signaling in 3D
Because IL-8 was prominently regulated by the integrated effects of hypoxia and dimensionality at both the individual gene (Fig 3C) and canonical pathway level (Fig 3B), and because IL-8 has pleiotropic effects on inflammation and angiogenesis [25–27], we chose to pursue this molecule as a representative candidate for further investigation. Interestingly, IL-8 was one of 214 genes affected by all four combinations of oxygen status and dimensionality, and also one of 351 genes that exhibited an inverted hypoxia response depending on culture dimension. Specifically, IL-8 expression was increased in 2D hypoxia but reduced in 3D hypoxia, compared to the respective expression under ambient conditions. Moreover, IL-8 was the most strongly up-regulated molecule in 3D culture compared to 2D culture at 17% O2 (Supplementary Table 3). Indeed, the changes in IL-8 transcription detected via microarray analysis were relevant as quantitative RT-PCR and ELISA analysis similarly confirmed the direction and magnitude of regulation of IL-8 in response to hypoxia in 2D and 3D culture (Fig 4A–B). Most importantly, IL-8 was expressed and secreted at significantly higher levels in 3D vs. 2D culture independent of oxygen concentration. These changes were not specific to the OSCC-3 cell line used for the initial investigations, but also applied to three additional human epithelial tumor cell lines: A549 alveolar basal adenocarcinoma, KATO-III gastric carcinoma, and MDA-MB231 breast carcinoma. Each of these cell lines similarly demonstrated a robust up-regulation of IL-8 in normoxic 3D versus 2D culture (Fig 5A–B). These results reaffirm that 3D microenvironmental conditions can regulate IL-8 and that the microarray results are not an artifact of one particular cell line.
Figure 4. Microenvironmental control of IL-8 signaling confirmed by qPCR and ELISA.
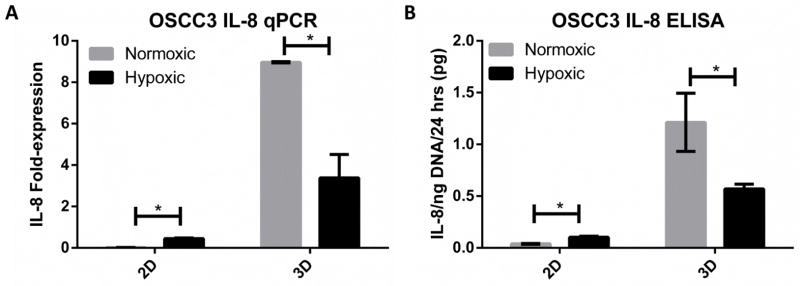
A–B) Fold-change in mRNA transcription and protein secretion of IL-8 by qPCR (A) and ELISA (B) between normoxia (17% O2) and hypoxia (1% O2) for 2D and 3D cultures. Interaction between hypoxia- and dimensionality-associated changes in IL-8 gene expression were validated at the mRNA transcription and protein secretion levels by qPCR (A) and ELISA (B), respectively. IL-8 expression was constitutively increased in 3D environments compared to 2D monolayers, but hypoxia produced an inverted effect on IL-8 activity depending on substrate dimension.
Figure 5. Relevance of 3D up-regulation of IL-8 across additional epithelial tumor cell lines.
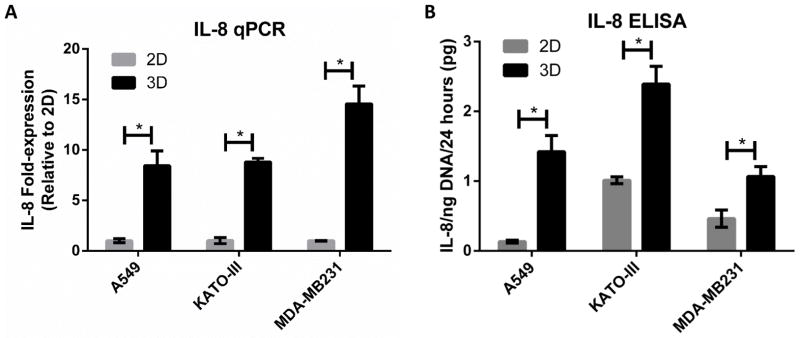
A–B) Fold-change in mRNA transcription and protein secretion levels of IL-8 was measured by qPCR (A) and ELISA (B), respectively, for 2D and 3D cultures of three cell lines (A549 lung carcinoma, KATO-III gastric carcioma, and MDA-MB231 mammary gland/breast adenocarcinoma). 3D up-regulation of IL-8 was consistent across 3 additional tumor cell lines under normoxic conditions.
Finally, we confirmed the clinical relevance of IL-8 up-regulation in tumors using bioinformatics. Oncomine® software retrieved 370 unique microarray analyses of IL-8 gene expression in cancer versus normal samples. Of these, 54 datasets and 12 different cancer types demonstrated IL-8 over-expression based on the utilized search criteria (p-value <0.001; FC > 2), including ductal breast carcinoma (FC = 4.86) [28], gastric cancer (FC = 11.6) [29], squamous cell lung carcinoma (FC = 2.1) [30], and oral squamous cell carcinoma (FC = 20.3) [31] (Supplementary Fig 1A). An additional 24 analyses indicated IL-8 down-regulation in tumor vs. normal tissue, including 10 leukemia, 7 lymphoma, and 2 sarcoma datasets (Supplementary Fig 1B). Collectively, these data imply that our studies are clinically relevant for tumors of epithelial origin, but not for hematopoietic cancers or sarcomas.
Pro-inflammatory signals in the 3D environment may promote angiogenesis via IL-8 and VEGF interaction
Next, we examined the relevance of microenvironmentally-induced IL-8 on tumor angiogenesis. To this end, we used a microwell invasion assay to evaluate the direct interactions between tumor and endothelial cells within a 3D culture environment.
The microwell assay comprised remodelable type I collagen molded to the same dimensions as the alginate discs, but confined within a PDMS template to prevent gel contraction (Fig 6A). We previously confirmed that culturing OSCC-3 in 3D collagen disks similarly upregulated IL-8 [15], but the assay used here additionally allowed the seeding of HUVECs on the surface of the culture conditions (Fig 6B). In the mono-culture assay, IL-8 and VEGF were added exogenously to the media, either alone or in combination. While IL-8 has previously been reported to exert direct pro-angiogenic effects [32, 33], our results suggest that exogenous IL-8 alone exhibits no effect on endothelial cell invasion. However, in the presence of VEGF, IL-8 synergistically enhances sprouting, suggesting that interactions with VEGF are necessary for IL-8 to modulate endothelial cell behavior (Fig 6C). Likewise, inhibition of either IL-8 or VEGF in the co-culture assay showed significant reduction in sprouting; combined inhibition of both molecules showed no additional benefits (Fig 6D). These results indicate a direct functional consequence of the 3D culture environment in regulating tumor hypoxia response and neovascularization as a function of increased IL-8 levels.
Figure 6. Synergistic IL-8 and VEGF interactions promoted endothelial cell sprouting.

A) A custom, 3D microwell invasion assay used to evaluate endothelial cell invasion into collagen gels in mono- or co-culture with tumor cells. Schematic illustrates the microwell design, in which HUVECs were seeded on the gel surface and tumor cells were embedded within the matrix. A PDMS mold confined the gel to prevent contraction.
B) Representative micrographs of a co-culture invasion assay showing a series of z-slices and the xz cross-section. Cells were labeled with DAPI (nuclear, blue), phalloidin (actin, red), and CD31 (endothelial-specific marker, green). Scale bar = 50 μm.
C–D) Endothelial cell sprouting was evaluated by counting the number of CD31+ invasions extending beyond 12 μm from the gel surface. Results from the monoculture invasion assay show no induction of sprouting with the addition of exogenous IL-8 or VEGF alone, but the combination of both factors exhibited synergistically enhanced number of invasions (C). Likewise, co-culture invasion assays containing OSCC-3 cells within the collagen bulk demonstrated sprout inhibition through function-blocking antibodies for either IL-8 (anti-IL-8) or VEGF (anti-VEGF), possibly by preventing this interaction (D).
4. Discussion
Microenvironmental conditions are critical determinants of tumor angiogenic capability; however, due to a lack of unbiased gene expression data sets helping to delineate the effects of tissue dimensionality and oxygen status, it is unclear how these conditions interact to regulate neovascularization. In order to evaluate the interdependence between tissue culture environment and the hypoxia response, we used custom biomaterials-based assays to control oxygen concentrations within 3D cell-laden alginate scaffolds. A comprehensive microarray analysis revealed profound coupling between culture dimensionality and hypoxia response, which was mediated in part by pro-inflammatory signaling pathways. In particular, IL-8 emerged as a major component of the microenvironmental regulation of the hypoxic program with important functional consequences on endothelial sprouting in a 3D invasion assay. Taken together, our results highlight the importance of pathologically relevant tissue culture models to study complex biological processes such as hypoxia-related cell responses and tumor angiogenesis.
We maintained homogeneous oxygen-concentration by fabricating 200 μm alginate discs, which alleviated the depletion of oxygen typically found beyond 150 μm from the surface. Although we cannot exclude that subcellular level oxygen variations may exist in this model, it has demonstrated stable, uniform conditions throughout the culture period at the cellular scale [15]. We used this platform to conduct a comprehensive microarray analysis of gene expression for cells cultured in 2D, or in 3D alginate discs, subjected to hypoxic (1% O2) or normoxic (17% O2) conditions.
Results from the microarray analysis revealed a striking interdependence between oxygen status and culture dimensionality. Of the 8637 genes that responded to dimension or oxygen conditions by greater than 2-fold change, 77% were co-regulated rather than independent. Similarly, we found that changes in gene expression induced by hypoxia varied greatly based on its 2D or 3D substrate, and genes regulated by dimensionality also depended on oxygen status. In total, 2563 genes were found to be differentially expressed by greater than 2-fold change. These results support the conclusion that the change in dimensionality had a strong effect on cells’ biological response to low oxygen conditions, and vice versa. Therefore, the intimate coupling of mass transport and 3D culture is both a physically and biologically relevant problem.
Our results are consistent with previous efforts to characterize the effects of oxygen deprivation in 3D using spheroid models and biomaterials-based approaches. For example, the rate of osteogenic differentiation of adipose stem cells in response to low oxygen conditions has been reported to change in 3D poly(lactide-co-glycolide) (PLG) scaffolds compared to 2D polystyrene [34]. Likewise, we previously reported that secretion of VEGF and IL-8 depends on both 3D environment and oxygen status [15]. On the other hand, our results contrast with a recent proteomic study comparing 11 different tumor cell lines cultured in 2D monolayers and 3D spheroids under ambient or hypoxic conditions [35], in which the authors concluded that changes due to oxygenation in 2D are predominantly similar in 3D. This disparity may be due to the method of acquiring and analyzing data. Whereas the previous study was designed to identify the top similarities between various treatments and across multiple cell lines at the protein level, our study specifically examined top differences in each condition at the gene expression level. In both cases, careful validation for individual molecules of interest should be performed when interpreting high-throughput data.
Our next task was to identify which genes were most affected by dimensionality and hypoxia. Not surprisingly, Ingenuity pathway analysis revealed significant regulation of cell cycle, cancer, cell growth and proliferation, and cell death and survival in individual comparisons between each of the four conditions. These are known consequences of both hypoxic and 3D culture conditions [36]. Divergence in the 3D versus 2D hypoxia response was associated with a pro-inflammatory phenotype at the network, pathway, and molecular levels, suggesting that this process is equally sensitive to the culture environment. Together, this supports the conclusion that pro-inflammatory signals are closely linked to the differential regulation of hypoxic signaling in 2D and 3D culture. These results are consistent with a recent study focusing on IL-6/pSTAT signaling, which similarly suggested that the 3D tissue context can regulate pro-inflammatory potential [37]. Collectively, these data imply an important role of the environment in regulating pro-inflammatory processes.
The interdependence between hypoxia and dimensionality was particularly striking in the regulation of IL-8. In the microarray analysis, IL-8 was one of 214 genes affected by all four combinations of oxygen status and dimensionality, and also one of 351 genes that exhibited an inverted hypoxia response depending on culture dimension. IL-8 was strongly up-regulated in 3D culture compared to 2D culture in both 1% and 17% O2. On the other hand, IL-8 levels were increased in 2D hypoxia but reduced in 3D hypoxia, compared to the respective ambient expression. This observation supports previous reports of microenvironmental regulation of IL-8 [15]. Furthermore, we confirmed the 3D-mediated up-regulation of this cytokine in a panel of three additional tumor cell lines derived from lung, breast, and gastric epithelial tissue, suggesting relevance of microenvironmentally-regulated IL-8 signaling in multiple disease types. Nevertheless, cell lines are crude models of cancer [38, 39], and in vivo studies are typically used to confirm pathological relevance. Indeed, we have previously shown that in vitro changes of IL-8 secretion in response to culture dimensionality and integrin engagement are physiologically relevant as similar differences were detected in vivo [21]. Additionally, clinical gene expression data sets obtained from Oncomine® database confirm that solid tumors exhibit elevated IL-8 signaling relative to normal tissue in 54 of 370 patient studies, including breast, gastric, lung, and oral carcinoma. These clinical findings are consistent with the elevated IL-8 protein content in non-small cell lung carcinoma, uterine endometrial carcinoma, gastric carcinomas, and astrocytomas [40–43]. Collectively, these results suggest that IL-8 may play a critical role in coordinating the interactions between hypoxia and dimensionality in the tumor microenvironment.
Given that culture dimensionality regulated tumor cell hypoxia response, which, in turn, impacts tumor angiogenesis [4], we next explored the functional consequences of these changes on endothelial cell behavior. Results from both the mono-culture and co-culture inhibition studies suggest that IL-8 alone is not sufficient to induce angiogenic sprouting, but that IL-8 synergistically enhances VEGF-mediated sprouting angiogenesis. In the past, IL-8 has been described as a direct modulator of endothelial cell behavior, but these studies were performed with VEGF-containing culture media [25]. Moreover, increased IL-8 signaling has been clinically correlated with elevated angiogenesis for nonsmall cell lung carcinoma patients [32], gastric cancer [41], and uterine endometrial cancers [42], although this observation was not found for hepatocellular carcinoma patients [44, 45]. Furthermore, resistance to VEGF-based anti-angiogenic therapies can activate compensatory IL-8 signaling [27, 46]. Collectively, these connections suggest that 3D context promotes angiogenic signaling by enhancing synergistic VEGF and IL-8 signaling, and that these findings are clinically relevant. Further studies will be needed to evaluate the specific interactions between pro-inflammatory and hypoxia response pathways that may provide novel avenues for therapeutic intervention.
The study and treatment of cancer requires the development of controlled experimental platforms that faithfully explore tissue phenomena in vitro. These systems, such as the alginate-based disc assay described here, recreate critical features of the physiological environment. Furthermore, such platforms help delineate the individual and combined effects of various tissue-level conditions, including dimensionality, hypoxia, or inflammation. However, despite the advantages of simple and realistic tumor models, these systems remain only approximations of the true disease. As with any in vitro assay, these models neglect numerous features of in vivo tissue and provide an over-simplified representation of cancer pathology. Despite these limitations, tissue engineering approaches provide an opportunity for “designed complexity”, thus allowing the examination of independent and co-dependent effects for select microenvironmental characteristics. In this case, exploring the interactions between hypoxia and dimensionality helped distinguish their relative contributions to tumor angiogenesis. Further investigations on the differential effects of the 3D context and resulting biochemical changes on other cancer hallmarks, such as cell growth and invasion, remain critical for understanding and treating the disease. Another limiting factor common to in vitro studies of angiogenesis is the use of HUVECs. While HUVECs are a widely accepted model for endothelial cells, endothelial cell phenotype varies at different sites in the body and tumor-associated endothelial cells differ from normal endothelial cells [47–49]. Yet we and others have shown that IL-8 modulates tumor angiogenesis in vivo [21, 40, 50–53] and is correlated with increased vascular density in patient tumors [32, 41, 42, 54], suggesting that the results collected with HUVECs are relevant.
Taken together, these results suggest that tumor cell hypoxia response is significantly influenced by culture/tissue dimensionality and thus, may not be appropriately studied in conventional 2D monolayer cultures. Furthermore, investigation of therapeutic agents that target hypoxia, matrix, or pro-inflammatory signaling should consider the potential confounding interactions between low-oxygen and 3D that may interfere with or potentially facilitate the desired intervention. The rational design of therapeutic strategies that address this interdependence may enhance the efficacy of existing pharmaceutical regimens.
Conclusion
Using biomaterials-based models of tumor hypoxia response and tumor angiogenesis with isolated control of oxygen distribution and culture dimensionality, we have demonstrated a differential response to hypoxic stress in 2D versus 3D culture, with direct consequences for endothelial cell behavior. Specifically, we found that the pro-inflammatory response pathway, notably through IL-8 signaling, represents a critical link between oxygen status and dimensionality. This observation proved functionally relevant through the synergistic enhancement of VEGF-dependent endothelial sprouting in a 3D microwell invasion assay. Because tumor hypoxia response and angiogenic capability are products of complex microenvironmental interactions, therapeutic strategies that target matrix structure, hypoxia, angiogenesis, or inflammation may benefit from an improved understanding of the interdependence between of these processes.
Supplementary Material
Supplementary Figure 1: Clinical expression of IL-8 in cancer versus normal tissue
A) Oncomine® Research Edition identified 54 of 370 microarray gene expression data sets that indicate significant up-regulation (p-value < 0.001; FC > 2) of IL-8 in cancer versus normal tissue from 12 different organ sites (red). An additional 24 analyses exhibited down-regulation of IL-8 (blue).
B) Subsequent categorization by tissue type shows that adenoma and carcinoma comprise the majority of IL-8 over-expressing tumors, while hematopoietic cancers and sarcomas account for most down-regulated IL-8 expression.
Supplementary Table 1: Top Networks (Biofunctions) Associated with Hypoxia (1% O2) vs. Normoxia (17% O2) or 2D vs. 3D
Supplementary Table 2: Top Canonical Pathways Associated with Hypoxia (1% O2) vs. Normoxia (17% O2) or 2D vs. 3D
Supplementary Table 3: Top Molecules Up-Regulated by Hypoxia (1% O2) vs. Normoxia (17% O2) or 2D vs. 3D
Supplementary Table 4: Top Molecules Down-Regulated by Hypoxia (1% O2) vs. Normoxia (17% O2) or 2D vs. 3D
Acknowledgments
Authors thank Dr. Jeffrey Varner and Dr. Anirikh Chakrabarti for insightful discussions. Funding was provided by the National Cancer Institute (RC1 CA 146065, R21CA161532), and from the Cornell Center on the Microenvironment and Metastasis (U54CA143876). P. DelNero was supported by a NSF graduate research fellowship.
Footnotes
Publisher's Disclaimer: This is a PDF file of an unedited manuscript that has been accepted for publication. As a service to our customers we are providing this early version of the manuscript. The manuscript will undergo copyediting, typesetting, and review of the resulting proof before it is published in its final citable form. Please note that during the production process errors may be discovered which could affect the content, and all legal disclaimers that apply to the journal pertain.
References
- 1.Carmeliet P, Jain RK. Angiogenesis in cancer and other diseases. Nature. 2000;407:249–57. doi: 10.1038/35025220. [DOI] [PubMed] [Google Scholar]
- 2.Semenza GL. HIF-1: mediator of physiological and pathophysiological responses to hypoxia. Journal of Applied Physiology. 2000;88:1474–80. doi: 10.1152/jappl.2000.88.4.1474. [DOI] [PubMed] [Google Scholar]
- 3.Semenza GL. Regulation of mammalian O-2 homeostasis by hypoxia- inducible factor 1. Annual Review of Cell and Developmental Biology. 1999;15:551–78. doi: 10.1146/annurev.cellbio.15.1.551. [DOI] [PubMed] [Google Scholar]
- 4.Bergers G, Benjamin LE. Tumorigenesis and the angiogenic switch. Nature Reviews Cancer. 2003;3:401–10. doi: 10.1038/nrc1093. [DOI] [PubMed] [Google Scholar]
- 5.Dery MAC, Michaud MD, Richard DE. Hypoxia-inducible factor 1: regulation by hypoxic and non-hypoxic activators. International Journal of Biochemistry & Cell Biology. 2005;37:535–40. doi: 10.1016/j.biocel.2004.08.012. [DOI] [PubMed] [Google Scholar]
- 6.Semenza GL. Defining the role of hypoxia-inducible factor 1 in cancer biology and therapeutics. Oncogene. 2010;29:625–34. doi: 10.1038/onc.2009.441. [DOI] [PMC free article] [PubMed] [Google Scholar]
- 7.Aung KZ, Pereira BP, Tan PHS, Han HC, Nathan SS. Interstitial fluid pressure as an alternate regulator of angiogenesis independent of hypoxia driven HIF-1a in solid tumors. Journal of Orthopaedic Research. 2012;30:2038–45. doi: 10.1002/jor.22154. [DOI] [PubMed] [Google Scholar]
- 8.Xu L, Xie KP, Mukaida N, Matsushima K, Fidler IJ. Hypoxia-induced elevation in interleukin-8 expression by human ovarian carcinoma cells. Cancer Res. 1999;59:5822–9. [PubMed] [Google Scholar]
- 9.Bianchi E, Denti S, Granata A, Bossi G, Geginat J, Villa A, et al. Integrin LFA-1 interacts with the transcriptional co-activator JAB1 to modulate AP-1 activity. Nature. 2000;404:617-+. doi: 10.1038/35007098. [DOI] [PubMed] [Google Scholar]
- 10.Bissell MJ, Radisky DC, Rizki A, Weaver VM, Petersen OW. The organizing principle: microenvironmental influences in the normal and malignant breast. Differentiation. 2002;70:537–46. doi: 10.1046/j.1432-0436.2002.700907.x. [DOI] [PMC free article] [PubMed] [Google Scholar]
- 11.Yamada KM, Cukierman E. Modeling tissue morphogenesis and cancer in 3D. Cell. 2007;130:601–10. doi: 10.1016/j.cell.2007.08.006. [DOI] [PubMed] [Google Scholar]
- 12.Griffith LG, Swartz MA. Capturing complex 3D tissue physiology in vitro. Nat Rev Mol Cell Bio. 2006;7:211–24. doi: 10.1038/nrm1858. [DOI] [PubMed] [Google Scholar]
- 13.Braun RD, Beatty AL. Modeling of oxygen transport across tumor multicellular layers. Microvascular Research. 2007;73:113–23. doi: 10.1016/j.mvr.2006.11.001. [DOI] [PMC free article] [PubMed] [Google Scholar]
- 14.Grimes DR, Kelly C, Bloch K, Partridge M. A method for estimating the oxygen consumption rate in multicellular tumour spheroids. Journal of the Royal Society Interface. 2014:11. doi: 10.1098/rsif.2013.1124. [DOI] [PMC free article] [PubMed] [Google Scholar]
- 15.Verbridge SS, Choi NW, Zheng Y, Brooks DJ, Stroock AD, Fischbach C. Oxygen-Controlled Three-Dimensional Cultures to Analyze Tumor Angiogenesis. Tissue Eng Pt A. 2010;16:2133–41. doi: 10.1089/ten.tea.2009.0670. [DOI] [PMC free article] [PubMed] [Google Scholar]
- 16.Bin Kim J, Stein R, O’Hare MJ. Three-dimensional in vitro tissue culture models of breast cancer - a review. Breast Cancer Research and Treatment. 2004;85:281–91. doi: 10.1023/B:BREA.0000025418.88785.2b. [DOI] [PubMed] [Google Scholar]
- 17.Debnath J, Brugge JS. Modelling glandular epithelial cancers in three-dimensional cultures. Nature Reviews Cancer. 2005;5:675–88. doi: 10.1038/nrc1695. [DOI] [PubMed] [Google Scholar]
- 18.Elliott NT, Yuan F. A Review of Three-Dimensional In Vitro Tissue Models for Drug Discovery and Transport Studies. Journal of Pharmaceutical Sciences. 2011;100:59–74. doi: 10.1002/jps.22257. [DOI] [PubMed] [Google Scholar]
- 19.Kim JB. Three-dimensional tissue culture models in cancer biology. Seminars in Cancer Biology. 2005;15:365–77. doi: 10.1016/j.semcancer.2005.05.002. [DOI] [PubMed] [Google Scholar]
- 20.Nelson CM, Bissell MJ. Modeling dynamic reciprocity: Engineering three-dimensional culture models of breast architecture, function, and neoplastic transformation. Seminars in Cancer Biology. 2005;15:342–52. doi: 10.1016/j.semcancer.2005.05.001. [DOI] [PMC free article] [PubMed] [Google Scholar]
- 21.Fischbach C, Chen R, Matsumoto T, Schmelzle T, Brugge JS, Polverini PJ, et al. Engineering tumors with 3D scaffolds. Nat Methods. 2007;4:855–60. doi: 10.1038/nmeth1085. [DOI] [PubMed] [Google Scholar]
- 22.Seo BR, DelNero P, Fischbach C. In vitro models of tumor vessels and matrix: engineering approaches to investigate transport limitations and drug delivery in cancer. Advanced Drug Delivery Reviews. 2014 doi: 10.1016/j.addr.2013.11.011. [DOI] [PMC free article] [PubMed] [Google Scholar]
- 23.DelNero P, Song YH, Fischbach C. Microengineered tumor models: insights & opportunities from a physical sciences-oncology perspective. Biomedical Microdevices. 2013;15:583–93. doi: 10.1007/s10544-013-9763-y. [DOI] [PMC free article] [PubMed] [Google Scholar]
- 24.Cross VL, Zheng Y, Choi NW, Verbridge SS, Sutermaster BA, Bonassar LJ, et al. Dense type I collagen matrices that support cellular remodeling and microfabrication for studies of tumor angiogenesis and vasculogenesis in vitro. Biomaterials. 2010;31:8596–607. doi: 10.1016/j.biomaterials.2010.07.072. [DOI] [PMC free article] [PubMed] [Google Scholar]
- 25.Li AH, Dubey S, Varney ML, Dave BJ, Singh RK. IL-8 directly enhanced endothelial cell survival, proliferation, and matrix metalloproteinases production and regulated angiogenesis. Journal of Immunology. 2003;170:3369–76. doi: 10.4049/jimmunol.170.6.3369. [DOI] [PubMed] [Google Scholar]
- 26.Waugh DJJ, Wilson C. The Interleukin-8 Pathway in Cancer. Clinical Cancer Research. 2008;14:6735–41. doi: 10.1158/1078-0432.CCR-07-4843. [DOI] [PubMed] [Google Scholar]
- 27.Gyanchandani R, Sano D, Alves MVO, Klein JD, Knapick BA, Oh S, et al. Interleukin-8 as a modulator of response to bevacizumab in preclinical models of head and neck squamous cell carcinoma. Oral Oncology. 2013;49:761–70. doi: 10.1016/j.oraloncology.2013.03.452. [DOI] [PubMed] [Google Scholar]
- 28.Richardson AL, Wang ZGC, De Nicolo A, Lu X, Brown M, Miron A, et al. X chromosomal abnormalities in basal-like human breast cancer. Cancer Cell. 2006;9:121–32. doi: 10.1016/j.ccr.2006.01.013. [DOI] [PubMed] [Google Scholar]
- 29.D’Errico M, de Rinaldis E, Blasi MF, Viti V, Falchetti M, Calcagnile A, et al. Genome-wide expression profile of sporadic gastric cancers with microsatellite instability. Eur J Cancer. 2009;45:461–9. doi: 10.1016/j.ejca.2008.10.032. [DOI] [PubMed] [Google Scholar]
- 30.Talbot SG, Estilo C, Maghami E, Sarkaria IS, Pham DK, O-charoenrat P, et al. Gene expression profiling allows distinction between primary and metastatic squamous cell carcinomas in the lung. Cancer Res. 2005;65:3063–71. doi: 10.1158/0008-5472.CAN-04-1985. [DOI] [PubMed] [Google Scholar]
- 31.Peng CH, Liao CT, Peng SC, Chen YJ, Cheng AJ, Juang JL, et al. A Novel Molecular Signature Identified by Systems Genetics Approach Predicts Prognosis in Oral Squamous Cell Carcinoma. Plos One. 2011:6. doi: 10.1371/journal.pone.0023452. [DOI] [PMC free article] [PubMed] [Google Scholar]
- 32.Masuya D, Huang CL, Liu D, Kameyama K, Hayashi E, Yamauchi A, et al. The intratumoral expression of vascular endothelial growth factor and interleukin-8 associated with angiogenesis in nonsmall cell lung carcinoma patients. Cancer. 2001;92:2628–38. doi: 10.1002/1097-0142(20011115)92:10<2628::aid-cncr1616>3.0.co;2-f. [DOI] [PubMed] [Google Scholar]
- 33.Heidemann J, Ogawa H, Dwinell MB, Rafiee P, Maaser C, Gockel HR, et al. Angiogenic effects of interleukin 8 (CXCL8) in human intestinal microvascular endothelial cells are mediated by CXCR2. Journal of Biological Chemistry. 2003;278:8508–15. doi: 10.1074/jbc.M208231200. [DOI] [PubMed] [Google Scholar]
- 34.He JW, Genetos DC, Yellowley CE, Leach JK. Oxygen Tension Differentially Influences Osteogenic Differentiation of Human Adipose Stem Cells in 2D and 3D Cultures. J Cell Biochem. 2010;110:87–96. doi: 10.1002/jcb.22514. [DOI] [PubMed] [Google Scholar]
- 35.Levin VA, Panchabhai S, Shen L, Baggerly KA. Protein and phosphoprotein levels in glioma and adenocarcinoma cell lines grown in normoxia and hypoxia in monolayer and three-dimensional cultures. Proteome Science. 2012:10. doi: 10.1186/1477-5956-10-5. [DOI] [PMC free article] [PubMed] [Google Scholar]
- 36.Rak J, Yu JL, Klement G, Kerbel RS. Oncogenes and angiogenesis: Signaling three-dimensional tumor growth. Journal of Investigative Dermatology Symposium Proceedings. 2000;5:24–33. doi: 10.1046/j.1087-0024.2000.00012.x. [DOI] [PubMed] [Google Scholar]
- 37.Leslie K, Gao SP, Berishaj M, Podsypanina K, Ho H, Ivashkiv L, et al. Differential interleukin-6/Stat3 signaling as a function of cellular context mediates Ras-induced transformation. Breast Cancer Research. 2010:12. doi: 10.1186/bcr2725. [DOI] [PMC free article] [PubMed] [Google Scholar]
- 38.Vogel TW, Zhuang ZP, Li J, Okamoto H, Furuta M, Lee YS, et al. Proteins and protein pattern differences between glioma cell lines and glioblastoma multiforme. Clinical Cancer Research. 2005;11:3624–32. doi: 10.1158/1078-0432.CCR-04-2115. [DOI] [PubMed] [Google Scholar]
- 39.Ertel A, Verghese A, Byers SW, Ochs M, Tozeren A. Pathway-specific differences between tumor cell lines and normal and tumor tissue cells. Mol Cancer. 2006:5. doi: 10.1186/1476-4598-5-55. [DOI] [PMC free article] [PubMed] [Google Scholar]
- 40.Smith DR, Polverini PJ, Kunkel SL, Orringer MB, Whyte RI, Burdick MD, et al. Inhibition of Interleukin-8 Attenuates Angiogenesis in Bronchogenic-Carcinoma. J Exp Med. 1994;179:1409–15. doi: 10.1084/jem.179.5.1409. [DOI] [PMC free article] [PubMed] [Google Scholar]
- 41.Kitadai Y, Haruma K, Sumii K, Yamamoto S, Ue T, Yokozaki H, et al. Expression of interleukin-8 correlates with vascularity in human gastric carcinomas. Am J Pathol. 1998;152:93–100. [PMC free article] [PubMed] [Google Scholar]
- 42.Fujimoto J, Aoki I, Khatun S, Toyoki H, Tamaya T. Clinical implications of expression of interleukin-8 related to myometrial invasion with angiogenesis in uterine endometrial cancers. Ann Oncol. 2002;13:430–4. doi: 10.1093/annonc/mdf078. [DOI] [PubMed] [Google Scholar]
- 43.Desbaillets I, Diserens AC, deTribolet N, Hamou MF, Van Meir EG. Upregulation of interleukin 8 by oxygen-deprived cells in glioblastoma suggests a role in leukocyte activation, chemotaxis, and angiogenesis. J Exp Med. 1997;186:1201–12. doi: 10.1084/jem.186.8.1201. [DOI] [PMC free article] [PubMed] [Google Scholar]
- 44.Kubo F, Ueno S, Hiwatashi K, Sakoda M, Kawaida K, Nuruki K, et al. Interleukin 8 in human hepatocellular carcinoma correlates with cancer cell invasion of vessels but not with tumor angiogenesis. Ann Surg Oncol. 2005;12:800–7. doi: 10.1245/ASO.2005.07.015. [DOI] [PubMed] [Google Scholar]
- 45.Akiba J, Yano H, Ogasawara S, Higaki K, Kojiro M. Expression and function of interleukin-8 in human hepatocellular carcinoma. Int J Oncol. 2001;18:257–64. doi: 10.3892/ijo.18.2.257. [DOI] [PubMed] [Google Scholar]
- 46.Huang D, Ding Y, Zhou M, Rini BI, Petillo D, Qian CN, et al. Interleukin-8 Mediates Resistance to Antiangiogenic Agent Sunitinib in Renal Cell Carcinoma. Cancer Res. 2010;70:1063–71. doi: 10.1158/0008-5472.CAN-09-3965. [DOI] [PMC free article] [PubMed] [Google Scholar]
- 47.Nolan DJ, Ginsberg M, Israely E, Palikuqi B, Poulos MG, James D, et al. Molecular signatures of tissue-specific microvascular endothelial cell heterogeneity in organ maintenance and regeneration. Dev Cell. 2013;26:204–19. doi: 10.1016/j.devcel.2013.06.017. [DOI] [PMC free article] [PubMed] [Google Scholar]
- 48.Aird WC. Molecular heterogeneity of tumor endothelium. Cell Tissue Res. 2009;335:271–81. doi: 10.1007/s00441-008-0672-y. [DOI] [PubMed] [Google Scholar]
- 49.Dudley AC. Tumor Endothelial Cells. Csh Perspect Med. 2012:2. doi: 10.1101/cshperspect.a006536. [DOI] [PMC free article] [PubMed] [Google Scholar]
- 50.Arenberg DA, Kunkel SL, Polverini PJ, Glass M, Burdick MD, Strieter RM. Inhibition of interleukin-8 reduces tumorigenesis of human non-small cell lung cancer in SCID mice. J Clin Invest. 1996;97:2792–802. doi: 10.1172/JCI118734. [DOI] [PMC free article] [PubMed] [Google Scholar]
- 51.Strieter RM, Kunkel SL, Elner VM, Martonyi CL, Koch AE, Polverini PJ, et al. Interleukin-8 - a Corneal Factor That Induces Neovascularization. Am J Pathol. 1992;141:1279–84. [PMC free article] [PubMed] [Google Scholar]
- 52.Inoue K, Slaton JW, Eve BY, Kim SJ, Perrotte P, Balbay MD, et al. Interleukin 8 expression regulates tumorigenicity and metastases in androgen-independent prostate cancer. Clinical Cancer Research. 2000;6:2104–19. [PubMed] [Google Scholar]
- 53.Luca M, Huang SY, Gershenwald JE, Singh RK, Reich R, BarEli M. Expression of interleukin-8 by human melanoma cells up-regulates MMP-2 activity and increases tumor growth and metastasis. Am J Pathol. 1997;151:1105–13. [PMC free article] [PubMed] [Google Scholar]
- 54.Fujimoto J, Sakaguchi H, Aoki I, Tamaya T. Clinical implications of expression of interleukin 8 related to angiogenesis in uterine cervical cancers. Cancer Res. 2000;60:2632–5. [PubMed] [Google Scholar]
Associated Data
This section collects any data citations, data availability statements, or supplementary materials included in this article.
Supplementary Materials
Supplementary Figure 1: Clinical expression of IL-8 in cancer versus normal tissue
A) Oncomine® Research Edition identified 54 of 370 microarray gene expression data sets that indicate significant up-regulation (p-value < 0.001; FC > 2) of IL-8 in cancer versus normal tissue from 12 different organ sites (red). An additional 24 analyses exhibited down-regulation of IL-8 (blue).
B) Subsequent categorization by tissue type shows that adenoma and carcinoma comprise the majority of IL-8 over-expressing tumors, while hematopoietic cancers and sarcomas account for most down-regulated IL-8 expression.
Supplementary Table 1: Top Networks (Biofunctions) Associated with Hypoxia (1% O2) vs. Normoxia (17% O2) or 2D vs. 3D
Supplementary Table 2: Top Canonical Pathways Associated with Hypoxia (1% O2) vs. Normoxia (17% O2) or 2D vs. 3D
Supplementary Table 3: Top Molecules Up-Regulated by Hypoxia (1% O2) vs. Normoxia (17% O2) or 2D vs. 3D
Supplementary Table 4: Top Molecules Down-Regulated by Hypoxia (1% O2) vs. Normoxia (17% O2) or 2D vs. 3D