

Abstract
In aqueous solutions with high concentrations of chemical denaturants such as urea and guanidinium chloride (GdmCl) proteins expand to populate heterogeneous conformational ensembles. These denaturing environments are thought to be good solvents for generic protein sequences because properties of conformational distributions align with those of canonical random coils. Previous studies showed that water is a poor solvent for polypeptide backbones and therefore backbones form collapsed globular structures in aqueous solvents. Here, we ask if polypeptide backbones can intrinsically undergo the requisite chain expansion in aqueous solutions with high concentrations of urea and GdmCl. We answer this question using a combination of molecular dynamics simulations and fluorescence correlation spectroscopy. We find that the degree of backbone expansion is minimal in aqueous solutions with high concentrations denaturants. Instead, polypeptide backbones sample conformations that are denaturant-specific mixtures of coils and globules, with a persistent preference for globules. Therefore, typical denaturing environments cannot be classified as good solvents for polypeptide backbones. How then do generic protein sequences expand in denaturing environments? To answer this question, we investigated the effects of sidechains using simulations of two archetypal sequences with amino acid compositions that are mixtures of charged, hydrophobic, and polar groups. We find that sidechains lower the effective concentration of backbone amides in water leading to an intrinsic expansion of polypeptide backbones in the absence of denaturants. Additional dilution of the effective concentration of backbone amides is achieved through preferential interactions with denaturants. These effects lead to conformational statistics in denaturing environments that are congruent with those of canonical random coils. Our results highlight the role of sidechain-mediated interactions as determinants of the conformational properties of unfolded states in water and in influencing chain expansion upon denaturation.
INTRODUCTION
Tanford’s classical studies established that functional activity and structural features of globular proteins are abrogated in the presence of high concentrations of denaturants such as 8 M urea and 6 M GdmCl. Hydrodynamic radii (Rh) of denatured proteins show power law behavior such that Rh ~ Nν 1,2, where N denotes the chain length. The exponent ν is set by the length-scale for correlations in conformational fluctuations and is governed by the balance of intra-chain, chain-solvent, and solvent-solvent interactions. In a good solvent, chain-solvent interactions are preferred and the effective intra-chain interactions are repulsive thereby yielding a value of ν≈0.59.3 Tanford showed that Rh ~ N0.59 for highly denatured proteins. Wilkins et al. used pulse-field gradient nuclear magnetic resonance measurements to recapitulate the scaling of Rh with N for a set of single domain proteins that show apparent two-state behavior.4 Similarly, Kohn et al.5 used small angle X-ray scattering (SAXS) to show that the mean radius of gyration (Rg) scales as N0.59 for 28 different chemically denatured proteins of different lengths and amino acid sequences.
The overall implications of the scaling of Rh and Rg with N are two-fold: First, solutions with high concentrations of denaturants are akin to good solvents for generic protein sequences. Second, given that many proteins show apparent two-state behavior, the conjecture that emerges is that generic unfolded proteins sample ensembles with similar statistical properties. This conjecture has received considerable scrutiny and several lines of investigation have established that a scaling exponent of 0.59 does not imply purely self-avoiding random-coil-like conformations for denatured state ensembles.6–13 Instead, the exponent of 0.59 accommodates considerable sequence specificity in the conformational properties of denatured proteins.
Our work is motivated by the question of why aqueous solutions with high concentrations of denaturants should be good solvents for generic proteins? Studies based on the solute partitioning model14,15, atomistic simulations16–24 and experimental data25,26 have converged on a consensus that urea denatures proteins through preferential interactions with backbone and sidechain atoms. Specifically, urea molecules accumulate preferentially around the carbonyl oxygen atoms of peptide group amides27 and to different degrees around the aliphatic, aromatic, and polar sites of sidechains.14,28 The mechanisms for denaturation in solutions with high concentrations of GdmCl remain unresolved although insights are emerging from different types of experiments.29 Lim et al.30 measured the ability of guanidinium ions to block acid- and base-catalyzed hydrogen exchange of an alanine dipeptide in high concentrations of GdmCl. Their results suggest an absence of direct interactions between guanidinium ions and the functional groups of backbone amides. Studies with other model compounds suggest that guanidinium ions interact favorably with aromatic groups and primary amides of sidechains.31,32 Simulations suggest that the strengths of ion pairs are reduced in high concentrations of GdmCl.33 These results highlight a prominent role for sidechain-mediated interactions as drivers of the loss of structure and chain expansion in solutions with high concentrations of GdmCl. The recent work of Jha and Marqusee34 suggests that denaturation follows a two-stage mechanism. The first step appears to involve accumulation of guanidinium ions near the protein surface and this is followed by penetration of water molecules to disrupt the hydrophobic core.
Observations that serve as motivation for the current study
Studies based on simulations35 and fluorescence correlation spectroscopy (FCS) experiments36 have established that water is a poor solvent for polypeptide backbones. In poor solvents, quantities such as Rg and Rh scale as N0.33 thus ensuring that the chain-solvent interface is minimized.3 Similar behavior has been observed using a combination of simulations and experiments for intrinsically disordered polar tracts such as polyglutamine,37 glycine-serine block copolypeptides,35 and the Gln/Asn rich N-domain of Sup35 protein.38 In aqueous solutions, the preference of polypeptide backbones for collapsed globular states can be reversed through sidechain-mediated interactions as evidenced by the following observations. If the net charge per residue exceeds a threshold value, then polyelectrolytic intrinsically disordered proteins (IDPs) can have dimensions in water that are larger than those of highly denatured proteins.39–41 This is also true of polyampholytic IDPs providing their fraction of charged residues exceeds a threshold value and the linear sequence patterning of oppositely charged residues meets certain specifications.41,42 Chain expansion in IDPs that are enriched in charged residues is driven by the combination of favorable free energies of solvation of charged sidechains and electrostatic repulsions in polyelectrolytes or the mutual screening of electrostatic repulsions and attractions in polyampholytes. The role of charged sidechains is also evident in their effect on the unfolded states under folding conditions.43
Focus of this work
The preceding observations raise two questions that form the focus of our work: Do polypeptide backbones, sans sidechains, expand in a manner that is consistent with the observed scaling exponent of 0.59 in aqueous solutions with high concentrations of denaturants? What role do sidechains play in influencing the expansion of polypeptide backbones in aqueous solutions with high concentrations of denaturants? Answers to these questions provide deeper insights into the mechanisms of protein denaturation. Our findings highlight the need to go beyond inferences gleaned from the studies of model compounds. This is important if we are to obtain a coherent and comprehensive understanding of protein denaturation and the conformational properties of proteins in complex milieus such as cellular environments. The objects of our study are polyglycine peptides that mimic pure polypeptide backbones and two 15-residue peptides that serve as model systems to help elucidate the role of sidechains and we report results from atomistic simulations and FCS experiments. The analysis of our simulation results is guided by the use of reference ensembles that mimic the conformational statistics of flexible polymers in poor, indifferent (theta), and good solvents. We also introduce the effective concentration of backbone amides as a parameter to help in quantifying how backbone conformations are altered by the combination of sidechain-mediated interactions and preferential interactions of different sidechain groups with denaturants.
MATERIALS AND METHODS
Peptide systems
We used molecular dynamics simulations based on atomistic models for peptides and explicit representations of solvent and cosolute molecules to simulate the effects of water, 8 m urea and 8 m GdmCl on three different peptide systems. In order to assess the impact of denaturants on the conformational properties of pure polypeptide backbones, we performed three sets of simulations for a polyglycine peptide, N-acetyl-(Gly)15-N′-methylamide referred to hereafter as G15. To understand how sidechains modulate the intrinsic properties of backbones in different environments, we performed simulations for two archetypal peptides designated as CAP and OSP. The sequence of CAP is QFHFHWNRQDDQYFE and that of OSP is GVSLLTIDVKKSLTK. The N- and C-termini were capped using N-acetyl and N′-methylamide groups, respectively. These 15-residue peptides are based on fragments of full-length proteins and are excised from Carbonic Anhydrase (CAP) and from OspA (OSP). The sequences of CAP and OSP show negligible biases toward specific secondary or tertiary structures in water and they serve as useful model systems for unfolded states under folding conditions. The sequences have complementary attributes. CAP has no aliphatic residues whereas OSP has no aromatic residues. The net charge per residue, calculated as (f+ − f−), where f+ and f− are the fraction of positive and negatively charge residues, respectively, is −0.2 for CAP and +0.2 for OSP. The fraction of charged residues i.e., (f+ + f−) is 0.27 for both peptides. Based on the combination of hydrophobicity, net charge per residue, and fraction of charged residues, these sequences and longer tandem repeats of these sequences are expected to have a predominant preference for heterogeneous distributions of globular conformations in water.42
Fluorescence correlation spectroscopy (FCS) experiments were performed for three peptides containing polyglycine tracts of different lengths. The peptides were of the form: Trp-(Gly)N-Cys*-(Lys)2 with N=15, 31, and 45. Here, Cys* denotes a cysteine that was modified by covalent addition of an Alexa488 dye through a maleimide linkage. The Lys residues were necessary to enhance solubility and enable peptide purification and the Trp residue was used for accurate assessments of peptide concentration.
Molecular mechanics forcefields
We used the TIP3P model for water molecules.44 We also used explicit representations for urea molecules and guanidinium (Gdm+) and chloride (Cl−) ions. We used the Kirkwood-Buff forcefield (KBFF) to model urea and GdmCl.45,46 Molecular mechanics parameters for the three peptides and neutralizing counterions were taken from the OPLS-AA/L forcefield.47 Neutralizing Na+ and Cl− ions were included in the simulations of CAP and OSP, respectively. Our choices maintain fidelity with the paradigm for the development of the KBFF forcefield, which has been designed for interoperability with the OPLS-AA/L forcefield for peptides and neutralizing counterions. Recent work48,49 has highlighted issues with the combination of the OPLS-AA/L forcefield and the TIP3P water model for modeling conformational equilibria of various peptide systems. In this context, it is noteworthy that the collapse and poor solubility of polyglycine in water have been reproduced using other combinations of forcefields and water models,50,51 thus pointing to the robustness of the results to differences in forcefields.
Details of the molecular dynamics simulations
We used version 4.5.3 of the GROMACS modeling package52 for the molecular dynamics (MD) simulations. The design of these simulations was based on the multiple-replica MD or MRMD approach of Vitalis et al.53 In this approach, one performs multiple independent simulations, each starting from an entirely different conformation for the peptide in question. The starting conformations are drawn at random from pre-equilibrated ensembles of sterically allowed conformations that are expanded and collapsed. Each simulation was designed to be long enough to ensure multiple recurrent transitions between compact globular conformations and expanded coil-like conformations. In high concentrations of denaturants, the increased viscosities slow the overall transitions. These considerations were used to set the upper limit on the simulation time for each replica. The parameters of the MRMD protocol were as follows. For each peptide in water and 8 m urea, each independent MD simulation was run for 110 ns and for these peptides in 8 m GdmCl the simulation time per replica was 210 ns. For each of the replicates, the first ten nanoseconds of simulations were set aside as equilibration. Overall, for each combination of peptide and environment we performed 20 independent simulations. This yielded an aggregate simulation time of 2.1 μs for each of polyglycine, CAP, and OSP in water and 8 m urea and an aggregate simulation time of 4.1 μs for each of the three peptides in 8 m GdmCl.
The equations of motion were integrated using the leapfrog integrator with a time step of 2 fs. All peptide bond lengths and those within urea molecules and Gdm+ ions were constrained using the LINCS54 algorithm. The bonds and angles within TIP3P water molecules were constrained using the SETTLE algorithm55. The simulations were performed in the isothermal-isobaric ensemble. The target temperature, pressure, and isothermal compressibility in all simulations were 298 K, 1 bar, and 4.5×10⁻⁵ bar−1, respectively. We used the velocity rescaling method of Bussi et al.56 with a coupling constant of τ=1.0 ps to control the temperature. The simulation pressure was controlled using the extended-ensemble barostat of Parrinello and Rahman.57 The coupling time for the latter was τP=20 ps. Snapshots were saved once every 12.5 ps. Each snapshot included the positions of the peptide atoms and those of the denaturant molecules (urea and Gdm+ and Cl− ions).
In each of the MRMD simulations we used cubic boxes with periodic boundary conditions. Long-range electrostatic interactions between periodic images were treated using the particle mesh Ewald approach.58 We used an eighth-order cubic interpolation with a tolerance of 10−5. Cutoffs of 11 Å and 14 Å were used for the real space electrostatic and van der Waals interactions, respectively. Long-range dispersion corrections were applied for energy and pressure. Neighbor lists were updated once every five steps. This choice ensured against large deviations from the target pressures in all of the MD simulations. The average dimensions of the box as prescribed by the average length to each side ranged from 61Å for peptides in water to 71Å for peptides in 8 m GdmCl. The maximum end-to-end distance of each peptide is ca. 60Å and this value is never realized even in ensembles of self-avoiding random walks. Hence, the dimensions of the central simulation cell were large enough to accommodate maximally extended conformations and rule out any compaction due to artifacts imposed by confinement. In all of the simulations, we fixed the number of water molecules to be 7,360. For simulations in 8 m urea, we used 1,060 urea molecules and for simulations in 8 m GdmCl we used 1,060 Gdm+ and 1,060 Cl− ions. The choice for the number of water molecules was made to ensure a density of 1 gm/cm3 in a periodic box of volume 2.16×10⁵ Å3. In denaturing environments, the density of water is maintained by the increase in the box size, which is necessary to accommodate denaturant molecules. We used molality rather than molarity because molality remains constant irrespective of volume fluctuations.
Simulations of reference ensembles and analysis conformational properties
For each peptide, we generated reference ensembles using potentials that encode conformational properties corresponding to three distinct model scenarios. For these simulations we used version 1.0 of the CAMPARI modeling package (http://campari.sourceforge.net). For each peptide, we performed two sets of reference simulations using the ABSINTH model while zeroing out the mean field solvation and Coulomb terms of the potential. All other terms of the potential were used as prescribed by the ABSINTH model.59 The two reference potentials are distinguished by the choice of λ in equation (1). In one set of reference simulations, λ=0 and in the other λ=1.
| (1) |
The summation runs over all unique pairs of non-bonded atoms as defined by the ABSINTH model.59 Metropolis Monte Carlo simulations were performed at a simulation temperature of 298 K. The parameters for εij, σij and other non-zero terms of the potential were taken from the abs3.2_opls.prm parameter file that is part of the CAMPARI distribution. In good solvents and the so-called excluded volume (EV) limit, quantities such as the mean radius of gyration (〈Rg〉), the mean end-to-end distance (〈Ree〉), and the mean hydrodynamic radius (〈Rh〉) scale as N0.59 with chain length N. These features are reproduced using ensembles obtained by performing simulations with λ=0 in equation (1) and zeroing out the mean field solvation and electrostatic terms of the potential. By pursuing a similar approach and setting λ=1 we obtained the reference globule or Lennard-Jones (LJ) limit where quantities such as Rg and Rh scale as N0.33 with chain length. In this limit, the conformations are, on average, non-specifically compacted globules.
We also performed reference simulations using the rotational isomeric approximation to mimic the Flory random coil or FRC limit. Accordingly, the ABSINTH model with λ=0 in equation (1) combined with the mean field solvation and electrostatic terms being zeroed out were used to perform Metropolis Monte Carlo simulations of dipeptides i.e., Ac-Xaa-Nme for all twenty amino acids at 298 K. The distributions of φ, ψ, and χ angles from the dipeptide simulations were used to create libraries of rotational isomers for every amino acid. To generate FRC ensembles for longer chains, φ, ψ, and χ angles were randomly drawn from the residue-specific libraries of rotational isomers. In these simulations all inter-residue interactions between are explicitly zeroed out. The resultant ensembles conform to Flory’s approach for mimicking conformational distributions that result from the counterbalancing of chain-chain and chain-solvent interactions in an indifferent or theta solvent.60 Quantities such as Rg, Ree, and Rh scale as N0.5 as a function of chain length for all systems in the FRC limit. Similarly, distributions for a range of polymeric quantities match expectations from theory60 and simulation for chains in a theta solvent.61
Parameters that quantify chain size and shape
In a given environment, for each snapshot, we calculated the gyration tensor defined as:
| (2) |
Here, ri is the position vector of atom i within a specific conformation, rc is the location of the centroid for this conformation, na is the number of atoms in the chain, and the symbol ⊗ refers to the dyadic product. We use the eigenvalues Lj (j=1,2,3) of the gyration tensor for the specific conformation to calculate two global descriptors of conformations. The two parameters are the radius of gyration denoted as Rg and the asphericity denoted as δ*.61
| (3) |
Rg is a formal order parameter in polymer theories and serves as a measure of chain density. The asphericity δ* is a measure of the shape associated with a particular conformation. The values of 〈δ*〉 are predicted by theory to be approximately 0.42 and 0.52, for long, linear, flexible chains in theta (FRC limit) and good solvents (EV limit), respectively whereas 〈δ*〉→0 for compact globules.61 For globules formed by finite sized linear chains, 〈δ*〉 ranges between 0.05 and 0.3, with the smaller values corresponding to longer chains.
Calculation of internal scaling profiles
We utilized internal scaling profiles39,42,53 to compare the ensemble-averaged conformational properties of polypeptide backbones for different systems in different milieus. For a specific linear sequence separation |i−j|, we calculated 〈〈R〉〉|i−j| as follows:
| (4) |
Here, and are the position vectors of backbone atoms m and n from residues i and j, respectively; Zij is the number of unique pairwise distances between the backbone units of residues i and j. Internal scaling profiles, which are plots of 〈〈R〉〉|i−j| against |i−j| serve as robust classifiers of conformational ensembles because they provide a complete albeit concise description of the conformational properties on all length scales62. The notation for 〈〈R〉〉|i−j| is intended to clarify the fact that the averaging is over all conformations in the ensemble (the outer average) for all pairs of residues that are |i−j| apart in the linear sequence (the inner average).
Sample preparation for FCS measurements
Peptides of WG15CKK, WG31CKK and WG45CKK were purchased in crude form from Yale University’s Keck facility. The identities of the peptides were confirmed using mass spectrometry. For each peptide, the powder was suspended in water at 1 mg/ml concentration. The suspension was then sonicated for two minutes using a tabletop water bath sonicator. Since polyglycine is practically insoluble in water, LiCl powder (1 mg/ml) was added to this solution and dissolved by vortexing to obtain a clear solution.63 Tris(2-carboxyethyl)phosphine (TCEP) at 1 mM concentration was added to the solution to reduce any pre-formed disulfide bonds. The pH was adjusted to 7.4 using a 20 mM Hepes buffer. Finally, 200 μM alexa488 maleimide dye was added, and the solution was incubated at room temperature for 3 hrs. This solution was then stored overnight at 4 °C. Free dyes were removed by dialysis of the solution for 24 hrs in water in the presence of 5 mM β-mercaptoethanol using a 2 kDa dialysis membrane (Spectrapor). Centrifuging the sample and discarding the supernatant removed any free dye that remained following dialysis. The pellet containing the labeled polyglycine peptide was dissolved in an aqueous solution of 8 M LiCl. The peptide was further purified by size exclusion chromatography using a superdex peptide column (GE healthcare). The labeling efficiency, determined by the absorbance of the peptide at 488 nm and 280 nm, was found to be >80% in all cases. The concentrations of purified and labeled peptides in the final stock solutions were 6, 4 and 3 μM for WG15C*KK, WGG31C*KK and WG45C*KK respectively.
Details of FCS measurements
FCS has been used to reproduce the dimensions of highly expanded systems in the presence64 and absence of denaturants.39 Here, we used a Zeiss confocor 2 microscope equipped with FCS measurement capability. For the diffusion measurements, the stock solutions of Alexa488-labled polyglycine peptides were diluted by 100-fold into water, urea (4 M and 8 M) or GdmCl (3.5 M and 7 M). The measured diffusion times were found to be insensitive to further dilution. The measurements were also performed on a free Alexa488 dye (50 nM) solution in each of the solvent conditions as controls. Measurements in each condition were done in triplicate. In order to avoid optical aberrations due to high refractive indices in urea and GdmCl solutions, all of the measurements were performed at depths within 4–6 μm from the cover glass. The FCS autocorrelation traces were fit using one triplet and one diffusing species. To calculate the intrinsic diffusion time, we calculated a correction factor, which we defined as the observed diffusion time for the free dye in water divided by the diffusion time for the free dye in the environment of interest. Since the dye does not undergo any change in conformation under denaturing conditions, the multiplicative correction factor provides a route to generate environment-corrected values, which we designate as the intrinsic diffusion time for the peptide in the environment of interest.
Water is a poor solvent for polypeptide backbones.35,36 In poor solvents, there exists a saturation concentration beyond which the polymer plus solvent system separates into solvent-rich and insoluble polymer-rich phases.65,66 Polyglycine and polyglutamine are examples of polypeptide polyamides. The measured saturation concentrations for a range of polyglutamine peptides of different lengths are in the low- to sub-micromolar range67 and these saturation concentrations decrease with increasing polyglutamine length. Below the saturation concentration, there exists a second saturation boundary that is akin to a micellization boundary where the critical micelle concentration is ca.100 nM or lower.67 The data for polyglutamine and observations for glycine-rich peptides36,68 are consistent with our findings that polyglycine peptides are highly insoluble in water. This should in turn yield globules for individual chains in ultra dilute solutions36,65,66 for polyglycine in water. From a practical standpoint, measured saturation concentrations place constraints on the concentration ranges one can use for measuring the conformational properties of individual polypeptides. Measurements of hydrodynamic properties have to be performed in the low nanomolar or even picomolar concentrations, depending on chain length. According to the Flory theorem3, an individual chain within an aggregate can have dimensions that scale as N0.5 if the aggregates are reasonably large. This taken together with the lower diffusivity of aggregates will confound interpretations of measured diffusion times. Our data were collected at concentrations that lie below the known/inferred saturation concentrations and critical micelle concentrations for polypeptide polyamides. Further, the brightness per molecule matches that of the free dye implying the absence of aggregates and the monomeric form being the only diffusing species in all experiments.
RESULTS
Our overall approach is to obtain the conformational distributions for the polypeptide backbones of polyglycine, CAP, and OSP in water, 8 m urea, and 8 m GdmCl and compare these to distributions obtained for the same systems modeled in the LJ, FRC, and EV limits.
Quantifying the degree of expansion of polypeptide backbones in aqueous solutions with high concentrations of denaturants
Figure 1 shows the mean values for Rg and δ* that were obtained for G15 in water, 8 m GdmCl, 8 m urea, and the three reference ensembles, respectively. The mean Rg and δ* values suggest a systematic expansion of G15 in the two denaturing environments. The degree of expansion is higher in urea than GdmCl. The degrees of expansion observed for G15 in both denaturing environments are smaller than expected for either the FRC or EV reference ensembles. Figure 1 compares the internal scaling profiles for G15 in water, 8 m urea, and 8 m GdmCl to the profiles obtained from three reference ensembles. A distinct feature of internal scaling profiles for the FRC and EV reference ensembles is the monotonic increase of 〈〈R〉〉|i−j| with linear sequence separation |i−j|. This behavior derives from the fractal nature of long linear flexible chains in the FRC and EV limits. In contrast, the profile for the LJ reference shows plateauing behavior and the densities of the globules that form in this limit will dictate the plateau values. Figure 1 shows that the profiles for G15 in 8 m urea and GdmCl exhibit signatures of the plateauing behavior that are consistent with persistent preferences for globular conformations as observed for polyglycine in water. The profiles in denaturing environments plateau at higher values of 〈〈R〉〉|j−i| vis-à-vis that in water and this is also borne out in the systematic increase of the mean radii of gyration in denaturants.
Figure 1. Internal scaling profiles for G15 in water, 8 m urea, 8 m GdmCl compared to similar profiles calculated for G15 in the EV, FRC, and LJ limits.

Error bars are excluded in the interest of clarity. The supplementary material shows each of these internal scaling profiles with error bars. The legend shows the mean Rg and asphericity values for the three environments and the three reference ensembles.
Do the internal scaling profiles imply uniformly swollen globules in 8 m urea and 8 m GdmCl or do they imply increased sampling of expanded conformations via spontaneous fluctuations? To answer this question we performed a comparative analysis of the joint distributions P(δ*,Rg) calculated for G15 in each of the three environments and each of the three reference ensembles. These distributions are shown in Figure 2. We quantify the populations for distinct asphericity intervals to compare the amplitudes of conformational fluctuations in different milieus. The fluctuations in sizes and shapes are correlated, and this diminishes the possibility of sampling conformations with high Rg and low asphericity values, thus ruling out uniformly swollen globules in denaturing environments. Instead, the ensembles in 8 m urea and GdmCl are mixtures of compact spherical conformations and expanded aspherical conformations. In 8 m urea there is a 30% reduction in the population of compact spherical conformations vis-à-vis that in water and this population is reduced by 10% in 8 m GdmCl. However, in order to achieve statistics that are congruent with those of canonical random coils such as the FRC or EV reference ensembles, the population of compact spherical conformations has to be reduced by at least 60%. Clearly, this degree of expansion is not achieved for polypeptide backbones in high concentrations of urea and GdmCl and there remains a persistent preference for compact globular conformations.
Figure 2. Plots of the joint probability densities P(Rg,δ*) of sizes and shapes for G15 in water, 8 m urea, and 8 m GdmCl – top row – and in the LJ, FRC, and EV limits.

Each panel also shows the populations within three distinct, equally sized, non-overlapping intervals along the δ*axis.
Experimental tests of simulation results
Figure 3 summarizes results from FCS measurements for three polyglycine peptides in water and different concentrations of urea and GdmCl. In a given environment, the intrinsic diffusion times (τD) increase with chain length. Further, for a given chain length, the values of τD are highest in 4 and 8 M urea, respectively. In 3.5 M GdmCl the values of τD are similar to those in water and there is a small increase of τD in 7.5 M GdmCl. These results, shown in panel a of Figure 3, imply a higher degree of expansion for polyglycine chains in higher concentrations of urea as opposed to GdmCl. The value of τD measures the mean diffusion time through the confocal volume and this quantity is proportional to Rh.
Figure 3. Summary of results from FCS experiments.
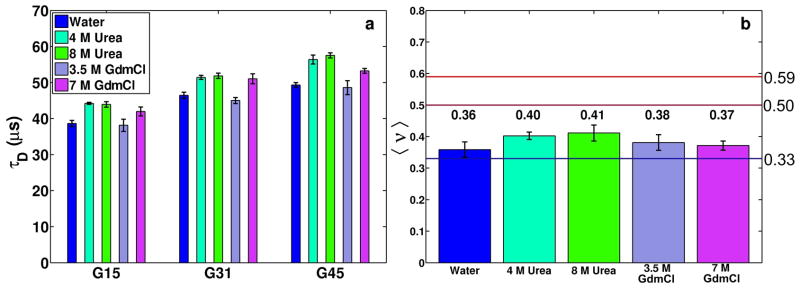
Panel a shows the estimated values of τD in microseconds for three different polyglycine peptides in different milieus. Panel b shows the estimated scaling exponents for the scaling of τD as a function of molecular weight for polyglycine peptides in different milieus.
Is the expansion we observe in denaturants congruent with expectations for chains in either the FRC or EV limits? We answer this question by performing a scaling analysis using the measured τD values for different chain lengths in different milieus. Since τD ~ Rh, it follows that τD ~ τ0(Mw)ν where Mw refers to the molecular weight of the diffusing species that includes the dye 37. For each combination of peptide and environment, we obtained three independent estimates for τD, plus a separate estimate for τD of the free dye. Therefore, for a given milieu, we used multiple combinations of independent estimates of τD to generate synthetic datasets for linear regression analysis of ln(τD) as a function of ln(Mw). Each synthetic dataset has four data points, three for the labeled peptides and one for the free dye. The results do not change materially if we exclude the free dye from this analysis. For each of the five environments, we apply the following procedure to estimate the scaling exponent ν for polyglycine in that environment: (i) we randomly selected a set of four τD values from the data replicates for the dye and the three peptides. (ii) We perform linear regression analysis by plotting ln(τD) against ln(MW). The slope of the line of best fit is an estimate of ν for the particular combination of four data points. For each regression attempt, the goodness of fit was evaluated and on average, the regression lines were found to fit the data with no more than 1–2% overall error. (iii) Steps (i) and (ii) were repeated 104 times for each environment thereby yielding a distribution of 104 estimates for ν. These distributions were used to estimate the mean and standard deviation of ν for polyglycine in a specific milieu.
The results of the scaling analysis are shown in panel b of Figure 3 for polyglycine in water, 4 M urea, 8 M urea, 3.5 M GdmCl, and 7.5 M GdmCl, respectively. Our estimates for the values of ν for polyglycine in water, 4 M urea, 8 M urea, 3.5 M GdmCl, and 7.5 M GdmCl are 0.36 ± 0.03, 0.40 ± 0.01, 0.41 ± 0.03, 0.38 ± 0.03, and 0.37 ± 0.01, respectively. These results support the following conclusions: Within bounds imposed by finite size artifacts, we can assert that water is a poor solvent for polyglycine. Further, although solvent quality improves in solutions with high concentrations of urea or GdmCl these milieus cannot be classified as good solvents for polypeptide backbones. Taken together, the simulation results and assessments of experimental data yield mutually consistent inferences. Polypeptide backbones form compact globules in water and the despite discernible destabilization of the globules, the degree of expansion is insufficient to classify denaturing environments as good solvents for backbones. Instead, in denaturing environments, backbones sample a mixture of expanded and collapsed states, with a clear bias for the latter.
Our results suggest that the observed expansion of generic protein sequences5 in highly denaturing environments must derive mainly from the influences of amino acid sidechains. The question is if the contributions from sidechains derive exclusively from preferential interactions of denaturant molecules with specific sidechain residues or if the sidechains act as a local solvent to prime the backbone by engendering an intrinsic expansion even in the absence of denaturants.
Sidechains enhance the expansion of polypeptide backbones in all environments
Figures 4 and 5 summarize results for two archetypal sidechain containing peptide sequences designated as CAP and OSP, respectively. With one exception, all residues in CAP and OSP are non-glycine residues and values for φ,ψ-angles are therefore limited by local steric hindrances that are not present for glycine. All three reference models account for this local steric hindrance. Polyglycine is 17% more expanded in water than for the reference LJ globule. In contrast, the backbone is 25% more expanded in water for CAP and OSP as compared to the corresponding reference LJ globule. Therefore, sidechains can prime the backbone by inducing an intrinsic expansion whereby its dimensions increase even in the absence of denaturant molecules.
Figure 4. Internal scaling profiles for CAP and OSP.

The supplementary material shows these plots with error bars, which are not shown here in the interest of clarity.
Figure 5. Distributions of Rg and δ* values for the backbones of CAP and OSP in water, 8 m urea, and 8 m GdmCl – top row – compared to the equivalent distributions in the reference LJ, FRC, and EV ensembles – bottom row.
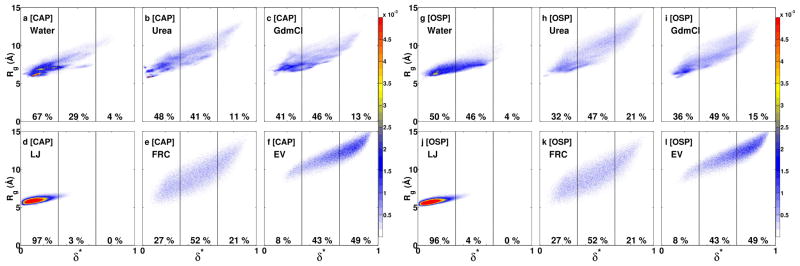
Each panel shows the populations in three equally sized non-overlapping intervals along the δ*-axis.
The mean Rg and δ* values for the backbones of CAP and OSP in 8 m urea and 8 m GdmCl are closer to the FRC limit than is the case for polyglycine. These values are shown in Figure 4 along with the internal scaling profiles, which provide visual evidence of the similarities between intra-backbone distances for the two peptides in the FRC limit and in denaturing environments. In order to enable direct comparisons to the results in Figure 1, the internal scaling profiles shown in Figure 4 were calculated using only backbone atoms. The sidechain priming of backbones is also illustrated by comparing the distributions for Rg and δ* shown in panels a and g from Figure 5 to that of panel a in Figure 2. In water, there is a significant diminution in the population of compact spherical conformations and an increase in the population of more expanded aspherical conformations, especially for OSP, which has no residues with bulky aromatic sidechains. The distributions of Rg and δ* values in 8 m urea and GdmCl show close agreement with those of the FRC limit, especially for the backbone of OSP, the peptide that is lacking in aromatic residues. The increased expansion of OSP’s backbone in water and in both denaturing environments is attributable to the lack of aromatic sidechains and to the presence of smaller aliphatic residues.
Quantifying the convergence toward random coil ensembles
In Figure 6 we quantify the effective concentrations of backbone amides for each of the three peptides in different environments and in the three reference ensembles. The values for the FRC and EV ensembles set the targets that are to be achieved for the effective concentrations if the ensembles are to converge upon one of the two canonical random coils. The effective concentration of amides is 19.2 M for polyglycine in water. This decreases to 17 M in 8 m GdmCl and 11.3 M in 8 m urea. However, the concentrations for polyglycine in the FRC and EV ensembles are 6.7 M and 4.8 M, respectively. Despite a 41% dilution of the effective amide concentration that is caused by chain expansion in 8 m urea, the conformational properties of the backbone do not converge upon either of the random coil ensembles. In order to converge on the FRC limit, chain expansion needs to engender at least a 65% dilution of the effective amide concentration. This degree of expansion requires suitable sidechains as seen from the results for CAP and OSP.
Figure 6.

Effective concentrations of backbone amides and fluctuations calculated using the average Rg values and their standard deviations for G15, CAP, and OSP.
The effective amide concentration in water is ca. 11 M for the polypeptide backbones of CAP and OSP. Therefore, in water, the sidechains act as a local solvent and induce a 42% reduction in the effective amide concentrations for CAP and OSP vis-à-vis polyglycine in water. This reduction is similar to the extent of dilution realized by polyglycine in 8 m urea. For CAP and OSP the effective concentrations of backbone amides are ca. 6.7 M and 2.7 M, for the FRC and EV limits, respectively. Chain expansion induced by denaturants leads to a further 39% dilution and Figure 6 shows that the concentrations for the FRC limit are achieved on average and as a result of conformational fluctuations for CAP and OSP in high concentrations of denaturants. In order to achieve congruence between the conformational properties of polypeptide backbones in denaturants and those of canonical random coils, there has to be suitable sidechain-mediated intrinsic expansion of the backbone in water in the absence of denaturants.
Quantifying relative occupancies of denaturant molecules around peptide sites
We used the integrals of site-site radial distribution functions to calculate the relative occupancies of denaturant molecules around peptide sites. These relative occupancies serve as proxies for preferential interaction coefficients that underlie the formalism of the solute partitioning model and analysis based on Kirkwood-Buff integrals.24,69–71 The relative occupancy parameters, denoted as π, were calculated as follows: For a given combination of atomic sites denoted as X on urea molecules and Y on a peptide sequence we calculated:
| (5) |
Here, g(rXY) is the radial distribution function that quantifies the relative probability of finding sites labeled X (either nitrogen or oxygen) on urea molecules within a distance rXY around peptide sites denoted as Y. Similarly, gu(rNO) is the radial distribution function that quantifies the relative probability of finding nitrogen atoms from urea molecules at a distance rNO in the bulk solution from oxygen atoms on other urea molecules. We focus only on the effects of direct interatomic interactions including hydrogen bonds, and therefore we consider a length scale of 4 Å for each of the radial distribution functions. If πXY is greater than unity, then there is accumulation of the urea site X around the peptide site Y and conversely, values of πXY less than unity point to depletion of urea sites X around the peptide sites Y. The results obtained for peptides in 8 m urea are shown in Figure 7 and those for 8 m GdmCl are shown in the supplementary material.
Figure 7.

Values of πXY for urea nitrogen (top row) and urea oxygen atoms (bottom row) around backbone and sidechain sites.
Our definition of πXY is analogous, although not identical, to the definition of preferential interaction coefficients or partition coefficients 14,72,73 that are central to the quantification of group-specific contributions to protein denaturation. The central distinction is that unlike πXY, which uses the strengths of donor-acceptor interactions between urea molecules or interactions between Gdm+ and Cl− ions for GdmCl as the reference states, canonical preferential interaction/partition coefficients are referenced to interactions between urea/Gdm+ with water molecules. Unfortunately, given the large box sizes, the numbers of independent simulations being performed, and our efforts to keep the storage demands tractable, we decided against saving the positions of water molecules for our simulations with denaturants. This choice, post facto, necessitated the use of a different reference state. Given the near ideality of urea-water mixtures24,45,69, our choice of reference state does not have a material impact on quantitative comparisons between our numbers for πXY and those reported by Record and coworkers based on vapor pressure osmometry measurements for model compounds.14,15,72,73 However, in GdmCl, additional complications are introduced by the favorable solvation of the Gdm+ ion and electrostatic repulsions/attractions with other Gdm+/Cl− ions in the bulk solution. This confounds our analysis of the site-site pair correlations because the energy scales that contribute to the reference distributions are fundamentally different and hence the values of π do not lend themselves to ready interpretations regarding accumulation versus depletion. Although reasonable inferences can be gleaned from the relative trends of Gdm+ occupancies around different sites, quantitative comparisons to experimental data will require the use as reference the pair correlation functions that quantify the strengths interactions between Gdm+ and water molecules as opposed to Gdm+ and Cl−.
Figure 7 shows the values for πXY where X is the urea nitrogen atom or the urea oxygen atom on the top and bottom rows respectively. The Y sites refer to different backbone and sidechain sites on each of the three peptides. Panel a in Figure 7 shows evidence for accumulation (πXY > 1) of the nitrogen atoms of urea molecules around each carbonyl oxygen atom of the polyglycine backbone. The magnitudes of πXY are similar around the different sites along the chain. There is a depletion of the nitrogen atoms of urea molecules around the amide nitrogen atoms of the backbone. The values of πXY are approximately unity for the oxygen atoms of urea around the carbonyl oxygen and amide nitrogen atoms of the backbone. This implies a lack of accumulation or depletion of urea oxygen sites around the polyglycine backbone – see panel d in Figure 7.
Panels b and e of Figure 7 show the πXY values obtained for the relative occupancies of urea oxygen (panel b) and urea nitrogen (panel e) atoms around backbone and sidechain sites of the CAP peptide. These plots show increased variation in the values of πXY around backbone sites when compared to what we calculate around similar sites for polyglycine. Secondly, the accumulation of urea nitrogen atoms around specific sidechain sites is equivalent to or higher than the accumulation of urea nitrogen atoms around backbone oxygen atoms. These sidechain sites include the primary amide oxygen atoms of Gln and Asn, atoms within the aromatic rings of Phe and Tyr, and atoms of imidazole rings of His. Similar trends are observed for the relative occupancies of urea nitrogen atoms around the backbone and sidechain sites of the OSP peptide. Here, there is accumulation around the carbon atoms of aliphatic sidechains and depletion of the urea nitrogen atoms around the positively charged amines of Lys sidechains. Urea oxygen atoms accumulate around the primary amide nitrogen atoms of Gln and Asn. They also accumulate around the sidechain atoms of Ser and the sites of on Arg and Lys sidechains that carry partial positive charges.
The results shown in Figure 7 can be compared quantitatively with the values for local solute partition coefficients designated as KP that were recently reported by Diehl et al.72 Salient agreements are as follows: On average, we obtain πXY values of 1.29, 1.20, 1.1, and 1.04 for the urea nitrogen atoms (X=N) around the backbone oxygen atoms, aromatic carbon atoms, aliphatic carbon atoms, and the hydroxyl oxygen atoms, respectively. These values compare favorably to the corresponding KP values of Diehl et al., which are 1.28 ± 0.02, 1.28 ± 0.02, 1.03 ± 0.02, and 1.08 ± 0.02 for the interactions of urea with amide oxygen, aromatic carbon, aliphatic carbon, and hydroxyl oxygen atoms, respectively. The central discrepancy between our πXY values and the KP values reported by Diehl et al. arise for the interaction of urea with amide nitrogen atoms. We obtain an average value of 0.9 for πXY where X=O for the interaction of urea oxygen atoms around the backbone amide nitrogen of G15 whereas Diehl et al. report a KP value of 1.10 ± 0.07 for the interaction of urea with backbone amide nitrogen atoms. The disagreement is greater when we consider the average πXY value of 0.64 for the interaction of urea oxygen atoms around the backbone amide nitrogen atoms of CAP and OSP, respectively. This discrepancy originates mainly from the effects of chain connectivity and occlusion of the backbone amide nitrogen by the sidechains in CAP and OSP, and both these features are absent in the model compounds used to arrive at partition coefficients.
DISCUSSION
Summary
Polypeptide backbones form compact globules in water. The preference for compact globular conformations persists in high concentrations of denaturants although modest expansion derives from the sampling of conformations that are mixtures. Therefore, the observed expansion of generic protein sequences in highly denaturing environments cannot be attributed to preferential interactions of denaturants with backbone moieties74. We uncover a two-stage mechanism to explain the effect of sidechains on protein denaturation. In water, in the absence of denaturants, favorable sidechain-solvent interactions induce a dilution in the effective concentration of polypeptide amides. Further accumulation of denaturant molecules around backbone and sidechain sites, in accord with the solute partitioning model14 and observations from detailed as well as coarse grained molecular dynamics simulations16,17,75–79, leads to expansion that results in conformational properties that become congruent with those of canonical random coils.
Our results highlight the need to consider the thermodynamic impact of the three-way competition among amide-amide, amide-water, and amide-denaturant interactions. In the absence of sidechains, the effective amide-amide interactions are stronger than the totality of the effects of amide-water and amide-denaturant interactions. Consequently, while the πXY values are in accord with the partition coefficients summarized by Diehl et al.72 for urea that these values alone do not help in quantifying the extent of chain expansion that is realized for a protein sequence. This is because the effects of chain connectivity on the effective amide-amide interactions cannot be incorporated into estimates based on model compounds. Our results suggest that the energy scales for effective amide-amide interactions are weakened by sidechains, which act as a local solvent matrix for backbone amides. This, sidechain priming effect, when combined with the additive contributions from preferential interactions of denaturant molecules with specific protein sites will give rise to chain expansion that is consistent with the statistical properties of canonical random coils. Our work highlights the importance of quantifying the effective concentration of backbone amides. This quantity, unlike solvent accessible surface areas, might be a useful descriptor of the effects of conformational properties because it can be converted into an estimate of the effective amide-amide interactions given knowledge of the energetics of amide-water and amide-denaturant interactions.
Impact of forcefields for denaturant molecules
Tran et al.35 used parameters from the OPLS-AA forcefield to model the effects of high concentrations of urea on the conformational properties of polyglycine. The combination of the KBFF forcefield for urea and TIP3P for water molecules reproduces the near ideality of urea-water mixtures across the entire solubility range of urea.45,46,69,80 In contrast, the combination of OPSL-AA81 and TIP3P shows considerable non-ideal clustering of urea molecules.69,80 This points to inaccuracies in the balance of solute-solute, solute-solvent, and solvent-solvent interactions with the OPLS-AA forcefield. These inaccuracies engender stronger clustering of urea molecules around polypeptide amides, which leads to significant chain expansion that is inconsistent with our simulation results based on the KBFF forcefield and our FCS data.
Connections to interpretations from the transfer model
Data regarding the denaturant dependence of solubility of backbone and sidechain analogs have been used to develop mechanistic inferences regarding protein denaturation 27,68. According to a specific version of the transfer model, preferential interactions with backbone amides provide the main driving force for denaturation in urea. In this interpretation, the picture that emerges is one of a backbone centric view for protein denaturation with sidechains playing a passive role 74. Our results indicate that pure polypeptide backbone constructs, devoid of sidechains, undergo modest expansion. Therefore, preferential interactions of urea with the backbone cannot explain the extent of denaturation measured for generic protein sequences. Further, we demonstrate the priming of the backbone in the absence of denaturants and we implicate this intrinsic expansion in water as a contributor to protein denaturation. The results in Figure 7 demonstrate that the primed backbone units interact differently with urea when compared to the backbone units devoid of sidechains. Overall, our findings are consistent with those reported by Moeser and Horinek 82. They used molecular dynamics simulations to assess the accuracy of the backbone centric version of the transfer model. Moeser and Horinek found significantly improved correlation between the transfer free energy and change in solvent accessible surface area upon unfolding when they use a “universal backbone” construct. This construct accounts for synergy between the backbone and sidechain moieties in the form of a “compensating error” in the transfer free energies of sidechain groups. In effect, Moeser and Horinek demonstrate that one can construct an additive transfer model if one were to account for synergistic rather than independent contributions of backbone and sidechain moieties to interactions with urea. These findings are conceptually congruent with our results, although we take a different route toward uncovering a mechanistic interpretation of the origins of preferential interactions. Recently Wei et al.83 reported simulation results, obtained using AMBER99 forcefield for peptides 84, the SPC/E water model 85, and the OPLS-AA forcefield for urea 81. These results point to sidechain-specificity in the sequential destabilization of backbone hydrogen bonds of beta hairpins. As noted above, the OPLS-AA forcefield shows considerable non-idealities in terms of anomalous clustering of urea molecules that engender spuriously strong interactions of urea with peptide amides as well. Therefore, we see the results of Wei et al. as being in qualitative agreement with the with the two-stage mechanism that we propose based on our results.
Reconciling our observations with the SAXS data of Kohn et al.5
Our results for the conformational properties of the backbones of CAP and OSP in 8 m urea and 8 m GdmCl are congruent with the FRC rather than EV limit. At first glance, this seems to be at odds with the scaling of Rg with N that is derived from SAXS and single molecule spectroscopy. There are four reasons for the discrepancy: (i) We compare the statistical properties of polypeptide backbones to those observed in reference ensembles for sequences with and without sidechains. Therefore, part of the disagreement originates in the fact that SAXS data for Rg include contributions from the scattering cross-sections of sidechain and backbone atoms. (ii) The finite size of CAP and OSP – they are 15-residue fragments as opposed to being bona fide full-length sequences – is another reason for the discrepancy between simulation results and the inferences of Kohn et al. For longer chains, the amino acid compositions within polymeric segments along the sequence will, on average, be in accord with the biases seen in globular proteins. Increased sidechain priming and the increased number of sites for denaturant accumulation should yield dimensions that match those observed in experiment. (iii) Meng et al.8 recently showed that an exponent of ν≈0.59 in high concentrations of urea is compatible with quantifiable deviations from the conformational properties in the EV limit. Although mean Rg values for highly denatured proteins scale as N0.59 with chain length, the actual Rg values are considerably smaller than those expected from the EV limit and this discrepancy increases with increasing chain length. Therefore, residual intra-chain attractions do prevail even in apparent good solvents. Meng et al. attribute these to low-likelihood non-native clusters of hydrophobic residues and consequently the degree of expansion beyond the FRC limit is actually rather modest for proteins in aqueous solutions with high concentrations of urea or GdmCl. (iv) Finally, our results suggest a higher degree of expansion for the backbone of OSP over that of CAP in 8 m GdmCl. This points to possible weaknesses of the KBFF forcefield in capturing cation-pi interactions that are expected to be important for denaturation in high concentrations of GdmCl.32
Unfolded states under folding conditions
Our results suggest that sidechain prime the backbone for expansion by diluting the effective concentration of amides even in the absence of denaturant molecules. This observation leads us to propose a two-stage mechanism for protein denaturation that highlights the importance of sidechains, not just in their interactions with denaturants, but also as determinants of the conformational properties of unfolded states in the absence of denaturants. It is noteworthy that early work based on nuclear magnetic resonance spectroscopy and stopped flow kinetics yielded evidence demonstrating that the unfolded state under folding conditions is clearly distinct from the ensembles sampled by generic proteins in high concentrations of denaturants.86–90 Our findings, taken together with results from early studies 86–90, raise the question of the effective exponent νeff that best describes the scaling with chain length of the dimensions of unfolded ensembles in the absence of denaturants. The transfer model implicitly stipulates that νeff ≈ 0.59, especially for proteins that show apparent two-state behavior.14,91 A second alternative is that νeff ≈ 0.33 implying that unfolded ensembles under folding conditions follow the properties of polypeptide backbones in water. Neither alternative is supported by our results (Figures 4–6).
The recent results of Hofmann et al.43 are particularly noteworthy. They used single molecule spectroscopy to estimate the values of νeff for the unfolded ensembles of several archetypal proteins under folding conditions. Single molecule spectroscopy affords the resolution to separate folded and unfolded populations under folding conditions. This allows one to follow the evolution of conformational properties of unfolded states as a function of denaturant concentration. The general consensus from these measurements is that the collapse transition is continuous92, although this observation is apparently contradicted by inferences from SAXS measurements that generally require high protein concentrations.10 The implication from single molecule measurements is that the unfolded ensemble under folding conditions is distinct from the denatured state ensemble sampled under highly denaturing conditions – a finding that agrees with earlier studies as well86–90. Ensemble measurements of several marginally stable proteins93–96 and high-throughput simulations based on distributed computing97,98 have yielded similar conclusions regarding the non-equivalence of unfolded states under folding conditions versus those sampled in highly denaturing or unfolding environments.
Of direct interest and relevance are the estimates for νeff obtained by Hofmann et al. for generic protein sequences in the absence of denaturant molecules. Their estimates suggest that νeff ranges from 0.4 to 0.51 depending on the overall hydrophobicity and charge content of the underlying sequence. In a two-stage mechanism, the value for νeff prescribes the degree of intrinsic expansion and hence the extent of dilution that needs to be achieved in order to realize an exponent of ν≈0.59 in denaturing environments. If we set ν=3/5 as the target for the scaling exponent in highly denaturing environments, then the extent of dilution needed to be achieved will scale as N1.8–3νeff with chain length 99 providing the degree of intrinsic expansion for unfolded states under folding conditions is quantified using νeff. The intrinsic expansion of backbones in solutions with high concentrations of denaturants is rather modest. Accordingly, the values for νeff, as dictated by amino acid composition, would have to be in the range reported by Hofmann et al. if generic denatured state ensembles are to have dimensions that are congruent with a scaling exponent of ν≈0.59.
Most proteins show similar amino acid compositional biases
In light of NMR, SAXS and single molecule data for the scaling exponent that characterizes the dimensions of highly denatured proteins, we propose that proteins that have been subjected to scaling analysis in high concentrations of denaturants have similar amino acid compositional biases. We used a simplified alphabet and divided amino acids into disorder promoting (Ala, Arg, Asp, Gln, Glu, Gly, His, Lys, Ser, Pro, Thr) versus order promoting (Asn, Cys, Ile, Leu, Met, Phe, Trp, Tyr,Val) sets.100,101 This partitioning is reminiscent of the “HP-code” of Dill and coworkers 102. We find that the ratio of disorder to order promoting residues is 64:36 for proteins in the dataset of Kohn et al.5 This ratio is 62:38 for sequences of single domains drawn from the PSBSelect25 database103 of non-redundant protein sequences. The implication is that the compositions of generic protein sequences support the tenets of the proposed two-stage mechanism. Accordingly, there will always be a sufficient fraction of sidechains to prime the backbone for expansion of unfolded states in water thus giving rise to values of νeff that are between 0.41–0.5 as estimated by Hofmann et al.43 The generic sidechain compositional biases within most protein sequences therefore encodes the possibility of counterbalancing of intra-chain and chain-solvent interactions for unfolded states in the absence of denaturants. This should give rise to statistical properties for unfolded states under folding conditions that are congruent with those of polymers in theta solvents.3,60 The broader implications for non-native states in cellular milieus 104–106 and protein folding kinetics 107 are of considerable interest and merit closer scrutiny.
Supplementary Material
Acknowledgments
We are grateful to D. Thirumalai for insightful discussions. This work was supported in part by the National Institutes of Health through grant 5R01NS056114 to RVP and by the Center for Biological Systems Engineering at Washington University in St. Louis (KG). A majority of the computations were performed using the facilities of the Washington University Center for High Performance Computing, which is partially funded by NIH grants 1S10RR022984 and 1S10OD018091.
Footnotes
ASSOCIATED CONTENT
The supplementary material includes versions of Figures 1 and 4 with error bars, analysis of the relative occupancies for peptides in 8 m GdmCl, and a discussion of the analysis of the amino acid compositional biases in generic foldable proteins. This material is available free of charge via the Internet at http://pbs.acs.org.
References
- 1.Tanford C. Adv Protein Chem. 1968;23:121. doi: 10.1016/s0065-3233(08)60401-5. [DOI] [PubMed] [Google Scholar]
- 2.Tanford C. Adv Protein Chem. 1970;24:1. [PubMed] [Google Scholar]
- 3.Flory PJ. Principles of Polymer Chemistry. Cornell University Press; Ithaca, NY: 1953. [Google Scholar]
- 4.Wilkins DK, Grimshaw SB, Receveur V, Dobson CM, Jones JA, Smith LJ. Biochemistry. 1999;38:16424. doi: 10.1021/bi991765q. [DOI] [PubMed] [Google Scholar]
- 5.Kohn JE, Millett IS, Jacob J, Zagrovic B, Dillon TM, Cingel N, Dothager RS, Seifert S, Thiyagarajan P, Sosnick TR, Hasan MZ, Pande VS, Ruczinski I, Doniach S, Plaxco KW. Proc Natl Acad Sci USA. 2004;101:12491. doi: 10.1073/pnas.0403643101. [DOI] [PMC free article] [PubMed] [Google Scholar]
- 6.Jha AK, Colubri A, Freed KF, Sosnick TR. Proc Natl Acad Sci USA. 2005;102:13099. doi: 10.1073/pnas.0506078102. [DOI] [PMC free article] [PubMed] [Google Scholar]
- 7.Meng WL, Luan BW, Lyle N, Pappu RV, Raleigh DP. Biochemistry. 2013;52:2662. doi: 10.1021/bi301667u. [DOI] [PubMed] [Google Scholar]
- 8.Meng WL, Lyle N, Luan BW, Raleigh DP, Pappu RV. Proc Natl Acad Sci USA. 2013;110:2123. doi: 10.1073/pnas.1216979110. [DOI] [PMC free article] [PubMed] [Google Scholar]
- 9.Haran G. Curr Opin Struct Biol. 2012;22:14. doi: 10.1016/j.sbi.2011.10.005. [DOI] [PMC free article] [PubMed] [Google Scholar]
- 10.Yoo TY, Meisburger SP, Hinshaw J, Pollack L, Haran G, Sosnick TR, Plaxco K. J Mol Biol. 2012;418:226. doi: 10.1016/j.jmb.2012.01.016. [DOI] [PMC free article] [PubMed] [Google Scholar]
- 11.Udgaonkar JB. Arch Biochem Biophys. 2013;531:24. doi: 10.1016/j.abb.2012.10.003. [DOI] [PubMed] [Google Scholar]
- 12.Bernado P, Blackledge M, Sancho J. Biophys J. 2006;91:4536. doi: 10.1529/biophysj.106.087528. [DOI] [PMC free article] [PubMed] [Google Scholar]
- 13.Holthauzen LMF, Rosgen J, Bolen DW. Biochemistry. 2010;49:1310. doi: 10.1021/bi9015499. [DOI] [PMC free article] [PubMed] [Google Scholar]
- 14.Record MT, Guinn E, Pegram L, Capp M. Faraday Discuss. 2013;160:9. doi: 10.1039/c2fd20128c. [DOI] [PMC free article] [PubMed] [Google Scholar]
- 15.Guinn EJ, Pegram LM, Capp MW, Pollock MN, Record MT. Proc Natl Acad Sci USA. 2011;108:16932. doi: 10.1073/pnas.1109372108. [DOI] [PMC free article] [PubMed] [Google Scholar]
- 16.Canchi DR, García AE. Annu Rev Phys Chem. 2013;64:273. doi: 10.1146/annurev-physchem-040412-110156. [DOI] [PubMed] [Google Scholar]
- 17.Canchi DR, Garcia AE. Biophys J. 2011;100:1526. doi: 10.1016/j.bpj.2011.01.028. [DOI] [PMC free article] [PubMed] [Google Scholar]
- 18.Stumpe MC, Grubmüller H. PLoS Comput Biol. 2008;4:e1000221. doi: 10.1371/journal.pcbi.1000221. [DOI] [PMC free article] [PubMed] [Google Scholar]
- 19.Stumpe MC, Grubmüller H. J Am Chem Soc. 2007;129:16126. doi: 10.1021/ja076216j. [DOI] [PubMed] [Google Scholar]
- 20.Hua L, Zhou R, Thirumalai D, Berne BJ. Proc Natl Acad Sci USA. 2008;105:16928. doi: 10.1073/pnas.0808427105. [DOI] [PMC free article] [PubMed] [Google Scholar]
- 21.England JL, Pande VS, Haran G. J Am Chem Soc. 2008;130:11854. doi: 10.1021/ja803972g. [DOI] [PMC free article] [PubMed] [Google Scholar]
- 22.Liu ZX, Reddy G, O’Brien EP, Thirumalai D. Proc Natl Acad Sci USA. 2011;108:7787. doi: 10.1073/pnas.1019500108. [DOI] [PMC free article] [PubMed] [Google Scholar]
- 23.Horinek D, Netz RR. J Phys Chem A. 2011;115:6125. doi: 10.1021/jp1110086. [DOI] [PubMed] [Google Scholar]
- 24.Kokubo H, Pettitt BM. J Phys Chem B. 2007;111:5233. doi: 10.1021/jp067659x. [DOI] [PMC free article] [PubMed] [Google Scholar]
- 25.Lee S, Shek YL, Chalikian TV. Biopolymers. 2010;93:866. doi: 10.1002/bip.21478. [DOI] [PubMed] [Google Scholar]
- 26.Huang JR, Gabel F, Jensen MR, Grzesiek S, Blackledge M. J Am Chem Soc. 2012;134:4429. doi: 10.1021/ja2118688. [DOI] [PubMed] [Google Scholar]
- 27.Auton M, Holthauzen LMF, Bolen DW. Proc Natl Acad Sci USA. 2007;104:15317. doi: 10.1073/pnas.0706251104. [DOI] [PMC free article] [PubMed] [Google Scholar]
- 28.Makhatadze GI. J Phys Chem B. 1999;103:4781. [Google Scholar]
- 29.Courtenay ES, Capp MW, Record MT., Jr Protein Sci. 2001;10:2485. doi: 10.1110/ps.ps.20801. [DOI] [PMC free article] [PubMed] [Google Scholar]
- 30.Lim WK, Roesgen J, Englander SW. Proc Natl Acad Sci USA. 2009;106:2595. doi: 10.1073/pnas.0812588106. [DOI] [PMC free article] [PubMed] [Google Scholar]
- 31.Mason PE, Brady JW, Neilson GW, Dempsey CE. Biophys J. 2007;93:L4. doi: 10.1529/biophysj.107.108290. [DOI] [PMC free article] [PubMed] [Google Scholar]
- 32.Mason PE, Dempsey CE, Neilson GW, Kline SR, Brady JW. J Am Chem Soc. 2009;131:16689. doi: 10.1021/ja903478s. [DOI] [PMC free article] [PubMed] [Google Scholar]
- 33.O’Brien EP, Dima RI, Brooks B, Thirumalai D. J Am Chem Soc. 2007;129:7346. doi: 10.1021/ja069232+. [DOI] [PubMed] [Google Scholar]
- 34.Jha SK, Marqusee S. Proc Natl Acad Sci USA. 2014;111:4856. doi: 10.1073/pnas.1315453111. [DOI] [PMC free article] [PubMed] [Google Scholar]
- 35.Tran HT, Mao A, Pappu RV. J Am Chem Soc. 2008;130:7380. doi: 10.1021/ja710446s. [DOI] [PubMed] [Google Scholar]
- 36.Teufel DP, Johnson CM, Lum JK, Neuweiler H. J Mol Biol. 2011;409:250. doi: 10.1016/j.jmb.2011.03.066. [DOI] [PubMed] [Google Scholar]
- 37.Crick SL, Jayaraman M, Frieden C, Wetzel R, Pappu RV. Proc Natl Acad Sci USA. 2006;103:16764. doi: 10.1073/pnas.0608175103. [DOI] [PMC free article] [PubMed] [Google Scholar]
- 38.Mukhopadhyay S, Krishnan R, Lemke EA, Lindquist S, Deniz AA. Proc Natl Acad Sci USA. 2007;104:2649. doi: 10.1073/pnas.0611503104. [DOI] [PMC free article] [PubMed] [Google Scholar]
- 39.Mao AH, Crick SL, Vitalis A, Chicoine CL, Pappu RV. Proc Natl Acad Sci USA. 2010;107:8183. doi: 10.1073/pnas.0911107107. [DOI] [PMC free article] [PubMed] [Google Scholar]
- 40.Marsh JA, Forman-Kay JD. Biophys J. 2010;98:2383. doi: 10.1016/j.bpj.2010.02.006. [DOI] [PMC free article] [PubMed] [Google Scholar]
- 41.Muller-Spath S, Soranno A, Hirschfeld V, Hofmann H, Ruegger S, Reymond L, Nettels D, Schuler B. Proc Natl Acad Sci USA. 2010;107:14609. doi: 10.1073/pnas.1001743107. [DOI] [PMC free article] [PubMed] [Google Scholar]
- 42.Das RK, Pappu RV. Proc Natl Acad Sci USA. 2013;110:13392. doi: 10.1073/pnas.1304749110. [DOI] [PMC free article] [PubMed] [Google Scholar]
- 43.Hofmann H, Soranno A, Borgia A, Gast K, Nettels D, Schuler B. Proc Natl Acad Sci USA. 2012;109:16155. doi: 10.1073/pnas.1207719109. [DOI] [PMC free article] [PubMed] [Google Scholar]
- 44.Jorgensen WL, Chandrasekhar J, Madura JD, Impey RW, Klein ML. J Chem Phys. 1983;79:926. [Google Scholar]
- 45.Weerasinghe S, Smith PE. J Phys Chem B. 2003;107:3891. [Google Scholar]
- 46.Weerasinghe S, Smith PE. J Chem Phys. 2004;121:2180. doi: 10.1063/1.1768938. [DOI] [PubMed] [Google Scholar]
- 47.Kaminski GA, Friesner RA, Tirado-Rives J, Jorgensen WL. J Phys Chem B. 2001;105:6474. [Google Scholar]
- 48.Best RB, Mittal J. J Phys Chem B. 2010;114:14916. doi: 10.1021/jp108618d. [DOI] [PubMed] [Google Scholar]
- 49.Best RB, Mittal J. J Phys Chem B. 2010;114:8790. doi: 10.1021/jp102575b. [DOI] [PubMed] [Google Scholar]
- 50.Karandur D, Wong KY, Pettitt BM. J Phys Chem B. 2014;118:9565. doi: 10.1021/jp503358n. [DOI] [PMC free article] [PubMed] [Google Scholar]
- 51.Daidone I, Neuweiler H, Doose S, Sauer M, Smith JC. PLoS Comput Biol. 2010;6 doi: 10.1371/journal.pcbi.1000645. [DOI] [PMC free article] [PubMed] [Google Scholar]
- 52.Pronk S, Pall S, Schulz R, Larsson P, Bjelkmar P, Apostolov R, Shirts MR, Smith JC, Kasson PM, van der Spoel D, Hess B, Lindahl E. Bioinformatics. 2013;29:845. doi: 10.1093/bioinformatics/btt055. [DOI] [PMC free article] [PubMed] [Google Scholar]
- 53.Vitalis A, Wang X, Pappu RV. Biophys J. 2007;93:1923. doi: 10.1529/biophysj.107.110080. [DOI] [PMC free article] [PubMed] [Google Scholar]
- 54.Hess B, Bekker H, Berendsen HJC, Fraaije JGEM. J Comput Chem. 1997;18:1463. [Google Scholar]
- 55.Miyamoto S, Kollman PA. J Comput Chem. 1992;13:952. [Google Scholar]
- 56.Bussi G, Zykova-Timan T, Parrinello M. J Chem Phys. 2009;130 doi: 10.1063/1.3073889. [DOI] [PubMed] [Google Scholar]
- 57.Parrinello M, Rahman A. J Appl Phys. 1981;52:7182. [Google Scholar]
- 58.Darden T, York D, Pedersen L. J Chem Phys. 1993;98:10089. [Google Scholar]
- 59.Vitalis A, Pappu RV. J Comput Chem. 2009;30:673. doi: 10.1002/jcc.21005. [DOI] [PMC free article] [PubMed] [Google Scholar]
- 60.Flory PJ. Statistical Mechanics of Chain Molecules. Oxford University Press; New York: 1969. [Google Scholar]
- 61.Steinhauser MO. J Chem Phys. 2005;122:094901. doi: 10.1063/1.1846651. [DOI] [PubMed] [Google Scholar]
- 62.Mao AH, Lyle N, Pappu RV. Biochem J. 2013;449:307. doi: 10.1042/BJ20121346. [DOI] [PMC free article] [PubMed] [Google Scholar]
- 63.Bykov S, Asher S. J Phys Chem B. 2010;114:6636. doi: 10.1021/jp100082n. [DOI] [PMC free article] [PubMed] [Google Scholar]
- 64.Sherman E, Itkin A, Kuttner YY, Rhoades E, Amir D, Haas E, Haran G. Biophys J. 2008;94:4819. doi: 10.1529/biophysj.107.120220. [DOI] [PMC free article] [PubMed] [Google Scholar]
- 65.Raos G, Allegra G. J Chem Phys. 1996;104:1626. doi: 10.1063/1.2193509. [DOI] [PubMed] [Google Scholar]
- 66.Raos G, Allegra G. Macromolecules. 1996;29:6663. [Google Scholar]
- 67.Crick SL, Ruff KM, Garai K, Frieden C, Pappu RV. Proc Natl Acad Sci USA. 2013;110:20075. doi: 10.1073/pnas.1320626110. [DOI] [PMC free article] [PubMed] [Google Scholar]
- 68.Auton M, Bolen DW. Biochemistry. 2004;43:1329. doi: 10.1021/bi035908r. [DOI] [PubMed] [Google Scholar]
- 69.Rösgen J, Pettitt BM, Bolen DW. Biochemistry. 2004;43:14472. doi: 10.1021/bi048681o. [DOI] [PubMed] [Google Scholar]
- 70.Gee MB, Smith PE. J Chem Phys. 2009;131 doi: 10.1063/1.3253299. [DOI] [PMC free article] [PubMed] [Google Scholar]
- 71.Pierce V, Kang M, Aburi M, Weerasinghe S, Smith PE. Cell Biochem Biophys. 2008;50:1. doi: 10.1007/s12013-007-9005-0. [DOI] [PMC free article] [PubMed] [Google Scholar]
- 72.Diehl RC, Guinn EJ, Capp MW, Tsodikov OV, Record MT., Jr Biochemistry. 2013;52:5997. doi: 10.1021/bi400683y. [DOI] [PMC free article] [PubMed] [Google Scholar]
- 73.Guinn EJ, Schwinefus JJ, Cha HK, McDevitt JL, Merker WE, Ritzer R, Muth GW, Engelsgjerd SW, Mangold KE, Thompson PJ, Kerins MJ, Record MT. J Am Chem Soc. 2013;135:9220. doi: 10.1021/ja400965n. [DOI] [PMC free article] [PubMed] [Google Scholar]
- 74.Bolen DW, Rose GD. Annu Rev Biochem. 2008;77:339. doi: 10.1146/annurev.biochem.77.061306.131357. [DOI] [PubMed] [Google Scholar]
- 75.Dasgupta A, Udgaonkar JB, Das P. J Phys Chem B. 2014;118:6380. doi: 10.1021/jp410019f. [DOI] [PubMed] [Google Scholar]
- 76.Xia Z, Das P, Shakhnovich EI, Zhou R. J Am Chem Soc. 2012;134:18266. doi: 10.1021/ja3031505. [DOI] [PubMed] [Google Scholar]
- 77.Das P, Xia Z, Zhou R. Langmuir. 2013;29:4877. doi: 10.1021/la3046252. [DOI] [PubMed] [Google Scholar]
- 78.O’Brien EP, Ziv G, Haran G, Brooks BR, Thirumalai D. Proc Natl Acad Sci USA. 2008;105:13403. doi: 10.1073/pnas.0802113105. [DOI] [PMC free article] [PubMed] [Google Scholar]
- 79.O’Brien EP, Brooks BR, Thirumalai D. Biochemistry. 2009;48:3743. doi: 10.1021/bi8021119. [DOI] [PMC free article] [PubMed] [Google Scholar]
- 80.Weerasinghe S, Smith PE. J Chem Phys. 2003;118:5901. [Google Scholar]
- 81.Duffy EM, Severance DL, Jorgensen WL. Israel J Chem. 1993;33:323. [Google Scholar]
- 82.Moeser B, Horinek D. J Phys Chem B. 2013;118:107. doi: 10.1021/jp409934q. [DOI] [PubMed] [Google Scholar]
- 83.Wei H, Shao Q, Gao YQ. Phys Chem Chem Phys. 2010;12:9292. doi: 10.1039/b924593f. [DOI] [PubMed] [Google Scholar]
- 84.Case DA, Cheatham TE, 3rd, Darden T, Gohlke H, Luo R, Merz KM, Jr, Onufriev A, Simmerling C, Wang B, Woods RJ. J Comput Chem. 2005;26:1668. doi: 10.1002/jcc.20290. [DOI] [PMC free article] [PubMed] [Google Scholar]
- 85.Berendsen HJC, Grigera JR, Straatsma TP. J Phys Chem. 1987;91:6269. [Google Scholar]
- 86.Jennings PA, Wright PE. Science. 1993;262:892. doi: 10.1126/science.8235610. [DOI] [PubMed] [Google Scholar]
- 87.Arcus VL, Vuilleumier S, Freund SMV, Bycroft M, Fersht AR. J Mol Biol. 1995;254:305. doi: 10.1006/jmbi.1995.0618. [DOI] [PubMed] [Google Scholar]
- 88.Zhang J, Peng XD, Jonas A, Jonas J. Biochemistry. 1995;34:8631. doi: 10.1021/bi00027a012. [DOI] [PubMed] [Google Scholar]
- 89.Chan CK, Hu Y, Takahashi S, Rousseau DL, Eaton WA, Hofrichter J. Proc Natl Acad Sci USA. 1997;94:1779. doi: 10.1073/pnas.94.5.1779. [DOI] [PMC free article] [PubMed] [Google Scholar]
- 90.Mok YK, Kay CM, Kay LE, Forman-Kay J. J Mol Biol. 1999;289:619. doi: 10.1006/jmbi.1999.2769. [DOI] [PubMed] [Google Scholar]
- 91.Tran HT, Pappu RV. Biophys J. 2006;91:1868. doi: 10.1529/biophysj.106.086264. [DOI] [PMC free article] [PubMed] [Google Scholar]
- 92.Ziv G, Thirumalai D, Haran G. Phys Chem Chem Phys. 2009;11:83. doi: 10.1039/b813961j. [DOI] [PMC free article] [PubMed] [Google Scholar]
- 93.Khandogin J, Raleigh DP, Brooks CL. J Am Chem Soc. 2007;129:3056. doi: 10.1021/ja0688880. [DOI] [PMC free article] [PubMed] [Google Scholar]
- 94.Sinha KK, Udgaonkar JB. Proc Natl Acad Sci USA. 2008;105:7998. doi: 10.1073/pnas.0803193105. [DOI] [PMC free article] [PubMed] [Google Scholar]
- 95.Shan B, Eliezer D, Raleigh DP. Biochemistry. 2009;48:4707. doi: 10.1021/bi802299j. [DOI] [PMC free article] [PubMed] [Google Scholar]
- 96.Cho JH, Meng WL, Sato S, Kim EY, Schindelin H, Raleigh DP. Proc Natl Acad Sci USA. 2014;111:12079. doi: 10.1073/pnas.1402054111. [DOI] [PMC free article] [PubMed] [Google Scholar]
- 97.Voelz VA, Singh VR, Wedemeyer WJ, Lapidus LJ, Pande VS. J Am Chem Soc. 2010;132:4702. doi: 10.1021/ja908369h. [DOI] [PMC free article] [PubMed] [Google Scholar]
- 98.Voelz VA, Jager M, Yao SH, Chen YJ, Zhu L, Waldauer SA, Bowman GR, Friedrichs M, Bakajin O, Lapidus LJ, Weiss S, Pande VS. J Am Chem Soc. 2012;134:12565. doi: 10.1021/ja302528z. [DOI] [PMC free article] [PubMed] [Google Scholar]
- 99.Rubinstein M, Colby RH. Polymer Physics. Oxford University Press; New York: 2003. [Google Scholar]
- 100.Dunker AK, Lawson JD, Brown CJ, Williams RM, Romero P, Oh JS, Oldfield CJ, Campen AM, Ratliff CR, Hipps KW, Ausio J, Nissen MS, Reeves R, Kang CH, Kissinger CR, Bailey RW, Griswold MD, Chiu M, Garner EC, Obradovic Z. J Molec Graph Model. 2001;19:26. doi: 10.1016/s1093-3263(00)00138-8. [DOI] [PubMed] [Google Scholar]
- 101.Campen A, Williams RM, Brown CJ, Meng J, Uversky VN, Dunker AK. Protein Pept Lett. 2008;15:956. doi: 10.2174/092986608785849164. [DOI] [PMC free article] [PubMed] [Google Scholar]
- 102.Chan HS, Dill KA. Proteins Struct Func Bioinform. 1998;30:2. [Google Scholar]
- 103.Griep S, Hobohm U. Nucl Acid Res. 2010;38:D318. doi: 10.1093/nar/gkp786. [DOI] [PMC free article] [PubMed] [Google Scholar]
- 104.Hong J, Gierasch LM. J Am Chem Soc. 2010;132:10445. doi: 10.1021/ja103166y. [DOI] [PMC free article] [PubMed] [Google Scholar]
- 105.Gershenson A, Gierasch LM. Curr Opin Struct Biol. 2011;21:32. doi: 10.1016/j.sbi.2010.11.001. [DOI] [PMC free article] [PubMed] [Google Scholar]
- 106.Wirth AJ, Gruebele M. Bioessays. 2013;35:984. doi: 10.1002/bies.201300080. [DOI] [PubMed] [Google Scholar]
- 107.Klimov DK, Thirumalai D. Phys Rev Lett. 1996;76:4070. doi: 10.1103/PhysRevLett.76.4070. [DOI] [PubMed] [Google Scholar]
Associated Data
This section collects any data citations, data availability statements, or supplementary materials included in this article.