

Significance
It is well known that slow intrinsic activity, as measured by resting-state fMRI in a variety of animals including humans, is organized into temporally synchronous networks. The question of whether intrinsic activity contains reproducible temporal sequences has received far less attention. We have previously shown that human resting-state fMRI contains a highly reproducible lag structure. Here, we demonstrate that this lag structure is of high dimensionality and consists of multiple highly reproducible temporal sequences, which we term “lag threads.” Moreover, we demonstrate that the well-known zero-lag temporal correlation structure of intrinsic activity emerges as a consequence of lag structure. Thus, lag threads may represent a fundamental and previously unsuspected level of organization in resting-state activity.
Keywords: fMRI, dynamics, resting state, intrinsic activity
Abstract
It has been widely reported that intrinsic brain activity, in a variety of animals including humans, is spatiotemporally structured. Specifically, propagated slow activity has been repeatedly demonstrated in animals. In human resting-state fMRI, spontaneous activity has been understood predominantly in terms of zero-lag temporal synchrony within widely distributed functional systems (resting-state networks). Here, we use resting-state fMRI from 1,376 normal, young adults to demonstrate that multiple, highly reproducible, temporal sequences of propagated activity, which we term “lag threads,” are present in the brain. Moreover, this propagated activity is largely unidirectional within conventionally understood resting-state networks. Modeling experiments show that resting-state networks naturally emerge as a consequence of shared patterns of propagation. An implication of these results is that common physiologic mechanisms may underlie spontaneous activity as imaged with fMRI in humans and slowly propagated activity as studied in animals.
Spontaneous (intrinsic) neural activity is ubiquitously present in the mammalian brain, as first noted by Hans Berger (1). Spontaneous activity persists in all physiological states, although the statistical properties of this activity are modified by level of arousal and ongoing behavior (2–8). Invasive studies in animals using diverse techniques—for example, local field potentials (9–11), voltage-sensitive dyes (12–15), and calcium imaging (4, 16, 17)—have demonstrated richly organized intrinsic activity at multiple temporal and spatial scales. The most used technique for studying whole-brain intrinsic activity in humans is resting-state functional magnetic resonance imaging (rs-fMRI). Biswal et al. first reported that slow (<0.1 Hz) spontaneous fluctuations of the blood oxygen level-dependent (BOLD) signal are temporally synchronous within the somatomotor system (18). This basic result has since been extended to multiple functional systems spanning the entire brain (19–22). Synchrony of intrinsic activity is widely referred to as functional connectivity; the associated topographies are known as resting-state networks (RSNs) (23) and, equivalently, intrinsic connectivity networks (24).
Almost all prior rs-fMRI studies have used either seed-based correlation mapping (25) or spatial independent components analysis (sICA) (26). Critically, neither or these techniques provide for the possibility that activity within RSNs may exhibit temporal lags on a time scale finer than the temporal sampling density. However, we recently demonstrated highly reproducible lags on the order of ∼1 s by application of parabolic interpolation to rs-fMRI data acquired at a rate of one volume every 3 s (SI Appendix, Fig. S1) (27). Moreover, this lag structure can be modified, with appropriate focality, by a variety of task paradigms (27).
Investigations of rs-fMRI lag structure previously have been limited by the concern that observed lags may reflect regional differences in the kinetics of neurovascular coupling rather than primary neural processes (28, 29). However, our previous dimensionality analysis demonstrated that there are at least two independent lag processes within the brain (27). The neurovascular model can account for only one of these. Hence, there must be at least one lag process that is genuinely of neural origin. We have since made significant methodological improvements (Theory and Fig. 1) that enable a more detailed characterization of lag structure in BOLD rs-fMRI data. We report our results in two parts.
Fig. 1.

Illustration of lag threads. A shows three patterns of propagation (lag threads) through six nodes. The objective is to demonstrate the mapping between lag structure and PCA. The illustration is not intended as a model of propagation in neural tissue. B shows the superposition of the three lag threads. C shows the time-delay matrix (TD) recovered by analysis of the superposed time series in B, using the technique illustrated in SI Appendix, Fig. S1 (27). The bottom row of C shows the latency projection of TD, computed as the average over each column. D illustrates the latency projection as a node diagram. This projection represents nodes that are, on average, early or late. Critically, the projection fails to capture the full lag structure. E illustrates eigendecomposition of the covariance structure of TDz, derived from TD by removing the mean of each column (SI Appendix, Eqs. S4–S8). There are three nonzero eigenvalues, indicating the presence of three lag threads. The eigenvectors corresponding to these eigenvalues are the thread topographies (shown above the eigenvalues). The lag thread sequences defined in A were accurately recovered purely by eigen-analysis of TDz. It should be noted that the lag threads in this illustration were a priori constructed to be mutually orthogonal (SI Appendix, Eq. S7). Hence, they were neatly recovered intact by eigendecomposition of TDz. Also, although the nodes in this illustration are represented as foci, the algebra applies equally well to voxels, ROIs, or extended, possibly disjoint, topographies.
In part I, we present an expanded view of the lag structure within the normal adult human brain derived from BOLD rs-fMRI data in 1,376 individuals. Specifically, we show that at least eight orthogonal lag processes can be reproducibly demonstrated. We refer to these processes as “threads” by way of analogy with modern computer programming practice in which single applications contain multiple, independent thread sequences.
In part II, we investigate the relation between lag threads and zero-lag temporal correlations—that is, conventional, resting-state functional connectivity. We find that, although there is no simple relation between lag and zero-lag temporal correlation over all pairs of voxels, apparent propagation is largely unidirectional within RSNs. We also show that the zero-lag temporal correlation structure of rs-fMRI arises as a consequence of lags, whereas the reverse is not true. These results suggest that lag threads account for observed patterns of zero-lag temporal synchrony and that RSNs are an emergent property of lag structure.
Theory
We define the lag between two fMRI time series by computing the cross-covariance function at intervals of one frame and identifying the local extremum using parabolic interpolation (SI Appendix, Fig. S1). This analysis assumes the existence of a single temporal lag between regions. The validity of this assumption depends on the fact that BOLD fMRI time series are aperiodic (30, 31) (see SI Appendix, Lagged Cross-Covariance Curves Exhibit a Single Peak for additional discussion of this point). Measured lags at the group level (i.e., averaged over individuals) typically assume values in the range ±1 s. Apparent propagation is inferred on the basis of observed lag between two time series. This formulation makes no assumptions regarding the path over which the activity “propagates” between regions. Thus, “propagation,” as defined here, entails lags on the order of ∼1 s in activity over spatial scales on the order of centimeters.
As an aid to understanding the methodology, we describe our approach to characterizing lag structure using a simple illustrative model containing three orthogonal lag processes (threads) propagating through six nodes (Fig. 1). Apparent propagation, as defined here, is shown using synthetic time series with “1/f” spectral content duplicated from real BOLD rs-fMRI data (31) (see SI Appendix, Simulating Synthetic BOLD fMRI Time Series for further detail) propagating through six nodes (Fig. 1A). The superposition of the three thread processes is shown in Fig. 1B. Analysis of the superposed time series observed at the six nodes (using the procedure illustrated in SI Appendix, Fig. S1) yields the time delay matrix shown in Fig. 1C; we call this matrix TD. Having computed TD, we can compute a mean for each column, using the previously described projection strategy for computing BOLD rs-fMRI lag topographies (27). In the case of a single lag process, the projection strategy is sufficient to recover the ordering (SI Appendix, Figs. S2 and S3). However, as shown in Fig. 1D, in the case of multiple superposed lag processes, the column-wise projection generates an oversimplified approximation of the dynamic system.
In the present work, to recover lag processes in multidimensional time series, we use principal components analysis (PCA). PCA assumes linear superposition of components. The validity of this assumption is discussed in SI Appendix, Validity of Applying PCA to Recover Lag Thread Topographies. In each column, , of the time delay matrix TD, the vector corresponding to column i, is a lag map of the system with reference to time series i. That is, the first column of is a lag map of the system with respect to the first time series, and so on. Now, consider the matrix, TDz, constructed by subtracting the mean of each column from TD. The columns of TDz are zero-centered lag maps. Application of PCA to TDz recovers the eigenspectrum representing the number of lag threads present in the system. Fig. 1E shows that precisely three nonzero eigenvalues are found in this illustrative case. The eigenvectors corresponding to these nonzero eigenvalues can be used to recover the topography of the lag threads; the node diagrams above the nonzero eigenvalues in the Lower Right panel of Fig. 1 illustrate the recovered lag processes. In the case of no delays (SI Appendix, Fig. S2) or only a single set of delays (SI Appendix, Fig. S3), PCA finds zero or one nonzero eigenvalue. Thus, TD analysis is sufficient to assess the number of lag threads in the system. Although Fig. 1 illustrates TD and TDz as square matrices (i.e., the number of voxels in each lag map is equal to the number of lag maps), lag thread computation is algebraically well defined also when the number of voxels greatly exceeds the number of lag maps.
To increase the signal-to-noise ratio (SNR) in real BOLD rs-fMRI data, we produced (6 mm)3 voxel resolution lag maps from time series extracted from 330 (15 mm)3 cubic regions of interest (ROIs), uniformly distributed throughout gray matter (see SI Appendix for further detail).
Methods
A large data set (n = 1,376) was obtained from the Harvard-MGH Brain Genomics Superstruct Project (32) (Table 1). The 1,376 subjects were randomly divided into two groups of 688 subjects to test the reproducibility of our analyses. Please see SI Appendix for further details regarding preprocessing and computational methods.
Table 1.
Resting state fMRI data
| Group | 1 | 2 |
| Number of subjects | 688, 402 female | 688, 383 female |
| Age in years | 21.5 ± 3.1, SD | 21.3 ± 2.7, SD |
| Scanner | Siemens Tim Trio | |
| Acquisition voxel size | (3 mm)3 | |
| Flip angle | 85° | |
| Repetition time, s | 3.00 | |
| Number of frames | 124 × 2 runs | |
| Citation | Buckner et al., 2012 (32) | |
Results
Part I.
Existence and reproducibility of lag threads.
Fig. 2 shows the topography of four lag threads derived from real BOLD rs-fMRI data acquired in the first group of 688 subjects. Blue hues indicate regions that are early—that is, “sources” of propagated BOLD activity—and red hues indicate regions that are late—that is, “destinations” of propagated BOLD activity. The range of lag values in each thread is ∼2 s. The threads exhibit a high degree of bilateral symmetry. Interestingly, although specific anatomical structures are often prominent sources or destinations within threads, these topographies do not respect RSN boundaries (Fig. 2 and Movies S1–S4). BOLD rs-fMRI signals propagate in lag threads both within and across RSNs. We have previously reported this principle in relation to the distribution of lag values over pairs of nodes in the brain (27).
Fig. 2.

Four lag threads computed from real BOLD rs-fMRI data in the first group of 688 subjects. Blue and red hues represent, respectively, voxels that are early or late relative to the thread mean. Each map is in units of seconds. Note that brainstem and subcortical regions are early in thread 1, whereas higher order cortical regions such as frontopolar cortex (seen in transverse slices) are late. The significance of these observations is considered in Discussion.
Fig. 3A shows the first 20 eigenvalues derived by spatial PCA of the lag threads derived from the first 688-subject group (the first four threads of which are illustrated in Fig. 2). In Fig. 1E, only nonzero eigenvalues correspond to lag threads, making it easy to infer the dimensionality of the system. In real data, the presence of noise means that all eigenvalues are nonzero; hence, dimensionality must be estimated (33). Using an information criterion, we estimated the dimensionality in Fig. 3A to be 8 (see SI Appendix for further detail). To explore the reproducibility of our results, we applied the same calculations to a second, separate group of 688 subjects and obtained eigenspectrum and dimensionality estimates indistinguishable from the results shown in Fig. 3A. Reproducibility of lag thread topographies across the two groups of 688 subjects is illustrated in Fig. 3B. It is evident that lag threads are highly reproducible across groups. The full topographies of the first eight lag threads are reported in SI Appendix, Figs. S7–S14.
Fig. 3.

Dimensionality and reproducibility of lag threads. A displays the first 20 eigenvalues derived from the BOLD rs-fMRI lag structure computed in the first group of 688 subjects; the maximum likelihood dimensionality estimate is 8 (SI Appendix, Eq. S7). The orange box encloses the first eight eigenvalues. B shows the spatial correlation matrix (Pearson r) representing the first eight lag thread maps in the first and second groups of 688 subjects. The rows and columns are ordered by thread map (T1, T2, …) and group (G1, G2). The 2 2 blocks of high correlation along the diagonal demonstrate that lag thread topographies are highly reproducible across the two groups.
Multiple lag threads in a selected number of regions.
The high dimensionality of the lag system shown in Fig. 3 theoretically could reflect our specific choices of ROIs and lag map resolution (SI Appendix, Fig. S5). To test this possibility, we constructed 17 ROIs by thresholding the eight thread maps to define prominent sources and destinations. These ROIs are shown in Fig. 4A. Many of these regions have been previously identified as critical nodes that organize the brain’s ongoing activity (34). The corresponding 17 × 17 time delay matrices in the two groups of 688 subjects are each shown in Fig. 4B. Excellent reproducibility is evident (Fig. 4C). Moreover, the maximum likelihood dimensionality estimate in both groups is 8 (Fig. 4D), precisely the same result shown in Fig. 3A. Fig. 4 demonstrates that high dimensional lag structure can emerge from a relatively small set of ROIs as long as key regions of the brain are represented. Seed-based lag maps for these ROIs are shown in SI Appendix, Figs. S15–S24.
Fig. 4.

High dimensionality lag structure derived from selected ROIs. A shows 17 ROIs obtained by thresholding the first eight lag thread maps derived in the first group of 688 subjects (Fig. 2 and SI Appendix, Figs. S7–S14). These ROIs represent maximally early and late nodes over several lag threads. The color code in A identifies ROIs without relation to latency. B shows the 17 17 time delay matrix (TD) corresponding to these ROIs in both groups of 688 subjects. These matrices are exactly skew-symmetric (27). C shows a scatter plot of group 2 versus group 1 unique (upper triangle) TD values; excellent reproducibility is evident. D shows the 17 eigenvalues of TDz in the first group of 688 subjects. The second group of 688 subjects yielded a nearly identical eigenspectrum (not shown in D as the plotted points overlap). In both groups, the estimated dimensionality is 8, in agreement with Fig. 3.
Part II.
Lag threads in relation to zero-lag temporal correlation.
Having demonstrated the existence and reproducibility of multiple lag threads in human rs-fMRI data, we next investigated the relation of lag threads to zero-lag temporal correlation structure. To this end, we examined shared patterns of propagation across lag threads. We did this by defining a matrix, , whose columns represent the topographies of the first eight lag threads (in units of seconds, as in Fig. 2). We include eight lag threads on the basis of the dimensionality estimate of lag structure (Fig. 3). is a 6528 × 8 (voxels threads) matrix, where each voxel has eight latency values (in units of seconds), one for each thread. To find common patterns of propagation across lag threads, we computed, across all voxel pairs, correlations in latency values across lag threads [], where k is the number of lag threads (SI Appendix, Eq. S9). The corresponding 6526 × 6526 (voxels voxels) correlation matrix (Fig. 5A) reveals commonalities in signal propagation across lag threads (see SI Appendix for additional discussion). Critically, the voxel-wise correlation structure across lag threads (Fig. 5A) resembles the conventional zero-lag temporal correlation structure of BOLD rs-fMRI (Fig. 5B) (RSN membership as in ref. 35). We quantitatively confirmed the similarity between the correlation structures in Fig. 5 A and B by computing the Pearson correlation between the unique values in each matrix (r = 0.41). Thus, there is a correspondence between common patterns of propagation across lag threads (Fig. 5A) and the zero-lag temporal structure of rs-fMRI.
Fig. 5.

Voxel:voxel correlation structure of two different measures derived from the first group of 688 subjects. A shows the voxel-wise correlation matrix computed over latency values in the eight lag threads (SI Appendix, Eq. S9). These correlations represent the extent to which voxel pairs exhibit similar latency values across all eight lag threads. B shows the corresponding zero-lag temporal correlation matrix. Note similarity of block structure in A and B (Pearson r = 0.41). As there are 6,526 (6 mm)3 voxels in each map, the full correlation matrices are 6526 6526. The matrices displayed in A and B have been masked to include only voxels with a ≥90% chance of belonging to one of eight RSNs (35) (SI Appendix, Fig. S5). Thus, the displayed matrices are 1065 1065. The rows and columns are ordered by RSN: dorsal attention network (DAN), ventral attention network (VAN), auditory network (AUD), primary SMN, visual network (VIS), frontoparietal network (FPC), language network (LAN), and default mode network (DMN). C displays a 2D histogram, compiled over voxel pairs, of lag versus temporal correlation. All 6526 6526 voxel pairs are represented, excluding those within 1 cm of each other (to reduce the influence of local correlations). Note no systematic relation, over voxel pairs, of lag versus zero-lag temporal correlation (r = –0.03). The same result is found using only the voxels shown in A and B (r = –0.02).
The similarity between the matrices shown in Fig. 5 A and B raises the question of whether, across pairs of voxels, lag is directly related to zero-lag temporal correlation. Hypothetically, voxel pairs exhibiting shorter temporal lags could exhibit higher temporal correlation at zero lag. However, a 2-dimensional histogram of zero-lag Pearson r versus lag for all voxel pairs (Fig. 5C) demonstrates no systematic relation. A second possibility is that regions belonging to the same RSN are iso-latent (i.e., exhibit the same lag value) in each lag thread. For example, the entire default mode network could be early in one thread but late in another. However, the topographies in Fig. 2 show that this is not the case. Additionally, we have previously shown that RSNs are not iso-latent. Rather, the range of intra- and inter-RSN lag values is the same and no RSN is either early or late as a whole (figure 9 in ref. 27). Therefore, the similarity between the cross-thread correlations (Fig. 5A) and zero-lag BOLD rs-fMRI temporal correlations (Fig. 5B) requires a more subtle explanation. To provide the basis for this explanation, we introduce the concept of “lag thread motifs.”
Fig. 9.

Simulated time series with the same zero-lag temporal correlation structure as rs-fMRI does not contain a consistent lag structure. In this simulation, we produced 12-min epochs of synthetic BOLD time series for a set of 36 previously defined ROIs (72) such that spectral content and zero-lag temporal correlation structure of each simulation was matched to real data (SI Appendix). A single 12-min simulation closely approximates the true zero-lag temporal correlation structure of rs-fMRI, as shown by the close agreement between the group average structure of real data (A) and a single simulation (B). The zero-lag temporal correlation matrix and time delay matrix (TD; as in Fig. 4B) were computed for each simulation. The blue line in C plots the correlation between the upper triangle values in the zero-lag correlation matrix of real group average data versus simulated data as a function of the number of simulations. The red line plots the same quantity as a function of number of real data sets. C demonstrates that the zero-lag temporal correlation structure of real and simulated data both rapidly converge to the same mean. D plots the squared sum of the upper triangle of the time delay matrix as a function of the quantity of included data. The blue line (simulated data) rapidly converges to zero; thus, the average time delay structure of simulated data converges to the all zeros matrix. In contrast, the red line (real data) converges to a nonzero value. D demonstrates that a consistent, nontrivial lag structure is present in real but not simulated rs-fMRI time series.
Lag thread motifs.
We illustrate the concept of a lag thread motif using a four-voxel model system with two lag threads (Fig. 6). The overall pattern of propagation between the four voxels is different in the two threads (Fig. 6A). However, the sequence of propagation through voxels 1 and 2 is identical. Voxels 1 and 2, therefore, constitute a lag thread motif: a set of regions in which the sequence of propagation is the same across lag threads. There are no other motifs in Fig. 6. The patterns of propagation shown in Fig. 6A are realized in Fig. 6B using synthetic time series with 1/f spectral content duplicating that of real BOLD rs-fMRI data (31) (SI Appendix, Simulating Synthetic BOLD fMRI Time Series). Again, although the overall pattern of propagation differs between threads, the sequence of propagation between the first two voxels is preserved (dotted arrows in the dark red boxes).
Fig. 6.
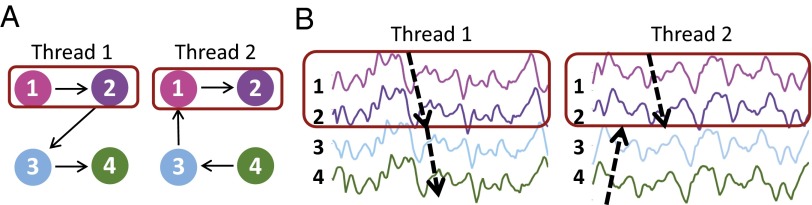
Simple illustration of lag thread motifs. A illustrates two lag threads propagating through four nodes. The overall pattern of propagation differs in the two threads, but the sequences through nodes 1 and 2 are the same (red box). Thus, nodes 1 and 2 represent a lag thread motif. B illustrates simulated time series realized with spectral content duplicated from real BOLD rs-fMRI data (see SI Appendix for further details). The sequences of propagation (dotted arrows) are as in A. Red boxes indicate the preserved sequence (thread motif). True lag threads are mutually orthogonal; here, this constraint is ignored to illustrate the idea of a thread motif using a minimal number of nodes. As in Fig. 1, nodes can represent voxels or ROIs.
We asked whether the thread motif model can explain the findings in Fig. 5, specifically, the similarity between the cross-thread correlations (Fig. 5A) and zero-lag temporal correlations (Fig. 5B), and the absence of a systematic relation between zero-lag Pearson r versus lag for all voxel pairs (Fig. 5C). We explore this question in Fig. 7, which presents a simulation experiment based on the model presented in Fig. 6, but scaled up to include 30 voxels, eight orthogonal lag threads, and two thread motifs (see SI Appendix for details concerning generation of orthogonal model lag threads; SI Appendix, Fig. S6 shows an explicit description of the model). Motif 1 propagates through voxels 1–5; motif 2 propagates through voxels 6–10. Fig. 7A shows the voxel-wise correlation across simulated lag threads (paralleling Fig. 5A). Voxels sharing a thread motif necessarily exhibit perfectly correlated lag sequences (diagonal blocks labeled “1” and “2”). Fig. 7B shows the 30 × 30 zero-lag temporal correlation matrix (paralleling Fig. 5B) computed on the basis of the synthetic 1/f time series representing the lag threads (see SI Appendix for additional details). Thus, thread motifs are sufficient to induce lag thread correlation structure, as in real rs-fMRI data (Fig. 5A). Moreover, the matrices shown in Fig. 7 A and B (synthetic data) exhibit the same similarity as the matrices shown in Fig. 5 A and B (real data). This similarity suggests that the existence of shared lag thread motifs is sufficient to explain zero-lag temporal correlations. We note that this model depends on the 1/f spectral content of BOLD rs-fMRI time series. The existence of an association between lag structure and temporal correlation requires that the underlying time series exhibit some degree of autocorrelation; lag structure would be dissociated from correlation structure in a system in which the signals were comprised of infinitely narrow impulses or white noise. Finally, Fig. 5C indicates that there is no systematic relationship in real BOLD rs-fMRI data across voxel pairs between conventional zero-lag Pearson r and lag. This feature is present also in our simulation (Fig. 7C). The low correlation between conventional zero-lag Pearson r and lag in the synthetic data (r = –0.04) confirms that thread motifs need not introduce a systematic relation between these quantities. Therefore, the results of Fig. 7 (simulation) suggest that the results shown in Fig. 5 (real data) can be explained if thread motifs correspond to conventional RSNs—in other words, if intra-RSN sequences of propagation are preserved across threads.
Fig. 7.

Scaled up illustration of lag thread motifs. This simulation includes 30 voxels (equivalently, 30 ROIs), eight orthogonal lag threads, and two thread motifs. The two thread motifs consist of voxels 1–5 and voxels 6–10, respectively. A displays the voxel:voxel correlation matrix across latency values in the eight simulated lag threads (as in Fig. 5A and SI Appendix, Eq. S9). Voxels belonging to a thread motif are perfectly correlated (diagonal blocks labeled 1 and 2). B illustrates a zero-lag temporal correlation matrix (as in Fig. 5B), computed from time series reconstructed on the basis of thread structure (as in Fig. 6B). Voxels belonging to a thread motif exhibit high zero-lag temporal correlation. C displays a scatter plot of the pairwise lag versus pairwise zero-lag temporal correlation, as in Fig. 5C. Note no systematic relation, for pairs of voxels, between lag and zero-lag temporal correlation. Thus, thread motifs do not impose a systematic relation between these quantities. D shows a scatter plot as in C but limited to voxels within the first thread motif (similar results are obtained with the second motif). For voxel pairs within a motif, lag and zero-lag temporal correlation are negatively correlated.
RSNs correspond to lag thread motifs.
The simulation in Fig. 7 suggests a model in which conventionally defined RSNs correspond to thread motifs and implies two testable predictions. First, if the sequence of propagation is preserved within thread motifs, it follows that the dimensionality of intra-RSN lag structure should be 1 (see SI Appendix, Fig. S3 for further explanation). Second, although the simulation in Fig. 7 contains no systematic relation, over all voxel pairs, between lag and zero-lag temporal correlation (Fig. 7C), if we examine the relationship between zero-lag Pearson r and lag considering only voxels within a motif, a substantial negative correlation emerges (r = –0.75; Fig. 7D). The basis for this relation is that, within a single thread motif, more nearly synchronous time series must be more correlated. However, in general, threads propagate in multiple directions outside of motifs (e.g., as in Fig. 6). Consequently, relations of the type shown in Fig. 7D are obscured in Figs. 5C and 7C, because the fraction of intramotif voxel pairs is a small fraction of all voxel pairs. Therefore, if RSNs correspond to lag thread motifs, voxel pairs within an RSN should exhibit a substantial negative correlation between zero-lag Pearson r and lag (Fig. 7D).
We test these predictions in Fig. 8 A and B. Fig. 8A shows the maximum likelihood dimensionality of the temporal lag structure calculated within RSNs as defined in ref. 35. As predicted by the thread motif model, the maximum likelihood dimensionality is 1 for all RSNs except the sensorimotor network (SMN). Fig. 8B shows the Pearson correlation derived from a scatter plot of zero-lag temporal correlation versus lag over all intranetwork voxels (as in Figs. 5C and 7C). Again, as predicted by the thread motif model, there is a substantial negative correlation in every RSN except the SMN. Therefore, although lag threads represent various patterns of propagation with generally reciprocal signaling across regions, within each RSN, BOLD rs-fMRI signal propagation is largely unidirectional.
Fig. 8.

Thread motifs in real BOLD rs-fMRI data. A shows the maximum likelihood dimensionality of lag structure computed within RSNs as defined in Fig. 5. With the exception of the SMN, intra-RSN lag structure has a dimensionality of 1. SMN is an exception because the ordering of primary motor (M) and primary sensory (S) cortices is not fixed. M is earlier than S in some threads—for example, thread 3 (T3)—whereas the reverse is true in other threads—for example, thread 7 (T7). B shows the correlation, over pairs of voxels within RSNs, between lag and zero-lag temporal correlation. With the exception of the SMN, there is a substantial negative correlation between these quantities in each RSN. C shows a zero-lag temporal correlation matrix for BOLD rs-fMRI time series reconstructed on the basis of eight lag threads derived from real data (Fig. 2). Note the similarity of the matrices shown in C and Fig. 5B (both 1065 × 1065). D shows a scatter plot of the unique (upper triangle) values in the simulated (C) versus real (Fig. 5B) zero-lag temporal correlation matrices. Dark blue dots represent intra-RSN relations, whereas light blue dots represent inter-RSN relations; the dark blue dots are semitransparent to make all of the data visible. The line of identity is indicated in red. The scatter plot demonstrates substantial agreement between the reconstructed and real data (r = 0.58 over all data, r = 0.62 for intra-RSN relations, and r = 0.24 for inter-RSN relations).
The apparently anomalous dimensionality result obtained with respect to the SMN (Fig. 8 A and B) highlights an interesting point concerning the correspondence between RSNs and thread motifs. Conventional BOLD rs-fMRI analyses generally agglomerate primary somatomotor and somatosensory areas into a single RSN (22, 36) (see also Fig. 5B). Separation of motor and sensory areas into distinct parcels has only recently been achieved using a boundary mapping technique (37). In contrast, lag threads sharply distinguish primary sensory versus primary motor cortices (Fig. 8A). Primary motor cortex is earlier than primary sensory cortex in most threads (Fig. 2, threads 3 and 4), but the ordering is reversed in other threads (SI Appendix, Figs. S11 and S12). This feature is also illustrated in Fig. 8A. Consequently, the observed dimensionality of lag structure in the SMN (as conventionally defined) is 2 (Fig. 8A). We verified that the dimensionality of lag structure in the separated motor and sensory components of the SMN is 1 in both cases.
Zero lag temporal synchrony emerges from lag structure.
The previous results suggest that RSNs correspond to lag thread motifs—that is, that the sequence of propagation within RSNs is largely preserved across lag threads. This finding raises the possibility that zero-lag temporal synchrony (i.e., conventional functional connectivity) within RSNs emerges from lag structure. To test this hypothesis, we converted each of the first eight lag threads extracted from real data (Fig. 2) into time series with the same spectral content as BOLD rs-fMRI (as in Fig. 6B; see SI Appendix, Simulating Lag Threads for further details). We then superposed these time series, weighted in proportion to their respective eigenvalues (Fig. 4A and SI Appendix, Eq. S9), to reconstruct synthetic BOLD rs-fMRI data with appropriate spectral content and imposed structure derived only from lag threads. The zero-lag temporal correlation matrix computed from the reconstructed time series is shown in Fig. 8C. This matrix is strikingly similar to the zero-lag temporal correlation matrix computed from real BOLD rs-fMRI data (Fig. 5B). Fig. 8D shows a scatterplot of the real (Fig. 5B) versus reconstructed (Fig. 8C) zero-lag temporal correlation values. Light blue and dark blue dots in Fig. 8D represent inter-RSN and intra-RSN correspondence, respectively. The scatterplot quantitatively demonstrates substantial agreement between the zero-lag temporal correlation structure of real and reconstructed data (r = 0.58). The model better predicts intra-RSN correlation structure (r = 0.62) versus inter-RSN correlation structure (r = 0.24); the implication of this difference is at present not understood. Nevertheless, Fig. 8 C and D suggests that intra-RSN synchrony RSNs is an emergent property of lag structure.
Fig. 8 demonstrates that zero-lag temporal correlation can arise from patterns in lag. Fig. 9 demonstrates that lag structure is not uniquely determined by zero-lag temporal correlation structure. To illustrate this point, we generated synthetic, multidimensional time series with spectral content and second order statistics (i.e., zero-lag correlation structure) matched to that of the real BOLD rs-fMRI data (Fig. 9 A and B; see SI Appendix, Zero-Lag Temporal Correlation Need Not Specify Lag Structure for details). Fig. 9C shows that the average zero-lag temporal correlation matrix, in both synthetic (blue) and real (red) data, converges to the average structure derived from real data. Fig. 9D concerns lag and demonstrates a very different result. In particular, the average time delay matrix computed over synthetic data rapidly converges to the all zeros matrix (blue line in Fig. 9D), whereas the TD matrix computed over real data converges to a consistent, nonzero delay structure (red line in Fig. 9D). Fig. 8C demonstrates that lag structure can be used to reconstruct zero-lag temporal correlations, whereas Fig. 9 shows that the reverse does not hold. The implication of these results is that lag structure represents the more fundamental level of organization in rs-fMRI.
Discussion
Summary of Findings.
The structure of human intrinsic brain activity, as imaged with resting-state BOLD fMRI, has been understood predominantly in terms of zero-lag, temporal synchrony within widely distributed functional systems (RSNs). We previously demonstrated that interregional lags are reproducibly present in BOLD rs-fMRI data and that these lags are not attributable to hemodynamic factors (27). We have substantially expanded on our previous findings here. In part I, we demonstrated that lag threads in human rs-fMRI exhibit multiple, highly reproducible patterns of propagated activity (lag threads) in BOLD rs-fMRI data (Figs. 2–4). We also showed that there are most likely eight lag threads in our current analysis and that eight lag threads can emerge from a small set of key ROIs (Figs. 3 and 4).
In part II, we investigated the relation between lag threads and zero-lag temporal correlations in BOLD rs-fMRI. To this end, we examined common patterns of propagation across lag threads by computing voxel-wise correlations across eight lag threads (Fig. 5A). We found that voxel-wise lag–thread correlations and BOLD rs-fMRI zero-lag temporal correlations exhibit a similar structure (Fig. 5). To explain this similarity, we hypothesize the existence of lag thread motifs—that is, sequences of propagation through subsets of regions that are shared across multiple threads (Fig. 6). Simulation experiments showed that zero-lag temporal synchrony within RSNs naturally emerges as a consequence of lag thread motifs (Fig. 7). We also demonstrated that conventionally defined zero-lag RSNs very likely correspond to lag thread motifs (Fig. 8 A and B). Finally, we reproduced, to a fair approximation, the zero-lag temporal correlation structure of BOLD rs-fMRI using synthetic time series with imposed structure derived only from lag threads (Fig. 8 C and D). The reverse relation does not hold—that is, zero-lag temporal correlation structure does not determine a unique lag structure (Fig. 9). Hence, temporal synchrony can be understood as a consequence of BOLD rs-fMRI lag structure.
It is important to note that, although the thread motif model provides a basis for understanding how synchrony arises from patterns in lag, this model is in no way imposed in the reconstruction in Fig. 8C; BOLD time series were reconstructed purely on the basis of lag threads calculated from real data. We conclude that lag threads represent a fundamental organizing property of the brain’s intrinsic activity.
Physiology of Propagated Activity.
A prominent concern regarding lags in human rs-fMRI has been that all observed phenomenology could be attributable to regional variations in the kinetics of neurovascular coupling (28, 29, 38–40). Such regional differences can be represented as an ordered sequence, as illustrated in Fig. 1. Importantly, this set of temporal shifts can account for only a single lag thread (27). Delayed signals in large venous structures most likely contribute to the topography of lag thread 5 (SI Appendix, Fig. S11). However, the existence of at least eight lag threads demonstrates that regional differences in neurovascular coupling account for a minor component of BOLD rs-fMRI lag structure.
Our results raise the question of what physiological mechanisms might underlie propagation of slow spontaneous activity over the whole brain. Propagation of low-frequency (<1 Hz) spontaneous activity has been extensively described in the rodent brain using various modalities, including whole-cell recordings (9), local field potentials (5, 41, 42), voltage-sensitive dyes (11, 12, 43), and calcium imaging (16). We have previously shown that spontaneous BOLD signal fluctuations correspond to low-frequency (<1 Hz) local field potentials, also known as slow cortical potentials (SCPs), which represent slow endogenous changes in excitability (44, 45). Thus, we speculate that propagation of activity in the BOLD signal is likely to represent propagation of slow changes in neuronal excitability.
Propagated changes in neuronal excitability have been previously described in terms of UP/DOWN states (UDSs). UDSs are slow (<1 Hz), spontaneous, subthreshold changes in neuronal membrane potential. These membrane potential fluctuations are effectively synchronous at a submillimeter spatial scale (15, 46, 47) but exhibit multiple, complex patterns of propagation over larger spatial scales (3, 4, 9, 15, 41, 48, 49), spanning thalamus (41), striatum (50), and cortex (41). Although UDSs were initially associated with anesthesia and slow wave sleep, it is now known that UDSs persist and propagate during quiet wakefulness (9, 11, 15). The lags we found (on the order of ∼1 s over the whole brain) in human spontaneous activity are comparable to UDS propagation delays in rodents (9, 11, 12, 15, 41, 43, 51). There also are intriguing correspondences between the directionality of lags in the BOLD signal and lags in UDSs in rodents. Reports by Hahn et al. (9) and Sirota et al. (42) both document that slow fluctuations in somatosensory neocortical areas lead activity in hippocampus by less than 1 s. These findings agree with lags between hippocampus and somatosensory cortex in a seed-based lag map derived from entorhinal cortex (SI Appendix, Fig. S17).
Thus, UDSs might underlie BOLD rs-fMRI signal fluctuations (6, 44, 52). However, some features of these two phenomena are discrepant. In particular, UDSs are generally periodic with frequency content in the range of 0.5–0.8 Hz (9, 15, 46), whereas the resting-state BOLD fMRI signal is aperiodic and dominated by frequencies ≤0.1 Hz (31). Whether or not UDSs are responsible for the present results, we note that there is no consensus regarding the mechanisms underlying slowly propagated activity. Proposed explanations include shifts in excitatory–inhibitory balance (51), thalamo–cortical interactions (41), astrocytic gliotransmission (52, 53), and metabolic neuromodulators such as adenosine (51, 54). Future work is required to definitively elucidate the physiologic mechanisms underlying propagation in the BOLD rs-fMRI signal.
Topography of Lag Threads.
Each lag thread (Fig. 2, Movies S1–S4, and SI Appendix, Figs. S7–S14) exhibits a unique, highly reproducible (Fig. 3B) topography. It is evident that these topographies generally are bilaterally symmetric, as are most functional systems and RSNs. Although fragments of functional systems can be observed in the lag threads (e.g., frontopolar cortex components of the frontoparietal control network in thread 1), the contours of the thread maps do not correspond to the topographies of RSNs. This point relates to our previous demonstration that RSNs as a whole are not iso-latent; rather, each RSN contains a wide range of latency values and includes both early and late nodes (27).
Several topographic features of the lag threads suggest functional properties. Because these points are speculative, we consider only the first two lag threads. In thread 1, the earliest regions are brainstem, thalamus, hippocampus, and putamen; late areas include frontopolar cortex and central insula. This sequence suggests a “bottom–up” process in which activity begins subcortically and propagates to progressively higher order areas of the cerebral cortex (Fig. 2 and Movie S1). Another striking finding is that the putamen is early, whereas the caudate is late. See Movie S1 to visualize activity propagation from posterior putamen to the head of the caudate. As far as we are aware, this finding has not been previously described. In thread 2, thalamus, hippocampus, and brainstem are late with respect to cerebral cortex—that is, opposite to their temporal position in thread 1. This sequence suggests a “top–down” process in which activity propagates from higher to lower centers (Fig. 2 and Movie S2). However, other features—for example, late cerebellum, early putamen, and late caudate—are common to threads 1 and 2. The functional significance of specific lag thread topographies is unknown and requires further study.
The Role of Lag Threads in Integration Versus Segregation.
Activity in the brain, at various spatial scales, has been discussed in terms of two fundamental concepts: synchrony (8, 13, 55) and lagged propagation (3, 4, 41, 56, 57). Taken to their logical extremes, synchrony and lag are opposed in a simple system: A perfectly synchronous system contains no lags, and a system with a single set of lags is not synchronous (58) (SI Appendix, Fig. S3). The fact that the brain’s spontaneous activity exhibits both of these properties may be a manifestation of the dual functions of neuronal segregation and integration (27, 59). Conventional zero-lag resting-state functional connectivity analysis has provided a powerful tool for using synchronicity to map spatially distinct functional areas (19–23, 37). However, functional parcellations do not explain how spatially segregated modules in the brain become integrated (59). Lag threads demonstrate that spontaneous activity exhibits apparent propagation both within and between spatially segregated RSNs. Therefore, lag threads may explain how spatially segregated networks can be integrated over a time scale of seconds.
Conversely, lag threads pose their own problem: If spontaneous activity is characterized by a lag structure, how does synchrony arise? Our results suggest that lag thread motifs provide an answer. Preservation of lag sequencing within certain regions of the brain (i.e., RSNs) across multiple threads gives rise to zero-lag synchrony within these systems (Fig. 8 C and D). Thus, the lag thread motif model unifies the coexistence of synchrony (spatial segregation) and lags (temporal integration) in the brain’s spontaneous activity.
The physiological functions served by lag threads remain unknown, but previous work sheds some light on this matter. We have shown that the lag structure of rs-fMRI is focally modulated, in humans, following the performance of a motor task (27), suggesting that the lag structure of intrinsic activity may be involved in learning and memory. Indeed, the spatiotemporal structure of UDSs (discussed in Physiology of Propagated Activity), a potential correlate of lags in the BOLD rs-fMRI signal, has been linked to consolidation and plasticity mechanisms (9, 15, 41, 60). Additional support for this perspective comes from studies of neurodevelopment showing that precise patterns of propagated intrinsic activity are essential for fine-tuning synaptic connections (61–63). It is believed that persistence of this principle into adulthood supports the brain’s capacity for lifelong plasticity (63–66). A second hypothesis is that the cortex, like the spinal cord, acts as a central pattern generator (67, 68) and that patterns of propagated intrinsic activity represent neuronal programs that are recruited to perform tasks (4, 5, 69). Thus, lag threads may form the basis for activity sequences that naturally play out in responses to events.
Regardless of their specific functions, the reproducibility of lag thread phenomenology suggests that this organizational feature is essential to normal brain physiology and function. We hypothesize that perturbed lag thread structure may underlie some neuropathological conditions. If so, these conditions may not manifest as altered conventional functional connectivity, as changes in lag thread structure (for instance, altered thread hierarchy in Fig. 3A) may not change zero-lag temporal correlations. Hence, an understanding of the physiologic functions of lag threads may lead to better understanding of the brain in health and disease.
Limitations and Future Directions.
The SNR of BOLD rs-fMRI is limited. Accordingly, extensive averaging over very large subject groups was required to obtain stable lag estimates at (6 mm)3 voxel resolution using (15 mm)3 reference ROIs. We are optimistic that future improvements in BOLD fMRI (70), for instance, increased temporal resolution, will allow detection of lag threads in smaller populations, provided that voxel-wise SNR remains adequate and preprocessing strategies effectively remove artifact. Alternative approaches to studying rs-fMRI lags, at coarser resolution, but with less sensitivity to SNR limitations, include deriving lag structure from selected ROIs, as in Fig. 4, and computing lag projections, as in ref. 27.
A second caveat is that the presently reported correspondence between lag thread motifs and RSNs (Fig. 8 A and B) reflects a specific RSN parcellation (SI Appendix, Fig. S5) (35), although the inferences derived from this result most likely depend only minimally on the details on any particular parcellation scheme (21, 22). We note that the correlation-based results (Figs. 5 A and B and 8 C and D) are parcellation independent.
Third, as lag threads are simply principal components of lag structure, they formally constitute only a basis set for lagged activity. Consequently, the sign of the lag threads are, by definition, undetermined by a factor of ±1. Moreover, the assumption of linear superposition in PCA implies that topologically complex or nonlinear temporal sequence topographies cannot be recovered. However, we did find that kernel PCA, a nonlinear technique, recovers lag thread topographies (SI Appendix, Fig. S28) quite similar to those shown in Fig. 2. Additionally, the sign and topographies of seed-based lag maps (SI Appendix, Figs. S15–S24) are uniquely determined. We used these maps to demonstrate that lag thread topographies reasonably separate seed-based lag maps into common clusters and that the sign of each lag thread has most likely been correctly assigned (SI Appendix, Validity of Applying PCA to Recover Lag Thread Topographies).
Fourth, there is an ambiguity concerning voxels with lag values near zero in each lag thread. One possibility is that these voxels are in the middle of the temporal sequence represented by the lag thread. Alternatively, the voxel may not participate in the temporal sequence. At present, we cannot distinguish between these possibilities.
Finally, Fig. 8C shows a temporal correlation matrix computed on the basis of reconstructed BOLD rs-fMRI time series. This result reproduces many features of real data (Fig. 5B), but the correspondence obviously is imperfect (Pearson r = 0.58; Fig. 8D). Importantly, we assumed that the spectral content of BOLD rs-fMRI is uniform over gray matter and that lag threads superpose linearly. These assumptions represent an approximation (71), although the extent to which spectral shapes are regionally dependent at frequencies below 0.1 Hz is uncertain (31). We also restricted our reconstruction to only the first eight lag threads deemed significant by maximum likelihood dimensionality analysis. Although the remaining lag threads contribute less individual variance, they may collectively play an important role in shaping correlation structure. In view of these approximations, a more complete model may be expected to provide a closer match between a reconstructed and true correlation structure of BOLD rs-fMRI time series. As our reconstruction relies only on lag threads, we have also excluded other phenomena that may contribute to the coordination of zero-lag correlation structure.
Supplementary Material
Acknowledgments
We thank John McCarthy, Manu Goyal, and Carl Hacker for helpful discussion and Dr. Randy Buckner for assistance in obtaining the MRI data, which came from the Brain Genomics Superstruct Project, funded by the Simons Foundation Autism Research Initiative. This work was supported by National Institutes of Health Grants NS080675 (to M.E.R. and A.Z.S.), P30NS048056 (to A.Z.S.), and F30MH106253 (to A.M.).
Footnotes
The authors declare no conflict of interest.
See Commentary on page 5263.
This article contains supporting information online at www.pnas.org/lookup/suppl/doi:10.1073/pnas.1503960112/-/DCSupplemental.
References
- 1.Berger H. On the electroencephalogram of man. Second report. Electroencephalogr Clin Neurophysiol. 1969 28:28, 75. [PubMed] [Google Scholar]
- 2.Gusnard DA, Raichle ME, Raichle ME. Searching for a baseline: Functional imaging and the resting human brain. Nat Rev Neurosci. 2001;2(10):685–694. doi: 10.1038/35094500. [DOI] [PubMed] [Google Scholar]
- 3.Cossart R, Aronov D, Yuste R. Attractor dynamics of network UP states in the neocortex. Nature. 2003;423(6937):283–288. doi: 10.1038/nature01614. [DOI] [PubMed] [Google Scholar]
- 4.Ikegaya Y, et al. Synfire chains and cortical songs: Temporal modules of cortical activity. Science. 2004;304(5670):559–564. doi: 10.1126/science.1093173. [DOI] [PubMed] [Google Scholar]
- 5.Luczak A, Barthó P, Marguet SL, Buzsáki G, Harris KD. Sequential structure of neocortical spontaneous activity in vivo. Proc Natl Acad Sci USA. 2007;104(1):347–352. doi: 10.1073/pnas.0605643104. [DOI] [PMC free article] [PubMed] [Google Scholar]
- 6.Ringach DL. Spontaneous and driven cortical activity: Implications for computation. Curr Opin Neurobiol. 2009;19(4):439–444. doi: 10.1016/j.conb.2009.07.005. [DOI] [PMC free article] [PubMed] [Google Scholar]
- 7.Grinvald A, Arieli A, Tsodyks M, Kenet T. Neuronal assemblies: Single cortical neurons are obedient members of a huge orchestra. Biopolymers. 2003;68(3):422–436. doi: 10.1002/bip.10273. [DOI] [PubMed] [Google Scholar]
- 8.Buzsáki G, Draguhn A. Neuronal oscillations in cortical networks. Science. 2004;304(5679):1926–1929. doi: 10.1126/science.1099745. [DOI] [PubMed] [Google Scholar]
- 9.Hahn TT, Sakmann B, Mehta MR. Phase-locking of hippocampal interneurons’ membrane potential to neocortical up-down states. Nat Neurosci. 2006;9(11):1359–1361. doi: 10.1038/nn1788. [DOI] [PubMed] [Google Scholar]
- 10.Logothetis NK, Pauls J, Augath M, Trinath T, Oeltermann A. Neurophysiological investigation of the basis of the fMRI signal. Nature. 2001;412(6843):150–157. doi: 10.1038/35084005. [DOI] [PubMed] [Google Scholar]
- 11.Ferezou I, et al. Spatiotemporal dynamics of cortical sensorimotor integration in behaving mice. Neuron. 2007;56(5):907–923. doi: 10.1016/j.neuron.2007.10.007. [DOI] [PubMed] [Google Scholar]
- 12.Mohajerani MH, et al. Spontaneous cortical activity alternates between motifs defined by regional axonal projections. Nat Neurosci. 2013;16(10):1426–1435. doi: 10.1038/nn.3499. [DOI] [PMC free article] [PubMed] [Google Scholar]
- 13.Kenet T, Bibitchkov D, Tsodyks M, Grinvald A, Arieli A. Spontaneously emerging cortical representations of visual attributes. Nature. 2003;425(6961):954–956. doi: 10.1038/nature02078. [DOI] [PubMed] [Google Scholar]
- 14.Grinvald A, Hildesheim R. VSDI: A new era in functional imaging of cortical dynamics. Nat Rev Neurosci. 2004;5(11):874–885. doi: 10.1038/nrn1536. [DOI] [PubMed] [Google Scholar]
- 15.Petersen CC, Hahn TT, Mehta M, Grinvald A, Sakmann B. Interaction of sensory responses with spontaneous depolarization in layer 2/3 barrel cortex. Proc Natl Acad Sci USA. 2003;100(23):13638–13643. doi: 10.1073/pnas.2235811100. [DOI] [PMC free article] [PubMed] [Google Scholar]
- 16.Stroh A, et al. Making waves: Initiation and propagation of corticothalamic Ca2+ waves in vivo. Neuron. 2013;77(6):1136–1150. doi: 10.1016/j.neuron.2013.01.031. [DOI] [PubMed] [Google Scholar]
- 17.Miller JE, Ayzenshtat I, Carrillo-Reid L, Yuste R. Visual stimuli recruit intrinsically generated cortical ensembles. Proc Natl Acad Sci USA. 2014;111(38):E4053–E4061. doi: 10.1073/pnas.1406077111. [DOI] [PMC free article] [PubMed] [Google Scholar]
- 18.Biswal B, Yetkin FZ, Haughton VM, Hyde JS. Functional connectivity in the motor cortex of resting human brain using echo-planar MRI. Magn Reson Med. 1995;34(4):537–541. doi: 10.1002/mrm.1910340409. [DOI] [PubMed] [Google Scholar]
- 19.Buckner RL, Krienen FM, Castellanos A, Diaz JC, Yeo BT. The organization of the human cerebellum estimated by intrinsic functional connectivity. J Neurophysiol. 2011;106(5):2322–2345. doi: 10.1152/jn.00339.2011. [DOI] [PMC free article] [PubMed] [Google Scholar]
- 20.Choi EY, Yeo BT, Buckner RL. The organization of the human striatum estimated by intrinsic functional connectivity. J Neurophysiol. 2012;108(8):2242–2263. doi: 10.1152/jn.00270.2012. [DOI] [PMC free article] [PubMed] [Google Scholar]
- 21.Power JD, et al. Functional network organization of the human brain. Neuron. 2011;72(4):665–678. doi: 10.1016/j.neuron.2011.09.006. [DOI] [PMC free article] [PubMed] [Google Scholar]
- 22.Yeo BT, et al. The organization of the human cerebral cortex estimated by intrinsic functional connectivity. J Neurophysiol. 2011;106(3):1125–1165. doi: 10.1152/jn.00338.2011. [DOI] [PMC free article] [PubMed] [Google Scholar]
- 23.Fox MD, Raichle ME. Spontaneous fluctuations in brain activity observed with functional magnetic resonance imaging. Nat Rev Neurosci. 2007;8(9):700–711. doi: 10.1038/nrn2201. [DOI] [PubMed] [Google Scholar]
- 24.Seeley WW, et al. Dissociable intrinsic connectivity networks for salience processing and executive control. J Neurosci. 2007;27(9):2349–2356. doi: 10.1523/JNEUROSCI.5587-06.2007. [DOI] [PMC free article] [PubMed] [Google Scholar]
- 25.Biswal BB, et al. Toward discovery science of human brain function. Proc Natl Acad Sci USA. 2010;107(10):4734–4739. doi: 10.1073/pnas.0911855107. [DOI] [PMC free article] [PubMed] [Google Scholar]
- 26.Beckmann CF, DeLuca M, Devlin JT, Smith SM. Investigations into resting-state connectivity using independent component analysis. Philos Trans R Soc Lond B Biol Sci. 2005;360(1457):1001–1013. doi: 10.1098/rstb.2005.1634. [DOI] [PMC free article] [PubMed] [Google Scholar]
- 27.Mitra A, Snyder AZ, Hacker CD, Raichle ME. Lag structure in resting-state fMRI. J Neurophysiol. 2014;111(11):2374–2391. doi: 10.1152/jn.00804.2013. [DOI] [PMC free article] [PubMed] [Google Scholar]
- 28.Friston KJ, Dolan RJ. Computational and dynamic models in neuroimaging. Neuroimage. 2010;52(3):752–765. doi: 10.1016/j.neuroimage.2009.12.068. [DOI] [PMC free article] [PubMed] [Google Scholar]
- 29.Handwerker DA, Ollinger JM, D’Esposito M. Variation of BOLD hemodynamic responses across subjects and brain regions and their effects on statistical analyses. Neuroimage. 2004;21(4):1639–1651. doi: 10.1016/j.neuroimage.2003.11.029. [DOI] [PubMed] [Google Scholar]
- 30.Maxim V, et al. Fractional Gaussian noise, functional MRI and Alzheimer’s disease. Neuroimage. 2005;25(1):141–158. doi: 10.1016/j.neuroimage.2004.10.044. [DOI] [PubMed] [Google Scholar]
- 31.He BJ, Zempel JM, Snyder AZ, Raichle ME. The temporal structures and functional significance of scale-free brain activity. Neuron. 2010;66(3):353–369. doi: 10.1016/j.neuron.2010.04.020. [DOI] [PMC free article] [PubMed] [Google Scholar]
- 32.Buckner R, et al. The Brain Genomics Superstruct Project. Harvard Dataverse Network; Cambridge, MA: 2012. [Google Scholar]
- 33.Minka TP. Automatic Choice of Dimensionality for PCA, Advances in Neural Information Processing Systems. Vol 13. MIT Press; Cambridge, MA: 2001. pp. 598–604. [Google Scholar]
- 34.van den Heuvel MP, Kahn RS, Goñi J, Sporns O. High-cost, high-capacity backbone for global brain communication. Proc Natl Acad Sci USA. 2012;109(28):11372–11377. doi: 10.1073/pnas.1203593109. [DOI] [PMC free article] [PubMed] [Google Scholar]
- 35.Hacker CD, et al. Resting state network estimation in individual subjects. Neuroimage. 2013;82:616–633. doi: 10.1016/j.neuroimage.2013.05.108. [DOI] [PMC free article] [PubMed] [Google Scholar]
- 36.Esposito F, et al. Rhythm-specific modulation of the sensorimotor network in drug-naive patients with Parkinson’s disease by levodopa. Brain. 2013;136(Pt 3):710–725. doi: 10.1093/brain/awt007. [DOI] [PubMed] [Google Scholar]
- 37.Gordon EM, et al. Generation and evaluation of a cortical area parcellation from resting-state correlations. Cereb Cortex. 2014 doi: 10.1093/cercor/bhu239. in press. [DOI] [PMC free article] [PubMed] [Google Scholar]
- 38.Friston K. Causal modelling and brain connectivity in functional magnetic resonance imaging. PLoS Biol. 2009;7(2):e33. doi: 10.1371/journal.pbio.1000033. [DOI] [PMC free article] [PubMed] [Google Scholar]
- 39.Friston K. Dynamic causal modeling and Granger causality Comments on: The identification of interacting networks in the brain using fMRI: Model selection, causality and deconvolution. Neuroimage. 2011;58(2):303–305. doi: 10.1016/j.neuroimage.2009.09.031. [DOI] [PMC free article] [PubMed] [Google Scholar]
- 40.Friston K, Moran R, Seth AK. Analysing connectivity with Granger causality and dynamic causal modelling. Curr Opin Neurobiol. 2013;23(2):172–178. doi: 10.1016/j.conb.2012.11.010. [DOI] [PMC free article] [PubMed] [Google Scholar]
- 41.Sheroziya M, Timofeev I. Global intracellular slow-wave dynamics of the thalamocortical system. J Neurosci. 2014;34(26):8875–8893. doi: 10.1523/JNEUROSCI.4460-13.2014. [DOI] [PMC free article] [PubMed] [Google Scholar]
- 42.Sirota A, Csicsvari J, Buhl D, Buzsáki G. Communication between neocortex and hippocampus during sleep in rodents. Proc Natl Acad Sci USA. 2003;100(4):2065–2069. doi: 10.1073/pnas.0437938100. [DOI] [PMC free article] [PubMed] [Google Scholar]
- 43.Mohajerani MH, McVea DA, Fingas M, Murphy TH. Mirrored bilateral slow-wave cortical activity within local circuits revealed by fast bihemispheric voltage-sensitive dye imaging in anesthetized and awake mice. J Neurosci. 2010;30(10):3745–3751. doi: 10.1523/JNEUROSCI.6437-09.2010. [DOI] [PMC free article] [PubMed] [Google Scholar]
- 44.He BJ, Snyder AZ, Zempel JM, Smyth MD, Raichle ME. Electrophysiological correlates of the brain’s intrinsic large-scale functional architecture. Proc Natl Acad Sci USA. 2008;105(41):16039–16044. doi: 10.1073/pnas.0807010105. [DOI] [PMC free article] [PubMed] [Google Scholar]
- 45.Pan WJ, Thompson GJ, Magnuson ME, Jaeger D, Keilholz S. Infraslow LFP correlates to resting-state fMRI BOLD signals. Neuroimage. 2013;74:288–297. doi: 10.1016/j.neuroimage.2013.02.035. [DOI] [PMC free article] [PubMed] [Google Scholar]
- 46.Steriade M, Contreras D, Curró Dossi R, Nuñez A. The slow (<1 Hz) oscillation in reticular thalamic and thalamocortical neurons: Scenario of sleep rhythm generation in interacting thalamic and neocortical networks. J Neurosci. 1993;13(8):3284–3299. doi: 10.1523/JNEUROSCI.13-08-03284.1993. [DOI] [PMC free article] [PubMed] [Google Scholar]
- 47.Steriade M, Nuñez A, Amzica F. A novel slow (<1 Hz) oscillation of neocortical neurons in vivo: Depolarizing and hyperpolarizing components. J Neurosci. 1993;13(8):3252–3265. doi: 10.1523/JNEUROSCI.13-08-03252.1993. [DOI] [PMC free article] [PubMed] [Google Scholar]
- 48.Fucke T, et al. Stereotypical spatiotemporal activity patterns during slow-wave activity in the neocortex. J Neurophysiol. 2011;106(6):3035–3044. doi: 10.1152/jn.00811.2010. [DOI] [PubMed] [Google Scholar]
- 49.Nir Y, et al. Regional slow waves and spindles in human sleep. Neuron. 2011;70(1):153–169. doi: 10.1016/j.neuron.2011.02.043. [DOI] [PMC free article] [PubMed] [Google Scholar]
- 50.Plenz D, Kitai ST. Up and down states in striatal medium spiny neurons simultaneously recorded with spontaneous activity in fast-spiking interneurons studied in cortex-striatum-substantia nigra organotypic cultures. J Neurosci. 1998;18(1):266–283. doi: 10.1523/JNEUROSCI.18-01-00266.1998. [DOI] [PMC free article] [PubMed] [Google Scholar]
- 51.Amzica F, Steriade M. Short- and long-range neuronal synchronization of the slow (<1 Hz) cortical oscillation. J Neurophysiol. 1995;73(1):20–38. doi: 10.1152/jn.1995.73.1.20. [DOI] [PubMed] [Google Scholar]
- 52.Poskanzer KE, Yuste R. Astrocytic regulation of cortical UP states. Proc Natl Acad Sci USA. 2011;108(45):18453–18458. doi: 10.1073/pnas.1112378108. [DOI] [PMC free article] [PubMed] [Google Scholar]
- 53.Araque A, et al. Gliotransmitters travel in time and space. Neuron. 2014;81(4):728–739. doi: 10.1016/j.neuron.2014.02.007. [DOI] [PMC free article] [PubMed] [Google Scholar]
- 54.Fellin T, et al. Endogenous nonneuronal modulators of synaptic transmission control cortical slow oscillations in vivo. Proc Natl Acad Sci USA. 2009;106(35):15037–15042. doi: 10.1073/pnas.0906419106. [DOI] [PMC free article] [PubMed] [Google Scholar]
- 55.Lachaux JP, Rodriguez E, Martinerie J, Varela FJ. Measuring phase synchrony in brain signals. Hum Brain Mapp. 1999;8(4):194–208. doi: 10.1002/(SICI)1097-0193(1999)8:4<194::AID-HBM4>3.0.CO;2-C. [DOI] [PMC free article] [PubMed] [Google Scholar]
- 56.Nikolić D. Non-parametric detection of temporal order across pairwise measurements of time delays. J Comput Neurosci. 2007;22(1):5–19. doi: 10.1007/s10827-006-9441-7. [DOI] [PubMed] [Google Scholar]
- 57.Massimini M, Huber R, Ferrarelli F, Hill S, Tononi G. The sleep slow oscillation as a traveling wave. J Neurosci. 2004;24(31):6862–6870. doi: 10.1523/JNEUROSCI.1318-04.2004. [DOI] [PMC free article] [PubMed] [Google Scholar]
- 58.Tognoli E, Kelso JA. Enlarging the scope: Grasping brain complexity. Front Syst Neurosci. 2014;8:122. doi: 10.3389/fnsys.2014.00122. [DOI] [PMC free article] [PubMed] [Google Scholar]
- 59.Raichle ME. The restless brain. Brain Connect. 2011;1(1):3–12. doi: 10.1089/brain.2011.0019. [DOI] [PMC free article] [PubMed] [Google Scholar]
- 60.Steriade M, Timofeev I. Neuronal plasticity in thalamocortical networks during sleep and waking oscillations. Neuron. 2003;37(4):563–576. doi: 10.1016/s0896-6273(03)00065-5. [DOI] [PubMed] [Google Scholar]
- 61.Adelsberger H, Garaschuk O, Konnerth A. Cortical calcium waves in resting newborn mice. Nat Neurosci. 2005;8(8):988–990. doi: 10.1038/nn1502. [DOI] [PubMed] [Google Scholar]
- 62.Goodman CS, Shatz CJ. Developmental mechanisms that generate precise patterns of neuronal connectivity. Cell. 1993;72(Suppl):77–98. doi: 10.1016/s0092-8674(05)80030-3. [DOI] [PubMed] [Google Scholar]
- 63.Katz LC, Shatz CJ. Synaptic activity and the construction of cortical circuits. Science. 1996;274(5290):1133–1138. doi: 10.1126/science.274.5290.1133. [DOI] [PubMed] [Google Scholar]
- 64.Penn AA, Shatz CJ. Brain waves and brain wiring: The role of endogenous and sensory-driven neural activity in development. Pediatr Res. 1999;45(4 Pt 1):447–458. doi: 10.1203/00006450-199904010-00001. [DOI] [PubMed] [Google Scholar]
- 65.Hensch TK. Critical period plasticity in local cortical circuits. Nat Rev Neurosci. 2005;6(11):877–888. doi: 10.1038/nrn1787. [DOI] [PubMed] [Google Scholar]
- 66.Spitzer NC. Electrical activity in early neuronal development. Nature. 2006;444(7120):707–712. doi: 10.1038/nature05300. [DOI] [PubMed] [Google Scholar]
- 67.Yuste R. Introduction: Spontaneous activity in the developing central nervous system. Semin Cell Dev Biol. 1997;8(1):1–4. doi: 10.1006/scdb.1996.0114. [DOI] [PubMed] [Google Scholar]
- 68.Yuste R, MacLean JN, Smith J, Lansner A. The cortex as a central pattern generator. Nat Rev Neurosci. 2005;6(6):477–483. doi: 10.1038/nrn1686. [DOI] [PubMed] [Google Scholar]
- 69.Hall TM, de Carvalho F, Jackson A. A common structure underlies low-frequency cortical dynamics in movement, sleep, and sedation. Neuron. 2014;83(5):1185–1199. doi: 10.1016/j.neuron.2014.07.022. [DOI] [PMC free article] [PubMed] [Google Scholar]
- 70.Feinberg DA, Yacoub E. The rapid development of high speed, resolution and precision in fMRI. Neuroimage. 2012;62(2):720–725. doi: 10.1016/j.neuroimage.2012.01.049. [DOI] [PMC free article] [PubMed] [Google Scholar]
- 71.Salvador R, et al. A simple view of the brain through a frequency-specific functional connectivity measure. Neuroimage. 2008;39(1):279–289. doi: 10.1016/j.neuroimage.2007.08.018. [DOI] [PubMed] [Google Scholar]
- 72.Brier MR, et al. Loss of intranetwork and internetwork resting state functional connections with Alzheimer’s disease progression. J Neurosci. 2012;32(26):8890–8899. doi: 10.1523/JNEUROSCI.5698-11.2012. [DOI] [PMC free article] [PubMed] [Google Scholar]
Associated Data
This section collects any data citations, data availability statements, or supplementary materials included in this article.