Abstract
BACKGROUND
Chronic alcohol exposure produces neuroadaptation, which increases the risk of cellular excitotoxicity and autonomic dysfunction during withdrawal. The temporal progression and regulation of the gene expression that contributes to this physiologic and behavioral phenotype is poorly understood early in the withdrawal period. Further, it is unexplored in the dorsal vagal complex (DVC), a brainstem autonomic regulatory structure .
METHODS
We use a qPCR platform to precisely and simultaneously measure the expression of 145 neuromodulatory genes in more than 100 rat DVC samples from control, chronically alcohol exposed, and withdrawn rats. To gain insight into the dynamic progression and regulation of withdrawal, we focus on the expression of a subset of functionally relevant genes during the first 48 hours, when behavioral symptoms are most severe.
RESULTS
In the DVC, expression of this gene subset is essentially normal in chronically alcohol exposed rats. However, withdrawal results in rapid, large magnitude expression changes in this group. We observed differential regulation in 86 of the 145 genes measured (59%), some as early as 4 hours into withdrawal. Time series measurements (4, 8, 18, 32 and 48 hours after alcohol removal) revealed dynamic expression responses in immediate early genes, γ-aminobutyric acid type A, ionotropic glutamate, and G-protein coupled receptors and the Ras/Raf signaling pathway. Together, these changes elucidate a complex, temporally coordinated response that involves correlated expression of many functionally related groups. In particular, the expression patterns of Gabra1, Grin2a, Grin3a and Grik3 were tightly correlated. These receptor subunits share over-represented transcription factor binding sites for Pax-8 and other transcription factors, suggesting a common regulatory mechanism and a role for these transcription factors in the regulation of neurotransmission within the first 48h of alcohol withdrawal.
CONCLUSIONS
Expression in this gene set is essentially normal in the alcohol-adapted DVC, but withdrawal results in immediate, large magnitude, dynamic changes. These data support both increased research focus on the biological ramifications of alcohol withdrawal and enable novel insights into the dynamic withdrawal expression response in this understudied homeostatic control center.
Keywords: alcohol withdrawal, gene expression, time series, vagus, gene regulatory network
Introduction
Alcohol is a CNS depressant that alters central nervous system function broadly. If consumed chronically, a neuroadapted state of dependence can emerge altering homeostasis. In dependence, individuals develop compulsive drinking behavior where, rather than providing positive reinforcement, continued alcohol intake limits the individual’s experience of negative emotional and physiologic states associated with abstinence (Koob 2011). Such negative reinforcement is thought to result from long term changes in neurotransmitter signaling systems, which at least in part, involve changes in gene expression (Zhou et al. 2011). The gene expression changes that occur following the sudden removal of alcohol from the cellular environment are equally dramatic (Hashimoto et al. 2011) and precipitate a potentially life threatening withdrawal syndrome characterized by agitation, delirium, seizures, and autonomic instability (Eyer et al. 2011). In order to better understand alcohol dependence and withdrawal, here we study temporal gene expression changes in a subset of functionally relevant transcripts within the dorsal vagal homeostatic center during the first 48h following alcohol removal.
Although it is clear that alcohol’s effects are brain region specific, little is known of withdrawal’s effects on the emotional-visceral axis, a homeostatic circuit relaying afferent information from visceral organs via the vagus to the brainstem, limbic system, and prefrontal cortex (Schwaber et al. 1982). We have previously demonstrated in rats that chronic alcohol exposure causes gene expression changes in the dorsal vagal complex (DVC), an integrative region in this axis (Covarrubias and Khan et al. 2005). Others have demonstrated the regional induction of immediate early gene (IEG) activity following acute exposure (Vilpoux et al. 2009). Here, we expand upon these findings by focusing on the temporal expression changes that occur when withdrawal-induced physiologic and behavioral symptoms are most severe. This time frame corresponds to our own observations of rats’ abnormal activity and feeding patterns, as well to those reported by others (Morris et al. 2010). We hypothesize that this approach will offer insight into how alcohol withdrawal-induced autonomic instability correlates with changes in gene expression.
Previous focused and global expression studies of the effects of chronic alcohol exposure and withdrawal have implicated several interacting neurotransmitter systems. Initially, alcohol inhibits glutamate excitation (Roberto et al. 2006a), enhances γ-aminobutyric acid (GABA) triggered chloride flux (Breese et al. 2006) and alters opioid (Mendez, Morales-Mulia 2008), dopaminegic and serotonergic signaling (Silberman et al. 2009). These signaling changes influence gene expression necessary for adaptation during prolonged use. This altered gene expression is detrimental during withdrawal. At the molecular level, abrupt alcohol cessation triggers pathological levels of excitation, with high levels of calcium flux and MAPK signaling (Silberman et al. 2009, Obara et al. 2009, Prendergast et al. 2004). Despite these profound changes in signaling early in withdrawal, there is a relative absence of information on the early coordination of gene expression.
Several targeted studies have highlighted the importance of glutamatergic (Roberto et al. 2006, Nagy 2008), GABAergic (Breese et al. 2006) and dopaminergic neurotransmitter systems (Silberman et al. 2009) in alcohol dependence and withdrawal. However, due to their focused nature, they cannot inform our understanding of system interaction. In contrast, RNA-seq (Zhou et al. 2011) and microarray (Tabakoff et al. 2009) experiments provide global expression data, but are typically limited to small sample numbers. Taken together, these previous studies have shown that withdrawal is a multigenic and time dependent process, characterized by progressive evolving behavior and physiology that suggests an accommodating molecular state. Further, the observed gene expression response is affected by multiple genetic, epigenetic, and individual history factors, as well as the type of alcohol exposure and the timing of observation within withdrawal. As such, capturing the dynamic contribution of the gene expression program with frequent observations is necessary, particularly during periods when large magnitude changes in many transcripts are expected as in alcohol withdrawal.
Here, we use a qPCR platform that enables the quantification of an increased number of sample conditions and mRNA levels. We present the expression patterns of a focused gene set in alcohol-withdrawn DVC samples beginning 4h after the removal of alcohol and continuing through 48h. With this approach, we characterize the initial changes in gene expression and the subsequent downstream expression wave in functionally relevant gene transcripts. While focused rather than global, this study offers a quantitative measure of temporally-coordinated changes in expression and a clustering and analysis of regulatory network structure for a select subset of biologically relevant neurotransmitter receptors and signaling systems.
Materials and Methods
Animals
Male, Sprague Dawley rats (>120g, Harlan, Indianapolis, IN) were housed individually in the Thomas Jefferson Alcohol Research Center Animal Core Facility. As shown in Fig. 1, animals were assigned to three treatment groups: control (n=39), chronic alcohol exposure (n=26), or withdrawal following chronic exposure (n=37). Withdrawal animals were assigned to one of five time points: 4, 8, 18, 32, or 48 hours (n=8, 10, 7, 6, and 6, respectively). Chronic and withdrawal animals were fed the Lieber-DeCarli liquid alcohol diet (36% of calories as alcohol) ad libitum for at least 35 days (Lieber, DeCarli 1994, de la M Hall et al. 2001). Control rats were fed a liquid diet where alcohol was isocalorically replaced with carbohydrate and diet volume equaled the average consumption of alcohol-fed littermates. No differences in weight gain were noted between groups. Facilities were maintained at constant temperature and humidity with 12/12h light cycles (lights on at Zeitgeber time (ZT) 0). All protocols were approved by the TJU Institutional Animal Care and Use Committee.
Fig. 1.
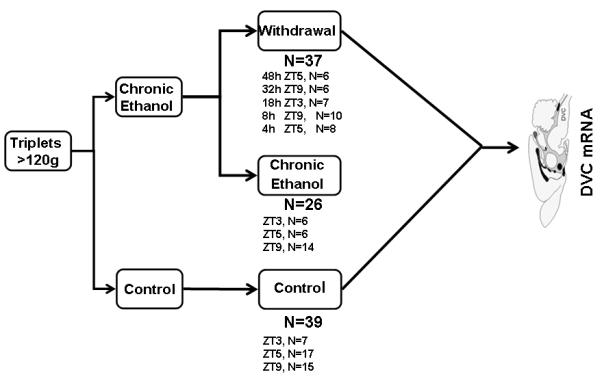
Experimental design. (A) A schematic of the experimental design. Animals were assigned to one of three treatment groups: control, chronic alcohol exposure, or withdrawal (with specific withdrawal time points covering the symptomatic period). The five time points selected for study are indicated, ranging from 4 to 48 hours after withdrawal. These were selected to capture early transcription changes as well as later changes associated with adaptation to withdrawal and the typical behavioral response after alcohol removal in the Lieber-DeCarli rat model. Control and chronic exposure animals were sacrificed at the same time as the withdrawal animal to account for differences in diurnal expression (ZT (Zeitgeber time) matched as indicated).
In the Lieber-DeCarli protocol blood alcohol levels are not externally controlled during the experiment. Rather each animal is allowed to self-regulate its oral alcohol intake. Studies using the Lieber-DeCarli method in this facility and elsewhere have shown peak blood alcohol concentrations of 20-30mM with an average daily alcohol intake of 12-16 g/kg in rats following long term exposure (>3 weeks) (Lieber, DeCarli 1994, Wilson et al. 1986, Macey et al. 1996). In our study the average daily alcohol intake was 15.20 g/kg. There were no differences in average intake between the chronic alcohol exposed and withdrawn animals (p > 0.1; Supplemental Fig. 1). Our alcohol-fed rats feed periodically throughout the day and night at regular intervals that are unlikely to induce withdrawal.
To initiate withdrawal, the alcohol diet was replaced with either water or control diet. Matched chronically-exposed rats were given free access to alcohol diet until sacrifice. Previous studies and our experience show that symptomatic alcohol withdrawal in rats following a long term liquid alcohol diet begins within hours and resolves over a 2 to 3d period (Walker et al. 1975, Geisler et al. 1978, Macey et al. 1996). Studies of alcohol clearance following the cessation of the liquid alcohol diet have shown that clearance rate is approximately linear, and is reduced to less than 25% of original levels at 7h (Wilson et al. 1986). Similarly, exposures longer than 10d on a liquid ethanol diet have been shown to generate physiologic evidence of dependence in withdrawal including behavioral manifestation of autonomic and somatic dysfunction with an increased susceptibility to audiogenic convulsions and other behavioral signs (Hunter et al. 1975) that are apparent by 4h and resolve over the first 48 to 72h (Macey et al. 1996, Geisler et al. 1978). In order to examine the changes in gene expression that occur during this period, we sampled the response following chronic exposure and at 4, 8, 18, 32, and 48h after alcohol removal.
Gene Set Selection and System of Interest Identification
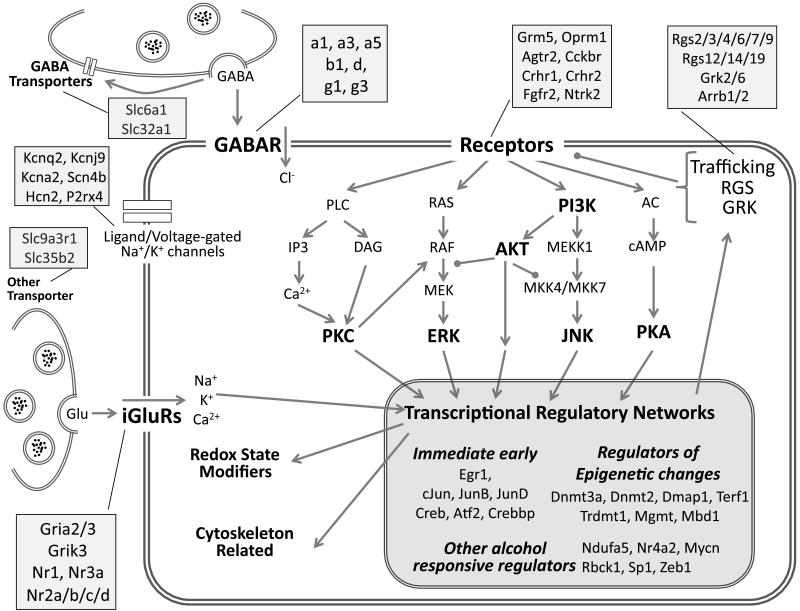
Gene selection was critical to experimental design. By quantitatively measuring the expression of many functionally-relevant genes in parallel, we defined a specific system of interest and gained perspective that cannot be captured by measuring changes in isolation. Predominantly, we chose genes for proteins known to be affected by alcohol consumption, alcohol withdrawal, or anxiety. This included individual GABAA (Breese et al. 2006), N-Methyl-D-aspartic acid (NMDA) (Roberto et al. 2006, Nagy 2008), and G-protein coupled receptor (GPCR) subunits and downstream signaling components (Sanna et al. 2002, Liu et al. 2006, Lomazzi et al. 2008), as shown in a simplified schematic in Fig. 2. The selected set also included other targets identified by previous gene expression studies (Hashimoto et al. 2011, Covarrubias and Khan et al. 2005, Sommer et al. 2006, Tabakoff et al. 2009, Arlinde et al. 2004). Additionally, to focus on the cardiovascular regulatory role of the DVC, we included the genes encoding members of the angiotensin II type I receptor signaling (AT1R) pathway. Hypertension is a common physiological consequence of alcohol withdrawal and the signaling cascade is similar to that of many other GPCRs which have also been shown to be affected by chronic alcohol and withdrawal (Sanna et al. 2002, Lomazzi et al. 2008, Khan et al. 2008). In sum, the tested set includes genes implicated in previous global gene expression studies, focused experiments on the molecular effects of alcohol, as well as other functionally related genes. The result is a biased, but highly relevant gene set that can be examined in detail during alcohol withdrawal.
Fig. 2.
Neurobiological systems of interest assayed by qPCR. The schematic shows the biological systems targeted for study including excitatory and inhibitory neurotransmission, receptor-driven intracellular signaling and transcriptional regulation. Major functional groups and signaling pathways are highlighted in bold. Compartments represented include the presynaptic terminal and membrane, and the postsynaptic membrane, cytoplasm and nucleus. Receptor subunits, isoforms, and family members assigned to the functional categories are listed in the attached shaded boxes. This schematic’s relative positioning is maintained in the data mapping shown in Figure 4.
DVC Microdissection
At the assigned time of sacrifice, withdrawn, chronically alcohol-exposed, and match-fed control animals were sacrificed via rapid decapitation and brainstems were excised, placed into ice-cold artificial cerebral spinal fluid (ACSF: 10mM HEPES, pH 7.4; 140mM NaCl; 5mM KCl; 1mM MgCl2; 1mM CaCl2; 24mM D-glucose) and secured with agarose for sectioning (4% UltraPure™ low melting point agarose [Invitrogen] in ACSF). 275μm transverse sections were made with a McIlwain Tissue Chopper (Gamshall, England) for DVC microdissection with size-matched micropunches (≤1.25mm; Stoelting, Wood Dale, IL), as previously reported (Khan et al. 2008). Bilateral punches from one animal were treated as a single sample. Samples for each withdrawal time point were collected at a single time of day (4h at ZT5 (n=8); 8h at ZT9 (n=10); 18h at ZT3 (n=7); 32h at ZT9 (n=6); 48h at ZT5 (n=6)). Control and chronic samples were sacrificed on the same day at the same time as matched fed withdrawal animals yielding a mixture of sacrifice time samples that were be used to normalize diurnal differences in gene expression (Control: n=7 at ZT3; n=17 at ZT5; and n=15 at ZT9. Chronic: n=6 at ZT3; n=6 at ZT5; and n=14 at ZT9).
qRT-PCR
Total RNA was extracted with either the RNeasy or the AllPrep DNA/RNA extraction kit (Qiagen, Valencia, CA), DNAase treated (DNA-Free RNA kit, Zymo Research, Orange, CA), and stored at −80°C. Concentration and integrity were assessed with an ND-1000 (NanoDrop, Wilmington, DE) and RNA nano-6000 chips on an Agilent 2100 Bioanalyzer. cDNA was reverse transcribed with SuperScript II (Invitrogen, Carlsbad, CA) from 100ng total RNA and stored at −20°C.
Intron-spanning PCR primers and probes were designed using Roche’s Universal Probe Library Assay Design Center (www.universalprobelibrary.com). The 145 that passed our quality control are listed in Supplemental Table S1. The standard BioMark™ protocol was used to pre-amplify cDNA samples for 14 cycles using TaqMan® PreAmp Master Mix per the manufacturer’s protocol (Applied Biosystems, Foster City, CA). qPCR reactions were performed using 96.96 BioMark™ Dynamic Arrays (Fluidigm, South San Francisco, CA) enabling quantitative measurement of up to 96 different mRNAs in 96 samples under identical reaction conditions (Spurgeon et al. 2008). Runs were 40 cycles (15s at 95°C, 5s at 70°C, 60s at 60°C). Raw CT values (Supplemental Table S2) were calculated by the Real-Time PCR Analysis Software (Fluidigm) and software-designated failed reactions were discarded from analysis.
Data Normalization and Analysis
All samples were quantile-normalized (ΔCT) using the R statistical computing package (Bolstad et al. 2003, Pradervand et al. 2009, http://www.r-project.org). To account for diurnal expression changes, ΔΔCT values were calculated by subtracting the ΔCT values from the average ΔCT value of all control animals sacrificed at the corresponding time of day. Prior to normalization for differences in sacrifice time, 46 genes in the control condition showed diurnal expression differences. Following normalization for sacrifice time, none of the genes showed expression differences within control samples based on diurnal time of sacrifice (ANOVA, p>0.05). These ΔΔCT values were used for all further analysis
Genes with a significant treatment effect were identified via an ANOVA with seven possible levels: control, chronic, and the five durations of withdrawal. Pairwise differences between time points were determined with post-hoc Tukey’s HSD tests. Multiple testing corrections based on estimated false discovery rate was performed using the q-value approach (Storey, Tibshirani 2003) as implemented in the qvalue library in R. Using this approach with conventional FDR thresholds of 10-20%, 80-90% of the genes show a statistically significant treatment effect (Supplemental Table 3). This statistical outcome arises from a very low Π0 value (Π0 = 0.09), which results from our experimental design where a relatively high proportion (>50%) of genes are expected to change; this differs fundamentally from genome scale microarray analyses where ~5% of 10,000s are expected to change. Furthermore, with a limited gene set (145), the number of potential false positives is inherently reduced (5% * 145 = 8, vs. 5% * 10,000s). Consequently, an ANOVA p-value cutoff of 0.05 is a more stringent inclusion criterion than ANOVA with FDR correction. Therefore the former was used for all subsequent analysis. All statistical tests were conducted at a 95% confidence level (p≤0.05).
Time series clustering of differentially expressed genes was performed using Short Time Series Expression Miner (STEM) (Ernst, Bar-Joseph 2006). In order to capture dynamic pattern similarities, all genes with a statistically significant treatment effect (ANOVA) were used as the input data. The user-defined parameters were set to the default settings (number of candidate profiles = 50, and minimal correlation threshold = 0.7). Functional enrichment analysis for each cluster was performed using the DAVID Bioinformatics Resource v6.7 against the 145 tested genes as background (Huang da et al. 2007). DAVID is a freely available, web-based functional annotation tool that systematically identifies gene-list associated functional terms from the most widely accessed public databases, such as the Gene Ontology (GO) and KEGG Pathways in over forty categories including GO terms, protein–protein interactions, protein functional domains, disease associations, bio-pathways, sequence general features, homologies, gene functional summaries, gene tissue expressions and literatures. The tool identifies those terms which are statistically enriched in the subset of interest compared to a user-defined background set. Statistical significance of enrichment was determined using Fisher’s Exact Test (p≤0.05).
Finally, the background 145 gene set and individual gene clusters were analyzed for enrichment of shared transcription factor binding sites within 1000bp upstream of the transcription start sites using the Promoter Analysis and Interaction Network Toolset (PAINT) (Vadigepalli et al. 2003). The PAINT analysis was performed using Entrez Gene IDs to retrieve promoter sequences with the TRANSFAC Professional 2009.4 algorithm (http://www.gene-regulation.com/pub/databases.html) and PAINT’s default settings for transcription regulatory elements (TRE) identification. This approach, called transcriptional regulatory network analysis, identifies binding sites for transcription factors that are statistically more common in the promoters of genes sets of interest than would be expected relative to their appearance in a set of promoters randomly sampled from the rat genome (Fisher’s Exact Test, p<0.05). As only frequencies are compared, no issues associated with differences in TRE definitions (length, complexity or degeneracy) influence the results. Significant enrichment is interpreted as evidence for true co-regulation, as well as suggesting a role for the corresponding transcription factor in the observed dynamics. Both the background set and each cluster were analyzed for evidence of over-represented transcription factor binding sites. Analyzing the combination of sequence and time series data in this manner is not unlike previous efforts (Kundaje et al. 2005) to identify gene regulatory network structure. Networks were exported to Cytoscape for visualization (Cline et al. 2007).
Results
System Differential Expression in the DVC
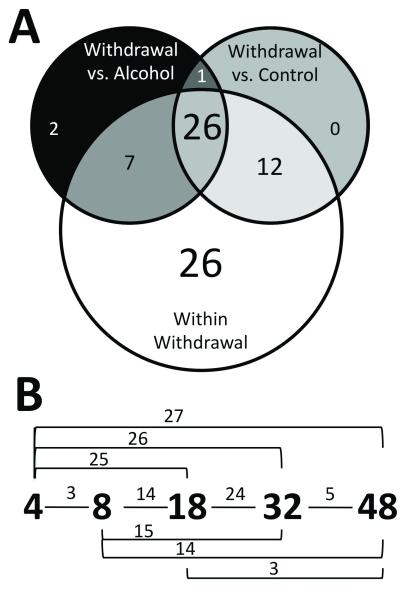
ANOVA revealed that 86 of the 145 genes (59%) had significant changes in expression in the DVC due to alcohol exposure or withdrawal. However, nearly all these effects were attributable to withdrawal rather than chronic exposure. Of the 86 genes, post-hoc analysis identified 75 genes with statistically significant difference in expression between individual time points in at least one pair-wise comparison (Tukey’s HSD comparisons, p≤0.05). Only four genes showed statistically significant differences in control and chronic alcohol expression levels (Gabra1, Gad1, Grin2c, and Rgs6), and all of these changes were less than 30% (0.74-fold, 0.76-fold, 1.28-fold, and 1.26-fold, respectively; see also Fig. 4B, chronic ethanol panel). In contrast, 74 of the 75 genes showed significant time-point expression differences involving at least one withdrawal time point. As shown in Figure 3, a subset of 27 genes had expression levels statistically different at one withdrawal time in comparison to both dependent and control samples, indicating a unique withdrawal expression state. In general, withdrawal changes were larger in magnitude, ranging from 1.3-fold to 3.7-fold; the mean statistically significant withdrawal-induced expression change was 1.77-fold (median: 1.67-fold).
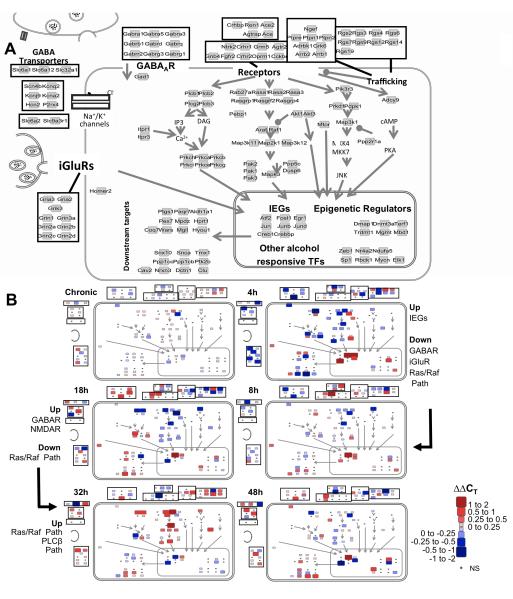
Fig. 4.
Cellular and signaling pathway view of gene expression changes during alcohol withdrawal. (A) Network layout of processes and molecules of interest. The 145 genes measured are represented as light gray squares and are grouped according to functional class. Relative positioning is maintained as in Fig. 2. (B) ΔΔCT values were superimposed on the map presented in (A) with the color and size scale presented for all 86 genes found to have a statistically significant treatment effect by ANOVA regardless of whether the post-hoc testing revealed significant changes at that time point. Small black points are included for positioning and represent the genes that do not undergo significant changes (NS). All ΔΔCT values were calculated relative to the mean expression in sacrifice-time matched control animals. Values of 1 and -1 represent a doubling and a halving of mRNA levels, respectively. The heavy black arrow indicates the progression of alcohol withdrawal from the chronic state through 48 hours of withdrawal at each of the 5 measured time points. Size changes are proportional to the absolute value of the changes. Positive values (red) indicate an increase in expression as compared to control animals whereas negative values (blue) indicate a decrease.
Fig. 3.
Statistical testing results. Of the 86 genes with a significant ANOVA alcohol treatment effect, post-hoc analysis (Tukey’s MSD comparisons, p≤0.05) revealed that 74 genes showed statistically significant expression changes in one withdrawal time point as compared to at least one other treatment group (control, chronic ethanol, 4, 8 18 32 or 48h withdrawal). The Venn diagram in (A) shows the subsets of significant changes by Tukey’s MSD comparison. The majority of these changes occurred during withdrawal (white circle) and did not always coincide with deviations from the control (black circle) or alcohol-exposed (grey circle) states. The numbers within each segment indicate the number of genes with statistically significant changes in gene expression under the indicated pairwise comparison. Genes with a change in any withdrawal time point comparison difference are included in the white group. (B) Significant gene expression differences between two time points during withdrawal by pairwise comparisons of the 71 genes with significant gene expression changes (white circle in panel (A)). The small numbers above the lines connecting time points represent the number of genes with significant differences in that comparison. These comparisons are not mutually exclusive; a single gene may be counted in multiple comparisons.
Early System Alcohol Withdrawal Expression Changes
DVC samples showed widespread large-magnitude gene expression changes in the selected subset of genes after removal of the alcohol diet. “Early” 4h and 8h measures are mapped onto conventional pathway maps in Fig. 4B. At 4h, in addition to the upregulation of IEGs Creb, Fosl1, Egr1 and Jun, we also observed downregulation in genes encoding ionotropic glutamate receptors Gria2, Grik3, Grin1, Grin2a, Grin2d and Grin3a; the sodium and potassium channels Scn4b, Kcnj9, and Kcna2; and the GABAA receptor subunits Gabra1, Gabrq, and Gabrg3. Concomitantly, we saw downregulation of genes for Ras/Raf signaling components and an upregulation in negative signaling regulators including Dusp6, Rgs2, Rgs4 and Rgs6. At 8h, while the upregulation in the expression of Fosl1, Egr1, Junb, Jund, Creb and Crebbp mRNAs was sustained, there was a noticeable shift in the expression of the glutamate, GABAA, GPCR, Ras/Raf and RGS family transcripts, showing less intense changes in expression levels compared to those seen at 4h.
Mid to Late System Withdrawal Expression Changes
At 18h mid withdrawal, we observed a prominent induction in the measured set for mRNAs encoding membrane receptors and ion channels (Fig. 4B, 18h), transitioning from earlier active downregulation. This change included members of the GABAA, NMDA and GPCR families, including corticotropin-releasing factor, neurotropin, and growth factor receptor subunits (Ntrk2, Crhr1, and Fgfr2). Further, this induction coincided with repression of RGS family members, known inhibitors of GPCR signaling. At this time point, we typically observe a decrease in our rats’ phenotypic withdrawal intensity, but without complete resolution of signs of agitation and feeding disturbance. This may indicate that these changes in receptor expression are necessary for the complete resolution of withdrawal symptoms. Also of note, there is a distinct transition in the measured transcription factors’ expression from dominant induction to a picture of mixed of up and down regulation, marking a transition from mid to late withdrawal.
By 32 to 48h, physiologic and behavioral withdrawal signs are largely resolved and in our system the number of statistically significant expression changes decreased. Specifically, at 32h, most induction occurred in genes encoding intracellular signaling proteins, particularly those involved in the Ras/Raf kinase pathway. Active suppression increased from 32 to 48h involving transcripts from nearly all of the functional classes, coinciding with another transition in gene expression activity that suggests the involvement of distinct and novel processes beyond those measured at 48h. The number of involved genes and magnitude of their expression change resolved over time, and at 48h, only five genes had quantitative expression levels significantly different from control values by post-hoc testing: Creb, Clu, Rgs4, Pebp1, and Zeb1. While post-hoc testing only represents a subset of the total dynamic picture at a given time point, these five genes represent those that are the most different from controls at 48h.
Correlated Expression and Regulatory Analysis
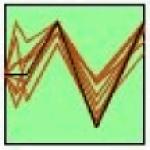
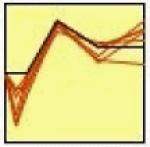
The STEM algorithm (Ernst and Bar-Joseph 2006) was used to identify genes with correlated expression over time and examine relevant regulatory networks. STEM analysis identified seven statistically significant clusters, as shown in Table 1. The seven clusters have variable expression patterns; however, they can be classified into three main groups: oscillatory (clusters 1, 2 and 7), early down regulation followed by late upregulation (clusters 3, 4 and 6), and early upregulation at 4h with later down regulation (cluster 5). The oscillatory expression varies significantly from measurement to measurement, and may reflect transcriptional bursting (Chubb et al. 2006, Golding et al. 2005, Raj et al. 2008). In all cases the clusters’ members are functionally related, and include multiple surface receptor systems and their downstream signaling components (Table 1. Functional associations). Over-represented binding sites for the transcription factors are found within each group, offering evidence of co-regulation (Table 1. Over-represented TF binding sites). TREs that were over-represented in a cluster in comparison to the genome are listed, representing the most relevant subset of TFs binding sites found in the initial 145 gene set. Bold face text indicates which of these TREs were also enriched in the cluster relative to the 145 tested, providing additional statistical support of their relevance. Three TREs were enriched only when the cluster was compared to the 145 gene set, but not in the 145 versus the genome (italics): a TFE site in Cluster 1 (cluster v. 145 p=0.02; 145 v. genome p=0.98), and KAISO (cluster v. 145 p=0.04; 145 v. genome p=0.89) and LEF1/TCF1 sites (cluster v. 145 p=0.05; 145 v. genome p=0.85) in Cluster 6. A complete description of the transcription factor binding site analysis, including the retrieved promoter sequence, all identified promoter regulatory elements, and results of the statistical analysis for all possible comparisons can be found in Supplemental Table S4.
Table 1.
STEM Cluster Analysis Results. The table shows the seven clusters identified by the STEM algorithm. The profile column gives the group expression template profile (black line) as well as the measured mean expression for each transcript in the cluster (red lines). The cluster p-value indicates the level of significance for the particular profile, and is a based on the observed number of matching transcripts compared to the expected number of transcripts fitting the pattern. The functional associations were determined using the DAVID bioinformatics resource using the tested genes as a specific background. The shared transcription factors binding sites were identified using PAINT algorithm and represent over-represented transcription factor binding sites in the promoter regions of cluster members in comparison to the rat genome. Bold faced transcription factors are additionally over-represented in the promoter sequences of the cluster relative to the 145 genes measured. Italics indicate that a given transcription factor binding site is ONLY over-represented in the cluster members in comparison to the background 145 gene set. TF=transcription factor.
| Cluster | Profile | Members | Cluster p-value |
Functional associations (Fisher’s) | Over-represented TF binding sites |
|---|---|---|---|---|---|
| 1. |

|
Rasa1, Plcb1, Ppp5c, Ptpn2, Mapk3, Plcb2, Rgs19, Slc32a1, Map3k11, Ptpn1, Rgs12, Rgs14, Raf1, Gria3, Grk6, Gria2, Pak3, Prkce, Rasgrf2 |
≤0.0001 | long-term depression (≤0.01) raf-like Ras binding (≤0.01) vesicle (≤0.05) GTPase regulator activity (≤0.05) GTPase activator (≤0.05) |
Gabp, Hnf4α,
Ap- 2α, E2, Etf, Krox, Srebp, Sp1, Wt1, Zf5 TFE |
| 2. |
|
Fgfr2, Ntrk2, Slc6a12, Slc6a1, Gabrq, Prkch, Wars, Sp1 |
≤0.001 | protein tyrosine kinase activity
(≤0.01) GABA transporter (≤0.01) plasma membrane (≤0.05) |
Nf-y, Szf1-1, E2, Etf, Hic1, Zf5 |
| 3. |

|
Gabrg3, Scn4b, Kcna2, Rasa2, Rasa3, Map3k12 |
≤0.05 | Ras GTPase-activating protein (≤0.005) gated channel activity (≤0.01) |
Bcl6, Brca1:Usf2,
c-Maf |
| 4. |
|
Gabra1, Grin2a, Grin3a, Grik3, Ptpre, Prkcg |
≤0.01 | glutamate receptor activity (≤0.005) synapse (≤0.005) synapse (≤0.005) receptor linked signal transduction (≤0.05) neurological system process (≤0.05) neurotransmitter binding (≤0.05) |
Pax-8, Deaf1, Hic1, Maz, Myb, , Sp1 |
| 5. |

|
Dusp6, Creb1, Pak2, Plcb3, Akt1, Rasgrp4 |
≤0.05 | regulation of cell size (≤0.001) negative regulation of transferase activity (≤0.01) MAPK signaling pathway (≤0.05) nuclear lumen (≤0.05) |
Ap-2, Cbf, Etf,
Krox, Sp1 |
| 6. |

|
Prkcb, Grin2d, Dctn1, Slc35b2, Zeb1 |
≤0.01 | microtubule cytoskeleton (≤0.05) ubl conjugation (≤0.05) |
Hfh1 (Foxq1),
Lrf KAISO, LEF1/TCF1 |
| 7. |

|
Ppp1cb, Ppp1cc, Jund, Agtrap | ≤0.05 | methyltransferase complex
(≤0.001) serine/threonine-specific phosphatase (≤0.001) glucose metabolic process (≤0.005) nucleus (≤0.05) |
Arnt,
ER, Pparα:Rxrα, Pparγ:Rxrα , Pax-4 |
As a result of its relevant membership which includes Grin2a, Grin3a, Grik3, Gabra1, Ptpre, and Prckg, Cluster 4 was selected for detailed discussion here (Fig. 5). The co-expression of glutamate receptors and GABAA receptors over time may suggest a role for expression-based maintenance of excitatory-inhibitory balance. This group of six genes underwent early suppression followed by peak induction at 18h (cluster p-value≤0.01; Fig. 5). Five of the six clustered genes encode proteins that are either ion channels or receptors. The sixth, Prkcg, encodes PKC-gamma and is known to be stress responsive at the gene expression level and to play a role in glutamate receptor regulation (Lin et al. 2006). This cluster is further enriched for genes associated with the terms receptor linked signal transduction (≤0.05), neurological system process (≤0.05), synapse (≤0.05), neurotransmitter binding (≤0.05), and glutamate receptor activity (≤0.01). Comparison of the upstream promoter regions indicated that the group shares known transcription factor binding sites for Deaf1, Hic1, Myb, Maz, Pax-8, and Sp1 and can be connected in the regulatory network shown in Fig. 5C. Sp1 was measured experimentally and its quantitative level increased significantly at 4h, prior to increased expression in the cluster, providing additional temporal evidence for its regulatory role during alcohol withdrawal. Pax-8 had additional statistical support for its role, being over-represented in the cluster in comparison to the 145-gene test set (p=0.02). Additional figures for the six remaining clusters can be found in the supplement.
Fig. 5.
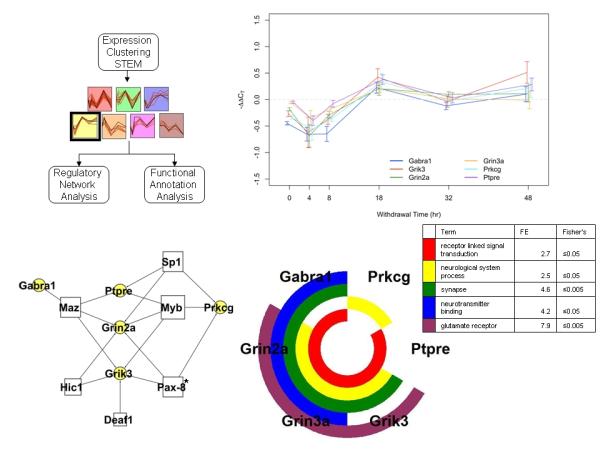
Correlated expression clusters discovered using the STEM algorithm for time series profile matching. (A) Schematic of the analysis pipeline used and the seven statistically significant gene clusters identified in the analysis. The black box surrounds the selected cluster, which is presented in more detail in panels B-D. Remaining statistically significant cluster assignments can be found in Supplemental Figures 2-7. (B) The expression profile for this cluster including Gabra1, Grin2a, Grin3a, Grik3, Prkcg, Ptpre, (p-value≤0.01). Values are the mean ΔΔCT values as compared to sacrifice-time matched control animals. Error bars represent 95% confidence intervals around the mean. Individual series are offset to ease visualization, but all measurements were taken at the time indicated. (C) A schematic network of the proposed regulatory network illustrating transcription factor binding sites shared among cluster members’ promoters from the 1000bp upstream of the transcription start site, as annotated by PAINT (white boxes). Yellow circles represent cluster member genes and connections indicate a predicted regulatory relationship. * indicates that the binding site is over-represented in the cluster in comparison to the 145 network. All other binding sites represent cluster enrichment in comparison to the genome. (D) Nested pie chart of cluster members showing significantly enriched annotation terms from the DAVID bioinformatics resource. The GO annotations of the 145 gene set were used as reference. Each ring is a single annotation term, indicated by the color noted in the legend along with fold enrichment score (FE) and the associated Fisher’s exact test p-value. All genes in the cluster with that GO annotation are colored in the nested pie chart.
NMDA and GABAA Receptor Subunit Expression
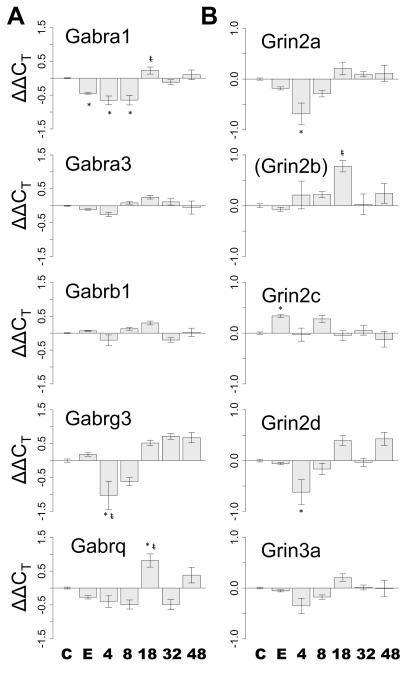
As a result of the clustering of NMDA and GABAA subunit genes, and general interest in these receptor families, we have highlighted their expression in Fig. 6. During withdrawal, there were time dependent changes in the subunit expression of both receptor families. Among GABAA receptor subunits, Gabrg3 shows the most rapid response, with over a 2-fold decrease from dependent levels at 4h. Gabra1 and Gabrq show more delayed dynamics, with large inductions between 8 and 18h that resolve by 32h. Gabrb1 and Gabra3 show more gradual changes, reaching a minimum at 4h and peaking at 18h.
Fig. 6.
Temporal changes in GABAA and NMDA receptor gene expression during the first 48h of alcohol withdrawal in the DVC. (A) The temporal expression of GABAA receptor subunits with statistically significant treatment effects (ANOVA p≤0.05) as ΔΔCT over time. (B) The temporal expression of NMDA receptor subunits with statistically significant treatment effects (ANOVA p≤0.05) as ΔΔCT over time. Grin2b appears in parentheses, indicating that the transcript did not show a statistically significant treatment effect via ANOVA though additional post-hoc treatment comparisons showed a difference between the chronic ethanol and 18 h measurements. It is included for completeness. C=control, E=chronic ethanol, 4, 8, 18, 32, and 48 refer to the duration of withdrawal when measurements were made. Post-hoc Tukey’s treatment comparisons: * significant versus control (p≤0.05), t significant versus dependent (p≤0.05).
NMDA receptor subunits Grin2a, Grin2c, Grin2d and Grin3a all show similar expression patterns, with decreased expression in chronic samples that undergoes further down regulation in the first 4h of withdrawal. This decrease is transient and is followed by an increase in expression around 18h: dynamics similar to those seen in the GABAA receptor family transcripts. Grin2c is unique among NMDA receptor subunits by having increased mRNA levels in chronically alcohol exposed DVC samples (Tukey’s HSD test, p≤0.05). However during withdrawal, it also follows the pattern of early decreased expression followed by induction. These quantitative measures suggest that the DVC experiences altered excitatory and inhibitory states beginning early in alcohol withdrawal that change dynamically over the first 48h.
Discussion
Overall, our quantitative time series results show a limited expression change in chronically exposed DVC samples in contrast to a multi-gene expression response during withdrawal. In withdrawal, the expression of genes encoding IEGs, GABAA, iontotropic glutamate and GPC receptors and the Ras/Raf signaling pathways demonstrated a complex temporally coordinated response. These changes were immediate and readily apparent at 4h as upregulation in IEGs and the concomitant downregulation of genes encoding membrane receptors and downstream signaling pathways. At 18h the genes for many of these receptors were upregulated, including members of the NMDA, GABAA and opioid receptor families. Shared transcription factor binding sites in a group of genes with similar time series expression, including Gabra1, Grin2a, Grin3a and Grik3, predict a transcription factor regulatory network during withdrawal centered around Myb, Pax-8, Maz and Sp1.
The experimental design used in this analysis is relatively novel, based on 102 samples and 145 PCR assays measured over a 48h time period. As a focused study, this approach certainly misses genes undergoing significant changes in expression with important effects on withdrawal biology; however this focus allows us to look at a limited a panel of genes in more detail. As such, the statistical approach was matched accordingly. Analysis with established approaches for estimating FDR indicated that 80-90% of the measured data showed statistically significant changes (Supplemental Table 3). However, as FDR correction measures are based on the assumption that gene expression measures are independent and uncorrelated, we used a more stringent criterion based on the individual p-values by ANOVA and several downstream analyses such as functional annotation and promoter analysis to further refine the results. Further, the study of expression changes over time introduces additional complexity resulting from diurnal expression changes. While the experiment and statistical analyses attempt to account for these differences by including sacrifice-time matched controls, we cannot account for confounding withdrawal-diurnal expression relationships that occur uniquely in withdrawal animals. Alcohol usage has been shown to modulate circadian activity (Norrell et al. 2010, Rosenwater et al. 2010), and withdrawal-circadian interactions have been the focus of previously published withdrawal studies (Melendez et al. 2011, Logan et al. 2011) and this laboratory (Staehle et al, in progress). Consequently, the results of these analyses are based on evidence that, after sacrifice-specific normalization, (1) a significant change in expression was seen over time, (2) multiple genes follow that expression pattern, (3) the groups are annotated for specific relevant functions, and (4) they share over representation of specific transcription factor binding sites in their promoter region. Hence they can be regarded as reasonably resistant to false positives and withdrawal-diurnal expression correlations. For example, the PAINT results from cluster 4 are based on a group of 6 genes that share synaptic functions, with enriched promoter regulatory elements that are not dependent on any one or two genes individually, but are based on several genes that share similar expression patterns over time (Figure 5). Recent developments indicate that this approach is fruitful even when scaled up to tens of thousands of genes measured using microarrays. Further, in extreme cases in genomic experiments, all gene expression data can be used in clustering, pattern and module identification without initial filtering for significant change, relying solely on statistical evaluation of the grouping (e.g., WGCNA: Zhang et al. 2005, Oldham et al. 2008, Clarke et al. 2011).
In light of the autonomic instability experienced following the cessation of chronic alcohol intake (Bar et al. 2008), dynamic expression changes in the DVC are of considerable interest. The role of the DVC neurons sampled in this study is to integrate inputs from the viscera, to maintain homeostatic cardiovascular stability, and to relay information to hypothalamic, limbic and forebrain structures (Schwaber et al. 1982). Recent studies quantifying human cerebral blood flow during the first 24h of “moderate to severe” symptomatic alcohol withdrawal showed significantly elevated systolic blood pressure and cerebral blood flow (Jochum et al. 2010). The DVC would be expected to receive information about these changes and respond to alter sympathetic outflow. These quantitative expression changes may represent a portion of the molecular response necessary to achieve this new homeostatic balance. Additionally, as a result of the DVC relays to emotional and reward circuits, particularly dense in the central amygdala (Schwaber et al. 1982), these findings may be important for emotional and endocrine dysregulation (Silberman et al. 2009).
Because the DVC is a homeostatic center, we would expect its molecular activity to parallel its physiologic regulatory function (Khan et al. 2008). This idea is supported by the comparison of expression changes seen during chronic alcohol exposure and withdrawal. In the exposed state, we saw relatively few changes are seen with qPCR measurement. Functionally, these genes, Grin2c, Gabra1, Gad1 and Rgs6, modulate GABA and glutamate neurotransmission, either directly or through regulatory relationships (Liu et al. 2006, Lomazzi, et al. 2008). These limited changes are consistent with our previous microarray study during chronic alcohol exposure that identified differential expression in only 6% of genes (Covarrubias and Khan et al. 2005). Other global expression studies in the frontal cortex, nucleus accumbens and amygdala have shown changes in approximately 2% of genes (Tabakoff et al. 2009, Arlinde et al. 2004). Together, these findings suggest that chronically alcohol exposed animals are in a molecularly adapted dependent state that cannot be identified by sustained gene expression changes.
In contrast, withdrawal’s profound physiologic challenge is rapidly reflected in quantitative measures of DVC gene expression. The withdrawal time points showed broad, large-magnitude expression changes across all measured systems, in 86 of the 145 genes studied. While studies of gene expression changes in the DVC within the first 48h of alcohol withdrawal are limited, there is a considerable literature addressing early changes in other brain regions, particularly in transcription factors such as cFos (Kozell et al. 2005), Egr1 (Depaz, et al. 2000), SP1 (Wilce et al. 1994) and calcium signaling systems (Silberman et al. 2009). The burst of expression change after the removal of alcohol marks a transition from a steady-state condition and suggests that withdrawal results in a rapid and severe alteration in cellular signaling that triggers the expression.
Other novel observations in this experiment include the rapidity of the expression response in non-IEGs. While early studies (less than 12h) in alcohol withdrawal are limited, focused dynamic expression studies in other conditions have proposed similar time scales, including increased Grin2b expression 3h after cytokine stimulation (Nicolai et al. 2010) and a model of long term potentiation that within minutes shows nuclear translocation of Jacob protein, a coupler of glutamate signaling to transcription changes (Jacob et al. 2008). Our results indicate that the early expression response involves nearly all of the sampled systems. All told, these findings present a potential link between intense autonomic stress, withdrawal related increases in calcium signaling, and changes in DVC gene expression on the order of minutes to hours. It is plausible that the initial widespread down-regulation represents a protective response to rebound excitatory signaling seen following chronic exposure-induced enhancement of excitatory glutamate (Roberto et al. 2006) and calcium pathways and attenuation of GABA signaling.
More broadly, qPCR measurement showed a temporal progression of functionally related gene products. We observed an initial induction of expression in IEGs, other transcription factors and epigenetic regulators. Following, we saw induction of genes encoding receptors and channels, indicating that these may be downstream of the initial changes. This suggests that expression plays a role in altering the membrane protein composition following cessation of the alcohol diet. Finally, we saw adjustment in the expression of intracellular signaling components, which could be required for fine-tuning signaling systems following changes in receptor and channel composition. In focused experiments, many of these systems have been implicated in the pathology of alcohol use disorders including receptors, channels, transcription factors (Kozell et al. 2005, Depaz et al. 2000), and Ras/Raf and MAPK signaling (Sanna et al. 2002). Combining these quantitative measurements in a time series gives insight into how these systems interact and the temporal progression of expression changes. However, due to the focused nature of this data set, generalizability of these rapid changes to other gene systems and brain regions is unknown.
Time series clustering analysis revealed the correlated expression of a several groups of transcripts (Table 1). In each case, the expression profiles were common to a statistically significant number of genes, had known functional associations and shared over representation of specific transcription factors in their promoter regions. Combining these analyses of quantitative temporal expression measurement with putative common transcription factor binding sites points to a plausible mechanism of coordination for the clusters and many specific functions including GCPR signaling (cluster 1), GABA reuptake and transport (Cluster 2), glutamate receptor activity (Cluster 4), Mapk signaling (Cluster 5) and protein phosphatase activity (Cluster 7). Additionally, transcription factors Ap-2, E2, Sp1, ETF, Krox, Hic-1 and Zf5 are over-represented in at least two clusters. This suggests that these transcription factors are ubiquitous and may generate a permissive role for dynamic changes in expression during alcohol withdrawal. For example, prior literature has shown that SP1 is recruited to promoter regions following periods of intense depolarization (Harikrishnan et al. 2010), as would be expected in alcohol withdrawal. Similar activity has also been reported for Egr family transcription factors, which bind Krox regulatory elements early in alcohol withdrawal (Depaz et al. 2000). Hic1 is a tumor suppressor related to the regulation of cell death and stress responses (Van Rechem et al. 2009). In contrast, the transcription factors that are enriched within a single cluster, such as Gabp, Hnf4α (Cluster 1), Foxq1 (Cluster 6) and Pax-8 (Cluster 4) may help convey specificity to the expression profile.
A single temporal expression cluster included both the glutamate receptors Grin2a, Grin3a and Grik3, and GABAA receptor Gabra1. Only Gabra1 showed significantly altered expression following chronic exposure. The correlated expression of GABAA and NMDA receptor subunits suggests a role for expression in the reestablishment of excitatory and inhibitory balance during withdrawal. Additionally, expression changes in interacting but distinct membrane receptors suggests that these subunits are not expressed independently during alcohol withdrawal and likely share a common regulatory mechanism (Eisen et al. 1998, Qian et al. 2001). The proposed regulatory network combines SP1, Myb, Pax-8 and Maz, all of which are found in at least 3 of the 6 clustered genes, to enable concerted changes. Among these, Myb, Pax-8, and Maz are unique to the cluster. Pax family transcription factors have been implicated in fetal alcohol syndrome (Talens-Visconti et al. 2011). Maz is commonly studied for its role in regulating the expression of phenylethanolamine N-methyltransferase (Her et al. 2003). This enzyme converts norepinephrine to epinephrine, particularly relevant to the DVC during withdrawal where adrenergic modulation of A2 neurons is a key control point for central cardiovascular pathways (Vadigepalli et al. 2011). Myb is most widely studied for its role in regulating cell cycle (Gewirtz et al. 1989), and has been implicated in cellular proliferation associated with hepatic fibrosis (Okazaki et al. 2000), commonly associated with alcohol use. Their presence in this regulatory network further supports the existence of an expression program signature of an excitotoxic state and suggests a novel role for the involvement of these transcription factors during alcohol withdrawal representing neurotransmitter system cross-talk at the level of gene expression.
The insights provided by this study arise as a consequence of the quantitative measurement of many functionally-relevant genes in parallel across time. Taken together, these measurements show early and widespread changes in gene expression during alcohol withdrawal consistent with a protective response from excitotoxicity. This finding emphasizes the importance of examining early gene expression changes in functionally relevant systems. Our results also provide evidence for regulatory relationships coordinating the expression of interacting neurotransmission and intracellular signaling systems. Further, validation of the putative transcription factor regulatory networks can be sought using chromatin immunoprecipitation studies. Extension of these approaches to other brain regions, additional time series and other functionally-specific gene sets may lead to increased insight into how changes in gene expression relate to pathologic neuronal behavior during alcohol withdrawal.
Supplementary Material
Acknowledgements
This work was supported by grants from the NIH (R01 AA-015601, R01 GM-083108, R01 GM-076495 and R33 HL-087361 to JSS, GM-083108 to JSS and RV, R33 HL088283 to RV, R24 AA-014986 to JBH, and T32 AA-007463 support of KF and MMS). ZHG gratefully acknowledges support from The HRH Prince Alwaleed Bin Talal Bin Abdulaziz Alsaud Institute for Computational Biomedicine (ICB), and the computational resources of the Coffrin Center for Biomedical Information, (ICB) at Weill Cornell Medical College of Cornell University. The high-dimensional qPCR was performed with the generous help of Fluidigm, South San Francisco, CA. We also wish to thank Buğra Özer, Monica Payne, and Peter Ucciferro for assistance with experiments and analysis, and the TJU Alcohol Research Center, especially Dr. Biddanda Ponnappa, John Mullen, and Permelia Mullen, for their support with the animal model.
Footnotes
Conflict of interest The authors declare no conflict of interest.
References
- Arlinde C, Sommer W, Bjork K, Reimers M, Hyytia P, Kiianmaa K, Heilig M. A cluster of differentially expressed signal transduction genes identified by microarray analysis in a rat genetic model of alcoholism. Pharmacogenomics J. 2004;4:3208–218. doi: 10.1038/sj.tpj.6500243. [DOI] [PubMed] [Google Scholar]
- Bar KJ, Boettger MK, Schulz S, Neubauer R, Jochum T, Voss A, Yeragani VK. Reduced cardio-respiratory coupling in acute alcohol withdrawal. Drug Alcohol Depend. 2008;98:3210–217. doi: 10.1016/j.drugalcdep.2008.05.012. [DOI] [PubMed] [Google Scholar]
- Bolstad BM, Irizarry RA, Astrand M, Speed TP. A comparison of normalization methods for high density oligonucleotide array data based on variance and bias. Bioinformatics. 2003;19:2185–193. doi: 10.1093/bioinformatics/19.2.185. [DOI] [PubMed] [Google Scholar]
- Breese GR, Criswell HE, Carta M, Dodson PD, Hanchar HJ, Khisti RT, Mameli M, Ming Z, Morrow AL, Olsen RW, Otis TS, Parsons LH, Penland SN, Roberto M, Siggins GR, Valenzuela CF, Wallner M. Basis of the Gabamimetic Profile of Ethanol. Alcohol Clin Exp Res. 2006;30:4731–744. doi: 10.1111/j.0145-6008.2006.00086.x. [DOI] [PMC free article] [PubMed] [Google Scholar]
- Chubb JR, Trcek T, Shenoy SM, Singer RH. Transcriptional pulsing of a developmental gene. Curr Biol. 2006;16:101018–1025. doi: 10.1016/j.cub.2006.03.092. [DOI] [PMC free article] [PubMed] [Google Scholar]
- Clarke C, Doolan P, Barron N, Meleady P, O’Sullivan F, Gammell P, Melville M, Leonard M, Clynes M. Large scale microarray profiling and coexpression network analysis of CHO cells identifies transcriptional modules associated with growth and productivity. J Biotechnol. 2011;155:3350–359. doi: 10.1016/j.jbiotec.2011.07.011. [DOI] [PubMed] [Google Scholar]
- Cline MS, Smoot M, Cerami E, Kuchinsky A, Landys N, Workman C, Christmas R, Avila-Campilo I, Creech M, Gross B, Hanspers K, Isserlin R, Kelley R, Killcoyne S, Lotia S, Maere S, Morris J, Ono K, Pavlovic V, Pico AR, Vailaya A, Wang PL, Adler A, Conklin BR, Hood L, Kuiper M, Sander C, Schmulevich I, Schwikowski B, Warner GJ, Ideker T, Bader GD. Integration of biological networks and gene expression data using Cytoscape. Nat Protoc. 2007;2:102366–2382. doi: 10.1038/nprot.2007.324. [DOI] [PMC free article] [PubMed] [Google Scholar]
- Covarrubias MY, Khan RL, Vadigepalli R, Hoek JB, Schwaber JS. Chronic alcohol exposure alters transcription broadly in a key integrative brain nucleus for homeostasis: the nucleus tractus solitarius. Physiol Genomics. 2005;24:145–58. doi: 10.1152/physiolgenomics.00184.2005. [DOI] [PubMed] [Google Scholar]
- de la M Hall P, Lieber CS, DeCarli LM, French SW, Lindros KO, Jarvelainen H, Bode C, Parlesak A, Bode JC. Models of alcoholic liver disease in rodents: a critical evaluation. Alcohol Clin Exp Res. 2001;25(5 Suppl):254–261. doi: 10.1097/00000374-200105051-00041. [DOI] [PubMed] [Google Scholar]
- Depaz IM, Goodenough S, Wilce PA. Chronic ethanol has region-selective effects on Egr-1 and Egr-3 DNA-binding activity and protein expression in the rat brain. Neurochem Int. 2000;37:5–6473. doi: 10.1016/s0197-0186(00)00060-7. [DOI] [PubMed] [Google Scholar]
- Eisen MB, Spellman PT, Brown PO, Botstein D. Cluster analysis and display of genome-wide expression patterns. Proc Natl Acad Sci USA. 1998;95:2514863–14868. doi: 10.1073/pnas.95.25.14863. [DOI] [PMC free article] [PubMed] [Google Scholar]
- Ernst J, Bar-Joseph Z. STEM: a tool for the analysis of short time series gene expression data. BMC Bioinformatics. 2006;7:191. doi: 10.1186/1471-2105-7-191. [DOI] [PMC free article] [PubMed] [Google Scholar]
- Eyer F, Schuster T, Felgenhauer N, Pfab R, Strubel T, Saugel B, Zilker T. Risk assessment of moderate to severe alcohol withdrawal--predictors for seizures and delirium tremens in the course of withdrawal. Alcohol Alcohol. 2011;46:4427–433. doi: 10.1093/alcalc/agr053. [DOI] [PubMed] [Google Scholar]
- Geisler RF, Hunter BE, Walker DW. Ethanol dependence in the rat: temporal changes in neuroexcitability following withdrawal. Psychopharmacology. 1978;56:3287–292. doi: 10.1007/BF00432851. [DOI] [PubMed] [Google Scholar]
- Gewirtz AM, Anfossi G, Venturelli D, Valpreda S, Sims R, Calabretta B. G1/S transition in normal human T-lymphocytes requires the nuclear protein encoded by c-myb. Science. 1989;245:4914180–183. doi: 10.1126/science.2665077. [DOI] [PubMed] [Google Scholar]
- Golding I, Paulsson J, Zawilski SM, Cox EC. Real-time kinetics of gene activity in individual bacteria. Cell. 2005;123:61025–1036. doi: 10.1016/j.cell.2005.09.031. [DOI] [PubMed] [Google Scholar]
- Harikrishnan KN, Bayles R, Ciccotosto GD, Maxwell S, Cappai R, Pelka GJ, Tam PP, Christodoulou JEl, Osta A. Alleviating transcriptional inhibition of the norepinephrine slc6a2 transporter gene in depolarized neurons. J Neurosci. 2010;30:41494–1501. doi: 10.1523/JNEUROSCI.4675-09.2010. [DOI] [PMC free article] [PubMed] [Google Scholar]
- Hashimoto JG, Forquer MR, Tanchuck MA, Finn DA, Wiren KM. Importance of genetic background for risk of relapse shown in altered prefrontal cortex gene expression during abstinence following chronic alcohol intoxication. Neuroscience. 2011;173:57–75. doi: 10.1016/j.neuroscience.2010.11.006. [DOI] [PMC free article] [PubMed] [Google Scholar]
- Her S, Claycomb R, Tai TC, Wong DL. Regulation of the rat phenylethanolamine N-methyltransferase gene by transcription factors Sp1 and MAZ. Mol Pharmacol. 2003;64:51180–1188. doi: 10.1124/mol.64.5.1180. [DOI] [PubMed] [Google Scholar]
- Huang da W, Sherman BT, Tan Q, Kir J, Liu D, Bryant D, Guo Y, Stephens R, Baseler MW, Lane HC, Lempicki RA. DAVID Bioinformatics Resources: expanded annotation database and novel algorithms to better extract biology from large gene lists. Nucleic Acids Res. 2007;35:169–175. doi: 10.1093/nar/gkm415. [DOI] [PMC free article] [PubMed] [Google Scholar]
- Hunter BE, Riley JN, Walker DW. Ethanol dependence in the rat: a parametric analysis. Pharmacol Biochem Behav. 1975;3:4619–629. doi: 10.1016/0091-3057(75)90183-5. [DOI] [PubMed] [Google Scholar]
- Jacob TC, Moss SJ, Jurd R. GABAA receptor trafficking and its role in the dynamic modulation of neuronal inhibition. Nat Rev Neurosci. 2008;9:5331–343. doi: 10.1038/nrn2370. [DOI] [PMC free article] [PubMed] [Google Scholar]
- Jochum T, Reinhard M, Boettger MK, Piater M, Bar KJ. Impaired cerebral autoregulation during acute alcohol withdrawal. Drug Alcohol Depend. 2010;110:3240–246. doi: 10.1016/j.drugalcdep.2010.03.007. [DOI] [PubMed] [Google Scholar]
- Khan RL, Vadigepalli R, McDonald MK, Rogers RF, Gao GR, Schwaber JS. Dynamic transcriptomic response to acute hypertension in the nucleus tractus solitarius. Am J Physiol Regul Integr Comp Physiol. 2008;295:15–27. doi: 10.1152/ajpregu.00152.2008. [DOI] [PMC free article] [PubMed] [Google Scholar]
- Koob GF. Theoretical Frameworks and Mechanistic Aspects of Alcohol Addiction: Alcohol Addiction as a Reward Deficit Disorder. Curr Top Behav Neurosci. 2011 doi: 10.1007/7854_2011_129. [Epub ahead of print] [DOI] [PMC free article] [PubMed] [Google Scholar]
- Kozell LB, Hitzemann R, Buck KJ. Acute alcohol withdrawal is associated with c-Fos expression in the basal ganglia and associated circuitry: C57BL/6J and DBA/2J inbred mouse strain analyses. Alcohol Clin Exp Res. 2005;29:111939–1948. doi: 10.1097/01.alc.0000187592.57853.12. [DOI] [PubMed] [Google Scholar]
- Kundaje A, Middendorf M, Gao F, Wiggins C, Leslie C. Combining sequence and time series expression data to learn transcriptional modules. IEEE/ACM Trans Comput Biol Bioinform. 2005;2:3194–202. doi: 10.1109/TCBB.2005.34. [DOI] [PubMed] [Google Scholar]
- Lieber CS, DeCarli LM. Animal models of chronic ethanol toxicity. Methods Enzymol. 1994;233:585–594. doi: 10.1016/s0076-6879(94)33061-1. [DOI] [PubMed] [Google Scholar]
- Lin D, Barnett M, Lobell S, Madgwick D, Shanks D, Willard L, Zampighi GA, Takemoto DJ. PKCgamma knockout mouse lenses are more susceptible to oxidative stress damage. J Exp Biol. 2006;209:214371–4378. doi: 10.1242/jeb.02524. [DOI] [PubMed] [Google Scholar]
- Liu W, Yuen EY, Allen PB, Feng J, Greengard P, Yan Z. Adrenergic modulation of NMDA receptors in prefrontal cortex is differentially regulated by RGS proteins and spinophilin. Proc Natl Acad Sci USA. 2006;103:4818338–18343. doi: 10.1073/pnas.0604560103. [DOI] [PMC free article] [PubMed] [Google Scholar]
- Logan RW, McCulley WD, Seggio JA, Rosenwasser AM. Effects of Withdrawal from Chronic Intermittent Ethanol Vapor on the Level and Circadian Periodicity of Running-Wheel Activity in C57BL/6J and C3H/HeJ Mice. Alcohol Clin Exp Res. 2011 doi: 10.1111/j.1530-0277.2011.01634.x. [Epub ahead of print] [DOI] [PMC free article] [PubMed] [Google Scholar]
- Lomazzi M, Slesinger PA, Luscher C. Addictive drugs modulate GIRK-channel signaling by regulating RGS proteins. Trends Pharmacol Sci. 2008;29:11544–549. doi: 10.1016/j.tips.2008.07.011. [DOI] [PMC free article] [PubMed] [Google Scholar]
- Macey DJ, Schulteis G, Heinrichs SC, Koob GF. Time-dependent quantifiable withdrawal from ethanol in the rat: Effect of method of dependence induction. Alcohol. 1996;13:2163–170. doi: 10.1016/0741-8329(95)02030-6. [DOI] [PubMed] [Google Scholar]
- Melendez RI, McGinty JF, Kalivas PW, Becker HC. Brain region-specific gene expression changes after chronic intermittent ethanol exposure and early withdrawal in C57BL/6J mice. Addict Biol. 2011 doi: 10.1111/j.1369-1600.2011.00357.x. [Epub ahead of print] [DOI] [PMC free article] [PubMed] [Google Scholar]
- Mendez M, Morales-Mulia M. Role of mu and delta opioid receptors in alcohol drinking behaviour. Curr Drug Abuse Rev. 2008;1:2239–252. doi: 10.2174/1874473710801020239. [DOI] [PubMed] [Google Scholar]
- Morris SA, Kelso ML, Liput DJ, Marshall SA, Nixon K. Similar withdrawal severity in adolescents and adults in a rat model of alcohol dependence. Alcohol. 2010;44:189–98. doi: 10.1016/j.alcohol.2009.10.017. [DOI] [PMC free article] [PubMed] [Google Scholar]
- Nagy J. Alcohol related changes in regulation of NMDA Receptor Function. Current Neuropharmacology. 2008;6:139–54. doi: 10.2174/157015908783769662. [DOI] [PMC free article] [PubMed] [Google Scholar]
- Nicolai J, Burbassi S, Rubin J, Meucci O. CXCL12 inhibits expression of the NMDA receptor’s NR2B subunit through a histone deacetylase-dependent pathway contributing to neuronal survival. Cell Death Dis. 2010;1:33. doi: 10.1038/cddis.2010.10. [DOI] [PMC free article] [PubMed] [Google Scholar]
- Norrell S, Reyes-Vasquez C, Burau K, Dafny N. Alcohol usage and abrupt cessation modulate diurnal activity. Brain Res Bull. 2010;83:1–257. doi: 10.1016/j.brainresbull.2010.06.013. [DOI] [PMC free article] [PubMed] [Google Scholar]
- Obara I, Bell R, Goulding SP, Reyes CM, Larson L, Ary A, Truitt W, Szumlinski K. Differential Effects of Chronic Ethanol Consumption and withdrawal on Homer/Glutamate Receptor Expression in Subreions of the Accumbens and Amygdala of P Rats. Alcohol Clin Exp Res. 2009;33:111924–1934. doi: 10.1111/j.1530-0277.2009.01030.x. [DOI] [PMC free article] [PubMed] [Google Scholar]
- Okazaki I, Watanabe T, Hozawa S, Arai M, Maruyama K. Molecular mechanism of the reversibility of hepatic fibrosis: with special reference to the role of matrix metalloproteinases. J Gastroenterol Hepatol. 2000;15(Suppl):26–32. doi: 10.1046/j.1440-1746.2000.02185.x. [DOI] [PubMed] [Google Scholar]
- Oldham MC, Konopka G, Iwamoto K, Langfelder P, Kato T, Horvath S, Geschwind DH. Functional organization of the transcriptome in human brain. Nat Neurosci. 2008;11:111271–1282. doi: 10.1038/nn.2207. [DOI] [PMC free article] [PubMed] [Google Scholar]
- Pradervand S, Weber J, Thomas J, Bueno M, Wirapati P, Lefort K, Dotto GP, Harshman K. Impact of normalization on miRNA microarray expression profiling. RNA. 2009;15:3493–501. doi: 10.1261/rna.1295509. [DOI] [PMC free article] [PubMed] [Google Scholar]
- Prendergast MA, Harris BR, Mullholland PJ, Blanchard JA, Gibson DA, Holley RC, Littleton JM. Hippocampal CA1 region neurodegeneration produced by ethanol withdrawal requires activation of intrinsic polysynaptic hippocampal pathways and function of N-methyl-D-aspartate receptors. Neuroscience. 2004;124:4869–877. doi: 10.1016/j.neuroscience.2003.12.013. [DOI] [PubMed] [Google Scholar]
- Qian J, Dolled-Filhart M, Lin J, Yu H, Gerstein M. Beyond synexpression relationships: local clustering of time-shifted and inverted gene expression profiles identifies new, biologically relevant interactions. J Mol Biol. 2001;314:51053–1066. doi: 10.1006/jmbi.2000.5219. [DOI] [PubMed] [Google Scholar]
- Raj A, van Oudenaarden A. Nature, nurture, or chance: stochastic gene expression and its consequences. Cell. 2008;135:2216–226. doi: 10.1016/j.cell.2008.09.050. [DOI] [PMC free article] [PubMed] [Google Scholar]
- Roberto M, Bajo M, Crawford E, Madamba SG, Siggins GR. Chronic ethanol exposure and protracted abstinence alter NMDA receptors in central amygdala. Neuropsychopharmacology. 2006;31:5988–996. doi: 10.1038/sj.npp.1300840. [DOI] [PubMed] [Google Scholar]
- Rosenwasser AM. Circadian clock genes: non-circadian roles in sleep, addiction, and psychiatric disorders. Neurosci Biobehav Rev. 2010;34:81249–1255. doi: 10.1016/j.neubiorev.2010.03.004. [DOI] [PubMed] [Google Scholar]
- Sanna PP, Simpson C, Lutjens R, Koob G. ERK regulation in chronic ethanol exposure and withdrawal. Brain Res. 2002;948:1–2186. doi: 10.1016/s0006-8993(02)03191-8. [DOI] [PubMed] [Google Scholar]
- Schwaber J, Kapp B, Higgins G, Rapp P. Amygdaloid and basal forebrain direct connections with the nucleus of the solitary tract and the dorsal motor nucleus. J Neurosci. 1982;2:101424–1438. doi: 10.1523/JNEUROSCI.02-10-01424.1982. [DOI] [PMC free article] [PubMed] [Google Scholar]
- Silberman Y, Bajo M, Chappell AM, Chrisitan DT, Cruz M, Diaz M, Kash T, Läck AK, Messing R, Siggins G, Winder D, Roberto M, McCool B, Weiner J. Neurobiological mechanisms contributing to alcohol-stress-anxiety interactions. Alcohol. 2009;43:509–519. doi: 10.1016/j.alcohol.2009.01.002. [DOI] [PMC free article] [PubMed] [Google Scholar]
- Sommer W, Hyytia P, Kiianmaa K. The alcohol-preferring AA and alcohol-avoiding ANA rats: neurobiology of the regulation of alcohol drinking. Addict Biol. 2006;11:3–4289. doi: 10.1111/j.1369-1600.2006.00037.x. [DOI] [PubMed] [Google Scholar]
- Spurgeon SL, Jones RC, Ramakrishnan R. High throughput gene expression measurement with real time PCR in a microfluidic dynamic array. PLoS One. 2008;3:1662. doi: 10.1371/journal.pone.0001662. [DOI] [PMC free article] [PubMed] [Google Scholar]
- Storey JD, Tibshirani R. Statistical significance for genomewide studies. Proc Natl Acad Sci USA. 2003;100:169440–9445. doi: 10.1073/pnas.1530509100. [DOI] [PMC free article] [PubMed] [Google Scholar]
- Tabakoff B, Saba L, Printz M, Flodman P, Hodgkinson C, Goldman D, Koob G, Richardson HN, Kechris K, Bell RL, Hubner N, Heinig M, Pravenec M, Mangion J, Legault L, Dongier M, Conigrave KM, Whitfield JB, Saunders J, Grant B, Hoffman PL. WHO/ISBRA Study on State and Trait Markers of Alcoholism Genetical genomic determinants of alcohol consumption in rats and humans. BMC Biol. 2009;7:70. doi: 10.1186/1741-7007-7-70. [DOI] [PMC free article] [PubMed] [Google Scholar]
- Talens-Visconti R, Sanchez-Vera I, Kostic J, Perez-Arago MA, Erceg S, Stojkovic M, Guerri C. Neural differentiation from human embryonic stem cells as a tool to study early brain development and the neuroteratogenic effects of ethanol. Stem Cells Dev. 2011;20:2327–339. doi: 10.1089/scd.2010.0037. [DOI] [PubMed] [Google Scholar]
- Vadigepalli R, Chakravarthula P, Zak DE, Schwaber JS, Gonye GE. PAINT: a promoter analysis and interaction network generation tool for gene regulatory network identification. OMICS. 2003;7:3235–252. doi: 10.1089/153623103322452378. [DOI] [PubMed] [Google Scholar]
- Vadigepalli R, Gonye G, Paton JF, Schwaber J. Adaptive transcriptional dynamics of A2 neurons and central cardiovascular control pathways. Exp.Physiol. 2011 doi: 10.1113/expphysiol.2011.059790. [Epub ahead of print] [DOI] [PMC free article] [PubMed] [Google Scholar]
- Van Rechem C, Rood BR, Touka M, Pinte S, Jenal M, Guerardel C, Ramsey K, Monte D, Begue A, Tschan MP, Stephan DA, Leprince D. Scavenger chemokine (CXC motif) receptor 7 (CXCR7) is a direct target gene of HIC1 (hypermethylated in cancer 1) J Biol Chem. 2009;284:3120927–20935. doi: 10.1074/jbc.M109.022350. [DOI] [PMC free article] [PubMed] [Google Scholar]
- Vilpoux C, Warnault V, Pierrefiche O, Daoust M, Naassila M. Ethanol-sensitive brain regions in rate and mouse: a cartographic review, using immediate early gene expression. Alcohol Clin Exp Res. 2009;33:6945–969. doi: 10.1111/j.1530-0277.2009.00916.x. [DOI] [PubMed] [Google Scholar]
- Walker DW, Hunter BE, Riley J. A behavioral and electrophysiological analysis of ethanol dependence in the rat. Adv Exp Med Biol. 1975;59:353–372. doi: 10.1007/978-1-4757-0632-1_25. [DOI] [PubMed] [Google Scholar]
- Wilce P, Beckmann A, Shanley B, Matsumoto I. Gene expression during ethanol withdrawal. Alcohol Alcohol. 1994;(Suppl. 2):97–102. [PubMed] [Google Scholar]
- Wilson JS, Korsten MA, Lieber CS. The combined effects of protein deficiency and chronic ethanol administration on rat ethanol metabolism. Hepatology. 1986;6:5823–829. doi: 10.1002/hep.1840060504. [DOI] [PubMed] [Google Scholar]
- Zhang B, Horvath S. A general framework for weighted gene co-expression network analysis. Stat Appl Genet Mol Biol. 2005;4 doi: 10.2202/1544-6115.1128. Article17. [DOI] [PubMed] [Google Scholar]
- Zhou Z, Yuan Q, Mash DC, Goldman D. Substance-specific and shared transcription and epigenetic changes in the human hippocampus chronically exposed to cocaine and alcohol. Proc Natl Acad Sci USA. 2011;108:166626–6631. doi: 10.1073/pnas.1018514108. [DOI] [PMC free article] [PubMed] [Google Scholar]
Associated Data
This section collects any data citations, data availability statements, or supplementary materials included in this article.


