

Abstract
Deamidation is a nonenzymatic post-translational modification of asparagine to aspartic acid or glutamine to glutamic acid, converting an uncharged amino acid to a negatively charged residue. It is plausible that deamidation of asparagine and glutamine residues would result in disruption of a proteins' hydrogen bonding network and thus lead to protein unfolding. To test this hypothesis Calmodulin and B2M were deamidated and analyzed using tandem mass spectrometry on a Fourier transform ion cyclotron resonance mass spectrometer (FTICR-MS). The gas phase hydrogen bonding networks of deamidated and nondeamidated protein isoforms were probed by varying the infra-red multi-photon dissociation laser power in a linear fashion and plotting the resulting electron capture dissociation fragment intensities as a melting curve at each amino acid residue. Analysis of the unfolding maps highlighted increased fragmentation at lower laser powers localized around heavily deamidated regions of the proteins. In addition fragment intensities were decreased across the rest of the proteins which we propose is because of the formation of salt-bridges strengthening the intramolecular interactions of the central regions. These results were supported by a computational flexibility analysis of the mutant and unmodified proteins, which would suggest that deamidation can affect the global structure of a protein via modification of the hydrogen bonding network near the deamidation site and that top down FTICR-MS is an appropriate technique for studying protein folding.
Keywords: protein, unfolding, deamidation, mass spectrometry
Introduction
Post-translational modification of proteins
A protein's function and binding site activity is determined by its global structure. The global structure is determined by the formation of several secondary structure characteristics such as α-helices and β-sheets. These, in turn, are determined by the amino acid sequence.1 In diseases involving pathological dysfunction of a protein, this dysfunction is often correlated with a mutation, commonly referred to as a single nucleotide polymorphism (SNP). SNPs change the encoding codon often changing the amino acid in a sequence and thus altering the proteins' structure.2 In addition to SNP mutation of DNA, proteins can also be altered post-translationally via a wide range of modifications to an existing amino acid sequence. Some common modifications are enzymatically driven and include additions such as prenylation to increase hydrophobicity for membrane localization,3 phosphorylation in cell signalling events,4 and sulfation.5 Whilst others are nonenzymatically driven and involve the alteration of one residue into another such as deamination6 (replacement of an imine =NH group with a ketone =O group via hydrolysis) and deamidation7 (replacement of an amine -NH2 group with a hydroxyl -OH group via hydrolysis). Identifying the sites and understanding the functional impact of various post-translational modifications (PTM) is important in better understanding both healthy and pathological protein function.
Deamidation
Deamidation is the post-translational conversion of asparagine to aspartic and isoaspartic acid (and glutamine to glutamic acid at rate approximately one order of magnitude slower) via hydrolysis involving a succinimide intermediate.8 Deamidation of asparagine occurs naturally in vivo on a timescale ranging from 1 second to centuries9 depending on steric factors in the residues local environment and is correlated with the age of a protein.10 Deamidation converts an uncharged side-chain residue into a negatively charged polar one and also in the case of isoaspartic Acid or γ-glutamic acid extends the length of the protein backbone by one or more carbon(s). Under physiological conditions asparagine is also able to donate two protons for the formation of hydrogen bonds, whereas aspartic acid can donate only one. This means it is possible that this PTM is capable of altering the structure and, therefore, function of a modified protein. In addition, the ease of triggering deamidation in vitro11 made it an appropriate choice for the use of topdown Fourier transform ion cyclotron resonance mass spectrometer (FTICR-MS) methods for elucidation of structural changes in native state proteins.12
Native protein structural characterization by mass spectrometry
Top-down analysis by electron capture dissociation (ECD) is a powerful tool for the sequencing of proteins and identification of various drug binding13 and PTM sites.14 The ECD fragmentation mechanism cleaves N-Cα bonds to produce mainly c and z. ions.15 In addition to being complementary to the b and y ions produced in collisionally activated dissociation (CAD),16 ECD generates odd electron intermediates that fragment by odd electron rules yielding low energy rearrangements17 (whereas CAD results in even electron fragments following different rules). With regards to proteins and protein complexes electrosprayed under nondenaturing conditions—where in many cases hydrogen bonding, secondary, tertiary, and even quaternary structure have retained the gas-phase on the timescale of a MS experiment18–20—the applications of ECD have thus far been relatively unexplored. Study of secondary structure by dissociation is possible because ECD fragmentation does not significantly disrupt the hydrogen bonding network (or other noncovalent interactions) surrounding a residue despite causing extensive backbone cleavage.21 With the hydrogen bonding network intact, the two complementary c and z. ion fragments remain entangled despite the backbone cleavage and thus are detected as one by the FTICR-MS. Additionally, native state proteins are, in general, more tightly folded than under denaturing conditions; therefore, fewer potential positive charge sites on lysine and arginine residues are accessible. Fewer accessible charge sites reduces the total charges in the charge state envelope of the studied protein which makes ECD more challenging as ECD cleavage has been demonstrated to be more efficient at higher charge states because of a higher charge density and thus a greater radius for electron capture.22 Although it is possible to artificially increase the charge state of a protein via supercharging with an additive such as sulfolane or glycerol,23 in some cases supercharging disrupts the native state of a protein and causes unfolding.24,25
Photoactivated unfolding ECD
It has been demonstrated that the lack of ECD fragmentation for native state proteins can be overcome via the use of several activation mechanisms26 in the FTICR cell. With black body irradiative dissociation (BIRD)27 the cell and vacuum system is uniformly heated to a specific temperature in order to emit a Boltzmann distribution of electro-magnetic (EM) radiation to which ions inside the cell thermally equilibrate provided they are within the rapid energy exhange limit.28 Infra-red multi-photon dissociation (IRMPD), using a CO2 laser, can also be used immediately prior to the ECD experiment to excite the ions enough to disrupt hydrogen bonds but not cause backbone fragmentation. These techniques drastically improve ECD fragment residue coverage for native state proteins.29 By modulating the power output of the IRMPD laser or the temperature of the cell with BIRD over several experiments it has also been demonstrated that it is possible to partially and incrementally disturb the hydrogen bonding network (as well as a range of other molecular interations) of a protein and thus generate a melting curve at each residue for which a fragment is detected.29 Here it is hypothesized that the abundance of fragments at a particular residue is related to the strength of the noncovalent interactions, including the hydrogen bonding network, at that position and that this method could be used to detect a structural change in a protein caused by a PTM such as deamidation.
Alternative methods for assessing protein structure via mass spectrometry
In addition to the temperature dependent unfolding method used here, there are several other ways to study protein structure and conformational changes via mass spectrometry. The most common of these is ion mobility mass spectrometry, in which ions are separated according to their rotationally averaged cross-sectional area by collision with an inert gas. Larger molecules experience a greater number of collisions than smaller ones and thus make slower progress. Ion mobility is excellent for determining whether multiple conformers are present in a variety of samples from small peptides to protein complexes. IMS provides some information on the magnitude of difference, but it provides no information on which specific regions of a protein are altered. Thus, IMS is a useful and relatively high-throughput method for identifying if a particular mutation or PTM has had a global effect on a protein and would thus be an appropriate target for more specific approaches.
The second method of using mass spectrometry to study protein structure is hydrogen deuterium exchange (HDX) mass spectrometry. There are several protocols for carrying out HDX,30,31 which involve placing the protein in question into deuterium-doped water or allowing the exchange to occur in the gas phase. From here the hydrogen atoms attached to the various side chains and back bone residues exchange with the deuterium atoms, increasing the effective mass of the protein (Deuterium has a mass of 2.014101 Da whilst Hydrogen has a mass of 1.007825 Da). Specifically the mass of a protein is increased in regions that are most accessible to the solvent and thus more readily exchanged (a combination of hydrophobicity and hydrogen bonding). The deuteration reaction is taken to a time point depending on the type of protein folding change probed. Long incubations over several days can be used to track rarely occurring large rearrangements whereas incubations of less than a second can be used to probe only the most accessible and readily exchanged hydrogens. Once this time point is reached, the reaction is quenched by lowering the pH of the solution to 2.5 and also dropping the temperature to 0°C, the combination of both lowers the rate of exchange by around 5 orders of magnitude.32
Such acidic conditions typically destroy any hydrogen bonding in the protein, essentially denaturing it; however, because the initial exchange took place under native conditions, useful information can be gathered by performing tandem mass spectrometry on the sample provided the experiment is completed quickly (within 1 hour whilst still under quench conditions). Until recently HDX MS has most commonly been used in conjunction with bottom-up digest techniques which does not allow for such rapid analysis. The advantages of being able to carry out HDX with a top-down approach with ECD is a developing and exciting area of research. The work discussed in this paper does not include IMS or HDX data but these experiments are currently ongoing.
Calmodulin and β-2-microglobulin
Calmodulin (CaM) is a calcium (Ca2+) binding protein that is ubiquitously expressed in all eukaryotic cells. Its role in vivo is in the regulation of various downstream target proteins via calcium sensing.33 Here, it is selected for its properties as an appropriate model protein as CaM is a moderately sized protein at 16.8 kDa and six of its 148 residues are asparagines. Several of these asparagine residues are also located close to the calcium binding sites of CaM of which there are four. CaM is dumbbell-shaped with two binding sites on each end linked by a flexible region34 which has been shown to undergo significant structural changes upon binding or chelation of calcium.35 These residues have also been shown to rapidly deamidate because of their both being adjacent to two Glycine residues and thus relatively solvent accessible; hence CaM has been used previously as a deamidation standard.36
β-2-microglobulin (β2M) is an amyloid protein involved in the major histocompatibility complex. It pathologically aggregates into fibrils during haemodialysis of patients with kidney failure because of insufficient clearance promoted by Cu3+ adduction.37 Here again, like CaM, it is selected for its properties as an appropriate model protein containing five asparagine residues over its 99 amino acid, 11.6 kD, sequence. In contrast to CaM which is predominantly alpha helical, β2Ms' secondary structure consists mostly of beta sheets.38
Modelling of the hydrogen bonding networks
When investigating subtle physical characteristics such as hydrogen bonding at various energy levels, it is useful to have a theoretical model against which to analyze the results. Rigidity analysis in the software FIRST is a rapid computational tool for inferring a hydrogen-bond network from a crystal structure and categorizing sections of the protein as being either rigid or flexible.39,40 Each hydrogen bond in the network is assigned a strength based on its geometry, calculated using the Mayo potential.41 Only those hydrogen bonds with strength less than an energy cutoff parameter, Ecut, are included in the bond network. When Ecut is systematically lowered, hydrogen bonds are removed in order from weakest to strongest and a transition is observed as the protein changes from being mostly rigid to mostly flexible. This is referred to as a rigidity dilution and the location and persistence of the rigid regions in such a dilution yields information about the function of the protein.42,43 Indeed, a rigidity dilution is a simulation of thermal denaturation,40,44 and as such is an ideal choice of theoretical method for comparison with temperature unfolding experiments. A key advantage of FIRST over more sophisticated computational approaches such as molecular dynamics is the speed of the algorithm, which allows the study of many crystal structures40,45 in tandem and large system sizes.42,46 The speed of the method facilitates our study of CaM and β2M in their wild type (WT) and deamidated forms.
Results and Discussion
Deamidation
Samples were deamidated for 1 week in 100 mM ammonium bicarbonate (pH 8.3) at 37°C. Alternative incubation times and solutions (10 mM Ammonium Acetate - pH 6.8 for 14–28 days and 1 mM NaOH - pH 11 for 24 hours) were compared with respect to deamidation extent, sample preparation time, and similarity to endogenous conditions. A diagnostic fragment ion c18 of β2M is shown prior to deamidation and post deamidation in the Supporting Information Figure S1. Because the proteins are initially in their native folded state and the asparagine residues may be relatively inaccessible to base catalyzed hydrolysis, little evidence of deamidation was seen after 2 weeks in 10 mM Ammonium Acetate. In 1 mM NaOH significant deamidation (3.95 Dalton parent ion mass shift corresponding to four deamidations of 0.986 Da and complete deamidation of Asp17 from the c18 β2M fragment) was detected after 24 hours incubation. 100 mM Ammonium Bicarbonate yielded similar levels of deamidation to 24 hours of 1 mM NaOH after 1 week and was selected because the moderate pH was expected to minimize solution-phase unfolding. Full deamidation of five of the six CaM asparagine residues and four of the five β2M asparagine residues were detected. In addition partial deamidation was detected at several terminal region Glutamine residues, on β2M Gln2 and Gln8 and on CaM Gln3 and Gln143. Because fragment coverage of the proteins was limited due to the native conditions, it was not possible to identify all of the deamidated residues. However, it was seen that in CaM, full deamidation occurred at Asn53 and Asn137. It is also likely that deamidation occurred at Asn60 and Asn93 as both of these residues are adjacent to two glycines making them solvent accessible.9 Finally, Asn42 deamidation could not occur because of its location next to Pro43. The ring structure of proline means that the base catalyzed hydrolysis reaction always results in cleavage of the peptide bond.47,48 In β2M full deamidation was observed at Asn17, Asn21, Asn24, and Asn82. A fragment covering Asn42 was not observed in the deamidated form. Incomplete deamidation of some Asparagine residues was expected because of steric hindrance effects of the 3D protein structure.9 It has also been noted that in CaM Asn60 and Asn93 deamidate rapidly in the absence of calcium36 (they are located in calcium binding regions) because of the adjacent glycine residues.7 An effort was made to chelate calcium from the CaM prior to these experiments in order to promote deamidation at these regions. However, it was noted that in all experiments an average of two calcium ions (of a possible four) were still bound to the CaM protein making some deamidation inhibition at these sites plausible. In addition to this despite a thorough de-salting protocol, an average of one sodium ion also remained bound to the protein increasing the possibility of salt bridge formation. It may have been possible to achieve more complete deamidation of both proteins on a shorter timescale by first denaturing them via incubation in methanol rather than an aqueous solution, but it was unknown whether the proteins would refold into a biologically relevant native structure thereafter.
ECD-IRMPD spectra
Figure 1(a,b) show examples of ECD-IRMPD spectra for CaM and β2M. Spectra were assigned as fully as possible to an average of less than 1 ppm error; Supporting Information Tables S1 and S2 contain a full list of assigned peaks for each protein. ECD fragment coverage for each protein is shown in Figures 1(c,d). For both proteins fragment coverage efficiency is around 50% even with the use of IRMPD to unfold the native proteins. The lower levels of residue cleavage efficiency reflect the low charge state, the “native” state of the precursor ions as well the requirement to keep the laser pulse duration below a level that it would cause fragmentation on its own. This means that the hydrogen bonds of the protein's core are likely to remain intact thus limiting coverage of the central region of each protein. β2M also possesses a disulfide bond between residues 25 and 75. The ring structure that this forms means that two electron capture and/or radical cascade fragmentation events are required to create any observable fragment ions, which substantially decreases the number of ECD fragments expected to be seen within this region. It is also reported that ECD cleavage preferentially occurs at disulfide bonds49 further compounding the issue, although the applicability of this cleavage preference appears to be sequence-dependent.50 It should be noted that some fragments are detected in this region between the two cysteine residues and that these fragments match up favourably with the residue flexibility measuring B-factor obtained via X-ray crystallography (Supporting Information Fig. S2). This has been noted before at terminal regions of a protein and solvent-exposed regions of protein complexes.51 Matching of fragments to regions with a high B-factor at the core of a protein here further supports the hypothesis that ECD fragmentation is linked to protein flexibility and noncovalent interactions.
Figure 1.
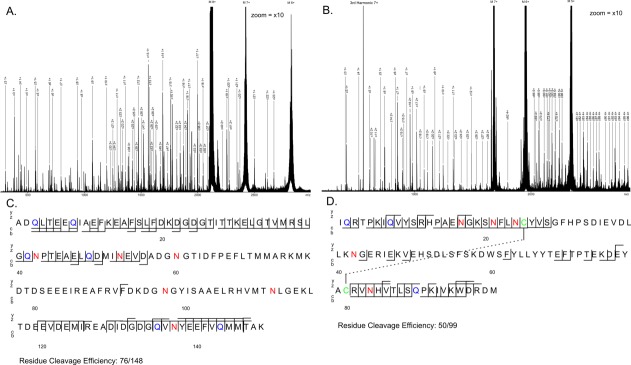
ECD-IRMPD spectra of (a) 8+ unmodified calmodulin, (b) 7+ unmodified β2M, and (c and d) corresponding cleavage coverage maps.
Temperature dependent unfolding maps
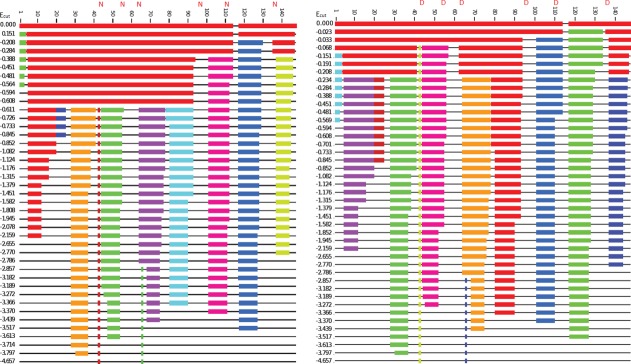
Figure 2 shows the temperature dependent unfolding maps generated for both modified and unmodified CaM, and Figure 3 does the same for β2M. First to be noted are the very clear trends for an increase in fragment intensity at each residue with increasing laser power as highlighted by the example fragment melting curves shown in Supporting Information Figure S3. This pattern fits with the hypothesis that the increase in ECD fragmentation observed by incorporating a prior IRMPD pulse is because of progressive breaking of hydrogen bonds. Resulting in a progressive shift of the ion population of the protein from one hydrogen bonding network configuration to another until all protein molecules in the ion cloud lack hydrogen bonding at a particular fragment and the fragment intensity thus stops increasing. It is also important to note that as the laser power increased there was an improvement in fragment coverage toward the interior of the protein. The improved ECD coverage at higher laser powers is seen clearly in Figures 2 and 3. Figures 4 and 5 show the laser power at which the rate of change of fragment intensity was the greatest which we define here as the “melting point” for each residue. Figures 4 and 5 show that the melting point for residues near the N or C termini is reached at relatively low laser powers (20–50%, 5–12.5 W) whilst those fragments more interior to the protein do so only at much higher laser powers (80–90%, 20–22.5 W) which we propose is because of the increased energy requirement of breaking a larger number of hydrogen bonds. Further improvement in the ECD fragment coverage could thus be achieved if it were possible to use longer irradiation times; however, any increase in pulse length beyond the durations described in the methods begin to cause IRMPD fragmentation at the protein termini. Beyond a certain irradiation time IRMPD fragmentation quickly impacts the parent ion intensity enough to negatively affect the quality of the obtainable ECD spectrum, in addition to confusing the interpretation of that spectrum. The specific intensities of each ECD fragment follows a reproducible pattern unique to each protein and its condition (deamidated/ nondeamidated). Which appears to be related to a convolution of several different factors—proximity to a lysine or arginine residue, the backbone hydrogen bonding environment, and the hydrophobicity or solvent accessibility.
Figure 2.
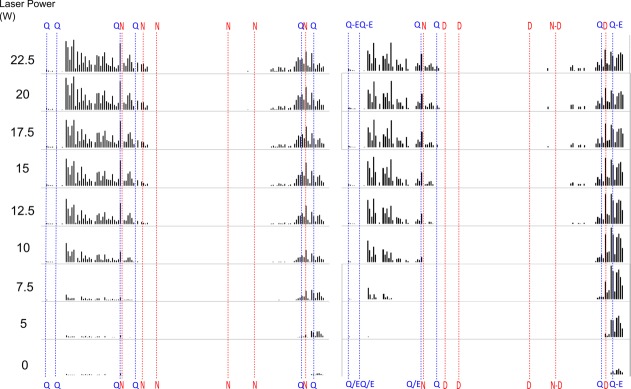
Photo-activated unfolding map of unmodified (left) and deamidated (right) 8+ calmodulin plotting normalized ECD-IRMPD fragment intensities at various levels of laser power. Asparagine deamidation and glutamine partial deamidation sites are highlighted across the entire sequence. Q-E and N-D represent partial deamidations.
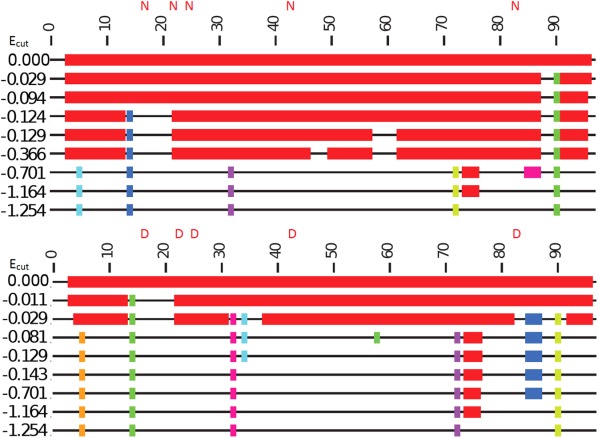
Figure 3.

Photo-activated unfolding map of unmodified (left) and deamidated (right) 7+ β2M plotting normalized ECD-IRMPD fragment intensities at various levels of laser power. Asparagine deamidation and glutamine partial deamidation sites are highlighted across the entire sequence along with disulphide bond location. Q-E and N-D represent partial deamidations.
Figure 4.
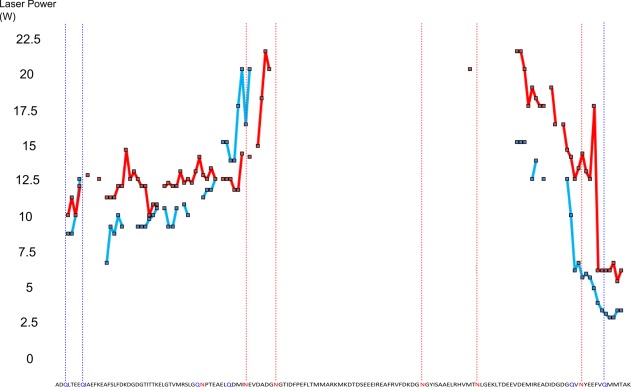
Plotting laser power required to cause maximum rate of change of ECD fragment intensities (melting point) for unmodified (red) and deamidated (blue) calmodulin. Highlighted sequence letters show possible deamidation sites and disulphide bonds, vertical hashed lines show sites at which at least partial deamidation occurs.
Figure 5.
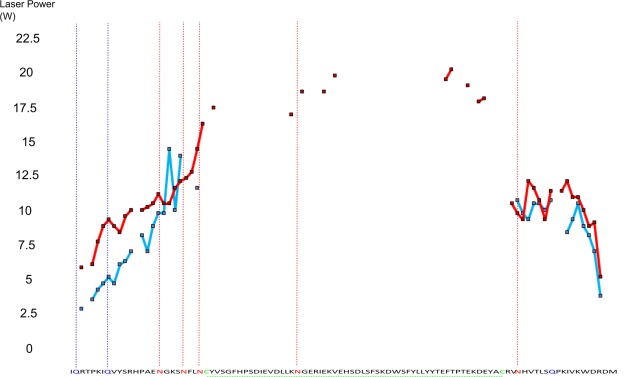
Laser power required to cause maximum rate of change of ECD fragment intensities (melting point) for unmodified (red) and deamidated (blue) β2M. Highlighted sequence letters show possible deamidation sites and disulphide bonds, vertical hashed lines show sites at which at least partial deamidation occurs.
When comparing deamidated and nondeamidated protein versions for both CaM and β2M, it is apparent that the fragmentation pattern is altered across the sequence. As previously noted, the ECD fragmentation pattern is consistent given a particular tuning; therefore, the deamidated protein has refolded to yield a distinct pattern of fragments. Figures 4 and 5 show more clearly that for the deamidated proteins several regions of ECD fragments localized around deamidation sites reach their melting point at a significantly lower laser power than the nondeamidated proteins (CaM N-terminal region residues 1–60 with four observed deamidation sites: average melting point 12.95 W wildtype vs. 11.55 W deamidated. C-terminal region residues 110–149 with three observed deamidation sites: average melting point 14.20 W wildtype vs. 7.80 W deamidated. B2M N-terminal region residues 1–24 with five observed deamidation sites: average melting point 10.40 W wildtype vs. 7.65 W deamidated. C-terminal region residues with one observed deamidation site: average melting point 9.90 W wildtype vs. 8.65 W deamidated). Reaching the melting points at lower laser powers is especially apparent near the terminal regions of the proteins whilst for fragments interior to the protein the difference between the deamidated and native protein diminishes. This difference could be explained by the addition of several negative charge sites on the proteins via deamidation resulting in the formation of salt bridges which may be contributing to protein stability in addition to the hydrogen bonding network. The presence of salt bridges is also supported by the overall slight decrease in fragment intensity and fragment coverage seen in the deamidated proteins. A decrease in intensity and fragment coverage towards the interior of the protein could also be because of the increased peak splitting effect of multiple deamidations decreasing the signal:noise of central fragments below threshold. Both the flexibility analysis modelling (Figs. 6 and 7), and the melting curve plots (Figs. 4 and 5), suggest that a number of hydrogen bonds have been broken as a result of the deamidation process. As full deamidation of the proteins could not be achieved in under native conditions on a reasonable timescale (after 28 days @ pH 6.8, deamidation was significantly lower than after 24 hours @ pH 11 and 1 week @ pH 8.3) it cannot be determined whether the changes observed were due in part to the alkaline conditions of the incubation.
Figure 6.
Rigid cluster analysis simulation plots of unmodified calmodulin (left) and deamidated (right). Thick colored lines represent regions where hydrogen bonds are intact at a particular Ecut value. Increasing Ecut energy values (descending) results in fewer intact hydrogen bonds. The different colors here serve only to differentiate groups of hydrogen bonds involved in each of the proteins alpha helices. Comparing left to right several regions from residues 40–60 and 100–135 in the deamidated form were seen to have less hydrogen bonding at the same Ecut energy.
Figure 7.
Rigid cluster analysis simulation plots of unmodified β2M (left) and deamidated (right).
Rigidity analysis modelling
Figures 6 and 7 show the results of the rigidity analysis modelling for CaM and β2M, respectively. The top line of each plot shows the protein with all hydrogen bonds present, and the protein is therefore almost entirely rigid. Moving down the plots, the protein gradually becomes more flexible because hydrogen bonds are being removed. The pattern of rigidity loss can be either sudden (first order) or gradual (second order). CaM exhibits second-order rigidity loss, which is expected for a mostly alpha-helix structure, and β2M exhibits first-order rigidity loss, which is expected for a mostly beta-sheet structure.52 The rigid region colored red in each line of each plot represents the largest rigid cluster in each RCD. In Figure 6, we see this goes from encompassing 110 residues of CaM to 13 residues. In the deamidated CaM protein the decrease in the size of the largest rigid cluster occurs at Ecut = −0.234 kcal/mol, whereas in WT CaM, a comparable level of change happens at Ecut = −0.611 kcal/mol. The lower value of Ecut in WT means that the rigidity is preserved to higher energies (i.e. suggests that there are more hydrogen bonds in the WT form than in deamidated). The difference in Ecut values between modified and WT proteins is also seen in Figure 7 with the plots for B2M. Here the first order rigidity transition occurs at Ecut = −0.701 kcal/mol in the WT and at Ecut = −0.081 kcal/mol in the deamidated protein. Again, the lower Ecut value for the transition in the WT suggests a denser/ stronger hydrogen bond network compared to the deamidated.
Materials and Methods
Materials
Bovine CaMCaM, β2M, ammonium acetate (CH3COONH4) formic acid (CH2O2) and ammonium bicarbonate (NH4HCO3) were purchased from Sigma (St. Louis, MO).
Preparation and deamidation of CaM and β2M
Aqueous solutions of CaM and β2M (25 µM) were prepared in a solution of 100 mM ammonium bicarbonate and incubated at 37°C for 1 week. For buffer exchange and desalting amicon filters (MW cut off = 10 kDa, Millipore, Watford, UK) were used at 13,000 rpm for 20 min at room temperature over three spin cycles with deionized water as a wash before being reconstituted in 10 mM aqueous ammonium acetate at a concentration of 2.5 µM. A similar desalting protocol was carried out for the nondeamidated protein versions. All samples were stored at −20°C until required.
FTICR mass spectrometry
Nano-electrospray (nanoESI) mass spectrometry was performed on a Bruker solariX FTICR mass spectrometer with a 12 T actively shielded magnet. A home built nanoESI source was used with custom pulled glass capillaries having an average tip diameter of 1 µm and a flow rate at 1000 V of approximately 2 µL / hour in aqueous solution. Typically 10 µL of sample was used per experiment. For each protein, the applied voltages for the numerous ion optics and cell parameters were tuned for maximal signal amplitude and peak shape quality. A full list of these values can be found in the Supporting Information Table S3. Full spectra for both proteins were internally calibrated using the b and y ion series of the nondeamidated proteins. Full tables of assignments for both proteins are located in the Supporting Information Tables S1 and S2.
Photoactivated unfolding ECD experiment
For the photoactivated unfolding experiments the 8+ CaM and 7+ β2M parent ions, which were the most abundant, were isolated in the quadrupole with a selection window of 50 m/z before being externally accumulated in the collision cell for 2 seconds. After being transferred to the Infinity cell,53 a custom pulse program was used to irradiate the ions with 1.2 eV electrons from a heated hollow cathode dispenser for 150 ms and 10.6 µm wavelength photons from a 25 W CO2 infrared laser for 65 ms with the electron gun pulse immediately following the laser pulse. The duration and power of the IRMPD laser excitation was tuned such that, at the highest intensity, it did not cause fragmentation on its own but that any pulse length longer would do so. For the photo activated experiment itself, the intensity of the laser was varied from 0% to 90% of its potential 25 W power in 10% increments to allow the generation of CaM and β2Ms noncovalent interaction melting curves at each amino acid that an ECD fragment was detected.
Rigidity analysis modelling
The PDB structures 1PRW54 and 1LDS55 were used to generate rigidity dilution plots for CaM and β2M, respectively. Deamidated mutants of these structures were created manually in PYMOL (http://www.pymol.org). The REDUCE software56 was used to add hydrogen atoms to the crystal structures, and to flip Asn, Gln, and His sidechains where necessary in order to avoid steric clashes and improve the hydrogen bond network. The pebble game algorithm in FIRST39,40 was used to generate a decomposition of the protein into rigid and flexible regions. Such a decomposition is known as a rigid cluster decomposition (RCD),45,52 and is dependent upon Ecut. As Ecut is systematically lowered, the RCD for the protein is recalculated. In a rigidity dilution plot, each residue is represented as being either rigid or flexible according to the rigidity of it alpha-carbon atom. Whenever the RCD changes, the backbone of the protein is printed with rigid residues shown as thick colored blocks and flexible residues as thin black lines. Mutually rigid residues are shown in the same color.
Conclusions
It has been demonstrated that IRMPD is a suitable alternative to BIRD for top down FTICR-MS protein unfolding studies. Although the exact energy input cannot be as easily quantified as with BIRD at a known temperature because of unknown transmission efficiency of the laser and overlap with the ion cloud, the melting curves produced are reproducible. Gas-phase retention of protein secondary and possibly tertiary structure over the timescale of an ICR experiment (approximately 3 seconds) has also been demonstrated, further supporting published results from other research groups.57 ECD fragments detected in-between the disulphide bond of B2M were shown to coincide with regions possessing a high B-factor from x-ray crystallography data similarly to previous findings.51 Partial glutamine deamidation and its possible relevance to structural changes was also demonstrated. The unfolding analysis showed increased fragment intensity at lower levels of laser power in heavily deamidated regions of both proteins. In addition, overall decreases in fragment intensity and coverage in regions not local to deamidation sites in which no change would normally be expeced to be seen could correspond to the formation of salt bridges by the additional negatively charged residues. The experimental results are supported by the theoretical flexibility analysis which suggests that deamidation should indeed decrease the number of hydrogen bonds present in both studied proteins and that specifically regions adjacent to deamidated asparagines should become more flexible. Taken as a combination these results support the hypothesis that deamidation is capable of subtly altering protein structure, and possibly function, and that top-down photo activated unfolding ECD MS is an appropriate tool to study structural impact of post-translational modifications.
Acknowledgments
The authors would like to thank Dr. Huilin Li, Dr. Andrea Lopez-Clavijo, Dr. David Kilgour, Dr. Pilar Perez-Hurtado, Dr. Rebecca Wills, Dr. Juan Wei, and Mr. Chris Wootton for their helpful comments and suggestions. Funding is gratefully acknowledged from the EPSRC MOAC doctoral training center (EP/F500378/1) and EPSRC grant (EP/J000302/1),
Supporting Information
Additional Supporting Information may be found in the online version of this article.
Supporting Information
References
- Berg JM, Tymoczko JL, Stryer L. 2002. ) Biochemistry [VOL:PAGE #S]
- Sachidanandam R, Weissman D, Schmidt SC. A map of human genome sequence variation containing 1.42 million single nucleotide polymorphisms. Nature. 2001;409:928–933. doi: 10.1038/35057149. [DOI] [PubMed] [Google Scholar]
- Zhang FL, Casey PJ. Protein prenylation: molecular mechanisms and functional consequences. Annu Rev Biochem. 1996;65:241–269. doi: 10.1146/annurev.bi.65.070196.001325. [DOI] [PubMed] [Google Scholar]
- Krebs EG, Beavo JA. Phosphorylation-dephosphorylation of enzymes. Annu Rev Biochem. 1979;48:923–959. doi: 10.1146/annurev.bi.48.070179.004423. [DOI] [PubMed] [Google Scholar]
- Moore KL. The biology and enzymology of protein tyrosine O-sulfation. J Biol Chem. 2003;278:24243–24246. doi: 10.1074/jbc.R300008200. [DOI] [PubMed] [Google Scholar]
- Cuthbert GL, Daujat S, Snowden AW, Erdjument-Bromage H, Hagiwara T, Yamada M, Schneider R, Gregory PD, Tempst P, Bannister AJ, Kouzarides T. Histone deimination antagonizes arginine methylation. Cell. 2004;118:545–553. doi: 10.1016/j.cell.2004.08.020. [DOI] [PubMed] [Google Scholar]
- Robinson AB, McKerrow JH, Cary P. Controlled deamidation of peptides and proteins: An experimental hazard and a possible biological timer. Proc Natl Acad Sci USA. 1970;66:753–757. doi: 10.1073/pnas.66.3.753. [DOI] [PMC free article] [PubMed] [Google Scholar]
- Stephenson RC, Clarke S. Succinimide formation from aspartyl and asparaginyl peptides as a model for the spontaneous degradation of proteins. J Biol Chem. 1989;264:6164–6170. [PubMed] [Google Scholar]
- Robinson NE, Robinson AB. Molecular clocks. Proc Natl Acad Sci USA. 2001;98:944–949. doi: 10.1073/pnas.98.3.944. [DOI] [PMC free article] [PubMed] [Google Scholar]
- Robinson NE, Robinson ZW. Structure-dependent nonenzymatic deamidation of glutaminyl and asparaginyl pentapeptides. J Pept Res. 2004;63:426–436. doi: 10.1111/j.1399-3011.2004.00151.x. [DOI] [PubMed] [Google Scholar]
- Geiger T, Clarke S. Deamidation, isomerization, and racemization at asparaginyl and aspartyl residues in peptides. Succinimide-linked reactions that contribute to protein degradation. J Biol Chem. 1987;262:785–794. [PubMed] [Google Scholar]
- Li X, Cournoyer JJ, Lin C, O'Connor PB. Use of 18 O labels to monitor deamidation during protein and peptide sample processing. J Am Soc Mass Spectrom. 2008;19:855–864. doi: 10.1016/j.jasms.2008.02.011. [DOI] [PMC free article] [PubMed] [Google Scholar]
- Huilin L, O'Connor PB. Mass spectrometry evidence for cisplatin as a protein cross-linking reagent. Anal Chem. 2011;83:5369–5376. doi: 10.1021/ac200861k. [DOI] [PMC free article] [PubMed] [Google Scholar]
- Hurtado Pilar Perez OPB. Deamidation of collagen. Anal Chem. 2012;84:3017–3025. doi: 10.1021/ac202980z. [DOI] [PubMed] [Google Scholar]
- Zubarev RA, Horn DM, McLafferty FW. Electron capture dissociation of multiply charged peptide cations. Int J Mass Spectrom. 1999;185–187:787–793. [Google Scholar]
- McLafferty FW, Horn DM, Breuker K, Ge Y. Electron capture dissociation of gaseous multiply charged ions by Fourier-transform ion cyclotron resonance. J Am Soc Mass Spectrom. 2001;12:245–249. doi: 10.1016/S1044-0305(00)00223-3. [DOI] [PubMed] [Google Scholar]
- Moss CL, Turecek F. Protonation sites in peptide dications and cation-radicals containing β-amino acid residues. Int J Mass Spectrom. 2012;316–318:57–67. [Google Scholar]
- Breuker K, McLafferty FW. Stepwise evolution of protein native structure with electrospray into the gas phase, 10−12 to 102 s. Proc Natl Acad Sci USA. 2008;105:18145–18152. doi: 10.1073/pnas.0807005105. [DOI] [PMC free article] [PubMed] [Google Scholar]
- Bereszczak JZ, Barbu IM, Tan M, Xia M, Jiang X, van Duijn E, Heck AJR. Structure, stability and dynamics of norovirus P domain derived protein complexes studied by native mass spectrometry. J Struct Biol. 2012;177:273–282. doi: 10.1016/j.jsb.2012.01.005. [DOI] [PubMed] [Google Scholar]
- Hewitt D, Marklund E, Scott DJ, Robinson CV, Borysik AJ. A hydrodynamic comparison of solution and gas phase proteins and their complexes. J Phys Chem B. 2014;118:8489–8495. doi: 10.1021/jp501950d. [DOI] [PubMed] [Google Scholar]
- Zhang H, Cui W, Wen J, Blankenship RE, Gross ML. Native electrospray and electron-capture dissociation in FTICR mass spectrometry provide top-down sequencing of a protein component in an intact protein assembly. J Am Soc Mass Spectrom. 2010;21:1966–1968. doi: 10.1016/j.jasms.2010.08.006. [DOI] [PMC free article] [PubMed] [Google Scholar]
- Yin S, Loo JA. Top-down mass spectrometry of supercharged native protein-ligand complexes. Int J Mass Spectrom. 2011;300:118–122. doi: 10.1016/j.ijms.2010.06.032. [DOI] [PMC free article] [PubMed] [Google Scholar]
- Iavarone AT, Jurchen JC, Williams ER. Supercharged protein and peptide ions formed by electrospray ionization. Anal Chem. 2001;73:1455–1460. doi: 10.1021/ac001251t. [DOI] [PMC free article] [PubMed] [Google Scholar]
- Sterling HJ, Daly MP, Feld GK, Thoren KL, Kintzer AF, Krantz BA, Williams ER. Effects of supercharging reagents on noncovalent complex structure in electrospray ionization from aqueous solutions. J Am Soc Mass Spectrom. 2010;21:1762–1774. doi: 10.1016/j.jasms.2010.06.012. [DOI] [PMC free article] [PubMed] [Google Scholar]
- Sterling HJ, Prell JS, Cassou CA, Williams ER. Protein conformation and supercharging with DMSO from aqueous solution. J Am Soc Mass Spectrom. 2011;22:1178–1186. doi: 10.1007/s13361-011-0116-x. [DOI] [PMC free article] [PubMed] [Google Scholar]
- Ge Y, Horn DM, McLafferty FW. Blackbody infrared radiative dissociation of larger (42 kDa) multiply charged proteins. Int J Mass Spectrom. 2001;210:203–214. [Google Scholar]
- Price WD, Schnier PD, Williams ER. Tandem mass spectrometry of large biomolecule ions by blackbody infrared radiative dissociation. Anal Chem. 1996;68:859–866. doi: 10.1021/ac951038a. [DOI] [PubMed] [Google Scholar]
- Price WD, Williams ER. Activation of Peptide ions by blackbody radiation: Factors that lead to dissociation kinetics in the rapid energy exchange limit. J Phys Chem A. 1997;101:8844–8852. doi: 10.1021/jp9722418. [DOI] [PMC free article] [PubMed] [Google Scholar]
- Breuker K, McLafferty FW. Native electron capture dissociation for the structural characterization of noncovalent interactions in native cytochrome c. Angew Chem Int Ed. 2003;42:4900–4904. doi: 10.1002/anie.200351705. [DOI] [PubMed] [Google Scholar]
- Pan J, Han J, Borchers CH, Konermann L. Hydrogen/deuterium exchange mass spectrometry with top-down electron capture dissociation for characterizing structural transitions of a 17 kDa protein. J Am Chem Soc. 2009;131:12801–12808. doi: 10.1021/ja904379w. [DOI] [PubMed] [Google Scholar]
- Zhang Y, Rempel DL, Zhang J, Sharma AK, Mirica LM, Gross ML. Pulsed hydrogen–deuterium exchange mass spectrometry probes conformational changes in amyloid beta (Aβ) peptide aggregation. Proc Natl Acad Sci USA. 2013;110:14604–14609. doi: 10.1073/pnas.1309175110. [DOI] [PMC free article] [PubMed] [Google Scholar]
- Engen JR. Analysis of protein conformation and dynamics by hydrogen/deuterium exchange MS. Anal Chem. 2009;81:7870–7875. doi: 10.1021/ac901154s. [DOI] [PMC free article] [PubMed] [Google Scholar]
- Means ARDJR. Calmodulin-an intracellular calcium receptor. Nature. 1980;285:73–77. doi: 10.1038/285073a0. [DOI] [PubMed] [Google Scholar]
- Babu YS, Sack JS, Greenhough TJ, Bugg CE. Three-dimensional structure of calmodulin. Nature. 1984;315:37–40. doi: 10.1038/315037a0. [DOI] [PubMed] [Google Scholar]
- Zhang M, Tanaka T, Ikura M. Calcium-induced conformational transition revealed by the solution structure of apo Calmodulin. Nature Struct Mol Biol. 1995;2:758. doi: 10.1038/nsb0995-758. [DOI] [PubMed] [Google Scholar]
- Johnson BA, Shirokawa JM, Aswad DW. Deamidation of calmodulin at neutral and alkaline pH: Quantitative relationships between ammonia loss and the susceptibility of calmodulin to modification by protein carboxyl methyltransferase. Arch Biochem Biophys. 1989;268:276–286. doi: 10.1016/0003-9861(89)90589-4. [DOI] [PubMed] [Google Scholar]
- T Miyata OORIYINANYSHNTKMTK. beta 2-Microglobulin modified with advanced glycation end products is a major component of hemodialysis-associated amyloidosis. J Clin Invest. 1993;92:1243. doi: 10.1172/JCI116696. [DOI] [PMC free article] [PubMed] [Google Scholar]
- Becker JW, Reeke GN. Three-dimensional structure of beta 2-microglobulin. Proc Natl Acad Sci USA. 1985;82:4225–4229. doi: 10.1073/pnas.82.12.4225. [DOI] [PMC free article] [PubMed] [Google Scholar]
- Jacobs DJ, Thorpe MF. Generic rigidity percolation: The pebble game. PRL. 1995;75:4051–4054. doi: 10.1103/PhysRevLett.75.4051. [DOI] [PubMed] [Google Scholar]
- Jacobs DJ, Rader AJ, Kuhn LA, Thorpe MF. Protein flexibility predictions using graph theory. Prot Struct Funct Genet. 2001;44:150–165. doi: 10.1002/prot.1081. [DOI] [PubMed] [Google Scholar]
- Dahiyat BI, Gordon DB, Mayo SL. Automated design of the surface positions of protein helices. Protein Sci. 1997;6:1333–1337. doi: 10.1002/pro.5560060622. [DOI] [PMC free article] [PubMed] [Google Scholar]
- Rader AJ, Anderson G, Isin B, Khorana HG, Bahar I, Klein-Seetharaman J. Identification of core amino acids stabilizing rhodopsin. Proc Natl Acad Sci USA. 2004;101:7246–7252. doi: 10.1073/pnas.0401429101. [DOI] [PMC free article] [PubMed] [Google Scholar]
- Rader AJ. Thermostability in rubredoxin and its relationship to mechanical rigidity. Phys Biol. 2010:16002. doi: 10.1088/1478-3975/7/1/016002. [DOI] [PubMed] [Google Scholar]
- Rader AJ, Hespenheide BM, Kuhn LA, Thorpe MF. Protein unfolding: Rigidity lost. Proc Natl Acad Sci USA. 1999;99:3540–3545. doi: 10.1073/pnas.062492699. [DOI] [PMC free article] [PubMed] [Google Scholar]
- Heal JW, Jimenez-Roldan JE, Wells SA, Freedman RB, R″omer RA. Inhibition of HIV-1 protease: The rigidity perspective. Bioinformatics. 2012;28:350–357. doi: 10.1093/bioinformatics/btr683. [DOI] [PubMed] [Google Scholar]
- Wang Y, Rader AJ, Bahar I, Jernigan RL. Global ribosome motions revealed with elastic network model. J Struct Biol. 2004;147:302–314. doi: 10.1016/j.jsb.2004.01.005. [DOI] [PubMed] [Google Scholar]
- Zubarev RA. Electron-capture dissociation tandem mass spectrometry. Curr Opin Biotechnol. 2004;15:12–16. doi: 10.1016/j.copbio.2003.12.002. [DOI] [PubMed] [Google Scholar]
- Tarelli E, Corran PH. Ammonia cleaves polypeptides at asparagine proline bonds. J Pept Res. 2003;62:245–251. doi: 10.1046/j.1399-3011.2003.00089.x. [DOI] [PubMed] [Google Scholar]
- Zubarev RA, Kruger NA, Fridriksson EK, Lewis MA, Horn DM, Carpenter BK, McLafferty FW. Electron capture dissociation of gaseous multiply-charged proteins is favored at disulfide bonds and other sites of high hydrogen atom affinity. J Am Chem Soc. 1999;121:2857–2862. [Google Scholar]
- Ganisl B, Breuker K. Does electron capture dissociation cleave protein disulfide bonds? ChemistryOpen. 2012 doi: 10.1002/open.201200038. [Internet] 1. Available from: http://www.ncbi.nlm.nih.gov/pubmed/24363980. [DOI] [PMC free article] [PubMed] [Google Scholar]
- Zhang H, Cui W, Wen J, Blankenship RE, Gross ML. Native electrospray and electron-capture dissociation FTICR mass spectrometry for top-down studies of protein assemblies. Anal Chem. 2011;83:5598–5606. doi: 10.1021/ac200695d. [DOI] [PMC free article] [PubMed] [Google Scholar]
- Wells SA, Jimenez-Roldan JE, Römer RA. Comparative analysis of rigidity across protein families. Phys Biol. 2009;6:46005–46011. doi: 10.1088/1478-3975/6/4/046005. [DOI] [PubMed] [Google Scholar]
- Caravatti P, Allemann M. The infinity cell: A new trapped-ion cell with radiofrequency covered trapping electrodes for fourier transform ion cyclotron resonance mass spectrometry. Org Mass Spectrom. 1991;26:514–518. [Google Scholar]
- Fallon JL, Quiocho FA. A closed compact structure of native Ca2+-calmodulin. Structure. 2003;11:1303–1307. doi: 10.1016/j.str.2003.09.004. [DOI] [PubMed] [Google Scholar]
- Trinh CH, Smith DP, Kalverda AP, Phillips SEV, Radford SE. Crystal structure of monomeric human beta-2-microglobulin reveals clues to its amyloidogenic properties. Proc Natl Acad Sci USA. 2002;99:9771–9776. doi: 10.1073/pnas.152337399. [DOI] [PMC free article] [PubMed] [Google Scholar]
- Word JM, Lovell SC, Richardson JS, Richardson DC. Asparagine and glutamine: Using hydrogen atoms contacts in the choice of side-chain amide orientation. J Mol Biol. 1999;285:1735–1747. doi: 10.1006/jmbi.1998.2401. [DOI] [PubMed] [Google Scholar]
- Skinner OS, McLafferty FW, Breuker K. How ubiquitin unfolds after transfer into the gas phase. J Am Soc Mass Spectrom. 2012;23:1011–1014. doi: 10.1007/s13361-012-0370-6. [DOI] [PMC free article] [PubMed] [Google Scholar]
Associated Data
This section collects any data citations, data availability statements, or supplementary materials included in this article.
Supplementary Materials
Supporting Information