Abstract
Since introns were discovered 26 years ago, people have wondered how changes in intron/exon structure occur, and what role these changes play in evolution. To answer these questions, we have begun studying gene structure in nematodes related to Caenorhabditis elegans. As a first step, we cloned a set of five genes from six different Caenorhabditis species, and used their amino acid sequences to construct the first detailed phylogeny of this genus. Our data indicate that nematode introns are lost at a very high rate during evolution, almost 400-fold higher than in mammals. These losses do not occur randomly, but instead, favor some introns and do not affect others. In contrast, intron gains are far less common than losses in these genes. On the basis of the sequences at each intron site, we suggest that several distinct mechanisms can cause introns to be lost. The small size of C. elegans introns should increase the rate at which each of these types of loss can occur, and might account for the dramatic difference in loss rate between nematodes and mammals.
Soon after the discovery of introns, Gilbert (1978) realized that they could speed up the origin of new genes during evolution. He reasoned that introns are often much longer than exons, and thus should increase the rate of homologous recombination within genes. In addition, imprecise recombination involving introns would allow “exon shuffling”—the creation of new genes from pieces of several pre-existing ones. Soon afterward, Doolittle (1978) suggested that exon shuffling might have been responsible for the origin of many genes in the period prior to the divergence of prokaryotes and eukaryotes. He explained the absence of introns in present-day prokaryotes as a result of a “streamlining” process caused by the pressure for fast genome replication. Finally, Blake (1978) noted that this model implied that exons should correspond to units of protein structure, or domains, which would be required for the combinatorial assembly of new genes. Taken together, these ideas defined the “introns-early” theory of gene evolution—introns date to the origin of many eukaryotic genes and were instrumental in their creation.
Cavalier-Smith (1978, 1985, 1991) strongly disagreed with these arguments. On the basis of the unique functions and requirements of the eukaryotic nucleus, as well as on phylogenetic considerations, he suggested that the original genes were uninterrupted, like those in present-day bacteria, and that introns were inserted into them during the course of eukaryotic evolution. Since then, several papers have documented the recent insertion of introns into genes, which strongly supports this theory (e.g., Giroux et al. 1994; Hankeln et al. 1997). However, one of the primary pieces of evidence for the introns-late theory—the observation that introns were absent from basal groups of eukaryotes, and thus, must have been created later during eukaryotic evolution (Logsdon Jr. 1998)—now appears to be wrong (Nixon et al. 2002).
Although the introns-early/introns-late debate still continues, a synthesis that combines both theories is becoming prominent (Gilbert et al. 1997; de Souza 2003). This “synthetic theory” of intron evolution emerged from evidence showing that a subset of present-day introns might have ancient origins, and that these ancient introns have a biased distribution in eukaryotic genes. For example, in genes conserved between prokaryotes and eukaryotes, there is a large excess of phase 0 introns (which break between two codons) over what one would expect by chance (Long et al. 1995). Furthermore, there is a small, but significant excess of symmetric exons—ones whose flanking introns have the same phase number (Long et al. 1995). Both of these traits are predicted by the hypothesis that symmetric exons of phase 0 were originally required to allow exon shuffling. Most importantly, these ancient introns seem to be located more frequently at the boundaries of units of protein tertiary structure than within units of tertiary structure (de Souza et al. 1996, 1997, 1998; Roy et al. 1999; Fedorov et al. 2001). Because these characteristics apply only to genes whose origin predates the divergence of prokaryotes and eukaryotes, the synthetic theory proposes that a subset of present-day phase 0 introns are ancient, and that these introns are associated with protein modules that were assembled into the first genes by exon shuffling (de Souza 2003). Most other introns, especially those in phase 1 or phase 2, arose later during eukaryotic evolution.
An important effect of this debate is that most research has focused on dating the first appearance of introns during evolution, thereby drawing attention away from the host of micro-evolutionary and mechanistic questions that introns pose. For example, how frequently are introns gained or lost during recent evolution, and what consequences do these events have? What mechanisms are responsible for the loss of some introns and the acquisition of others? And, are these processes universal, or do they vary from one group of eukaryotes to another?
How Are Introns Lost or Gained?
The most popular model to explain how introns are lost involves homologous recombination between the genomic copy of a gene and an intronless cDNA copy produced by reverse transcription (Fink 1987; Long and Langley 1993). Because retrotransposons can reverse-transcribe the cell's own mRNA, the required cDNA templates are expected to be present in eukaryotic cells (Esnault et al. 2000). Furthermore, Derr (1998) showed that a cDNA could recombine with its corresponding gene, resulting in intron loss. However, other researchers have suggested that the loss of introns most often occurs by a simple deletion, caused by imprecise recombination (e.g., Robertson 1998).
The most common mechanisms proposed to explain intron gain are the insertion of mobile genetic elements that contain splicing signals into a gene (Giroux et al. 1994), “reverse splicing” (Bonen and Vogel 2001), or recombination between homologous copies of a gene (Venkatesh et al. 1999). Finally, recent work indicates that some introns might be created by the activation of new splice sites in a degenerate coding region (Wang et al. 2004).
Gene Structure in C. elegans
In Caenorhabditis elegans, splicing occurs much as in other animals. However, it has a few unusual aspects that are peculiar to nematodes. First, introns in C. elegans tend to be much shorter than those in vertebrates, or even in the yeast Saccharomyces cerevisiae. More than half of all C. elegans introns are shorter than 60 nucleotides (Blumenthal and Steward 1997), which is too small for splicing in vertebrates (Ogg et al. 1990). However, the C. elegans splicing machinery retains the ability to splice very long introns (Starich et al. 1993), and long introns are occasionally found in nematode genes. Second, although C. elegans introns obey the GU-AG rule (almost all eukaryotic introns have a GU at the 5′ end and an AG at the 3′ end), they use an extended 3′ splice site, UUUCAG; Blumenthal and Steward 1997). Third, nematodes also use trans-splicing, in which a short leader sequence, the spliced leader (SL), is attached to the 5′ end of many mRNAs (Krause and Hirsh 1987; Davis 1993). Finally, genes located in a cluster with the same 5′ to 3′ orientations are often transcribed together as an operon, and each message is separated from the others by trans-splicing (Spieth et al. 1993). These unique features might allow these animals to develop some nematode-specific ways of constructing and altering genomes.
To learn how intron/exon structure changes during evolution, we compared genomic and cDNA sequences for fog-3 and the CPEB genes fog-1, cpb-1, cpb-2, and cpb-3 from several species in the genus Caenorhabditis. These comparisons elucidiate the recent history of each intron. Furthermore, because the four CPEB genes we studied were formed by earlier duplication events, comparisons between them reveal information about ancient changes in intron structure.
RESULTS
Each Caenorhabditis Species Has Four CPEB Genes and One FOG-3 Gene
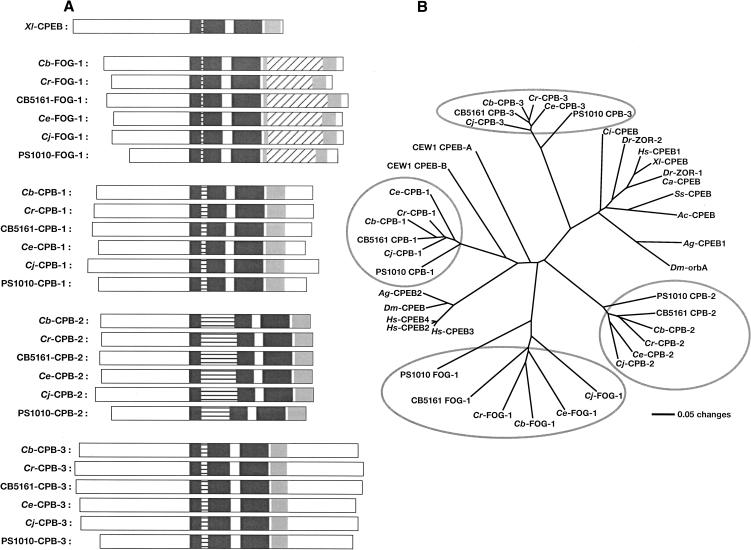
We used degenerate primers to clone homologs of FOG-3 and the CPEB gene FOG-1 from five species of nematodes: C. briggsae, C. remanei, C. japonica, and the unnamed species C. sp. CB5161 and C. sp. PS1010. Supplemental Table 2 lists the GenBank Accession numbers for these cDNAs. In each species, we identified a single fog-3 gene and four different CPEB genes, just as in C. elegans (Chen et al. 2000; Luitjens et al. 2000; Jin et al. 2001). These CPEB genes can be assigned to the same family groups as in C. elegans, both by structural considerations (Fig. 1A) and by phylogenetic analysis (Fig. 1B).
Figure 1.
Each Caenorhabditis species has four CPEB genes. (A) CPEB domain structures. Each protein is depicted as a white box, with the amino terminus at the left. The RNA recognition motifs (RRMs) are dark gray and the C-H domain is light gray. Insertions within the first RRM are horizontally striped, and insertions within the C-H domain are diagonally striped. (Xl) Xenopus laevis; (Cb) Caenorhabditis briggsae; (Cr) C. remanei; (CB5161) C. sp. CB5161; (Ce) C. elegans; (Cj) C. japonica; (PS1010) C. sp. PS1010. (B) Neighbor-joining tree showing the relationships among CPEB genes. This tree is based on an alignment of sequences from the conserved RRM1, RRM2, and C-H domains. Each nematode gene family is circled in gray. Nematodes are listed in A, but also include Oscheius tipulae (CEW1). Other animals are as follows: (Dm) Drosophila melanogaster; (Ag) Anopheles gambiae (malaria mosquito); (Ss) Spisula solidissima (Atlantic surf clam); (Ac) Aplysia californica (California sea hare); (Ci) Ciona intestinalis (ascidian tadpole); (Dr) Danio rerio (zebra fish); (Ca) Carassius auratus (gold fish); (Hs) Homo sapiens.
What relationships do these nematode families have to the CPEB proteins of other animals? Our analyses extend those of Luitjens et al. (2000) and Mendez and Richter (2001) and confirm that the CPB-3 family is most closely related to Xenopus CPEB protein, which is also expressed during oogenesis. In contrast, the FOG-1, CPB-1, and CPB-2 families are more closely related to a group of mammalian and insect proteins that have only recently been identified (Fig. 1B). One member of this family, CPEB2, is expressed during spermatogenesis in mice (Kurihara et al. 2003), just as FOG-1, CPB-1, and CPB-2 are in C. elegans (Luitjens et al. 2000; Jin et al. 2001). Thus, these CPEB proteins might descend from an ancestral form that functioned during spermatogenesis. However, all known rodent CPEB proteins are also expressed in the brain (Wu et al. 1998; Theis et al. 2003), which suggests an ancient role for CPEB proteins in nerve cells.
C. sp. PS1010 Is an Outgroup for the Elegans Subgroup of Nematodes
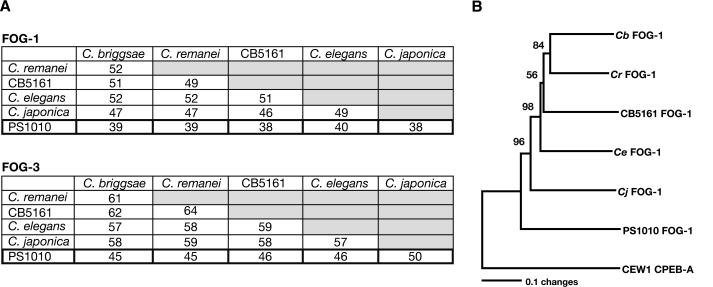
Because all species in the elegans subgroup of Caenorhabditis are closely related, previous attempts to determine their phylogeny were hindered by the limited sequence data available (Fitch et al. 1995). We hoped that analysis of amino acid sequences from five different proteins for each species would provide enough information to resolve the phylogeny. However, to do this, we also needed a closely related outgroup. Molecular data had placed the strain PS1010 within the genus Caenorhabditis, although its males have very distinctive tails (Baldwin et al. 1997). We found that the sequences of FOG-1 and FOG-3 from PS1010 were also dramatically different from those of other Caenorhabditis species (Fig. 2A). Furthermore, the phylogeny shown in Figure 1B suggested that C. sp. PS1010 might serve as an outgroup for other members of this genus. To confirm this hypothesis, we used the CPEB-A protein from the related genus Oscheius to root a phylogeny based on FOG-1 sequences (Fig. 2B). The bootstrap replication values for this tree, and its congruence with a tree based on morphological traits (Sudhaus and Kiontke 1996), confirm that C. sp. PS1010 is indeed an outgroup for C. elegans and its close relatives.
Figure 2.
PS1010 is an outgroup for C. elegans and its close relatives. (A) Percent identity values for the FOG-1 and FOG-3 proteins of each species. (B) Neighbor-joining tree of nematode FOG-1 sequences. Because they were hard to align, we excuded the amino terminus of each FOG-1 protein from this analysis; these excluded sequences totaled 60–128 amino acid residues per protein. (The total size range for the FOG-1 proteins was 564–653 residues). We chose the Oscheius tipulae CEW1 CPEB-A protein as our outgroup, and used PAUP* 4.0b10 for the calculations. Bootstrap confidence values are presented at each node, and were based on 10,000 replications.
C. briggsae and C. remanei Are Likely to Be Sister Species
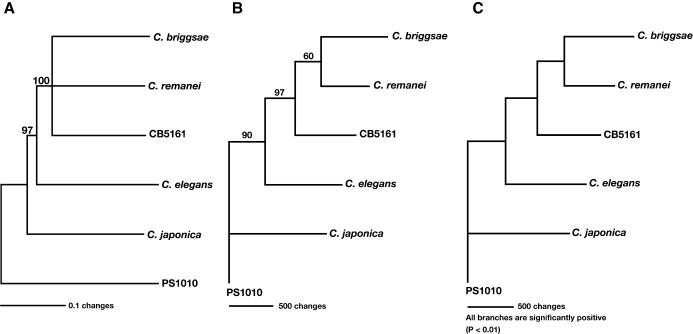
We used three different methods to reconstruct the phylogeny of the elegans group of nematodes. For each calculation, we used C. sp. PS1010 to root the tree, and based our calculations on a sequential, continuous alignment of FOG-3 and all four CPEB proteins. To filter out weakly supported relationships, we ignored any results whose bootstrap support was below 60%. Because of this criterion, our Neighbor-Joining tree was unable to resolve the relationships among three species—C. remanei, C. briggsae, and C. sp. CB5161 (Fig. 3A). However, it did show that these three species form a clade, whose sister is C. elegans. Furthermore, the branch lengths suggest that all members of the elegans subgroup originated in an ancient burst of speciation, which explains why it is hard to determine their relative relationships. Maximum Parsimony calculations were consistent with these results, and, furthermore, placed C. briggsae and C. remanei as sister species (Fig. 3B). Finally, Maximum Likelihood calculations gave the same results, with >95% confidence for each branch of the tree (Fig. 3C). Our phylogeny also agrees with one based on an entirely different set of genes (Kiontke et al. 2004). Thus, C. elegans and C. briggsae could not be sister species, despite the fact that both have male/hermaphrodite mating systems. Instead, our data suggested that the male/hermaphrodite species C. briggsae and the male/female species C. remanei were sisters.
Figure 3.
Phylogeny of the genus Caenorhabditis. (A) Neighbor-joining tree. The FOG-1, CPB-1, CPB-2, CPB-3, and FOG-3 sequences were concatenated, giving a total of 2839 characters for each species. We aligned the sequences using ClustalX, with final adjustments by hand, and used PAUP* 4.0b10 to build the tree. After 10,000 bootstrap replications, only segregations with a support value higher than 60% were accepted as significant. (B) Maximum Parsimony tree. We used PAUP* 4.0b10. Only segregations with a support value higher than 60% after 500 bootstrap replications were accepted as significant. (C) Maximum Likelihood tree. We used the Phylip software package and the JTT amino acid change model for these calculations.
The Intron/Exon Structures of the fog-3 and cpb Genes
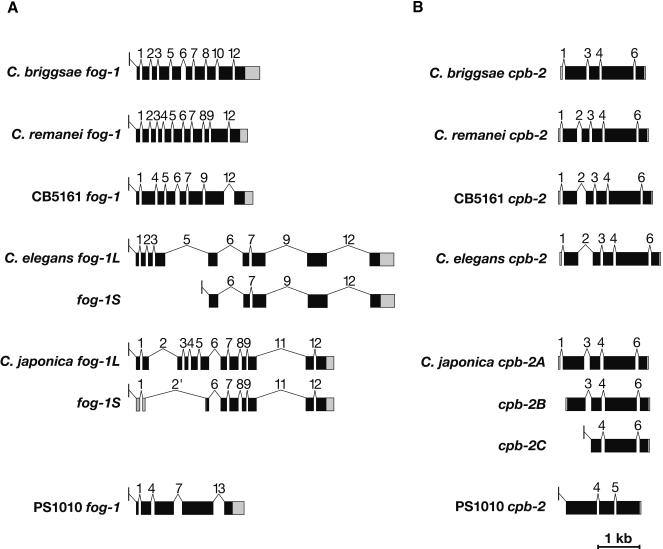
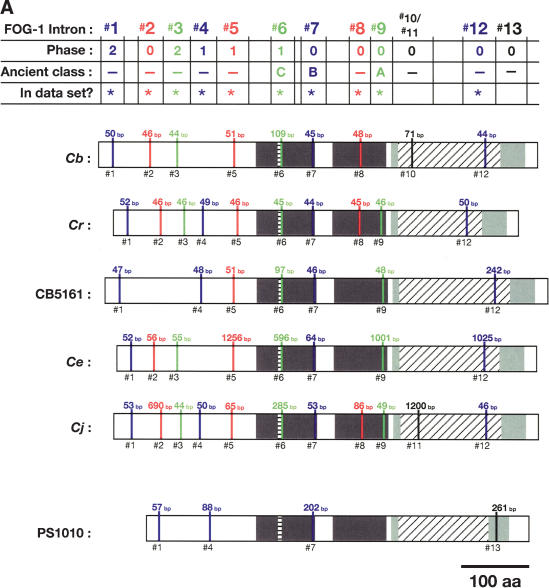
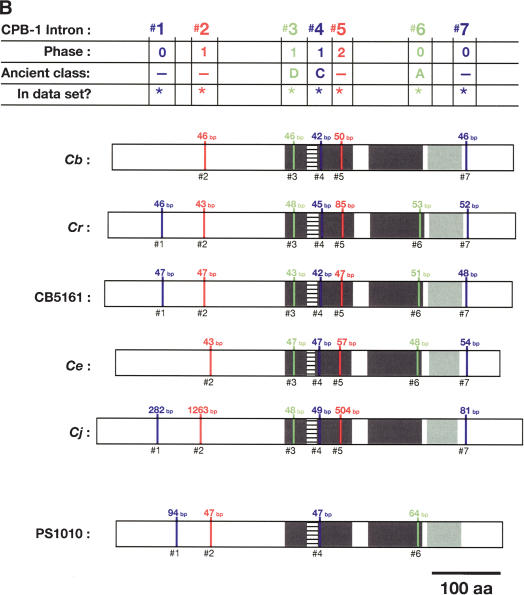
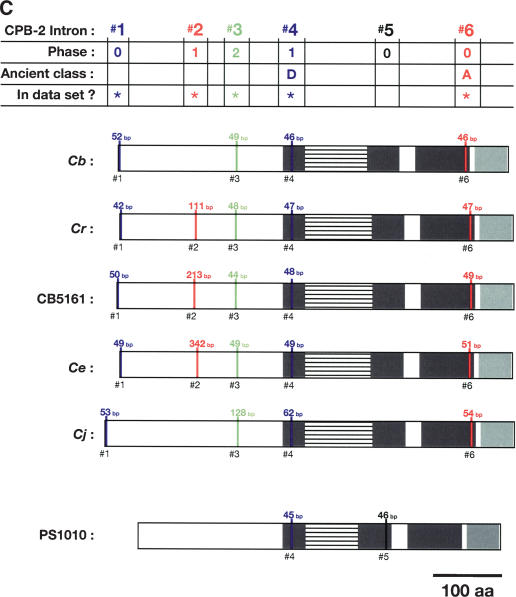
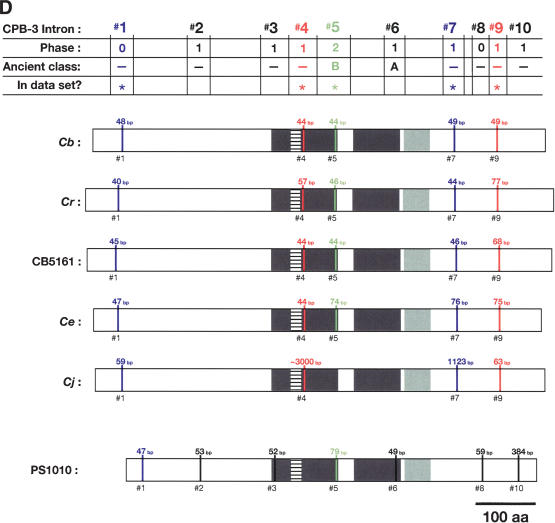
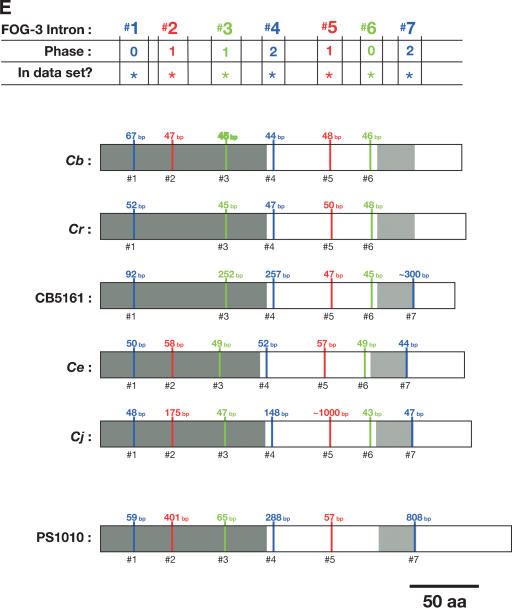
To learn how the intron/exon structures of fog-1, cpb-1, cpb-2, cpb-3, and fog-3 had changed during evolution, we used the PCR to clone the corresponding genomic DNAs. These sequences have been deposited with GenBank (Supplemental Table 2). By comparing genomic sequences with each cDNA, we determined the splicing patterns for each gene. Although most genes did not produce alternatively spliced products, a few did (Fig. 4 A,B). For our studies, we selected only the longest transcript from each of these genes. We then identified homologous introns by comparing insertion sites, and plotted the locations of these sites on diagrams of the proteins (Fig. 5A–E). Our results show that that the sizes of these introns are very small in each nematode species, with the median value always close to 50 bp (Table 1). However, the average sizes of the C. elegans, C. japonica, and C. sp. PS1010 introns are higher than for the other species, because a few introns appear to have expanded significantly in size (Fig. 5; Table 1).
Figure 4.
(A) The fog-1 gene family. (B) The cpb-2 family. Changes in splicing structure in the fog-1 and cpb-2 genes. We cloned cDNAs as described in the Methods section, and determined gene structures by comparing cDNA and genomic DNA sequences. Protein-coding regions are shown as black boxes, noncoding regions as gray boxes, and introns as thin lines. The SL1 leader sequence is shown as a small exon located above the line. All genes were drawn to scale.
Figure 5.
Alignment of conserved intron positions. The coding region of each gene is shown as a rectangle drawn to scale. (A–D) The RNA recognition motifs (RRMs) are dark gray, the C-H domain is light gray, insertions within the first RRM are horizontally striped, and insertions within the C-H domain are diagonally striped. (E) The BTF domain is dark gray, and the TF domain is light gray (Chen et al. 2000). Introns are shown as vertical lines within each gene, with size above, and number below. The introns used in our data set are colored blue, red, or green to make it easy to compare homologs between species. Phase 0 introns lie between codons, phase 1 introns after the first nucleotide of a codon, and phase 2 introns after the second nucleotide. Ancient introns A, B, C, and D were found in more than one CPEB gene.
Table 1.
Intron Sizes for the fog and cpb Genes of Caenorhabditis
| Species | Median Size | Average Size |
|---|---|---|
| C. remanei | 47 | 51 |
| C. briggsae | 46 | 51 |
| C. sp. CB5161 | 48 | 85 |
| C. elegans | 52 | 181 |
| C. japonica | 63 | 341 |
| C. sp. PS1010 | 59 | 146 |
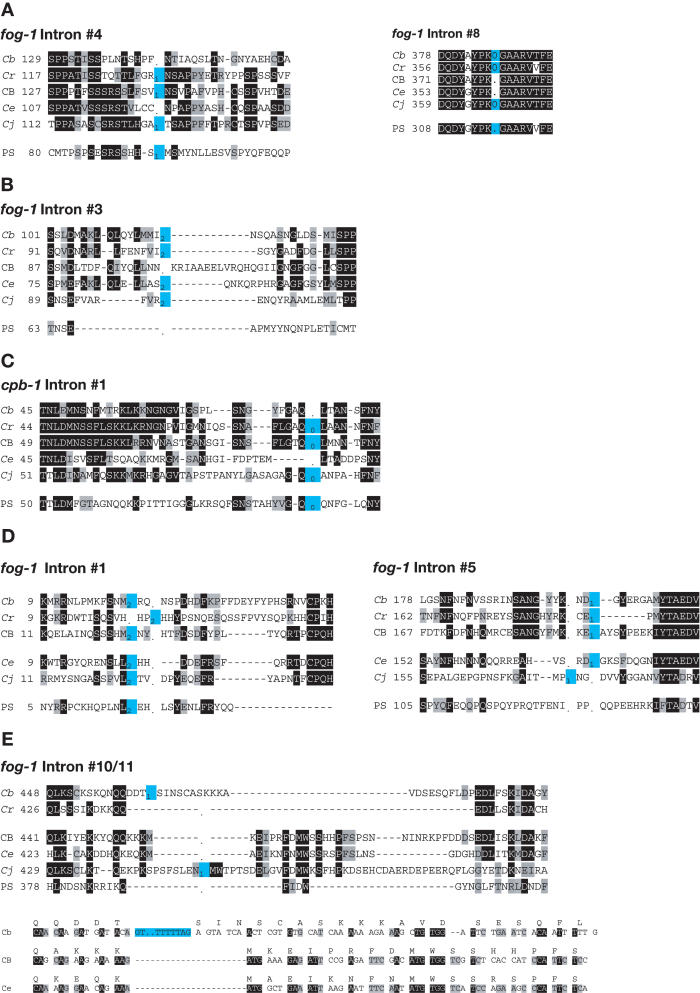
Many of the introns were present in all six species, but we also observed numerous sites for which one species was missing an intron, although the flanking sequences had been conserved (Fig. 6A). We also observed a few instances in which the site flanking a missing intron had changed dramatically in sequence (Fig. 6B,C), or in which the position of an intron might have `slid' relative to that of its relatives (Fig. 6D). Both potential cases of intron sliding involved an integral number of codons, so they were probably caused by a nearby insertion or deletion. Alternatively, these cases of sliding might have been caused by the deletion of the original intron, followed by the insertion of a novel intron in the same vicinity.
Figure 6.
(A) Perfect deletions. (B) Deletion with 3′ insertion. (C) Deletion with associated mutation. (D) Intron sliding. (E) Intron insertions. Sequences of selected intron sites. The starting position of each sequence follows the species name. Identical amino acids are shaded black, similar ones are shaded gray, and intron sites are colored blue. A “-“is used for amino acid gaps, and a “.” for intron gaps. Phase 0 introns lie between the indicated codons, and phase 1 or 2 introns lie within the codon to the left. The bottom half of E contains nucleotide sequences, with the translation above the line. (Cb) C. briggsae; (Cr) C. remanei; (CB) C. sp. CB5161; (Ce) C. elegans; (Cj) C. japonica; (PS) C. sp. PS1010.
Introns Are Lost Frequently During Nematode Evolution
Using C. sp. PS1010 as an outgroup, and our phylogeny (Fig. 3), we identified introns that were present in the ancestor of C. remanei, C. briggsae, C. sp. CB5161, C. elegans, and C. japonica (Fig. 5A–E). Most of these assignments were obvious, but three required further analysis. First, fog-1 intron 10 is found only in C. briggsae, and intron 11 only in C. japonica. Although their insertion sites are close to each other, the amino acid sequences cannot be aligned (Fig. 6E), and we believe they were formed by separate insertion events. This hypothesis was confirmed by comparing the nucleotide sequences of C. briggsae, C. sp. CB5161, and C. elegans (Fig 6E, bottom). Our alignment implies that the C. briggsae intron was inserted into this sequence along with additional nucleotides that caused a shift in the reading frame. Because fog-1 intron 10 was created after the split between C. briggsae and C. sp. CB5161, it cannot be related to fog-1 intron 11, which must have been created independently during C. japonica evolution.
Second, fog-3 intron 7 could have been lost in the common ancestor of C. briggsae and C. remanei, or it might have been lost independently in the two lineages. Because these species diverged from one another shortly after separating from C. sp. CB5161, and have since undergone extensive evolutionary change, we favor the latter hypothesis, but consider both possibilities in our analyses. Third, cpb-2 intron 2 might have been present in the ancestor of all five species and then lost in C. briggsae and C. japonica, or been created in the ancestor of the C. elegans portion of the lineage, and subsequently been lost in C. briggsae. Either explanation is equally parsimonious, and we consider both possibilities.
Because of these ambiguities, four different models can explain the history of intron losses in our data set (Table 2). These models differ in only a few details, and lead to similar conclusions. Whichever one is correct, our results show that intron losses have been far more common than insertions during recent nematode evolution. Furthermore, these losses occur at a high rate.
Table 2.
Intron Losses are More Frequent Than Insertions
|
Features of Model
|
Number of Introns Lost
|
Total Introns
|
||||||
|---|---|---|---|---|---|---|---|---|
| Model | fog-3 In # 7 | cpb-2 In # 2 | Never | Once | Twice | Lost | Gained | Ratio of Loss/Gain |
| 1 | Independent | Ancestral | 23 | 4 | 7 | 18 | 2 | 9.0 |
| 2 | Independent | Inserted | 23 | 5 | 6 | 17 | 3 | 5.7 |
| 3 | Ancestral | Ancestral | 23 | 5 | 6 | 17 | 2 | 8.5 |
| 4 | Ancestral | Inserted | 23 | 6 | 5 | 16 | 3 | 5.3 |
Because there are two ambiguities in the phylogeny of these introns, four different models that explain the pattern of intron evolution are possible.
Intron Losses Make Poor Traits for Constructing Phylogenies
Although one might expect that deletions, like the intron losses we observe in these lineages, would make excellent traits for cladistic analysis, it is clear from our data that these events occur independently at a high enough frequency to make them useless for building phylogenies. We observed six cases in which an ancestral intron had been lost in exactly two of the five species we were studying, and only the loss of fog-3 intron 7 in C. briggsae and C. remanei could have been due to a single event occurring in a common ancestor.
Intron Losses Are Not Randomly Distributed
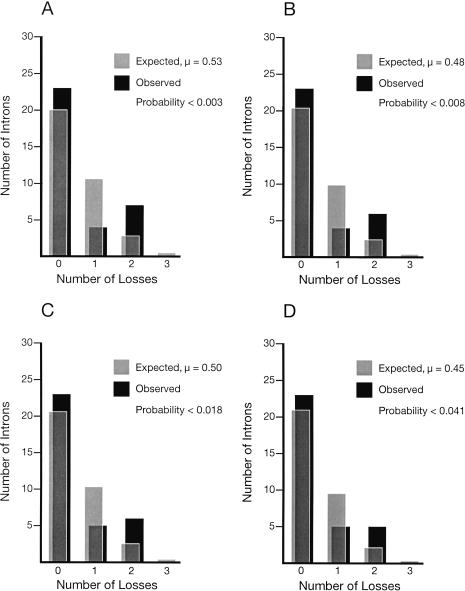
Are these intron losses random events that affect all introns equally, or are some introns more likely to be lost than others? To answer this question, we used the Poisson Distribution to calculate the number of introns expected to show no losses, a single loss, two independent losses, or three independent losses, given the assumption that these losses occur randomly. The crucial parameter for these calculations is μ, the average number of losses for each intron. For example, in Model 1, there were four single losses, seven double losses, and 34 ancestral introns, so μ = (4 + 2*7)/34 = 0.53. Because μ is ∼0.5 for each model, the largest class should be introns that show no losses, followed by those that show only one, and so on. However, this is not what we see (Fig. 7). Instead, the number of introns that show two independent losses is greater than or equal to those showing only one loss. This distortion is so large that a χ2 test shows that models in which all losses occur randomly are unlikely to explain our data (Fig. 7).
Figure 7.
(A) Model 1. (B) Model 2. (C) Model 3. (D) Model 4. Introns are not lost randomly. The four models are described in Table 3. However, as Models 2 and 4 assume that cpb-2 intron #2 was created sometime after the split between the ancestor of C. japonica and that of the other species, this intron was excluded from the calculations, leaving only 33 ancestral introns in the data set for these two models. This correction allowed us to consider only introns that have existed for the same length of time.
Some Introns Might Have Conserved Functions
One explanation for this nonrandom pattern is that some introns have a very low chance of being lost, because they perform important functions, and that these introns contribute to an unexpectedly large class that are never lost. For example, if we assume that 19 of the introns in our data set cannot be lost, and that losses for the remaining introns are distributed randomly, the probability of explaining our results rises to ≥0.05 for each model.
Is there other evidence that some of these introns are essential? Of the 24 introns that were not lost in any of the species we studied, 10 were also present in the outgroup C. sp. PS1010. Furthermore, three of these 10 conserved introns must have arisen before the duplication and divergence of the CPEB genes, as they are present in more than one CPEB gene (introns B, C, and D, Fig. 5). However, another intron that has occasionally been deleted in the genes we studied also arose before the divergence of the CPEB genes (intron A, Fig. 5), so great age alone is not proof that an intron has an essential function. Because these introns do not appear to have conserved nucleotide sequences, these essential functions are probably related either to their secondary structures, or to the influence of their positions within the transcript.
Adjacent Introns Are Not More Likely to Be Lost Together
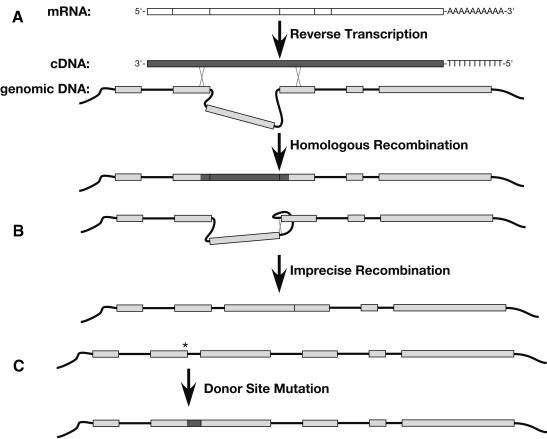
The leading hypothesis for how introns are lost is homologous recombination between a gene and a reverse-transcribed copy of its message. One prediction of this hypothesis is that adjacent introns should frequently be lost together, as recombination in a region flanking two or more introns would eliminate all of them in a single step (Fig. 8A). Considering Model #1, for example, we observed 16 events in which a single intron had been lost, and only a single instance in which two adjacent introns had been lost — introns 2 and 3 from C. sp. CB5161 fog-1 (Fig. 5A). Is this frequency of adjacent losses more than one would expect from chance alone? In this model, there were 34 ancestral introns in each of the five species we examined (Table 3), yielding a total of 170 introns. Of these, 18 were lost, so the chance that a particular intron in a single species would be lost is 10.6%. Thus, we predict that the number of events in which two adjacent introns would be lost equals (0.106)2*(29*5) = 1.6, as there are 29 adjacent sets of introns among these genes, and five different species. Clearly, the number of adjacent losses is no more than predicted by chance. The other models listed in Table 2 yield similar results.
Figure 8.
Mechanisms of intron loss. (A) Loss by recombination with cDNA. In the genomic DNA, coding sequences are shown as gray boxes. Sites of recombination are marked with an X. (B) Loss by deletion. Only one of several possible mechanisms for deletion is shown. (C) Loss by mutation of the donor site. (*) The site of a point mutation that destroys the donor site. The dark gray box indicates in-frame intron sequences that have become part of the coding sequence.
Table 3.
Novel Introns in C. sp. PS1010 Genes
| Gene | Present in PS1010 and Other Nematodes | Unique to PS1010 |
|---|---|---|
| fog-1 | 3 | 1 |
| cpb-1 | 4 | 0 |
| cpb-2 | 1 | 1 |
| cpb-3 | 2 | 5 |
| fog-3 | 6 | 0 |
We were concerned that including essential introns in our calculations might alter the number of adjacent losses we should expect. Thus, we considered only introns 2, 3, 4, 8, and 9 from fog-1, as these have all had at least one loss among the species we studied, and also formed three adjacent groups (introns 2 and 3, 3 and 4, and 8 and 9). The rate of loss for these five introns is 7/25 = 28%, so we would expect the number of events in which two or more adjacent introns would be lost equals (0.28)2*(3*5) = 1.2. Thus, these calculations also provide no support for models in which the loss of adjacent introns is favored.
Recently, Mourier and Jeffares (2003) showed that the introns in unicellular eukaryotes are predominantly located at the 5′ ends of genes. They suggested that this clustering is due to preferential loss of introns at the 3′ ends of genes by homologous recombination, as partial cDNAs produced by reverse transcription might contain a preponderance of DNA from 3′ ends. Although this effect is most pronounced in unicellular animals that have few remaining introns, one might expect that direct measurements of intron loss in higher eukaryotes would reveal the same bias. However, of the 18 introns lost in Model #1, 10 were eliminated from the 5′ half of a gene, one from the center, and seven from the 3′ half. Thus, we see no positional bias.
DISCUSSION
Nematode Mating Systems Change Often During Evolution
To analyze changes in gene structure during nematode evolution, we began by preparing the first detailed phylogeny of the elegans group (Fig. 3). Surprisingly, this phylogeny also shows that mating systems have changed multiple times during the evolution of this small group within the genus Caenorhabditis. This result dramatically extends previous analyses of the entire phylum Nematoda (Fitch et al. 1995; Blaxter et al. 1998), which showed that mating systems had changed many times during the long evolutionary history of the nematodes.
The fact that most species in this genus use male/female mating systems suggests that the ancestor of the elegans group was male/female. Thus, if our phylogeny is correct (Fig. 3), the simplest model is that C. elegans and C. briggsae each evolved hermaphroditism separately. However, it remains possible that the common ancestor of C. briggsae, C. remanei, C. sp. CB5161, and C. elegans acquired a male/hermaphrodite mating system, and this system then reverted to a male/female one in C. remanei and C. sp. CB5161. Although the second scenario involves more steps than the first one, it might be equally probable, because we do not know the relative likelihood of switching from a male/female mating system to a male/hermaphrodite one, or vice versa.
In the past few years, a major effort has been launched to determine the molecular changes that have influenced the control of sex determination during nematode evolution (Kuwabara and Shah 1994; de Bono and Hodgkin 1996; Kuwabara 1996; Hansen and Pilgrim 1998; Haag and Kimble 2000; Chen et al. 2001; Wang and Kimble 2001; Haag et al. 2002; Luz et al. 2003). Our phylogeny provides a framework for interpreting these studies, and will allow us to infer the direction of each regulatory change that is detected.
The Rate of Intron Loss is Very High in Nematodes
From an evolutionary perspective, changes in intron/exon structure might be an important force for generating differences in gene function. However, a recent study showed that such changes are rare in mammalian evolution (Roy et al. 2003). For example, of 10,020 introns considered in a comparison between humans and mice, only five were lost in the mouse lineage, and none were lost in humans.
Gene structures change much more rapidly in nematodes. First, a direct comparison of the C. elegans and C. briggsae genomes showed that they have significant differences in intron/exon structure (Kent and Zahler 2000; Stein et al. 2003). In the latter study, of 60,275 introns that were examined, 4379 were unique to C. elegans, and 2200 were unique to C. briggsae. Because no outgroups were considered, it was unclear if these differences were caused by losses or gains. Second, several studies have documented dramatic changes in intron/exon structure within large C. elegans gene families (Gotoh 1998; Robertson 1998, 2000). These data showed that intron losses were more common than gains, just as we observed, but could not determine the rate of loss, as the dates of each gene duplication were unknown.
Because we established a phylogeny for these nematodes, we could measure loss rates directly. We found that individual introns had roughly a 10% chance of being lost since the divergence of the five species we studied. This number is based on direct sequence analysis of the relevant genomic DNAs and cDNAs and does not depend on computer predictions of gene structure. By comparison, the data from humans and mice showed a loss rate of 0.025%, which is 400-fold lower. This comparison depends on the assumption that the last common ancestor of humans and mice lived at roughly the same time as the last common ancestor of these nematodes (Stein et al. 2003), which would be true if the rate of molecular evolution were constant. However, if the rate of genome evolution is faster in nematodes, as seems likely, then the rate at which introns are lost in worms exceeds that of mammals by more than 400-fold.
Why such a high loss rate in nematodes? Roy et al. (2003) found that the deleted introns in mammals were probably much smaller than the average human size of 2500 bp. In C. elegans, most introns are about 50-bp long (Blumenthal and Steward 1997), and we found small introns in each of the other nematode species we examined (Table 2). Thus, it seems possible that the frequency at which introns are lost is inversely proportional to their size. Because nematodes also have some large introns, this hypothesis can be directly tested when additional genome sequences from Caenorhabditis are finished.
The rate at which introns are gained might also be higher in worms. No insertions were found in any human, mouse, or rat genes (Roy et al. 2003), whereas we observed either two or three insertions in the nematode genes we analyzed. However, in the mammalian study, 16 introns in coding regions of low amino acid sequence conservation were not considered, and some of these excluded cases might have involved insertions. For comparison, the two recently inserted introns we detected in fog-1 are both located in a poorly conserved region that would have been excluded from the mammalian study.
How Do Intron Losses Occur?
Recombination With cDNA
The most common hypothesis for how introns are lost is by recombination with reversed-transcribed copies of a message, which should lack all introns (Fig. 8A). In its simplest form, this model implies that adjacent introns have a high probability of being lost together in a single event. Some data strongly support this model. For example, five adjacent introns seem to have been lost simultaneously during the evolution of the catalase 3 gene in Zea mays (Frugoli et al. 1998), and all of the introns in the Oikopleura longicauda EP-1α gene might have been lost in a single event (Wada et al. 2002).
However, adjacent losses like these are rare in our data and in data from plants (Frugoli et al. 1998), insects (Krzywinski and Besansky 2002), and deuterostomes (Wada et al. 2002). One potential explanation is that the cDNA templates that recombine with genomic DNA are usually small fragments rather than complete genes. For each species, the size of these fragments would determine which introns could be lost together. If so, in worms, these cDNA fragments are unlikely to be formed by partial reverse transcription starting from the 3′ end, as has been hypothesized for unicellular eukaryotes (Mourier and Jeffares 2003), as we see no bias toward loss of introns at the 3′ ends of genes (Fig. 5). A more plausible model is that the enzymes responsible for recognizing and degrading aberrant DNA control the formation of these cDNA fragments, and thus influence the rate of intron loss. Alternatively, recombination might favor individual short introns, because the cDNA and genomic DNA sequences should align more easily if smaller loops are involved (Roy et al. 2003). In either case, shorter introns are more likely to be eliminated by recombination than longer ones.
It is also possible that adjacent introns are rarely lost together, because recombination with cDNA is not the primary cause of loss. Two other considerations support this idea. First, a crucial prediction of this model is that intron losses should be restricted to genes that are actively transcribed in the germ line, like those in our current study. However, Robertson (1998; 2000) observed a large number of intron losses in a family of putative odor receptor genes in C. elegans. If these genes are indeed odor receptors, they are unlikely to be expressed in germ cells, so their introns must have been lost by other means. Second, although nematodes have a large number of pseudogenes (Mounsey et al. 2002), most of these are not processed pseudogenes (Mounsey et al. 2002; Nieduszynski et al. 2002), so it seems unlikely that there is an unusually high rate of cDNA production in worms.
Deletions
Introns could also be lost by spontaneous genomic deletions (Fig. 8B). In theory, these deletions could either be precise, which would yield a product indistinguishable from an intron lost by recombination, or imprecise. Such events are known to occur, as the jingwei gene of Drosophila teissieri has two alleles, one of which is an imprecise deletion that did not remove 12 nucleotides of the original intron 2 (Llopart et al. 2002). Similarly, intron #1 of the C. elegans cpb-1 gene might have been formed by imprecise deletion, as it appears to have been lost along with some adjacent coding sequence (Fig. 6C). Because the probability of a 2500-bp intron being exactly deleted is much lower than it is for a 50-bp intron, this mechanism should also favor the loss of short introns.
Changes in Splice Doner Sites
In regions that are tolerant of changes in amino acid sequence, one might also expect some introns to be lost by the mutation of a splice donor site. If this were to happen and no cryptic donor sites were activated, the associated intron would become part of the coding region (Fig. 8C). This mechanism could explain how intron #3 was lost from the fog-1 gene of C. sp. CB5161 (Fig. 6B). Because longer introns are more likely to contain in-frame stop codons, this mechanism should only work for very short introns.
We suspect that all of these mechanisms contribute to intron loss during evolution, but that spontaneous genomic deletions are far more important than previously suspected. Once additional nematode genome sequences become available, we plan a global comparison of the loss rate for introns in germ-line and somatic genes to test this hypothesis. Because of the high loss rate for nematode introns, such a comparison could also test the hypothesis that all mechanisms for intron loss favor the elimination of short introns over longer ones.
Are the Rates of Intron Loss and Gain Constant During Evolution?
We observed a much higher rate of intron loss than of insertion (Table 3), and this observation also appears true for other organisms (Krzywinski and Besansky 2002; Wada et al. 2002; Roy et al. 2003). However, if the rate at which new introns are created has always been much lower than that of losses, then the number of introns must have been much higher in the distant past. In fact, rough estimates suggest that this number should once have been high enough that introns occurred every few codons, which seems ridiculous. Alternatively, the rate of either insertions or losses might vary over time.
Examination of the cpb-3 gene suggests one intriguing possibility for such variation (Fig. 5D; Table 3). In this gene, five introns are present in C. sp. PS1010 that are not found in other cpb-3 genes (introns 2, 3, 6, 8, and 9). Of these introns, four are not found in any other CPEB genes and might have been formed by insertion events in the C. sp. PS1010 lineage. Because none of the other genes we examined could have had a high number of insertion events (Table 3), it is possible that such insertions affect specific genes only at certain times during evolution. If insertions are often accompanied by mutation (as in Fig. 6E), these differences might reflect changes in selective pressure over time. Alternatively, they might be caused by changes in the rate of transposition or DNA duplication. Because of differences in chromatin structure, such changes might preferentially affect specific regions of the chromosome. Of course, it is also possible that these four introns were ancestral and have been lost in the other cpb-3 genes. Additional sequence analyses from a more distant relative could resolve this question.
If the high rate of intron loss in the elegans group is true of nematodes in general, then it must have been matched by a relatively high rate of intron creation in worms, as the number of introns in worm genes is similar to that found in their insect or mammalian counterparts. This observation implies that introns play a crucial role in gene function, even when their sequences are not conserved and, in the long run, losses must be offset by gains. Given the important role of splicing in nonsense-mediated decay and mRNA processing and export (Lynch and Richardson 2002), this observation is not surprising.
Have Introns Facilitated Changes in Protein Structure During Nematode Evolution?
In nematodes, about 70% of messages are trans-spliced to a short leader sequence (Blumenthal and Steward 1997). We observed two examples in which a trans-spliced leader had been added to a transcript in one species, or eliminated from it in another, and only one case in which internal splicing patterns had changed. On the one hand, in C. elegans, a novel trans-splice helped create the fog-1S transcript, which lacks exons 1 through 4 (Fig. 4A). In addition, the C. japonica cpb-2C transcript lacks exons 1 and 2 because of a novel trans-splice (Fig. 4B). In contrast, the only internal change involves C. japonica fog-1S, which lacks part of exon 2, all of exons 3–5, and part of exon 6 (Fig. 4B).
These results suggest that changes in the pattern of trans-splicing provide an important mechanism for generating new transcripts in nematodes. Although some of these changes merely alter a few residues, in other cases they produce much shorter transcripts that lack conserved domains. Many other genes in C. elegans and C. briggsae are also known to produce short transcript variants that are spliced to the SL1 leader sequence. Unfortunately, little is known about the functions of these variants.
Future Prospects
Recent proposals have been made to sequence the genomes of C. remanei, C. sp. CB5161, and C. japonica. When these projects are completed, analyses of intron gains and losses can be carried out on a genomic scale for five related species of nematodes. If this work is combined with similar studies that should soon be possible in insects and vertebrates, the statistical analyses used here should provide a definitive picture of the pattern of intron gains and losses during evolution.
METHODS
Genetic Nomenclature
We use the genetic nomenclature described by Horvitz et al. (1979) with some modifications. First, we use Cb-fog-1 and Crfog-1 to refer to the fog-1 homologs from C. briggsae and C. remanei, respectively. Second, capital letters in plain font indicate the proteins that are encoded by each gene; for example, fog-1 encodes the protein FOG-1.
Genetic Methods and Nematode Strains
We used the techniques for culturing worms described by Brenner (1974), and raised all animals at 20°C. Wild-type refers to the Bristol strain N2 for C. elegans (Brenner 1974), AF16 for C. briggsae (Fodor et al. 1983), EM464 for C. remanei (Baird et al. 1992), SB339 for C. japonica (Kiontke et al. 2002), CB5161 for C. sp. CB5161 (Baird et al. 1992), PS1010 for C. sp. PS1010 (Baldwin et al. 1997), and CEW1 for Oscheius tipulae (Evans et al. 1997).
Cloning cDNA Copies of the CPEB Genes and fog-3
The central portions of each CPEB transcript were obtained by RT–PCR, using degenerate primers designed by the CO-DEHOP method (Rose et al. 1998). In an attempt to isolate all CPEB genes from a single amplification, we began by using general primers that targeted regions shared by these genes (Supplemental Table 1). Afterward, we used more specific primers to clone those genes we did not recover in our initial experiments. Finally, we cloned the 3′ ends of each cDNA by RACE (Frohman et al. 1988), using Primers Q0n for primary amplifications, and Q1n for secondary amplifications. We cloned the 5′ ends either by RACE or by RT–PCR, using a primer homologous to the SL1 or SL2 leader sequences. We followed a similar strategy to clone and characterize the fog-3 genes from CB5161, C. japonica, and PS1010 with degenerate primers specific to fog-3 (Supplemental Table 1).
All PCR products were subcloned into the pGEM-T easy vector (Promega), and both strands were sequenced using the di-deoxy nucleotide method (Sanger et al. 1977) with fluorescently labeled terminators (Halloran et al. 1993). These experiments identified four CPEB genes from each Caenorhabditis species, but only two from Oscheius tipulae. These two genes are more closely related to the fog-1/cpb-1 group than to cpb-2 or cpb-3, but their exact orthology is uncertain. Thus, we call these genes CEW1 cpeb-A and cpeb-B.
Phylogenetic Analyses
We used CLUSTAL X version 1.81 (Jeanmougin et al. 1998) to prepare alignments, and adjusted them by hand before using them for phylogenetic analyses. To carry out Neighbor-Joining (Saitou and Nei 1987) and Maximum Parsimony analyses, we used the PAUP* 4.0b10 software package (Swofford 2000). We used PHYLIP (Felsenstein 1993) for Maximum Likelihood analyses, and followed the amino acid change model of Jones et al. (1992).
To develop a phylogeny of the elegans group, we prepared an alignment using concatemers of the four CPEB proteins (FOG-1, CPB-1, CPB-2, and CPB-3) and FOG-3 for each Caenorhabditis species. These concatenated sequences had a total of 2839 characters.
Cloning and Characterizing Intron Sequences
To prepare genomic DNA, we used populations of animals grown on single 100-mm culture plates. We harvested the worms in M9 buffer and pelleted them by centrifugation at 2000g for 3 min, followed by one rinse with water. We then purified genomic DNA using the PUREGENE DNA isolation Kit (Gentra Systems).
For each gene, we cloned genomic DNA by the PCR using primers based on cDNA sequences, and sequenced both strands of each purified PCR product. For genes whose genomic sequence was too long for a single amplification, we used overlapping sets of primers to obtain the entire sequence. Finally, we determined the positions and sequences of introns by comparing each genomic sequence with its corresponding cDNA.
The Poisson Distribution Test for Intron Loss
To see whether introns were lost randomly, we used the Poisson Distribution test. The average number of intron losses (μ) for each model was calculated as the number of intron losses divided by the total number of ancestral introns (N). For the Poisson Distribution, the number of introns showing x losses equals P(x) = (e–μ * μx)/x!. Finally, we used the χ2 test to calculate the probability that deviations between the expected and observed distributions could be produced by chance. The probabilities were calculated assuming two degrees of freedom.
Acknowledgments
This work was funded by a grant from the National Science Foundation. We thank the Caenorhabditis Genetics Center, Scott Baird, and David Fitch for strains, Catherine Ross for technical assistance, and Jianzhi Zhang, Eric Moss, Karin Kiontke, and David Fitch for valuable discussions.
The publication costs of this article were defrayed in part by payment of page charges. This article must therefore be hereby marked “advertisement” in accordance with 18 USC section 1734 solely to indicate this fact.
Article and publication are at http://www.genome.org/cgi/doi/10.1101/gr.2639304.
Footnotes
[Supplemental material is available online at www.genome.org.]
References
- Baird, S.E., Sutherlin, M.E., and Emmons, S.W. 1992. Reproductive isolation in Rhabditidae (Nematoda:Secernentea); mechanisms that isolate six species of three genera. Evolution 46: 585–594. [DOI] [PubMed] [Google Scholar]
- Baldwin, J.G., Frisse, L.M., Vida, J.T., Eddleman, C.D., and Thomas, W.K. 1997. An evolutionary framework for the study of developmental evolution in a set of nematodes related to Caenorhabditis elegans. Mol. Phylogenet. Evol. 8: 249–259. [DOI] [PubMed] [Google Scholar]
- Blake, C.C. 1978. Do genes-in-pieces imply protein-in-pieces? Nature 273: 267–268. [Google Scholar]
- Blaxter, M.L., De Ley, P., Garey, J.R., Liu, L.X., Scheldeman, P., Vierstraete, A., Vanfleteren, J.R., Mackey, L.Y., Dorris, M., Frisse, L.M., et al. 1998. A molecular evolutionary framework for the phylum Nematoda. Nature 392: 71–75. [DOI] [PubMed] [Google Scholar]
- Blumenthal, T. and Steward, K. 1997. RNA processing and gene structure. In C. elegans II (eds. D.L. Riddle et al.), pp. 117–145. Cold Spring Harbor Laboratory Press, Cold Spring Harbor, NY. [PubMed]
- Bonen, L. and Vogel, J. 2001. The ins and outs of group II introns. Trends Genet. 17: 322–331. [DOI] [PubMed] [Google Scholar]
- Brenner, S. 1974. The genetics of Caenorhabditis elegans. Genetics 77: 71–94. [DOI] [PMC free article] [PubMed] [Google Scholar]
- Cavalier-Smith, T. 1978. Nuclear volume control by nucleoskeletal DNA, selection for cell volume and cell growth rate, and the solution of the DNA C-value paradox. J. Cell. Sci. 34: 247–278. [DOI] [PubMed] [Google Scholar]
- Cavalier-Smith, T. 1985. Selfish DNA and the origin of introns. Nature 315: 283–284. [DOI] [PubMed] [Google Scholar]
- Cavalier-Smith, T. 1991. Intron phylogeny: A new hypothesis. Trends Genet. 7: 145–148. [PubMed] [Google Scholar]
- Chen, P.J., Singal, A., Kimble, J., and Ellis, R.E. 2000. A novel member of the tob family of proteins controls sexual fate in Caenorhabditis elegans germ cells. Dev. Biol. 217: 77–90. [DOI] [PubMed] [Google Scholar]
- Chen, P.J., Cho, S., Jin, S.W., and Ellis, R.E. 2001. Specification of germ cell fates by fog-3 has been conserved during nematode evolution. Genetics 158: 1513–1525. [DOI] [PMC free article] [PubMed] [Google Scholar]
- Davis, R.E. 1993. Spliced leader RNA trans-splicing in metazoa. Parasitol. Today 12: 33–40. [DOI] [PubMed] [Google Scholar]
- de Bono, M. and Hodgkin, J. 1996. Evolution of sex determination in Caenorhabditis: Unusually high divergence of tra-1 and its functional consequences. Genetics 144: 587–595. [DOI] [PMC free article] [PubMed] [Google Scholar]
- Derr, L.K. 1998. The involvement of cellular recombination and repair genes in RNA-mediated recombination in Saccharomyces cerevisiae. Genetics 148: 937–945. [DOI] [PMC free article] [PubMed] [Google Scholar]
- de Souza, S.J. 2003. The emergence of a synthetic theory of intron evolution. Genetica 118: 117–121. [PubMed] [Google Scholar]
- de Souza, S.J., Long, M., Schoenbach, L., Roy, S.W., and Gilbert, W. 1996. Intron positions correlate with module boundaries in ancient proteins. Proc. Natl. Acad. Sci. 93: 14632–14636. [DOI] [PMC free article] [PubMed] [Google Scholar]
- de Souza, S.J., Long, M., Schoenbach, L., Roy, S.W., and Gilbert, W. 1997. The correlation between introns and the three-dimensional structure of proteins. Gene 205: 141–144. [DOI] [PubMed] [Google Scholar]
- de Souza, S.J., Long, M., Klein, R.J., Roy, S., Lin, S., and Gilbert, W. 1998. Toward a resolution of the introns early/late debate: Only phase zero introns are correlated with the structure of ancient proteins. Proc. Natl. Acad. Sci. 95: 5094–5099. [DOI] [PMC free article] [PubMed] [Google Scholar]
- Doolittle, W.F. 1978. Gene-in-pieces: Were they ever together? Nature 272: 581–582. [Google Scholar]
- Esnault, C., Maestre, J., and Heidmann, T. 2000. Human LINE retrotransposons generate processed pseudogenes. Nat. Genet. 24: 363–367. [DOI] [PubMed] [Google Scholar]
- Evans, D., Zorio, D., MacMorris, M., Winter, C.E., Lea, K., and Blumenthal, T. 1997. Operons and SL2 trans-splicing exist in nematodes outside the genus Caenorhabditis. Proc. Natl. Acad. Sci. 94: 9751–9756. [DOI] [PMC free article] [PubMed] [Google Scholar]
- Fedorov, A., Cao, X., Saxonov, S., de Souza, S.J., Roy, S.W., and Gilbert, W. 2001. Intron distribution difference for 276 ancient and 131 modern genes suggests the existence of ancient introns. Proc. Natl. Acad. Sci. 98: 13177–13182. [DOI] [PMC free article] [PubMed] [Google Scholar]
- Felsenstein, J. 1993. PHYLIP (Phylogeny Inference Package) version 3.5c. Distributed by the author, Department of Genetics, University of Wahington, Seattle, WA.
- Fink, G.R. 1987. Pseudogenes in Yeast. Cell 49: 5–6. [DOI] [PubMed] [Google Scholar]
- Fitch, D.H., Bugaj-Gaweda, B., and Emmons, S.W. 1995. 18S ribosomal RNA gene phylogeny for some Rhabditidae related to Caenorhabditis. Mol. Biol. Evol. 12: 346–358. [DOI] [PubMed] [Google Scholar]
- Fodor, A., Riddle, D.L., Nelson, F.K., and Golden, J.W. 1983. Comparison of a new wild-type Caenorhabditis-Briggsae with laboratory strains of Caenorhabditis-Briggsae and C. elegans. Nematologica 29: 203–217. [Google Scholar]
- Frohman, M.A., Dush, M.K., and Martin, G.R. 1988. Rapid production of full-length cDNAs from rare transcripts: Amplification using a single gene-specific oligonucleotide primer. Proc. Natl. Acad. Sci. 85: 8998–9002. [DOI] [PMC free article] [PubMed] [Google Scholar]
- Frugoli, J.A., McPeek, M.A., Thomas, T.L., and McClung, C.R. 1998. Intron loss and gain during evolution of the catalase gene family in angiosperms. Genetics 149: 355–365. [DOI] [PMC free article] [PubMed] [Google Scholar]
- Gilbert, W. 1978. Why genes in pieces? Nature 271: 501. [DOI] [PubMed] [Google Scholar]
- Gilbert, W., de Souza, S.J., and Long, M. 1997. Origin of genes. Proc. Natl. Acad. Sci. 94: 7698–7703. [DOI] [PMC free article] [PubMed] [Google Scholar]
- Giroux, M.J., Clancy, M., Baier, J., Ingham, L., McCarty, D., and Hannah, L.C. 1994. De novo synthesis of an intron by the maize transposable element Dissociation. Proc. Natl. Acad. Sci. 91: 12150–12154. [DOI] [PMC free article] [PubMed] [Google Scholar]
- Gotoh, O. 1998. Divergent structures of Caenorhabditis elegans cytochrome P450 genes suggest the frequent loss and gain of introns during the evolution of nematodes. Mol. Biol. Evol. 15: 1447–1459. [DOI] [PubMed] [Google Scholar]
- Haag, E.S. and Kimble, J. 2000. Regulatory elements required for development of caenorhabditis elegans hermaphrodites are conserved in the tra-2 homologue of C. remanei, a male/female sister species. Genetics 155: 105–116. [DOI] [PMC free article] [PubMed] [Google Scholar]
- Haag, E.S., Wang, S., and Kimble, J. 2002. Rapid coevolution of the nematode sex-determining genes fem-3 and tra-2. Curr. Biol. 12: 2035–2041. [DOI] [PubMed] [Google Scholar]
- Halloran, N., Du, Z., and Wilson, R.K. 1993. Sequencing reactions for the applied biosystems 373A Automated DNA Sequencer. Meth. Mol. Biol. 23: 297–315. [DOI] [PubMed] [Google Scholar]
- Hankeln, T., Friedl, H., Ebersberger, I., Martin, J., and Schmidt, E.R. 1997. A variable intron distribution in globin genes of Chironomus: Evidence for recent intron gain. Gene 205: 151–160. [DOI] [PubMed] [Google Scholar]
- Hansen, D. and Pilgrim, D. 1998. Molecular evolution of a sex determination protein. FEM-2 (pp2c) in Caenorhabditis. Genetics 149: 1353–1362. [DOI] [PMC free article] [PubMed] [Google Scholar]
- Horvitz, H.R., Brenner, S., Hodgkin, J., and Herman, R.K. 1979. A uniform genetic nomenclature for the nematode Caenorhabditis elegans. Mol. Gen. Genet. 175: 129–133. [DOI] [PubMed] [Google Scholar]
- Jeanmougin, F., Thompson, J.D., Gouy, M., Higgins, D.G., and Gibson, T.J. 1998. Multiple sequence alignment with Clustal X. Trends Biochem. Sci. 23: 403–405. [DOI] [PubMed] [Google Scholar]
- Jin, S.W., Kimble, J., and Ellis, R.E. 2001. Regulation of cell fate in Caenorhabditis elegans by a novel cytoplasmic polyadenylation element binding protein. Dev. Biol. 229: 537–553. [DOI] [PubMed] [Google Scholar]
- Jones, D.T., Taylor, W.R., and Thornton, J.M. 1992. The rapid generation of mutation data matrices from protein sequences. Comput. Appl. Biosci. 8: 275–282. [DOI] [PubMed] [Google Scholar]
- Kent, W.J. and Zahler, A.M. 2000. Conservation, regulation, synteny, and introns in a large-scale C. briggsae–C. elegans genomic alignment. Genome Res. 10: 1115–1125. [DOI] [PubMed] [Google Scholar]
- Kiontke, K., Hironaka, M., and Sudhaus, W. 2002. Description of Caenorhabditis japonica n. sp (Nematoda:Rhabditida) associated with the burrower bug Parastrachia japonensis (Heteroptera:Cydnidae) in Japan. Nematology 4: 933–941. [Google Scholar]
- Kiontke, K., Gavin, N.P., Raynes, Y., Roehrig, C., Piano, F., and Fitch, D.H. 2004. Caenorhabditis phylogeny predicts convergence of hermaphroditism and extensive intron loss. Proc. Natl. Acad. Sci. (in press). [DOI] [PMC free article] [PubMed]
- Krause, M. and Hirsh, D. 1987. A trans-spliced leader sequence on actin mRNA in C. elegans. Cell 49: 753–761. [DOI] [PMC free article] [PubMed] [Google Scholar]
- Krzywinski, J. and Besansky, N.J. 2002. Frequent intron loss in the white gene: A cautionary tale for phylogeneticists. Mol. Biol. Evol. 19: 362–366. [DOI] [PubMed] [Google Scholar]
- Kurihara, Y., Tokuriki, M., Myojin, R., Hori, T., Kuroiwa, A., Matsuda, Y., Sakurai, T., Kimura, M., Hecht, N.B., and Uesugi, S. 2003. CPEB2, a novel putative translational regulator in mouse haploid germ cells. Biol. Reprod. 69: 261–268. [DOI] [PubMed] [Google Scholar]
- Kuwabara, P.E. 1996. Interspecies comparison reveals evolution of control regions in the nematode sex-determining gene tra-2. Genetics 144: 597–607. [DOI] [PMC free article] [PubMed] [Google Scholar]
- Kuwabara, P.E. and Shah, S. 1994. Cloning by synteny: Identifying C. briggsae homologues of C. elegans genes. Nucleic Acids Res. 22: 4414–4418. [DOI] [PMC free article] [PubMed] [Google Scholar]
- Llopart, A., Comeron, J.M., Brunet, F.G., Lachaise, D., and Long, M. 2002. Intron presence–absence polymorphism in Drosophila driven by positive Darwinian selection. Proc. Natl. Acad. Sci. 99: 8121–8126. [DOI] [PMC free article] [PubMed] [Google Scholar]
- Logsdon Jr., J.M. 1998. The recent origins of spliceosomal introns revisited. Curr. Opin. Genet. Dev. 8: 637–648. [DOI] [PubMed] [Google Scholar]
- Long, M. and Langley, C.H. 1993. Natural selection and the origin of jingwei, a chimeric processed functional gene in Drosophila. Science 260: 91–95. [DOI] [PubMed] [Google Scholar]
- Long, M., Rosenberg, C., and Gilbert, W. 1995. Intron phase correlations and the evolution of the intron/exon structure of genes. Proc. Natl. Acad. Sci. 92: 12495–12499. [DOI] [PMC free article] [PubMed] [Google Scholar]
- Luitjens, C., Gallegos, M., Kraemer, B., Kimble, J., and Wickens, M. 2000. CPEB proteins control two key steps in spermatogenesis in C. elegans. Genes & Dev. 14: 2596–2609. [DOI] [PMC free article] [PubMed] [Google Scholar]
- Luz, J.G., Hassig, C.A., Pickle, C., Godzik, A., Meyer, B.J., and Wilson, I.A. 2003. XOL-1, primary determinant of sexual fate in C. elegans, is a GHMP kinase family member and a structural prototype for a class of developmental regulators. Genes & Dev. 17: 977–990. [DOI] [PMC free article] [PubMed] [Google Scholar]
- Lynch, M. and Richardson, A.O. 2002. The evolution of spliceosomal introns. Curr. Opin. Genet. Dev. 12: 701–710. [DOI] [PubMed] [Google Scholar]
- Mendez, R. and Richter, J.D. 2001. Translational control by CPEB: A means to the end. Nat. Rev. Mol. Cell. Biol. 2: 521–529. [DOI] [PubMed] [Google Scholar]
- Mounsey, A., Bauer, P., and Hope, I.A. 2002. Evidence suggesting that a fifth of annotated Caenorhabditis elegans genes may be pseudogenes. Genome Res. 12: 770–775. [DOI] [PMC free article] [PubMed] [Google Scholar]
- Mourier, T. and Jeffares, D.C. 2003. Eukaryotic intron loss. Science 300: 1393. [DOI] [PubMed] [Google Scholar]
- Nieduszynski, C.A., Murray, J., and Carrington, M. 2002. Whole-genome analysis of animal A- and B-type cyclins. Genome Biol. 3: RESEARCH0070. [DOI] [PMC free article] [PubMed] [Google Scholar]
- Nixon, J.E., Wang, A., Morrison, H.G., McArthur, A.G., Sogin, M.L., Loftus, B.J., and Samuelson, J. 2002. A spliceosomal intron in Giardia lamblia. Proc. Natl. Acad. Sci. 99: 3701–3705. [DOI] [PMC free article] [PubMed] [Google Scholar]
- Ogg, S.C., Anderson, P., and Wickens, M.P. 1990. Splicing of a C. elegans myosin pre-mRNA in a human nuclear extract. Nucleic Acids Res. 18: 143–149. [DOI] [PMC free article] [PubMed] [Google Scholar]
- Robertson, H.M. 1998. Two large families of chemoreceptor genes in the nematodes Caenorhabditis elegans and Caenorhabditis briggsae reveal extensive gene duplication, diversification, movement, and intron loss. Genome Res. 8: 449–463. [DOI] [PubMed] [Google Scholar]
- Robertson, H.M. 2000. The large srh family of chemoreceptor genes in Caenorhabditis nematodes reveals processes of genome evolution involving large duplications and deletions and intron gains and losses. Genome Res. 10: 192–203. [DOI] [PubMed] [Google Scholar]
- Rose, T.M., Schultz, E.R., Henikoff, J.G., Pietrokovski, S., McCallum, C.M., and Henikoff, S. 1998. Consensus-degenerate hybrid oligonucleotide primers for amplification of distantly related sequences. Nucleic Acids Res. 26: 1628–1635. [DOI] [PMC free article] [PubMed] [Google Scholar]
- Roy, S.W., Nosaka, M., de Souza, S.J., and Gilbert, W. 1999. Centripetal modules and ancient introns. Gene 238: 85–91. [DOI] [PubMed] [Google Scholar]
- Roy, S.W., Fedorov, A., and Gilbert, W. 2003. Large-scale comparison of intron positions in mammalian genes shows intron loss but no gain. Proc. Natl. Acad. Sci. 100: 7158–7162. [DOI] [PMC free article] [PubMed] [Google Scholar]
- Saitou, N. and Nei, M. 1987. The neighbor-joining method: A new method for reconstructing phylogenetic trees. Mol. Biol. Evol. 4: 406–425. [DOI] [PubMed] [Google Scholar]
- Sanger, F., Nicklen, S., and Coulson, A.R. 1977. DNA sequencing with chain-terminating inhibitors. Proc. Natl. Acad. Sci. 74: 5463–5467. [DOI] [PMC free article] [PubMed] [Google Scholar]
- Spieth, J., Brooke, G., Kuersten, S., Lea, K., and Blumenthal, T. 1993. Operons in C. elegans: Polycistronic mRNA precursors are processed by trans-splicing of SL2 to downstream coding regions. Cell 73: 521–532. [DOI] [PubMed] [Google Scholar]
- Starich, T.A., Herman, R.K., and Shaw, J.E. 1993. Molecular and genetic analysis of unc-7, a Caenorhabditis elegans gene required for coordinated locomotion. Genetics 133: 527–541. [DOI] [PMC free article] [PubMed] [Google Scholar]
- Stein, L.D., Bao, Z., Blasiar, D., Blumenthal, T., Brent, M.R., Chen, N., Chinwalla, A., Clarke, L., Clee, C., Coghlan, A., et al. 2003. The genome sequence of Caenorhabditis briggsae: A platform for comparative genomics. PLoS Biol. 1: E45. [DOI] [PMC free article] [PubMed] [Google Scholar]
- Sudhaus, W. and Kiontke, K. 1996. Phylogeny of Rhabditis subgenus Caenorhabditis (Rhaditidae, Nematoda). J. Zoo. Syst. Evol. Research 34: 217–233. [Google Scholar]
- Swofford, D.L. 2000. PAUP*: Phylogenetic analysis using parsimony and other methods (software). Sinauer Associates, Sunderland, MA.
- Theis, M., Si, K., and Kandel, E.R. 2003. Two previously undescribed members of the mouse CPEB family of genes and their inducible expression in the principal cell layers of the hippocampus. Proc. Natl. Acad. Sci. 100: 9602–9607. [DOI] [PMC free article] [PubMed] [Google Scholar]
- Venkatesh, B., Ning, Y., and Brenner, S. 1999. Late changes in spliceosomal introns define clades in vertebrate evolution. Proc. Natl. Acad. Sci. 96: 10267–10271. [DOI] [PMC free article] [PubMed] [Google Scholar]
- Wada, H., Kobayashi, M., Sato, R., Satoh, N., Miyasaka, H., and Shirayama, Y. 2002. Dynamic insertion-deletion of introns in deuterostome EF-1α genes. J. Mol. Evol. 54: 118–128. [DOI] [PubMed] [Google Scholar]
- Wang, S. and Kimble, J. 2001. The TRA-1 transcription factor binds TRA-2 to regulate sexual fates in Caenorhabditis elegans. EMBO J. 20: 1363–1372. [DOI] [PMC free article] [PubMed] [Google Scholar]
- Wang, W., Yu, H., and Long, M. 2004. Duplication-degeneration as a mechanism of gene fission and the origin of new genes in Drosophila species. Nat. Genet. 36: 523–527. [DOI] [PubMed] [Google Scholar]
- Wu, L., Wells, D., Tay, J., Mendis, D., Abbott, M.A., Barnitt, A., Quinlan, E., Heynen, A., Fallon, J.R., and Richter, J.D. 1998. CPEB-mediated cytoplasmic polyadenylation and the regulation of experience-dependent translation of α-CaMKII mRNA at synapses. Neuron 21: 1129–1139. [DOI] [PubMed] [Google Scholar]


