

Abstract
Skeletal muscle is responsible for the majority of glucose disposal in body. Impairment in skeletal muscle glucose handling capacity leads to the state of insulin resistance. The TNF-like weak inducer of apoptosis (TWEAK) cytokine has now emerged as a major regulator of skeletal muscle mass and function. However, the role of TWEAK in skeletal muscle metabolic function remains less understood. Here, we demonstrate that with progressive age, skeletal muscle-specific TWEAK-transgenic (TWEAK-Tg) mice gain increased body weight (∼16%) and fat mass (∼64%) and show glucose intolerance and insulin insensitivity. TWEAK-Tg mice also exhibit adipocyte hypertrophy in the epididymal fat. Oxygen uptake, voluntary physical activity, and exercise capacity were significantly reduced in TWEAK-Tg mice compared with controls. Overexpression of TWEAK inhibited (∼31%) 5′ AMP-activated protein kinase (AMPK) and reduced (∼31%) the levels of glucose transporter type 4 (GLUT4) without affecting the Akt pathway. TWEAK also inhibited insulin-stimulated glucose uptake (∼32%) and repressed the levels of GLUT4 (∼50%) in cultured myotubes from C57BL6 mice. TWEAK represses the levels of Krüppel-like factor 15; myocyte enhancer factor 2, and peroxisome proliferator-activated receptor-γ coactivator-1α, which are required for the activation of the GLUT4 locus. Collectively our study demonstrates that elevated levels of TWEAK in skeletal muscle cause metabolic abnormalities. Inhibition of TWEAK could be a potential approach to prevent weight gain and type 2 diabetes.—Sato, S., Ogura, Y., Tajrishi, M.M., Kumar, A. Elevated levels of TWEAK in skeletal muscle promote visceral obesity, insulin resistance, and metabolic dysfunction.
Keywords: Fn14, GLUT4, type 2 diabetes, AMPK, PGC-1α
Skeletal muscle is the largest organ of the body and is responsible for ∼80% of postprandial glucose disposal primarily in an insulin-dependent manner (1). Insulin resistance in the skeletal muscle accounts for 85–90% of the impairment of total body glucose disposal in patients with type 2 diabetes (T2D) (2). In patients who have a family history of T2D, reduced insulin sensitivity is noticeable 1–2 decades prior to diagnose of the disease (3). Furthermore, nonobese patients with T2D show reduced glucose uptake in response to insulin (4).
Binding of insulin to insulin receptor triggers phosphorylation of 3 key tyrosine molecules on the IR, which leads insulin receptor substrate (IRS)-1 to localize to the cell membrane and undergo phosphorylation at specific sites. Tyrosine phosphorylation of IRS-1 results in its binding to phosphatidylinositol 3-kinase (PI3K), an increase in phosphatidylinositol 3,4,5-triphosphate, and subsequent activation of downstream Akt/protein kinase B. Activated Akt phosphorylates AS160 (Akt substrate of 160) protein, which facilitates glucose transporter type 4 (GLUT4) to translocate to the sarcolemma leading to glucose entry to the cell (5–7). Akt also deactivates glycogen synthase kinase 3 (GSK3), which leads to activation of glycogen synthesis (6). Defects in insulin signaling such as decreased tyrosine phosphorylation of IRS-1 and impaired Akt activation have been suggested as causative factors for the development of insulin resistance in skeletal muscle (8–10). In addition, AMPK is a major fuel sensing enzyme, which is regulated by the cellular AMP:ATP ratio and through phosphorylation of Thr172 within the α-catalytic subunit by upstream liver kinase B1 (LKB1) (11). Activation of AMPK in response to regular exercise and calories restriction increases skeletal muscle fatty oxidation and insulin sensitivity and decreases the prevalence of metabolic disorders. By contrast, deregulation of AMPK plays an important role in the pathogenesis of insulin resistance and metabolic syndrome-associated diseases in human and experimental animals (11).
GLUT4 is a major transporter for glucose uptake in skeletal muscle. Although many previous studies have failed to demonstrate the changes in GLUT4 levels in skeletal muscle of patients with T2D (12, 13), there are reports demonstrating that muscle-specific overexpression of GLUT4 improves glucose disposal in animal models of insulin resistance (14–16). Moreover, inactivation of GLUT4 in the skeletal muscle blunts glucose uptake, leading to insulin resistance (17). Furthermore, whole body glucose disposal is directly related with GLUT4 protein levels (18), and exercise training increases insulin-stimulated glucose disposal through increasing the gene expression of GLUT4 without affecting insulin-simulated PI3K/Akt signaling in overweight nondiabetic and T2D subjects (19), signifying that maintaining levels of GLUT4 can be a potential strategy for treatment of insulin resistance.
Studies in humans and animal models have provided strong evidence that low-grade inflammation is critically involved in development of insulin resistance and obesity (20, 21). The first direct link between inflammatory cytokines and obesity and associated insulin resistance came from a study by Hotamisligil et al. (22) demonstrating that TNF-α is overexpressed in adipose tissue, and its neutralization improves glucose metabolism in multiple animal models of obesity and diabetes. Likewise, genetic ablation of TNF-α or TNF receptor (TNFR) improves insulin sensitivity in mice fed with high-fat diet and in genetic mouse models of obesity (23). In addition to TNF-α, increased abundance of activated macrophages and other mediators of inflammation and acute phase reactants such as leptin, IL-1β, IL-6, resistin, plasminogen-activator inhibitor, C-reactive protein, monocyte chemoattractant protein-1, and angiotensinogen have been implicated in the initiation and perpetuation of the subacute inflammatory state associated with obesity (24). These inflammatory mediators produced by adipose tissues, liver, and associated monocytes create a systematic inflammatory milieu that promotes insulin resistance in other tissues such as skeletal muscle (25). However, it is notable that infusion with humanized anti–TNF-α failed to restore insulin sensitivity in T2D subjects (26), suggesting that there are potentially other mediators that cause insulin resistance in skeletal muscle.
The TNF-like weak inducer of apoptosis (TWEAK) is a proinflammatory cytokine belonging to the TNF superfamily. TWEAK is expressed in many cell types including skeletal muscle. TWEAK functions by binding to fibroblast growth factor-inducible 14 (Fn14) on target cells (27). Usually dormant due to the relatively low levels of Fn14 expressed in normal healthy tissues, the TWEAK-Fn14 axis get activated as a consequence of the highly induced local expression of Fn14 in injured and diseased tissues (27). TWEAK has been recently identified as a key mediator of skeletal muscle atrophy in many conditions such as denervation and starvation and during aging (28–30). Furthermore, TWEAK has been shown to reduce mitochondrial content, cause slow-to-fast type fiber transition, and inhibit skeletal muscle oxidative phosphorylation capacity (28, 31). However, it remains unknown whether elevated levels of TWEAK in skeletal muscle causes metabolic abnormalities.
In the present study, using muscle-specific TWEAK transgenic (Tg) mice, we investigated the role of TWEAK in skeletal muscle metabolic functions. Our results demonstrate that a small increase in the levels of TWEAK in skeletal muscle leads to epididymal fat deposition in aged mice. TWEAK-Tg mice also show reduced glucose clearance capacity, insulin insensitivity, sedentary lifestyle, and exercise intolerance compared with littermate wild-type (WT) mice. We also found that TWEAK represses gene expression of GLUT4 both in vitro and in vivo, at least in part, by repressing 5′-AMP-activated protein kinase (AMPK) signaling and reducing the levels of PGC-1α. Furthermore, TWEAK represses the levels of myocyte enhancer factor 2 (MEF2) and krüppel-like factor 15 (KLF15) transcription factors, which are essential for the gene expression of GLUT4 in skeletal muscle.
MATERIALS AND METHODS
Animals
Male TWEAK-Tg mice expressing full-length TWEAK cDNA under the control of muscle creatine kinase promoter have been previously described (28, 32). The ob/ob mice were purchased from The Jackson Laboratory (Bar Harbor, ME, USA). All the mice were in the C57BL/6 background, and their genotype was determined by PCR from tail DNA. We used 18-mo-old TWEAK-Tg and littermate WT mice for our experimentation. All experimental protocols with mice were approved in advance by the Institutional Animal Care and Use Committee at the University of Louisville.
Analysis of body composition
The body fat and lean body mass composition of mice was performed by dual-energy X-ray absorptiometry (DEXA; PIXImus2; Lunar, Madison, WI, USA).
Glycogen concentration assay
Glycogen content in skeletal muscle and liver of mice was measured using a glycogen assay kit following a protocol suggested by the manufacturer (Sigma Chemical Company, St. Louis, MO, USA).
Measurement of TWEAK protein
TWEAK concentration in skeletal muscle and serum of mice was quantified using the mouse TWEAK ELISA kit (Sigma Chemical Company).
AMPK assay
The enzymatic activity of AMPK was measured using a commercially available kit following a procedure suggested by the manufacturer (CycLex Co., Nagano, Japan).
Glucose tolerance test and insulin tolerance test
The glucose tolerance test (GTT) and insulin tolerance test (ITT) were performed following a method as previously described (5). In brief, mice were fasted for 6 h before receiving an intraperitoneal injection of sterile glucose (1 g/kg body weight in sterile saline) for GTT. ITT was performed on nonfasted mice. Soluble insulin protein (Humulin R; Eli Lilly, Indianapolis, IN, USA) was injected intraperitoneally (0.75 U/kg body weight in sterile saline) in mice. The blood glucose levels were monitored at select time points for up to 2 h. Blood samples were collected from the tail veins, and blood glucose was measured with a handheld glucometer (Accu-Chek Aviva Plus; Roche Diagnostics, Indianapolis, IN, USA). The area under the curve was calculated according to the trapezoidal rule as previously described (33). In brief, the area under the curve was divided between 2 designated values on the x axis into small segments, and each area was calculated from its respective geometrical formula. Finally, the area of individual segment was added to obtain the total area under the curve.
Metabolic cage analysis
Metabolic cage analysis was performed to measure food and water intake, indirect calorimetry, and physical locomotor activity of mice. After the system was calibrated against standard gas mixtures, individual mouse was transferred to an experimental cage (TSE LabMaster, Chesterfield, MO, USA) containing specialized lids for water and food delivery and inlet/outlet airflow. The measurement was performed for 24 h for a total of 3 d at room temperature, and the mean of each parameter was calculated. The respiratory exchange ratio was calculated as VCO2/VO2 [volume of CO2 produced per volume of O2 consumed (milliliters per kilogram per hour)]. Ambulatory horizontal physical activity was measured simultaneously with the cage system. The number of beam breaks was recorded at intervals of 10 min during the overall experimental period, and data were subsequently calculated as average number of beam breaks per hour.
Exercise tolerance test
The exercise tolerance test on mice was performed as previously described (31) with slight modifications. In brief, all mice were allowed to run on a treadmill (Columbus Instruments, Columbus, OH, USA) at 10 m/min for 5 min at 0% degree incline for acclimation for 3 d. On the exercise testing day, the mice were run on the treadmill with a fixed slope of 10%. Mice first ran at 10 m/min for 5 min, and the speed was increased by 1 m/min every 2 min until they were exhausted. The criterion of exhaustion was defined as the inability of mice to run on the treadmill for 10 s despite hand prodding. Running time and maximum speed achieved was measured, and total running distance and work were calculated.
Histology and morphometric analysis
For histologic analysis of epididymal fat, the tissue was fixed in 10% neutral formalin for 24 h prior to embedding in paraffin. For the assessment of tissue morphology, 6 µm (paraffin-embedded) thick transverse sections of tissue were stained with hematoxylin and eosin (H&E), and the photomicrographs were captured on a microscope (Eclipse TE 2000-U; Nikon, Melville, NY, USA) with a digital camera (Digital Sight DS-Fi1; Nikon) and NIS Elements BR 3.00 software (Nikon). The images were quantified using ImageJ software (U.S. National Institutes of Health, Bethesda, MD, USA) to measure cross-sectional area (CSA) of adipocytes in epididymal fat.
Isolation and culturing of primary myotubes
Mice were euthanized, and the tibial anterior (TA) and gastrocnemius muscles were isolated. Connective tissues and fats were cleaned in sterile PBS, followed by mincing of skeletal muscle in DMEM and enzymatic dissociation with 0.1% Pronase. The digested slurry was spun, pelleted, and triturated several times and then passed through a 70 μm cell strainer (BD Falcon; BD Biosciences, San Jose, CA, USA). The filtrate was spun at 1000 g and resuspended in myoblast growth medium (Ham's F-10 medium with 20% fetal bovine serum supplemented with 5 ng/ml basic fibroblast growth factor). Cells were refed after 3 d of initial plating. During the first few passages, cells were also enriched by preplating for selection of the pure myoblast population. The cells were cultured in a 1:1 ratio of myoblast growth medium and growth medium (DMEM with 20% fetal bovine serum) until they reached 80% confluence. To induce differentiation, myoblasts were incubated in differentiation medium (2% horse serum in DMEM) for 96 h.
2-Deoxy-[3H]-d-glucose uptake
Glucose uptake in cultured myotubes was measured by uptake of 2-deoxy-[3H]-d-glucose (2-DG). Myotubes were then serum starved for 4 h in DMEM before any treatment. The cells were preincubated with TWEAK, washed with Krebs-Ringer-Hepes (KRH) buffer (140 mM NaCl, 5 mM KCl, 50 mM HEPES, 5 mM KCl, 2.5 mM MgSO4, and 1.0 mM CaCl2, pH 7.4), and stimulated by insulin (100 nM; 20 min). After insulin stimulation, the cells were washed with KRH buffer, and glucose uptake was determined by adding 2-DG in KRH buffer for 20 min at room temperature. The cells were washed by KRH buffer and harvested in 0.05 N NaOH to determine net accumulation of 2-DG by scintillation counter.
RNA isolation and quantitative real time-PCR
RNA isolation and quantitative real time-PCR (QRT-PCR) were performed as previously described (28). The sequence of the primers used is presented in Supplemental Table S1.
Western blot
Immunoblotting was performed following a method that has been previously described (28). The dilution of primary antibodies was as follows: anti–phospho-Akt and anti-Akt (1:1000; Cell Signaling, Danvers, MA, USA), anti–phospho-AMPK and anti-AMPK (1:1000; Cell Signaling), anti–phospho-mTOR and anti-mTOR (1:1000; Cell Signaling); anti-GLUT4 (1:1000, Abcam, Cambridge, MA, USA), anti–phospho-p70S6K (1:500; Cell Signaling), anti-p70S6K (1:1000; Cell Signaling), anti–phospho-LKB1 (1:500; Santa Cruz Biotechnology, Santa Cruz, CA, USA), anti-LKB1 (1:500; Santa Cruz Biotechnology), anti-phospho-GSK3β (1:1000; Cell Signaling), anti-GSK3β (1:1000; Cell Signaling), anti–phospho-AS160 and anti-AS160 (1:1000; Cell Signaling), anti-PP2Cα (1:500; R&D Systems, Minneapolis, MN, USA), and anti-tubulin (1:3000; Cell Signaling). Immunoblots were digitally scanned, and bands were quantified using ImageJ software (U.S. National Institutes of Health).
Statistical analysis
Comparisons between 2 groups were performed with unpaired Student t test (2-tailed), and results are expressed as mean ± sd. A value of P < 0.05 was considered statistically significant.
RESULTS
Body weight and fat mass are increased, whereas lean mass is decreased in TWEAK-Tg mice
Although high levels of TWEAK in skeletal muscle (>17-fold compared with controls) cause neonatal lethality (32), adult muscle-specific TWEAK-Tg mice expressing 4- to 5-fold higher TWEAK mRNA levels are indistinguishable from littermate WT mice with respect to body weight or lean mass, potentially due to expression of very low to undetectable levels of Fn14 (TWEAK receptor) in adult skeletal muscle (28, 32). At an older age (>6 mo), skeletal muscle of mice starts expressing significantly higher amounts of Fn14 as a result of an unknown age-related event with concomitant decrease in myofiber CSA (28, 30). However, the effects of chronic muscle-specific increase of TWEAK levels on various metabolic parameters remain unknown. To understand the role of elevated levels of TWEAK on whole body metabolism, male TWEAK-Tg and littermate WT mice were provided standard rodent chow and water ad libitum. Intriguingly, we found that there was no significant difference in the body weight between in 4-mo-old littermate WT and TWEAK-Tg mice (Fig. 1C). However, with progressive age, TWEAK-Tg mice started gaining more weight compared with littermate controls, and differences in mice size became clearly visible at the age of 18 mo (Fig. 1A). Body weight of 18-mo-old TWEAK-Tg mice was ∼16% higher compared with littermate control mice (Fig. 1C). By performing DEXA, we also evaluated whole body composition of 18-mo-old littermate WT and TWEAK-Tg mice (Fig. 1B). This analysis showed that TWEAK-Tg mice have significantly increased fat mass (∼64%) and percentage body fat (∼39%) compared with littermate WT mice (Fig. 1D, E). By contrast, lean mass was significantly decreased in TWEAK-Tg compared with littermate WT mice (Fig. 1F).
Figure 1.
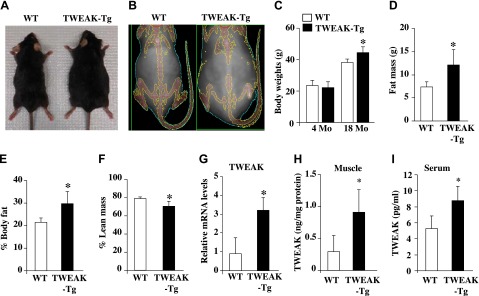
Increased body weight and fat mass in TWEAK-Tg mice. A) Representative photomicrographs presented here shows that 18-mo-old TWEAK-Tg mice are larger in size compared with littermate WT mice. B) Representative DEXA image of 18-mo-old male WT and TWEAK-Tg mice. C) Average body weight of 4- and 18-mo-old WT and TWEAK-Tg mice. Quantitative estimation of (D) fat mass, (E) percentage body fat, and (F) lean mass evaluated by whole body DEXA analysis of 18-mo-old WT and TWEAK-Tg mice. G) Gastrocnemius (GA) muscle from 18-mo-old WT and TWEAK-Tg mice were isolated and processed to measure mRNA levels of TWEAK. N = 5 in each group. Protein levels of TWEAK in (H) gastrocnemius muscle and (I) serum of 18-mo-old WT and TWEAK-Tg mice measured by ELISA. Error bars represent sd. *P < 0.05, values significantly different from littermate WT mice.
By performing QRT-PCR analysis, we quantified transcript levels of TWEAK in skeletal muscle of littermate WT and TWEAK-Tg mice. There was an ∼3-fold increase in the mRNA levels of TWEAK (Fig. 1G), whereas no significant difference was observed in mRNA levels of TWEAK receptor Fn14 in skeletal muscle of WT and TWEAK-Tg mice (data not shown). TWEAK is initially synthesized as a membrane-anchored protein but cleavage by furin can generate a secreted TWEAK isoform. Both membrane-bond and soluble TWEAK isoforms bind to Fn14 receptor and produce various cellular responses (27). We next quantified protein levels of TWEAK in skeletal muscle and serum of TWEAK-Tg mice by performing ELISA. There was a significant increase in the protein levels of TWEAK in both skeletal muscle and serum of TWEAK-Tg mice compared with littermate WT mice (Fig. 1H, I). These results provide initial evidence that increased levels of TWEAK in skeletal muscle cause weight gain in aging mice.
TWEAK-Tg mice exhibit decreased glucose disposal capacity and reduced glycogen content in skeletal muscle
A strong relationship between obesity and insulin resistance has been well recognized (34). Because 18-mo-old TWEAK-Tg mice develop obesity, we next investigated whether whole body glucose disposal and insulin sensitivity are affected in TWEAK-Tg mice. The GTT and ITT were performed to evaluate the difference of these metabolic parameters between 18-mo-old littermate WT and TWEAK-Tg mice. There was no significant difference in the fasting glucose level between WT and TWEAK-Tg mice. However, levels of plasma glucose in GTT were significantly higher at 30 and 60 min after glucose injection in the glucose response curve of TWEAK-Tg mice (Fig. 2A). Calculating the product of the areas under glucose curves obtained in the GTT showed that the mean area under the curve in TWEAK-Tg mice was ∼22% higher, suggesting increased hyperglycemia in response to glucose load and decreased whole body glucose disposal compared with littermate WT mice (Fig. 2B). In ITT, we found that the levels of plasma glucose were significantly higher at baseline and at 15 and 30 min in TWEAK-Tg mice (Fig. 2C). Calculating the product of the areas under glucose curves obtained in ITT showed that compared with littermate WT mice, TWEAK-Tg mice exhibited significantly reduced (∼21%) hypoglycemic response to insulin, indicating that TWEAK-Tg have decreased insulin sensitivity (Fig. 2D).
Figure 2.
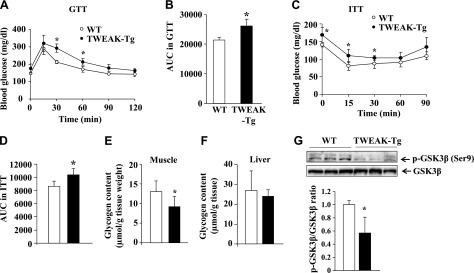
TWEAK-Tg mice show glucose intolerance and insulin insensitivity. A) GTT. Glucose (1 g/kg i.p.) was given to 18-mo-old WT (○) and TWEAK-Tg (●) mice, and plasma glucose levels were measured at 0, 15, 30, 60, 90, and 120 min. B) Area under the curve for intraperitoneal GTT. C) ITT. Insulin (0.75 U/kg i.p.) was given to 18-mo-old WT (○) and TWEAK-Tg (●) mice, and plasma glucose levels were measured at 0, 15, 30, 60, and 90 min. D) Area under the curve for intraperitoneal ITT. N = 5 in each group for both GTT and ITT. Error bars represent sd. *P < 0.05, values significantly different from littermate WT mice. Glycogen concentration in (E) gastrocnemius muscle and (F) liver of WT and TWEAK-Tg mice. G) Gastrocnemius muscle from 18-mo-old WT and TWEAK-Tg mice were isolated and processed for Western blot to detect GSK3β (Ser9) phosphorylation and total GSK3β. Representative immunoblots and densitometry quantification presented here demonstrate that the phosphorylation of GSK3β at Ser9 residue is significantly reduced in skeletal muscle of TWEAK-Tg mice compared with littermate WT mice. N = 5 in each group. Error bars represent sd. *P < 0.05, values significantly different from littermate WT mice.
We also performed the ITT and GTT on 4-mo-old WT and TWEAK-Tg mice. Consistent with our observations that the adult mice do not express TWEAK receptor Fn14 in naïve conditions (30, 35), we did not find any significant difference in GTT or ITT between 4-mo-old WT and TWEAK-Tg mice (Supplemental Fig. S1A–D).
Skeletal muscle and liver are the major tissues that absorb glucose from blood and store them in the form of glycogen. Because TWEAK-Tg mice have reduced glucose disposal capacity, we next investigated whether there is any difference in the levels of glycogen in skeletal muscle and liver of 18-mo-old WT and TWEAK-Tg mice. Interestingly, the amount of glycogen was significantly reduced in skeletal muscle of TWEAK-Tg mice compared with WT mice (Fig. 2E). However, there was no significant difference in glycogen content in the liver of WT and TWEAK-Tg mice (Fig. 2F). The GSK3β is an important regulator of glycogen metabolism that phosphorylates and inhibits the activity of glycogen synthase, the rate-limiting enzyme of glycogen synthesis (36). Phosphorylation at the serine 9 (Ser9) residue in GSK3β by upstream kinases such as p90 ribosomal s6 kinase results in the inactivation of GSK3β (37). Our results showed that the levels of phosphorylated GSK3β (at Ser9) were significantly inhibited in skeletal muscle of TWEAK-Tg mice (Fig. 2G), suggesting higher activation of GSK3β and hence reduced activity of glycogen synthase. Collectively, these results suggest that the increased amounts of TWEAK diminishes glucose uptake and glycogen synthesis in skeletal muscle of mice.
TWEAK-Tg mice exhibit reduced whole body metabolism, voluntary physical activity, and exercise tolerance
To assess the impact of disrupted whole-body energy metabolism due to chronically elevated levels of TWEAK in skeletal muscle, we analyzed several aspects of behavior relevant to energy homeostasis by indirect calorimetry and physical activity measurement. Each group of mice was individually placed in the metabolic cages to monitor their indirect caloric intake and horizontal voluntary movements for 24 h. TWEAK-Tg mice showed a significant decrease in O2 consumption during both the light and dark phase of activity compared with littermate WT mice (Fig. 3A). Similarly, CO2 production in TWEAK-Tg mice decreased in the light phase and dark phase of activity (Fig. 3B). There was also a significant decrease in the rates of O2 consumption and CO2 production in TWEAK-Tg mice compared with WT mice in the dark phase when the mice were compared based on their lean body mass (Supplemental Fig. S1E, F). As a consequence, respiratory exchange ratio was significantly decreased (Fig. 3C), indicating that elevated levels of TWEAK in skeletal muscle of mice cause reduction in whole body metabolism and a switch toward fat metabolism. TWEAK-Tg mice also showed a significant decrease in voluntary physical activity compared with littermate WT mice, assessed by the number of beam crossing during the dark phase of activity in a 24 h measurement period (Fig. 3D).
Figure 3.
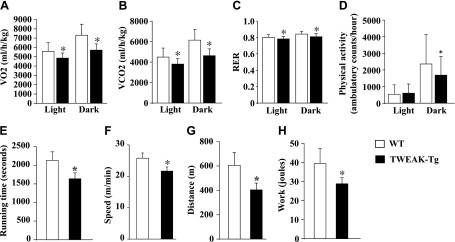
Whole-body metabolism, locomotor activity, and exercise capacity are decreased in TWEAK-Tg mice. Each group of mice was placed in metabolic cage and monitored over 24 h in 12-h light (6:00 am to 6:00 pm), 12-h dark (6:00 pm to 6:00 am) conditions. Data presented here demonstrate differences in (A) oxygen consumption rate (VO2); (B) carbon dioxide production rate (VCO2); (C) respiratory exchange ratio; and (D) ambulatory physical activity between 18-mo-old littermate WT and TWEAK-Tg mice. After acclimatization, mice were run on a treadmill with a 10% slope and increasing speed to exhaustion. Maximum speed and running time were monitored, and distance and work were calculated based on the individual performance. Data presented here show differences in (E) running time; (F) maximum running speed; (G) distance, and (H) work between 18-mo-old littermate WT and TWEAK-Tg mice. N = 5 in each group. Error bars represent sd. *P < 0.05, values significantly different from littermate WT mice.
Increased body weight is generally associated with reduced physical performance. Following a treadmill-based exercise tolerance protocol, we next sought to determine whether impairment of glucose metabolism in TWEAK-Tg mice has any effect on their exercise capacity. As shown in Fig. 3E, TWEAK-Tg mice stopped running earlier compared with WT mice (1626 s for TWEAK-Tg versus 2134 s for the controls). Because WT mice kept running on higher speed (25.8 m/min for WT mice versus 21.6 m/min for TWEAK-Tg mice; Fig. 3F), the difference in running distance became >50% (403 m for TWEAK-Tg mice versus 606 m for WT mice; Fig. 3G). As a result, work generated by TWEAK-Tg mice was lower compared with WT mice. TWEAK-Tg mice generated 28.8 J of work, whereas WT mice generated 39.4 J of work (a difference of 37%) during the exercise tolerance test (Fig. 3H). These results suggest that impaired glucose metabolism compels TWEAK-Tg mice to rely on fat as fuel and to be less vigorous during their active phase of daily activity potentially due to their decreased capacity to utilize relative instant source of energy.
Visceral fat deposition and adipocyte hypertrophy in TWEAK-Tg mice
Because TWEAK-Tg mice have increased body and fat mass, we investigated whether there is any difference in fat mass and size of adipocytes. Interestingly, epididymal fat mass appeared considerably larger in TWEAK-Tg mice compared with littermate WT mice (Fig. 4A). Quantitative estimation also showed that epididymal fat mass is significantly increased in 18-mo-old TWEAK-Tg compared with littermate WT mice (Fig. 4B). There was also a similar increase in the perirenal and mesenteric fat deposits in TWEAK-Tg mice (data not shown). We next made sections of the epididymal fat tissue, performed H&E staining, and quantified CSA of adipocytes (Fig. 4C). There was an increased number of larger diameter and a decreased number of smaller diameter adipocytes in the size distribution analysis (Fig. 4D). This analysis also showed that average adipocyte CSA of epididymal fat was significantly higher in TWEAK-Tg mice compared with littermate WT mice (Fig. 4E).
Figure 4.
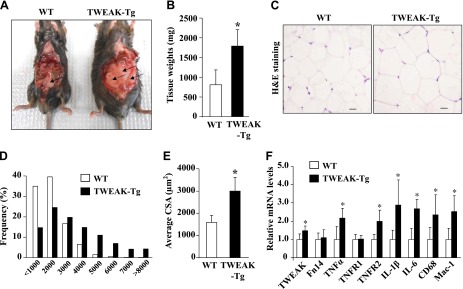
Effect of skeletal muscle-specific transgenic overexpression of TWEAK on epididymal fat. A) Representative photomicrographs demonstrating epididymal fat in 18-mo-old littermate WT and TWEAK-Tg mice. Arrows point to epididymal fat. B) Quantification of epididymal fat tissue weight from WT and TWEAK-Tg. C) Representative H&E staining images of epididymal fat tissue isolated from TWEAK-Tg and WT mice. Scale bars: 20 μm. D) Adipocyte size distribution between TWEAK-Tg and WT mice. E) Average CSA of adipocytes in epididymal fat of WT and TWEAK-Tg mice. F) Epididymal fat from 18-mo-old WT and TWEAK-Tg mice were isolated and processed to measure mRNA levels of TWEAK, Fn14, TNF-α, TNFRI, TNFRII, IL-1β, IL-6, CD68, and Mac-1 by performing QRT-PCR. Error bars represent sd. *P < 0.05, values significantly different from littermate WT mice. N = 5 in each group.
Enlarged adipocytes of obese individuals recruit macrophages, promote low-grade inflammation, and release a range of factors that predispose toward insulin resistance (24, 25). By performing the QRT-PCR assay, we next sought to determine whether the markers of inflammation are increased in epididymal fat of TWEAK-Tg mice. As shown in Fig. 4F, mRNA levels of IL-1β, IL-6, TNF-α, and TNFR2 were significantly higher in epididymal fat of TWEAK-Tg mice compared with littermate WT mice. Furthermore, mRNA levels of CD68 and Mac-1, the cell surface markers for inflammatory macrophages, were found to be significantly increased in the epididymal fat of TWEAK-Tg mice compared with WT mice (Fig. 4F). Intriguingly, we also found a small but significant increase in mRNA levels of TWEAK (but not Fn14) in the epididymal fat of TWEAK-Tg mice (Fig. 4F). Being an inflammatory cytokine, this increase appears to be a result of obesity and is not due to leakage of the muscle creatine kinase promoter because there was no difference in mRNA levels of TWEAK in epididymal fat of 3-mo-old TWEAK-Tg mice, which do not show any weight gain or obesity phenotype (data not shown). Although we found increased gene expression of inflammatory molecules in adipose tissue, there was no significant difference in mRNA levels of these molecules in skeletal muscle or liver of WT and TWEAK-Tg mice (Supplemental Fig. S2). Taken together, these results suggest that increased levels of TWEAK in skeletal muscle promote weight gain and visceral obesity in mice.
To further understand the TWEAK-Fn14 system in the development of metabolic abnormalities leading to obesity, we also measured the levels of TWEAK and Fn14 in skeletal muscle of diabetic mice. Our results showed that the expression of the TWEAK receptor Fn14 is significantly increased in the skeletal muscle of streptozotocin-induced diabetes in C57BL/6 mice and in ob/ob (a model of T2D) mice (Supplemental Fig. S3). These results indicate that increased activity of TWEAK-Fn14 system may be contributing factor to metabolic abnormalities in diabetic conditions.
Skeletal muscle mass is reduced in 18-mo-old TWEAK-Tg mice
Our previous studies have shown that elevated levels of TWEAK induce skeletal muscle atrophy in mice (28, 32). By isolating skeletal muscle and performing morphometric analysis, we next investigated whether an ∼3-fold increase in the levels of TWEAK is sufficient to reduce skeletal muscle mass in 18-mo-old mice. The hind limb skeletal muscle of 18-mo-old TWEAK-Tg and littermate WT mice were isolated, and their wet weight was measured. Results showed that wet gastrocnemius and plantaris muscle mass was significantly decreased (P < 0.05), whereas there was also a trend toward reduced TA muscle mass (P = 0.058) in TWEAK-Tg mice compared with littermate WT mice (Table 1). There was no significant difference in heart, liver, and spleen weight between WT and TWEAK-Tg mice, suggesting that a small increase in the levels of TWEAK in skeletal muscle does not cause any systemic effect in other tissues except visceral fat of mice (Table 1).
TABLE 1.
Wet tissue weight (in milligrams) in WT and TWEAK-Tg mice
| Tissue | WT | TWEAK-Tg |
|---|---|---|
| Liver | 1532 ± 321 | 1561 ± 302 |
| Spleen | 106 ± 10 | 106 ± 19 |
| Heart | 166 ± 7 | 161 ± 13 |
| Plantaris | 21.4 ± 0.6 | 18.5 ± 1.7* |
| Gastrocnemius | 144 ± 4.5 | 133 ± 5.3* |
| TA | 54.5 ± 2.2 | 51.0 ± 2.0 |
Data are represented as mean ± sd. N = 5 in each group. *P < 0.05, values vary significantly between WT and TWEAK-Tg mice.
We previously reported that TWEAK induces slow-to-fast type fiber transition in the skeletal muscle of 6-mo-old mice (28). By performing the QRT-PCR assay for fiber type-specific myosin heavy chains (MyHC), we also investigated the fiber type composition in skeletal muscle of 18-mo-old WT and TWEAK-Tg mice. Results showed that the mRNA levels of MyHC IIA (fast-oxidative) were significantly decreased, whereas the mRNA of MyHC IIB (fast-glycolytic) was significantly increased in skeletal muscle of TWEAK-Tg mice compared with WT mice (Supplemental Fig. S4A), suggesting that a small increase in the levels of TWEAK is sufficient to cause fiber type transition that may change metabolic phenotype and lead to exercise intolerance in mice.
Chronic overexpression of TWEAK in skeletal muscle inhibits AMPK and represses levels of PGC-1α and hexokinase II
To understand the mechanisms by which TWEAK regulates skeletal muscle metabolic function, we first investigated whether the overexpression of TWEAK in skeletal muscle affects the activation of the PI3K/Akt pathway in skeletal muscle. Interestingly, there was no significant difference in the levels of phosphorylation of Akt or its downstream phosphorylation targets mTOR and p70S6 kinase in skeletal muscle of WT and TWEAK-Tg mice (Fig. 5A). Activation of inflammatory signaling pathways such as JNK1/2 and NF-κB led to insulin resistance in skeletal muscle (24, 25). However, our analysis showed that there was no significant difference in the phosphorylation levels of JNK1/2 and DNA-binding activity of NF-κB (data not shown) in skeletal muscle of WT and TWEAK-Tg mice.
Figure 5.
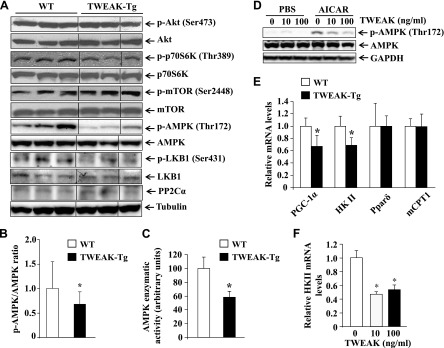
Reduced phosphorylation of AMPK and repression of PGC-1α and HKII in skeletal muscle of TWEAK-Tg mice. Gastrocnemius muscle from 18-mo-old WT and TWEAK-Tg mice were isolated and processed for Western blot. A) Representative immunoblots presented here demonstrate that the phosphorylation of AMPK and LKB1 is reduced, whereas there was no difference in the phosphorylation or total levels of Akt, mTOR, and p70S6K in skeletal muscle of WT and TWEAK-Tg mice. Total protein levels of PP2Cα did not show any change between WT and TWEAK-Tg mice. Black lines indicate that intervening lanes have been spliced out. B) Ratios of phosphorylated and total AMPK in gastrocnemius muscle of WT and TWEAK-Tg mice measured by densitometry analysis of immunoblots. C) Enzymatic activity of AMPK measured by a commercially available kit in gastrocnemius muscle of WT and TWEAK-Tg mice. D) Mice primary myotubes were treated with indicated concentration of TWEAK protein for 18 h followed by treatment with 1 mM AICAR for 3 h and measurement of phosphorylated AMPK levels. Representative immunoblots presented here demonstrate that TWEAK inhibits the AICAR-stimulated phosphorylation of AMPK. E) Transcript levels of PGC-1α, HKII, Pparδ, and mCPT1 in gastrocnemius muscle of WT and TWEAK-Tg mice assayed by performing QRT-PCR. F) QRT-PCR analysis demonstrating that TWEAK represses the mRNA levels of HKII in cultured myotubes. N = 5 in each group. Error bars represent sd. *P < 0.05, values significantly different from littermate WT mice.
It has been shown that AMPK regulates glucose uptake independent of insulin in the skeletal muscle, and its increased activity results in the enhancement of GLUT4 expression by inhibiting the histone deacetylase 5 (HDAC5) transcriptional repressor (38–40). Interestingly, our results showed that the levels of phosphorylated AMPK were significantly reduced in TWEAK-Tg mice compared with WT mice (Fig. 5A, B). Furthermore, the enzymatic activity of AMPK was found to be significantly reduced in skeletal muscle of TWEAK-Tg mice compared with WT mice (Fig. 5C). Phosphorylation levels of LKB1, an upstream activator of AMPK, were also found to be significantly reduced in skeletal muscle of TWEAK-Tg mice compared with WT mice (Fig. 5A and Supplemental Fig. S4B). By contrast, there was no significant difference in the levels of protein phosphatase 2Cα, which is known to dephosphorylate AMPK (Fig. 5A and Supplemental Fig. S4C). 5-Aminoimidazole-4-carboxamide ribonucleoside (AICAR) is an AMP mimetic that increases glucose uptake in skeletal muscle through activating AMPK (41). Using cultured primary myotubes, we investigated whether TWEAK can also inhibit the activation of AMPK in response to AICAR. As shown in Fig. 5D, TWEAK reduced the AICAR-stimulated phosphorylation of AMPK in cultured primary myotubes in a dose-dependent manner.
We also measured the expression levels of some genes whose products are involved in metabolic controls. The levels of PGC-1α and hexokinase II (HK II) expression are reduced in obesity (42, 43). Moreover, PGC-1α is a key target of AMPK to up-regulate gene expression of GLUT4 (44). We investigated whether the gene expression of PGC-1α and HK II are affected in skeletal muscle of TWEAK-Tg mice. Our analysis showed that mRNA levels of both PGC-1α and HK II were significantly reduced in TWEAK-Tg mice compared with WT mice (Fig. 5E). By contrast, transcript levels of peroxisome proliferator-activated receptor δ (PPARδ) and muscle carnitine palmitoyltransferase-1, which are related to fat metabolism, were comparable in skeletal muscle of WT and TWEAK-Tg mice (Fig. 5E). We previously reported that TWEAK represses the expression of PGC-1α in cultured primary myotubes and C2C12 myotubes (31, 35). To validate the effects of TWEAK on the gene expression of HK II, we treated cultured myotubes with TWEAK protein. As shown in Fig. 5F, TWEAK significantly repressed the mRNA levels of HK II in myotubes. Taken together, these results suggest that TWEAK inhibits AMPK pathway and gene expression of PGC-1α and HK II, which may be responsible for the development of glucose intolerance and metabolic abnormalities in TWEAK-Tg mice.
TWEAK represses the levels of GLUT4 in skeletal muscle
GLUT4 is a major glucose transporter in skeletal muscle, and repression of GLUT4 usually results in hyperglycemia (45).
To further understand the mechanisms of action of TWEAK in skeletal muscle, we compared mRNA and protein levels of GLUT4 in skeletal muscle of WT and TWEAK-Tg mice. Intriguingly, both mRNA and protein levels of GLUT4 were significantly reduced in skeletal muscle of 18-mo-old TWEAK-Tg mice compared with WT mice (Fig. 6A–C). GLUT4 is sequestered in intracellular vesicles in muscle cells in the low insulin condition. Insulin stimulates the translocation of GLUT4 from vesicles to the plasma membrane to increase the uptake of glucose. AS160 is one of the important proteins in the insulin-stimulated pathway that gets phosphorylated and promotes the translocation of GLUT4 to membrane (46). We measured phosphorylation levels of AS160 in skeletal muscle of WT and TWEAK-Tg mice. This analysis showed that there was no significant difference in the level of phosphorylation of AS160 in skeletal muscle of WT and TWEAK-Tg mice (Fig. 6B, D), suggesting that TWEAK does not affect the translocation of GLUT4 from intracellular vesicles to the membrane, which is consistent with the findings that there is no difference in the levels of phosphorylation of Akt in the skeletal muscle of WT and TWEAK-Tg mice.
Figure 6.

TWEAK inhibits GLUT4 expression in vivo. A) Transcript levels of GLUT4 in gastrocnemius muscle of WT and TWEAK-Tg mice measured by QRT-PCR technique. B) Representative immunoblots presented here show protein levels of GLUT4 and phosphorylated and total AS160 in gastrocnemius muscle of littermate WT and TWEAK-Tg mice. C) Quantification of relative GLUT4 protein levels in gastrocnemius muscle of WT and TWEAK-Tg mice. D) Ratios of phosphorylated and total AS160 protein in WT and TWEAK-Tg mice. E) Transcript levels of Mef2A, Mef2B, Mef2C, Mef2D, MyoD, and Klf15 in gastrocnemius muscle of 18-mo-old littermate WT and TWEAK-Tg mice. N = 5 in each group. Error bars represent sd. *P < 0.05, values significantly different from littermate WT mice.
Promoter analysis has shown that several transcription factors such as MEF2s, MyoD, and Klf15 regulate the gene expression GLUT4 in skeletal muscle (45). To understand the mechanisms by which TWEAK inhibits GLUT4, we also measured transcript levels of these transcription factors. Interestingly, mRNA levels of Mef2B and Klf15 were found to be significantly reduced in skeletal muscle of TWEAK-Tg mice compared with WT mice (Fig. 6E).
TWEAK inhibits glucose uptake and gene expression of GLUT4 in cultured myotubes
Because TWEAK-Tg mice show glucose intolerance, we next sought to obtain direct evidence whether TWEAK affects glucose uptake in cultured myotubes. As shown in Fig. 7A, pretreatment of myotubes with TWEAK significantly reduced (∼14%) uptake of 2-DG in response to insulin (Fig. 7A), suggesting that TWEAK inhibits insulin-induced glucose uptake in myotubes. We also studied whether TWEAK affects the gene expression of GLUT4 in cultured myotubes. Interestingly, treatment with TWEAK dramatically reduced the transcript and protein levels of GLUT4 in cultured myotubes (Fig. 7B, C). Furthermore, treatment with TWEAK significantly reduced the mRNA levels of Mef2A, Mef2B, Mef2C, Mef2D, and Klf15 (Fig. 7D). Intriguingly, a recent study has shown that TWEAK inhibits insulin-stimulated PI3K/Akt signaling in cultured hepatocytes (47). We investigated whether TWEAK can inhibit insulin-stimulated Akt phosphorylation in cultured myotubes. Mouse primary myotubes were treated with increasing concentration of TWEAK for 18 h, followed by addition of insulin and measurement of Akt phosphorylation by performing Western blot. As shown in Fig. 7E, insulin increased the phosphorylation of Akt in myotubes. However, TWEAK had no effect on the insulin-stimulated phosphorylation of Akt (Fig. 7E). These results further emphasize that the repression of GLUT4 levels could be an important mechanism by which TWEAK inhibits glucose uptake in skeletal muscle.
Figure 7.
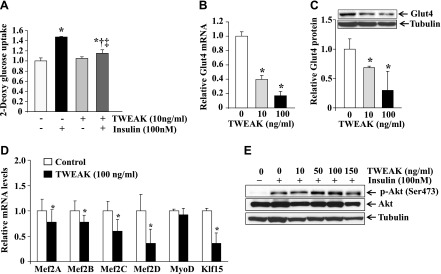
TWEAK inhibits glucose uptake and gene expression of GLUT4 in cultured myotubes. A) 2-DG uptake in response to insulin in the absence or presence of TWEAK (10 ng/ml) in cultured primary myotubes. N = 3 in each group. B) Primary myotubes were treated with indicated concentration of TWEAK for 18 h, and mRNA levels of GLUT4 were measured by performing QRT-PCR. N = 4 in each group. C) Primary myotubes were treated with indicated concentrations of TWEAK for 18 h followed by measurement of protein levels of GLUT4 by performing Western blot. Representative immunoblots and densitometry analysis of GLUT4 levels from 3 replicates (N = 3) are presented here. D) Primary myotubes were treated with TWEAK protein (100 ng/ml) for 18 h, and the mRNA levels of Mef2A, Mef2B, Mef2C, Mef2D, MyoD, and Klf15 were measured by performing QRT-PCR. N = 4 in each group. E) Primary myotubes were treated with increasing concentration of TWEAK for 18 h followed by treatment with insulin for 20 min. The levels of phosphorylated Akt were measured by performing Western blot. Representative immunoblots presented here are from 2 independent experiments. *†‡P < 0.05: *values vary significantly from control; †value varies significantly from that with insulin administration; and ‡value varies significantly from that with TWEAK administration.
DISCUSSION
A low-grade proinflammatory state, mediated by the elevated levels of proinflammatory cytokines, is at the core of the pathogenesis of obesity and T2D (25). TWEAK is an important inflammatory cytokine that is produced by a variety of cell types including macrophages, skeletal muscle, and adipocytes. Increased levels of TWEAK and its receptor Fn14 have been observed in subcutaneous and visceral adipose tissue of obese subjects (48). More recently, Bennett et al. demonstrated that TWEAK promotes maladaptive gonadal adipose tissue remodeling, leading to systemic metabolic complications in mice fed a high-fat diet (49). Our results in the present study demonstrate that TWEAK-Tg mice expressing ∼3-fold higher levels of TWEAK in skeletal muscle gain increased body weight and exhibit significantly reduced glucose clearance capacity, insulin insensitivity, whole body metabolism, voluntary physical activity, and exercise tolerance compared with WT mice. It is noteworthy that adult 4-mo-old TWEAK-Tg mice do not show any difference in body weight (Fig. 1C) or glucose or insulin tolerance (Supplemental Fig. S1A–D) but with progressive age, they become obese and show glucose intolerance and insulin insensitivity (Figs. 1 and 2). Although the exact mechanisms remain enigmatic, this phenomenon could be attributed to the fact that skeletal muscle of naïve adult mice do not express Fn14; hence, the TWEAK-Fn14 signaling pathway remains dormant even if the levels of TWEAK are increased (27, 28, 35). However, the expression levels of Fn14 in skeletal muscle are increased with progressive age, potentially through epigenetic mechanisms such as changes in promoter DNA methylation status (30, 50), leading to the activation of TWEAK-Fn14 signaling and ensuing effects on skeletal muscle mass and metabolism.
The increased body weight and associated metabolic abnormalities in TWEAK-Tg mice appears to be a result of decrease in glucose clearance from the body. Insulin robustly stimulates the transport of glucose out of the bloodstream and into tissues, such as skeletal muscle, that express the insulin-regulated glucose transporter GLUT4. Because of the high responsiveness of skeletal muscle to insulin and the large overall mass of skeletal muscle, most glucose that is cleared from the blood in response to insulin in humans is stored as glycogen in skeletal muscle. Insulin resistance in skeletal muscle results in an inability to keep blood glucose concentrations leading to the formation of new fatty tissue and accelerates weight gain (2, 3, 5). Our study provides evidence that TWEAK-Tg mice have reduced glucose clearance capacity compared with WT mice, potentially due to reduced overall skeletal muscle mass (Table 1) and changes in metabolic parameters that reduce its ability to absorb glucose (Fig. 2). This premise is supported by our results demonstrating that pretreatment with soluble TWEAK protein significantly inhibits the insulin-stimulated glucose uptake in cultured primary myotubes (Fig. 7A). Furthermore, a significant reduction in glycogen content and activation of GSK3β indicate that glycogen synthesis is significantly reduced in skeletal muscle of TWEAK-Tg mice (Fig. 2E, G).
Although TWEAK is an important proinflammatory cytokine and its levels are increased in plasma of TWEAK-Tg mice (Fig. 1I), it did not produce any systematic inflammatory effects on various tissues including skeletal muscle. There was no difference in the expression levels of inflammatory molecules in skeletal muscle or liver of TWEAK-Tg mice (Supplemental Fig. S2). We observed increased expression of inflammatory molecules in epididymal fat that is generally a hallmark of obesity, which is clearly evident in TWEAK-Tg mice (Fig. 4). Moreover, the wet weight of many other tissues except skeletal muscle and visceral fat remained comparable between WT and TWEAK-Tg mice (Table 1). Furthermore, we did not find any fatty accumulation in the skeletal muscle or liver of 18-mo-old TWEAK-Tg mice (data not shown). These results suggest that TWEAK produces metabolic abnormalities primarily through affecting the expression of specific signaling pathways and expression of certain genes whose products are involved in regulation of glucose metabolism in skeletal muscle (Fig. 8). However, at present we cannot rule out the possibility that very high levels of TWEAK or in conditions where the levels of Fn14 are dramatically induced, TWEAK-Fn14 signaling can produce systematic effects. Indeed, TWEAK has been shown to cause inflammation and fibrosis in response to tissue injury and in multiple diseases states (27).
Figure 8.

Proposed mechanisms of action of TWEAK in skeletal muscle leading to metabolic dysfunction and obesity. A putative model summarizing the effects of TWEAK on various pathways and gene expression in skeletal muscle supported by the results presented in this study.
The PI3K-Akt signaling pathway has been strongly implicated in the regulation of insulin signaling because Akt2-null mice exhibit insulin resistance and a diabetic phenotype (51). Recently, AS160 (Akt substrate of 160 kDa) was identified as the Akt target that induces GLUT4 trafficking to the plasma membrane (7). Intriguingly, there was no significant difference in the levels of phosphorylated Akt or its downstream substrates in the skeletal muscle of WT and TWEAK-Tg mice (Fig. 5A). Furthermore, the level of phosphorylation of AS160 was comparable between WT and TWEAK-Tg mice (Fig. 6B, D). Along similar lines, we previously reported that TWEAK does not affect the activation of the Akt pathway in skeletal muscle in response to cardiotoxin-mediated injury or denervation (28, 52). Moreover, our results show that TWEAK does not affect insulin-stimulated phosphorylation of Akt in cultured myotubes (Fig. 7E). In contrast to our results, Feng et al. reported that TWEAK inhibits insulin signaling including the phosphorylation of Akt in hepatocytes (47). Although precise reasons for this phenomenon remain unclear, it is possible that different cell types respond differentially to TWEAK cytokine.
Strikingly, our results demonstrate that the phosphorylation of AMPK and its upstream kinase liver kinase B1 (LKB1) is significantly reduced in skeletal muscle of TWEAK-Tg mice (Fig. 5A, B). Furthermore, enzymatic activity of AMPK was significantly reduced in TWEAK-Tg mice (Fig. 5C), and AICAR-stimulated phosphorylation of AMPK is inhibited by TWEAK in cultured myotubes (Fig. 5D). Moreover, TNF-α has been shown to cause insulin resistance in skeletal muscle through inhibition of AMPK (53). Interestingly, although TNF-α induces the gene expression of PP2Cα in skeletal muscle, which inactivates AMPK through dephosphorylation (53), we did not find any significant difference in the levels of PP2Cα in skeletal muscle of WT and TWEAK-Tg mice (Fig. 5A) or TWEAK-treated cultured myotubes (data not shown). Although the exact mechanisms by which TWEAK inhibits AMPK activity remain obscure, reduction in the levels of phosphorylated LKB1 indicate that TWEAK-Fn14 signals cross-talk with the AMPK pathway to inhibit its activity. Intriguingly, a recent study has shown that GSK3β directly interacts and inhibits AMPK activity (54). Because the activation of GSK3β is increased in skeletal muscle of TWEAK-Tg mice (Fig. 2D), GSK3β appears to be another important player in the inhibition of AMPK in skeletal muscle of TWEAK-Tg mice. Nevertheless, our results demonstrate that TWEAK inhibits AMPK, which could be a potential mechanism for the development of metabolic abnormalities and increased body weight in TWEAK-Tg mice.
The reduced glucose handling capacity of skeletal muscle of TWEAK-Tg mice is also supported by our findings that the levels of HK II are significantly reduced in TWEAK-Tg mice (Fig. 5E) and in TWEAK-treated cultured myotubes (Fig. 5F). HK II is an important molecule in relation to glucose uptake because the enzyme is expressed essentially in insulin-sensitive tissues such skeletal muscle (43). Once glucose is transported into skeletal muscle via GLUT4, it must be phosphorylated to glucose-6-phosphate by HK II to maintain transmembrane glucose gradient for facilitated diffusion of glucose (43). Levels of HK II have been found to be reduced in diabetic animals (55, 56) and humans (43, 57, 58). Partial HK II knockout (HK II+/−) mice fed with a high-fat diet exhibited an exaggerated state of insulin resistance compared with controls with the same diet (59), whereas overexpression of HK II demonstrated increased glucose uptake in response to insulin in isolated skeletal muscle (60). Furthermore, an increase in intramuscular glucose-6-phosphate concentration simulates glycogen synthesis in response to insulin and reduced insulin-stimulated glycogen synthase activation is associated with T2D (61, 62). Our experiments demonstrate that mRNA levels of HK II are decreased in skeletal muscle of TWEAK-Tg mice, which could be a compensatory mechanism due to reduced glucose uptake in the skeletal muscle (Fig. 5E).
Our results also demonstrate that both mRNA and protein levels of GLUT4 are significantly reduced in skeletal muscle of TWEAK-Tg mice (Fig. 6). Furthermore, TWEAK drastically reduced the levels of GLUT4 in cultured myotubes (Fig. 7). Although the increased translocation of GLUT4 by insulin is the major mechanism for glucose uptake, the amount of GLUT4 in intracellular compartments is also critical (45). Skeletal muscle-specific deletion GLUT4 causes insulin resistance and glucose intolerance in mice, whereas overexpression of GLUT4 in adipose tissue reverses insulin resistance in mice lacking GLUT4 in skeletal muscle (17). Several studies in human diabetic patients or animal models (ob/ob and db/db mice) have suggested that the gene expression of GLUT4 is controlled at the transcriptional level. Promoter analysis of GLUT4 has shown that it contains binding sites for multiple transcription factors that positively or negatively regulate gene expression (45). In particular, the GLUT4 promoter contains a well-conserved binding site for MEF2 transcription factors that are located at −526/−412, a critical domain for the full transcriptional activation of GLUT4 (63). Mutation in MEF2 binding site causes a dramatic reduction in transactivation of GLUT4 promoter (63). Furthermore, MyoD and KLF15 also bind close to MEF2 binding sites in GLUT4 promoter to enhance gene expression of GLUT4 (45). Indeed, forced expression of MEF2, MyoD, or KLF15 increases the gene expression of GLUT4 and augments glucose transport activity in cultured muscle cells or adipocytes, suggesting that these transcription factors play an important role in the gene expression of GLUT4 (45). Our results demonstrate that mRNA levels of MEF2B and KLF15 are significantly reduced in skeletal muscle of TWEAK-Tg mice compared with WT mice (Fig. 6E), and TWEAK represses the levels of MEF2A, MEF2B, MEF2C, MEF2D, and KLF15 in cultured myotubes (Fig. 7D).
PGC-1α also regulates the gene expression of GLUT4 by cooperating with MEF2 transcription factors in skeletal muscle (64). Furthermore, activation of PGC-1α is controlled through phosphorylation by AMPK (44). HDAC5 associates with MEF2 to inhibit MEF2-mediated transcription in the skeletal muscle. AMPK phosphorylates HDAC5, which results in the dissociation of the HDAC5:MEF2 complex, hence making MEF2 available to increase the gene expression of GLUT4 (65). In agreement with these findings, our results demonstrate that the levels of PGC-1α and the activation of AMPK are repressed in skeletal muscle of TWEAK-Tg mice (Fig. 5). Collectively, these results suggest TWEAK might be inhibiting GLUT4 levels by inactivating AMPK and suppressing the levels of transcriptional regulators PGC-1α, MEF2, and KLF15. Based on the findings in this study, we proposed a model describing the mechanisms of action of TWEAK in skeletal muscle leading to metabolic dysfunction and weight gain (Fig. 8).
In summary, our study provides initial evidence that chronically elevated levels of TWEAK in skeletal muscle causes glucose intolerance, insulin insensitivity, and whole body metabolic abnormality, leading to increased body weight. Although more studies are required especially in humans, inhibition of TWEAK activity could be a potential approach to attenuate metabolic dysfunction in T2D and obese subjects.
Supplementary Material
Acknowledgments
The authors thank Dr. Bradford Hill and Dr. Daniel Conklin of Diabetes and Obesity Center of University of Louisville for their help and discussion on metabolic cage analysis. This work was supported by the U.S. National Institutes of Health (Grant R01-AG029623) (to A.K.).
Glossary
- AICAR
5-aminoimidazole-4-carboxamide ribonucleoside
- AMPK
5′-AMP-activated protein kinase
- CSA
cross-sectional area
- 2-DG
2-deoxy-[3H]-d-glucose
- DEXA
dual-energy X-ray absorptiometry
- Fn14
fibroblast growth factor-inducible 14
- GLUT4
glucose transporter type 4
- GSK3β
glycogen synthase kinase 3β
- GTT
glucose tolerance test
- H&E
hematoxylin and eosin
- HDAC5
histone deacetylase 5
- HKII
hexokinase II
- ITT
insulin tolerance test
- KLF15
Krüppel-like factor 15
- KRH
Krebs-Ringer-Hepes
- LKB1
liver kinase B1
- MEF2
myocyte enhancer factor
- MyHC
myosin heavy chains
- 2PGC-1α
PPAR-γ coactivator-1α
- PI3K
phosphatidylinositol 3-kinase
- PPAR
peroxisome proliferator-activated receptor
- PP2Cα
protein phosphatase 2C α
- QRT-PCR
quantitative real-time PCR
- TA
tibial anterior
- T2D
type 2 diabetes
- Tg
transgenic
- TNFR
TNF receptor
- TWEAK
TNF-like weak inducer of apoptosis
- WT
wild type
Footnotes
This article includes supplemental data. Please visit http://www.fasebj.org to obtain this information.
REFERENCES
- 1.Thiebaud D., Jacot E., DeFronzo R. A., Maeder E., Jequier E., Felber J. P. (1982) The effect of graded doses of insulin on total glucose uptake, glucose oxidation, and glucose storage in man. Diabetes 31, 957–963 [DOI] [PubMed] [Google Scholar]
- 2.Defronzo R. A. (2009) Banting Lecture. From the triumvirate to the ominous octet: a new paradigm for the treatment of type 2 diabetes mellitus. Diabetes 58, 773–795 [DOI] [PMC free article] [PubMed] [Google Scholar]
- 3.Warram J. H., Martin B. C., Krolewski A. S., Soeldner J. S., Kahn C. R. (1990) Slow glucose removal rate and hyperinsulinemia precede the development of type II diabetes in the offspring of diabetic parents. Ann. Intern. Med. 113, 909–915 [DOI] [PubMed] [Google Scholar]
- 4.DeFronzo R. A., Jacot E., Jequier E., Maeder E., Wahren J., Felber J. P. (1981) The effect of insulin on the disposal of intravenous glucose. Results from indirect calorimetry and hepatic and femoral venous catheterization. Diabetes 30, 1000–1007 [DOI] [PubMed] [Google Scholar]
- 5.DeFronzo R. A., Tripathy D. (2009) Skeletal muscle insulin resistance is the primary defect in type 2 diabetes. Diabetes Care 32(Suppl 2), S157–S163 [DOI] [PMC free article] [PubMed] [Google Scholar]
- 6.Kalupahana N. S., Moustaid-Moussa N., Claycombe K. J. (2012) Immunity as a link between obesity and insulin resistance. Mol. Aspects Med. 33, 26–34 [DOI] [PubMed] [Google Scholar]
- 7.Ng Y., Ramm G., Lopez J. A., James D. E. (2008) Rapid activation of Akt2 is sufficient to stimulate GLUT4 translocation in 3T3-L1 adipocytes. Cell Metab. 7, 348–356 [DOI] [PubMed] [Google Scholar]
- 8.Krook A., Björnholm M., Galuska D., Jiang X. J., Fahlman R., Myers M. G. Jr., Wallberg-Henriksson H., Zierath J. R. (2000) Characterization of signal transduction and glucose transport in skeletal muscle from type 2 diabetic patients. Diabetes 49, 284–292 [DOI] [PubMed] [Google Scholar]
- 9.Cusi K., Maezono K., Osman A., Pendergrass M., Patti M. E., Pratipanawatr T., DeFronzo R. A., Kahn C. R., Mandarino L. J. (2000) Insulin resistance differentially affects the PI 3-kinase- and MAP kinase-mediated signaling in human muscle. J. Clin. Invest. 105, 311–320 [DOI] [PMC free article] [PubMed] [Google Scholar]
- 10.Bouzakri K., Roques M., Gual P., Espinosa S., Guebre-Egziabher F., Riou J. P., Laville M., Le Marchand-Brustel Y., Tanti J. F., Vidal H. (2003) Reduced activation of phosphatidylinositol-3 kinase and increased serine 636 phosphorylation of insulin receptor substrate-1 in primary culture of skeletal muscle cells from patients with type 2 diabetes. Diabetes 52, 1319–1325 [DOI] [PubMed] [Google Scholar]
- 11.Ruderman N. B., Carling D., Prentki M., Cacicedo J. M. (2013) AMPK, insulin resistance, and the metabolic syndrome. J. Clin. Invest. 123, 2764–2772 [DOI] [PMC free article] [PubMed] [Google Scholar]
- 12.Garvey W. T., Maianu L., Hancock J. A., Golichowski A. M., Baron A. (1992) Gene expression of GLUT4 in skeletal muscle from insulin-resistant patients with obesity, IGT, GDM, and NIDDM. Diabetes 41, 465–475 [DOI] [PubMed] [Google Scholar]
- 13.Handberg A., Vaag A., Damsbo P., Beck-Nielsen H., Vinten J. (1990) Expression of insulin regulatable glucose transporters in skeletal muscle from type 2 (non-insulin-dependent) diabetic patients. Diabetologia 33, 625–627 [DOI] [PubMed] [Google Scholar]
- 14.Leturque A., Loizeau M., Vaulont S., Salminen M., Girard J. (1996) Improvement of insulin action in diabetic transgenic mice selectively overexpressing GLUT4 in skeletal muscle. Diabetes 45, 23–27 [DOI] [PubMed] [Google Scholar]
- 15.Ren J. M., Marshall B. A., Mueckler M. M., McCaleb M., Amatruda J. M., Shulman G. I. (1995) Overexpression of Glut4 protein in muscle increases basal and insulin-stimulated whole body glucose disposal in conscious mice. J. Clin. Invest. 95, 429–432 [DOI] [PMC free article] [PubMed] [Google Scholar]
- 16.Atkinson B. J., Griesel B. A., King C. D., Josey M. A., Olson A. L. (2013) Moderate GLUT4 overexpression improves insulin sensitivity and fasting triglyceridemia in high-fat diet-fed transgenic mice. Diabetes 62, 2249–2258 [DOI] [PMC free article] [PubMed] [Google Scholar]
- 17.Zisman A., Peroni O. D., Abel E. D., Michael M. D., Mauvais-Jarvis F., Lowell B. B., Wojtaszewski J. F., Hirshman M. F., Virkamaki A., Goodyear L. J., Kahn C. R., Kahn B. B. (2000) Targeted disruption of the glucose transporter 4 selectively in muscle causes insulin resistance and glucose intolerance. Nat. Med. 6, 924–928 [DOI] [PubMed] [Google Scholar]
- 18.Koranyi L. I., Bourey R. E., Vuorinen-Markkola H., Koivisto V. A., Mueckler M., Permutt M. A., Yki-Järvinen H. (1991) Level of skeletal muscle glucose transporter protein correlates with insulin-stimulated whole body glucose disposal in man. Diabetologia 34, 763–765 [DOI] [PubMed] [Google Scholar]
- 19.Christ-Roberts C. Y., Pratipanawatr T., Pratipanawatr W., Berria R., Belfort R., Kashyap S., Mandarino L. J. (2004) Exercise training increases glycogen synthase activity and GLUT4 expression but not insulin signaling in overweight nondiabetic and type 2 diabetic subjects. Metabolism 53, 1233–1242 [DOI] [PubMed] [Google Scholar]
- 20.Nieto-Vazquez I., Fernández-Veledo S., Krämer D. K., Vila-Bedmar R., Garcia-Guerra L., Lorenzo M. (2008) Insulin resistance associated to obesity: the link TNF-alpha. Arch. Physiol. Biochem. 114, 183–194 [DOI] [PubMed] [Google Scholar]
- 21.Mingrone G., Rosa G., Di Rocco P., Manco M., Capristo E., Castagneto M., Vettor R., Gasbarrini G., Greco A. V. (2002) Skeletal muscle triglycerides lowering is associated with net improvement of insulin sensitivity, TNF-alpha reduction and GLUT4 expression enhancement. Int. J. Obes. Relat. Metab. Disord. 26, 1165–1172 [DOI] [PubMed] [Google Scholar]
- 22.Hotamisligil G. S., Shargill N. S., Spiegelman B. M. (1993) Adipose expression of tumor necrosis factor-alpha: direct role in obesity-linked insulin resistance. Science 259, 87–91 [DOI] [PubMed] [Google Scholar]
- 23.Uysal K. T., Wiesbrock S. M., Marino M. W., Hotamisligil G. S. (1997) Protection from obesity-induced insulin resistance in mice lacking TNF-alpha function. Nature 389, 610–614 [DOI] [PubMed] [Google Scholar]
- 24.Gregor M. F., Hotamisligil G. S. (2011) Inflammatory mechanisms in obesity. Annu. Rev. Immunol. 29, 415–445 [DOI] [PubMed] [Google Scholar]
- 25.Shoelson S. E., Lee J., Goldfine A. B. (2006) Inflammation and insulin resistance. J. Clin. Invest. 116, 1793–1801 [DOI] [PMC free article] [PubMed] [Google Scholar]
- 26.Ofei F., Hurel S., Newkirk J., Sopwith M., Taylor R. (1996) Effects of an engineered human anti-TNF-alpha antibody (CDP571) on insulin sensitivity and glycemic control in patients with NIDDM. Diabetes 45, 881–885 [DOI] [PubMed] [Google Scholar]
- 27.Tajrishi M. M., Zheng T. S., Burkly L. C., Kumar A. (2014) The TWEAK-Fn14 pathway: a potent regulator of skeletal muscle biology in health and disease. Cytokine Growth Factor Rev. 25, 215–225 [DOI] [PMC free article] [PubMed] [Google Scholar]
- 28.Mittal A., Bhatnagar S., Kumar A., Lach-Trifilieff E., Wauters S., Li H., Makonchuk D. Y., Glass D. J., Kumar A. (2010) The TWEAK-Fn14 system is a critical regulator of denervation-induced skeletal muscle atrophy in mice. J. Cell Biol. 188, 833–849 [DOI] [PMC free article] [PubMed] [Google Scholar]
- 29.Paul P. K., Bhatnagar S., Mishra V., Srivastava S., Darnay B. G., Choi Y., Kumar A. (2012) The E3 ubiquitin ligase TRAF6 intercedes in starvation-induced skeletal muscle atrophy through multiple mechanisms. Mol. Cell. Biol. 32, 1248–1259 [DOI] [PMC free article] [PubMed] [Google Scholar]
- 30.Tajrishi M. M., Sato S., Shin J., Zheng T. S., Burkly L. C., Kumar A. (2014) The TWEAK-Fn14 dyad is involved in age-associated pathological changes in skeletal muscle. Biochem. Biophys. Res. Commun. 446, 1219–1224 [DOI] [PMC free article] [PubMed] [Google Scholar]
- 31.Sato S., Ogura Y., Mishra V., Shin J., Bhatnagar S., Hill B. G., Kumar A. (2013) TWEAK promotes exercise intolerance by decreasing skeletal muscle oxidative phosphorylation capacity. Skelet Muscle 3, 18. [DOI] [PMC free article] [PubMed] [Google Scholar]
- 32.Dogra C., Changotra H., Wedhas N., Qin X., Wergedal J. E., Kumar A. (2007) TNF-related weak inducer of apoptosis (TWEAK) is a potent skeletal muscle-wasting cytokine. FASEB J. 21, 1857–1869 [DOI] [PMC free article] [PubMed] [Google Scholar]
- 33.Tai M. M. (1994) A mathematical model for the determination of total area under glucose tolerance and other metabolic curves. Diabetes Care 17, 152–154 [DOI] [PubMed] [Google Scholar]
- 34.Kahn B. B., Flier J. S. (2000) Obesity and insulin resistance. J. Clin. Invest. 106, 473–481 [DOI] [PMC free article] [PubMed] [Google Scholar]
- 35.Hindi S. M., Mishra V., Bhatnagar S., Tajrishi M. M., Ogura Y., Yan Z., Burkly L. C., Zheng T. S., Kumar A. (2014) Regulatory circuitry of TWEAK-Fn14 system and PGC-1α in skeletal muscle atrophy program. FASEB J. 28, 1398–1411 [DOI] [PMC free article] [PubMed] [Google Scholar]
- 36.Woodgett J. R. (1991) A common denominator linking glycogen metabolism, nuclear oncogenes and development. Trends Biochem. Sci. 16, 177–181 [DOI] [PubMed] [Google Scholar]
- 37.Sutherland C., Leighton I. A., Cohen P. (1993) Inactivation of glycogen synthase kinase-3 beta by phosphorylation: new kinase connections in insulin and growth-factor signalling. Biochem. J. 296, 15–19 [DOI] [PMC free article] [PubMed] [Google Scholar]
- 38.Itani S. I., Saha A. K., Kurowski T. G., Coffin H. R., Tornheim K., Ruderman N. B. (2003) Glucose autoregulates its uptake in skeletal muscle: involvement of AMP-activated protein kinase. Diabetes 52, 1635–1640 [DOI] [PubMed] [Google Scholar]
- 39.Walker P. S., Ramlal T., Sarabia V., Koivisto U. M., Bilan P. J., Pessin J. E., Klip A. (1990) Glucose transport activity in L6 muscle cells is regulated by the coordinate control of subcellular glucose transporter distribution, biosynthesis, and mRNA transcription. J. Biol. Chem. 265, 1516–1523 [PubMed] [Google Scholar]
- 40.McGee S. L., van Denderen B. J., Howlett K. F., Mollica J., Schertzer J. D., Kemp B. E., Hargreaves M. (2008) AMP-activated protein kinase regulates GLUT4 transcription by phosphorylating histone deacetylase 5. Diabetes 57, 860–867 [DOI] [PubMed] [Google Scholar]
- 41.Sakoda H., Ogihara T., Anai M., Fujishiro M., Ono H., Onishi Y., Katagiri H., Abe M., Fukushima Y., Shojima N., Inukai K., Kikuchi M., Oka Y., Asano T. (2002) Activation of AMPK is essential for AICAR-induced glucose uptake by skeletal muscle but not adipocytes. Am. J. Physiol. Endocrinol. Metab. 282, E1239–E1244 [DOI] [PubMed] [Google Scholar]
- 42.Crunkhorn S., Dearie F., Mantzoros C., Gami H., da Silva W. S., Espinoza D., Faucette R., Barry K., Bianco A. C., Patti M. E. (2007) Peroxisome proliferator activator receptor gamma coactivator-1 expression is reduced in obesity: potential pathogenic role of saturated fatty acids and p38 mitogen-activated protein kinase activation. J. Biol. Chem. 282, 15439–15450 [DOI] [PubMed] [Google Scholar]
- 43.Kruszynska Y. T., Mulford M. I., Baloga J., Yu J. G., Olefsky J. M. (1998) Regulation of skeletal muscle hexokinase II by insulin in nondiabetic and NIDDM subjects. Diabetes 47, 1107–1113 [DOI] [PubMed] [Google Scholar]
- 44.Jäger S., Handschin C., St-Pierre J., Spiegelman B. M. (2007) AMP-activated protein kinase (AMPK) action in skeletal muscle via direct phosphorylation of PGC-1alpha. Proc. Natl. Acad. Sci. USA 104, 12017–12022 [DOI] [PMC free article] [PubMed] [Google Scholar]
- 45.Im S. S., Kwon S. K., Kim T. H., Kim H. I., Ahn Y. H. (2007) Regulation of glucose transporter type 4 isoform gene expression in muscle and adipocytes. IUBMB Life 59, 134–145 [DOI] [PubMed] [Google Scholar]
- 46.Bogan J. S. (2012) Regulation of glucose transporter translocation in health and diabetes. Annu. Rev. Biochem. 81, 507–532 [DOI] [PubMed] [Google Scholar]
- 47.Feng F., Wang L., Albanese N., Holmes A., Xia P. (2008) Tumor necrosis factor-like weak inducer of apoptosis attenuates the action of insulin in hepatocytes. Endocrinology 149, 1505–1513 [DOI] [PubMed] [Google Scholar]
- 48.Chacón M. R., Richart C., Gómez J. M., Megía A., Vilarrasa N., Fernández-Real J. M., García-España A., Miranda M., Masdevall C., Ricard W., Caubet E., Soler J., Vendrell J. (2006) Expression of TWEAK and its receptor Fn14 in human subcutaneous adipose tissue. Relationship with other inflammatory cytokines in obesity. Cytokine 33, 129–137 [DOI] [PubMed] [Google Scholar]
- 49.Bennett G., Strissel K. J., DeFuria J., Wang J., Wu D., Burkly L. C., Obin M. S. (2014) Deletion of TNF-like weak inducer of apoptosis (TWEAK) protects mice from adipose and systemic impacts of severe obesity. Obesity (Silver Spring) 22, 1485–1494 [DOI] [PMC free article] [PubMed] [Google Scholar]
- 50.Tajrishi M. M., Shin J., Hetman M., Kumar A. (2014) DNA methyltransferase 3a and mitogen-activated protein kinase signaling regulate the expression of fibroblast growth factor-inducible 14 (Fn14) during denervation-induced skeletal muscle atrophy. J. Biol. Chem. 289, 19985–19999 [DOI] [PMC free article] [PubMed] [Google Scholar]
- 51.Cho H., Mu J., Kim J. K., Thorvaldsen J. L., Chu Q., Crenshaw E. B. III, Kaestner K. H., Bartolomei M. S., Shulman G. I., Birnbaum M. J. (2001) Insulin resistance and a diabetes mellitus-like syndrome in mice lacking the protein kinase Akt2 (PKB beta). Science 292, 1728–1731 [DOI] [PubMed] [Google Scholar]
- 52.Mittal A., Bhatnagar S., Kumar A., Paul P. K., Kuang S., Kumar A. (2010) Genetic ablation of TWEAK augments regeneration and post-injury growth of skeletal muscle in mice. Am. J. Pathol. 177, 1732–1742 [DOI] [PMC free article] [PubMed] [Google Scholar]
- 53.Steinberg G. R., Michell B. J., van Denderen B. J., Watt M. J., Carey A. L., Fam B. C., Andrikopoulos S., Proietto J., Görgün C. Z., Carling D., Hotamisligil G. S., Febbraio M. A., Kay T. W., Kemp B. E. (2006) Tumor necrosis factor alpha-induced skeletal muscle insulin resistance involves suppression of AMP-kinase signaling. Cell Metab. 4, 465–474 [DOI] [PubMed] [Google Scholar]
- 54.Suzuki T., Bridges D., Nakada D., Skiniotis G., Morrison S. J., Lin J. D., Saltiel A. R., Inoki K. (2013) Inhibition of AMPK catabolic action by GSK3. Mol. Cell 50, 407–419 [DOI] [PMC free article] [PubMed] [Google Scholar]
- 55.Braithwaite S. S., Palazuk B., Colca J. R., Edwards C. W. III, Hofmann C. (1995) Reduced expression of hexokinase II in insulin-resistant diabetes. Diabetes 44, 43–48 [DOI] [PubMed] [Google Scholar]
- 56.Frank S. K., Fromm H. J. (1986) Effect of streptozotocin-induced diabetes and insulin treatment on the synthesis of hexokinase II in the skeletal muscle of the rat. Arch. Biochem. Biophys. 249, 61–69 [DOI] [PubMed] [Google Scholar]
- 57.Pendergrass M., Koval J., Vogt C., Yki-Jarvinen H., Iozzo P., Pipek R., Ardehali H., Printz R., Granner D., DeFronzo R. A., Mandarino L. J. (1998) Insulin-induced hexokinase II expression is reduced in obesity and NIDDM. Diabetes 47, 387–394 [DOI] [PubMed] [Google Scholar]
- 58.Højlund K., Birk J. B., Klein D. K., Levin K., Rose A. J., Hansen B. F., Nielsen J. N., Beck-Nielsen H., Wojtaszewski J. F. (2009) Dysregulation of glycogen synthase COOH- and NH2-terminal phosphorylation by insulin in obesity and type 2 diabetes mellitus. J. Clin. Endocrinol. Metab. 94, 4547–4556 [DOI] [PubMed] [Google Scholar]
- 59.Fueger P. T., Lee-Young R. S., Shearer J., Bracy D. P., Heikkinen S., Laakso M., Rottman J. N., Wasserman D. H. (2007) Phosphorylation barriers to skeletal and cardiac muscle glucose uptakes in high-fat fed mice: studies in mice with a 50% reduction of hexokinase II. Diabetes 56, 2476–2484 [DOI] [PubMed] [Google Scholar]
- 60.Chang P. Y., Jensen J., Printz R. L., Granner D. K., Ivy J. L., Moller D. E. (1996) Overexpression of hexokinase II in transgenic mice. Evidence that increased phosphorylation augments muscle glucose uptake. J. Biol. Chem. 271, 14834–14839 [PubMed] [Google Scholar]
- 61.Bouskila M., Hirshman M. F., Jensen J., Goodyear L. J., Sakamoto K. (2008) Insulin promotes glycogen synthesis in the absence of GSK3 phosphorylation in skeletal muscle. Am. J. Physiol. Endocrinol. Metab. 294, E28–E35 [DOI] [PubMed] [Google Scholar]
- 62.Jensen J., Lai Y. C. (2009) Regulation of muscle glycogen synthase phosphorylation and kinetic properties by insulin, exercise, adrenaline and role in insulin resistance. Arch. Physiol. Biochem. 115, 13–21 [DOI] [PubMed] [Google Scholar]
- 63.Liu M. L., Olson A. L., Edgington N. P., Moye-Rowley W. S., Pessin J. E. (1994) Myocyte enhancer factor 2 (MEF2) binding site is essential for C2C12 myotube-specific expression of the rat GLUT4/muscle-adipose facilitative glucose transporter gene. J. Biol. Chem. 269, 28514–28521 [PubMed] [Google Scholar]
- 64.Michael L. F., Wu Z., Cheatham R. B., Puigserver P., Adelmant G., Lehman J. J., Kelly D. P., Spiegelman B. M. (2001) Restoration of insulin-sensitive glucose transporter (GLUT4) gene expression in muscle cells by the transcriptional coactivator PGC-1. Proc. Natl. Acad. Sci. USA 98, 3820–3825 [DOI] [PMC free article] [PubMed] [Google Scholar]
- 65.McGee S. L., Hargreaves M. (2006) Exercise and skeletal muscle glucose transporter 4 expression: molecular mechanisms. Clin. Exp. Pharmacol. Physiol. 33, 395–399 [DOI] [PubMed] [Google Scholar]
Associated Data
This section collects any data citations, data availability statements, or supplementary materials included in this article.