Abstract
Angiotensin receptor blockers (ARBs) are a group of anti-hypertensive drugs that are widely used to treat pediatric hypertension. Recent application of ARBs to treat diseases such as Marfan syndrome or Alport syndrome has shown positive outcomes in animal and human studies, suggesting a broader therapeutic potential for this class of drugs. Multiple studies have reported a benefit of ARBs on adult bone homeostasis; however, its effect on the growing skeleton in children is unknown. We investigated the effect of Losartan, an ARB, in regulating bone mass and cartilage during development in mice. Wild type mice were treated with Losartan from birth until 6 weeks of age, after which bones were collected for microCT and histomorphometric analyses. Losartan increased trabecular bone volume vs. tissue volume (a 98% increase) and cortical thickness (a 9% increase) in 6-weeks old wild type mice. The bone changes were attributed to decreased osteoclastogenesis as demonstrated by reduced osteoclast number per bone surface in vivo and suppressed osteoclast differentiation in vitro. At the molecular level, Angiotensin II-induced ERK1/2 phosphorylation in RAW cells was attenuated by Losartan. Similarly, RANKL-induced ERK1/2 phosphorylation was suppressed by Losartan, suggesting a convergence of RANKL and angiotensin signaling at the level of ERK1/2 regulation. To assess the effect of Losartan on cartilage development, we examined the cartilage phenotype of wild type mice treated with Losartan in utero from conception to 1 day of age. Growth plates of these mice showed an elongated hypertrophic chondrocyte zone and increased Col10a1 expression level, with minimal changes in chondrocyte proliferation. Altogether, inhibition of the angiotensin pathway by Losartan increases bone mass and accelerates chondrocyte hypertrophy in growth plate during skeletal development.
Keywords: ARB, osteoclasts, chondrocyte, ERK phosphorylation, RANKL, microCT
1. Introduction
Losartan, the first angiotensin receptor antagonist used to treat hypertension, has been used in pediatrics for blood pressure control. Human and animal studies have shown positive outcomes of this treatment on other disease models, for example in Marfan Syndrome, Angiotensin II blockage reduced aortic root dilation [1,2]; in Alport Syndrome for treatment of proteinuria [3]. However, the effect of Losartan on the growing skeleton is poorly understood. This is especially important as increasing numbers of children treated with this class of drugs are affected with conditions that predispose them to low bone mineral density (BMD), like in Marfan syndrome [4–6]. To better understand the role of Angiotensin signaling in the growing skeleton, we studied the effects of Losartan treatment during murine bone and cartilage development.
The renin-angiotensin pathway is a key regulator of cardiac physiology and electrolyte homeostasis. The peptide hormone angiotensin II (AngII) is produced through a series of regulated proteolytic processes. First synthesized in the liver, angiotensinogen is cleaved by renin in the kidney to release angiotensin I, an inactive decapeptide. Upon cleavage by angiotensin converting enzyme (ACE), angiotensin I is converted into the biologically active octapeptide - AngII [7]. AngII binds and stimulates type 1 (AGTR1) and type2 (AGTR2) angiotensin receptors, a class of the seven-transmembrane G-protein coupled proteins. In rodents, type 2 angiotensin receptor is formed by a single protein encoded by Agtr2 gene, while the type 1 angiotensin receptor is a receptor complex consisting of Agtr1a and Agtr1b receptors.
Multiple reports in adult mouse and rat models [8–10] have shown that blockage of Agtr1a or Agtr2 effectively increased bone mass under physiological conditions and in an ovariectomy (OVX) induced osteoporosis model. In contrast, one study showed that an ACE inhibitor reduced BMD in the distal femoral metaphysis in mice [11]. Agtr1a, Agtr1b, Agtr2 and ACE are expressed in osteoclasts and osteoblasts, the two key cell types controlling the balance between bone resorption and formation. Agtr1 inhibition in vivo attenuated the differentiation of monocytes, the precursor cells of osteoclasts [12]. In a rat cell line, blocking Agtr1 in vitro reduced osteoclastogenesis indirectly by increasing the ratio of RANKL/OPG in osteoblasts [10]. Collectively, these data support that angiotensin signaling influences bone remodeling in the adult skeleton.
Angiotensin converting enzyme inhibitor has been reported to inhibit the conversion of type II procollagen to collagen in cartilage culture [13]. The expression of AGTR1 and AGTR2 is found in human articular chondrocytes as well as articular chondrocytes from patients with osteoarthritis or rheumatoid arthritis. The expression of these receptors is up-regulated in response to IL-1, a key mediator in chronic and destructive arthritis and cartilage erosion [14], suggesting a role for AngII signaling in chondrocyte physiology as well as in pathogenic processes. However, there is no study that has demonstrated the function of these receptors on chondrocytes in the growth plate yet in growing skeleton.
To better understand the role of angiotensin signaling in bone and cartilage during development, we examined the bone and cartilage phenotypes of growing mice treated with Losartan. We show that Losartan can increase bone mass in vivo and directly suppress osteoclastogenesis in vitro accompanied by decreased RANKL mediated ERK phosphorylation in osteoclast. In the growth plate, Losartan leads to increased chondrocyte hypertrophy without changing resting chondrocyte proliferation in vivo.
2. Materials and Methods
2.1. Ethics statement
All animal experiments were approved by the Institutional Animal Care and Use Committee at the Baylor College of Medicine (protocol # AN-1506) and were performed in strict accordance with the Guide for the Use and Care of Laboratory Animals of the National Institutes of Health.
2.2. Drug preparation and treatment with an AGTR1 Receptor Blocker
Losartan tablets (50 mg/tablet) were crushed with a mortar and pestle and were dissolved in water provided to mice at a dosage concentration of 0.6 g/L [2,15]. For the bone study, one day after delivery, wild type C57BL/6 lactating mothers were given oral Losartan (0.6g/L) or water (standard drinking water) until weaning. After weaning, oral losartan treatment (0.6g/L) or water was continued for the pups that had been previously treated via their lactating mothers. Both control and experimental mice were sacrificed at 6 weeks and their bones were collected for the different arms of experiments. For the cartilage study, wild type C57BL/6 dams were given oral Losartan (0.6g/L) or water starting from the first day of conception till the day after the pups were born. The pups from treated or untreated mother were sacrificed at P1 and limbs were collected for histology.
2.3. Micro Computed Tomography (microCT) analysis
MicroCT analysis was performed on the femurs of 6-week-old C57BL/6 male wild-type mice treated with Losartan or water. A microCT system (Scanco microCT40, SCANCO Medical, Swiss) was used for imaging the bones at medium resolution of 12 micrometers. 3D reconstruction and image analysis was performed on the trabecular bone of the distal femurs using the integrated software of the Scanco microCT40 system.
2.4. Histomorphometric analysis
The lumbar spines and the femurs from the same 6-week-old mice were embedded in polymethylmethacralate plastic resin and sectioned at a 7-micrometer thickness. Coronal histological sections were then stained with tartrate resistant acid phosphatase (TRAP) to calculate osteoclastic parameters, with toludine blue to conduct osteoblast indices, and Von Kossa staining to perform bone volume to tissue volume (BV/TV) measurements. Osteometrix software was used to analyze these variables. For the measurement, one section was chosen from each lumber and femoral sample to make the location of the specimen consistent, and two observers were double-blinded to read the slides [16].
2.5. Immunohistochemistry analysis
Col10a1 immunofluorescence was performed with polyclonal rabbit antibody againstCol10a1 (pXNC2, a kind gift from Dr. Greg Lunstrum) with dilution of 1:1000 followed by secondary antibody Donkey-anti-Goat-Alexa (1:600). Agtr1 antibody for immunofluorescence was purchased from Santa Cruz (sc-1173) with dilution of 1:200 followed by secondary antibody Goat-anti-Rabbit-Alexa (1:600). The immunostaining protocol for Col10a1 and Agtr1 is the same as the standard protocol. BrdU incorporation assay and growth plate measurements were conducted as described before on the P1 limbs [17][18].
2.6. Osteoclast cell culture, TRAP staining and western Blot
Bone marrow cells from 4–6 week old mice were harvested. Adhesion cells were discarded and floating cells were cultured with M-CSF (#216-MC-005, R&D Systems) at 15ng/ml for three days to obtain an enriched population of monocytes. The monocytes were plated at a concentration 1000 cells per well in 96-well plates and incubated with RANKL (#390-TN-010, R&D Systems) and M-CSF (#216-MC-005, R&D Systems) at 15ng/ml for both supplements for a period of 6 days, and Losartan were added to different plates at variable concentrations along with RANL and MCSF. During the osteoclast differentiation, the growth medium was changed every 48 hours and the osteoclasts were stained for Tartrate-resistant acid phosphatase (TRAP) on day 6. TRAP staining was performed following the standard protocol: fixing the osteoclasts with 4% paraformaldehyde in PBS for 1 min at room temperature then staining for TRAP for 15 min (Acid Phosphatase, Leukocyte (TRAP) Kit, Sigma-Aldrich). Mature osteoclasts that were TRAP positive with three or more nuclei were counted using a standard light microscope.
RAW 264.7, a murine macrophage cell line, was kindly provided by Dr. Bryant Darnay (Department of Experimental Therapeutics, The University of Texas MD Anderson Cancer Center, Houston, TX, USA) [19]. It was selected by limited dilution to express the highest osteoclastogenic potential. This clone (clone #28) has been used as an osteoclastogenic cell system that could differentiate into functional TRAP-positive osteoclasts in the presence of RANKL [20].
RAW 264.7 cells were cultured in 6-well plates at a density of 5×10^4 cells per well in DMEM/F12 supplemented with 10% fetal bovine serum and antibiotics and cultured overnight. On the second day, the medium was with DMEM/F12 without fetal bovine serum to starve the cells for 24 hours. On the third day we replaced the medium with DMEM/F12 with Losartan (100μM) or with vehicle (distilled water) for one hour to saturate the binding of Losartan to its receptors. Then, we added either Angiotensin II (1μM) or RANKL (100nM) to stimulate the cells and collected the cell lysis at time points: 0, 10, 30 and 60 minutes afterwards by applying 2xlaemmli buffer. The cell lyses were used for further western blot analysis.
To examine the ERK1/2 phosphorylation status, western Blot was performed following standard protocol. Phospho-ERK1/2 (#4370S, Cell Signaling) and total ERK1/2 (#4696, Cell Signaling) antibodies were diluted at 1:1000 and were incubated at 4°C overnight. Secondary antibody (#926-68071 and #926-32210, LI-COR Bioscience) was diluted at 1:10,000 and incubated at room temperature for 2 hours. Odyssey® Imaging Systems (LI-COR Bioscience, Lincoln, NE) and ImageJ were used to perform quantification of phosphorylated and total ERK1/2 proteins.
2.7. Statistical analysis
The Student's t test was used to compare between the control (water) group and the experimental group (Losartan). Differences were deemed statistically significant when p values were less than or equal to 0.05.
3. Results
3.1. MicroCT analysis of distal femurs in mice treated with Losartan shows an increase of bone mass in vivo
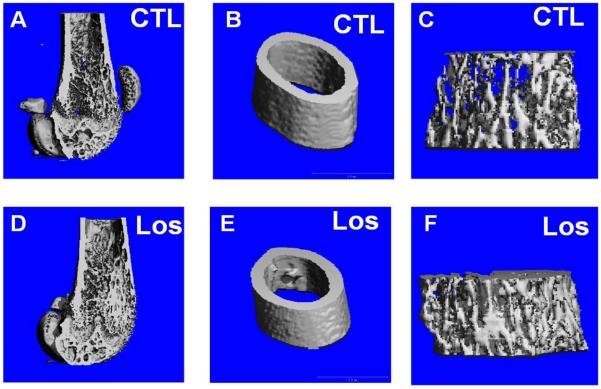
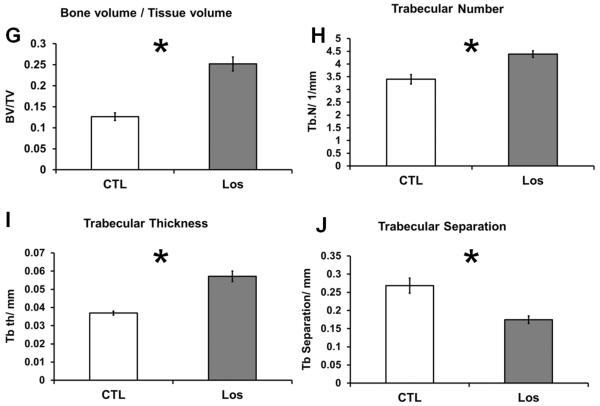
The effect of Losartan on bone of wild-type mice treated with 0.6g/L Losartan from P1 to 6 weeks of age was examined by microCT imaging followed by 3D reconstruction and analysis. We observed an increase in cortical width and trabecular bone mass in Losartan treated long bones compared to that of the controls (Fig.1. A–F). Quantitative measures by microCT analysis showed an increase in bone volume vs. tissue volume (BV/TV) (a 98% increase) (Fig.1. G), increased trabecular number (Tb.N) (a 29% increase) (Fig.1. H) and trabecular thickness (Tb.Th) (a 54% increase) (Fig.1. I) of distal femoral trabecular bone in Losartan treated mice (Los) compared to controls (CTL). Consistently, we observed a significant decrease in trabecular separation (Tb.Sp) (a 35% decrease) (Fig.1. J). The cortical compartment of the distal femur displayed a significant gain in cortical thickness (Ct.Th) (9% higher) (Fig.1. K); cortical bone mineral density remained unchanged (Fig.1. L). These data suggest blockage of Agtr1 signaling significantly increases bone mass during skeletal development.
Figure 1.
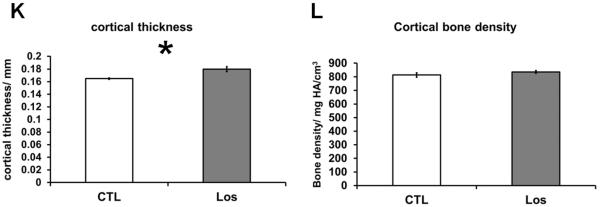
MicroCT reconstruction shows an increased trabecular bone mass and cortical thickness in Losartan treated mice. MicroCT reconstruction of the distal femur (A and D), cortical bone (B and E) and trabecular bone(C and F). (G–J) Trabecular bone indices quantified by microCT. Bone volume/Tissue volume (BV/TV) (G), Trabecular number (Tb.N) (H), Trabecular thickness (Tb.Th) (I) are improved in the treated group. Trabecular separation (Tb.Sp) (J) is decreased in the treated group. (K–L) Cortical bone indices obtained from microCT. The cortical thickness (Ct.Th) (K) is increased by 9% but not bone mineral density (BMD) in Losartan treated group. CTL: control, Los: Losartan-treated, * p<0.05, CTL: n = 7, LOS: n=8.
3.2. Histological findings and histomorphometrical analysis
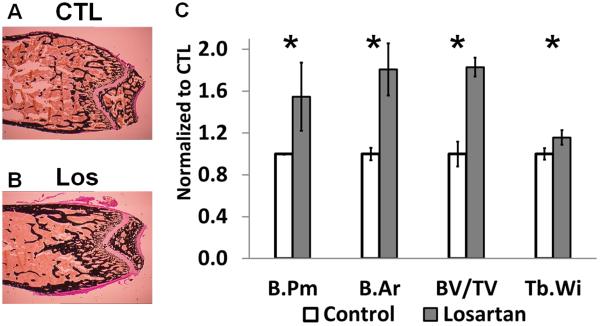
To examine whether the Losartan treatment modulates the catabolic or anabolic pathway of bone remodeling, bone histomorphometric analysis were performed on sections from Losartan or vehicle treated groups. Von Kossa staining (Fig.2.A and 2.B) revealed elevated bone perimeter (a 54% increase), bone area (an 80% increase), BV/TV (an 82% increase) and trabecular width (a 15% increase) in Losartan treated mice (Fig. 2.C). This is consistent with microCT analysis, suggesting a net increase in bone mass after Losartan treatment.
Figure 2.
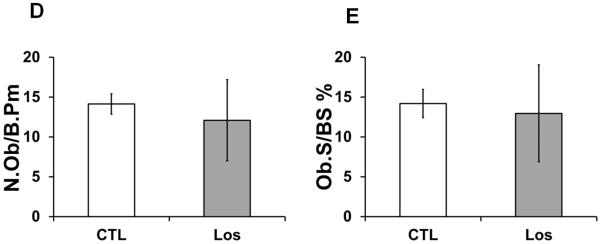
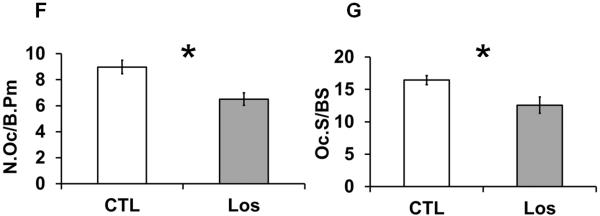
Histological and histomorphometric analyses of Losartan treated bones. Von Kossa staining of distal femurs of control (A) and Losartan treated (B) mice. (C) Quantification of the bone architecture indices. Bone perimeter (B.Pm), bone area (B.Ar), bone volume/tissue volume (BV/TV) and trabecular width (Tb.Wi) were increased significantly in Losartan treated group. Osteoblast parameters such as osteoblast number per bone surface (N.Ob/B.Pm) (D) and osteoblast surface per bone surface (Ob.S/BS) (E) were not affected by Losartan. Osteoclast number per bone surface (N.Oc/B.Pm) (F) and osteoclast surface per bone surface (Oc.S/BS) (G) were reduced in Losartan treated group. CTL: control, Los: Losartan-treated. * p<0.05, n=6 for control and treated group.
The elevated BV/TV values can possibly be explained by: 1) an increase in bone formation by osteoblasts, 2) suppressed bone resorption by osteoclasts, or 3) a combination of these two mechanisms. To differentiate among these mechanisms, we quantified the numbers of osteoclasts and osteoblasts with bone histomorphometric analysis.
Quantification of toluidine blue stained osteoblasts showed no significant changes in osteoblast number per bone surface (Ob.S/BS) or in other osteoblast related parameters (Fig.2.D and 2.E). In contrast, TRAP staining result showed a significant decrease in osteoclast numbers per bone surface (N.Oc/BS) (Fig.2.F) and in osteoclast surface per bone surface (Oc.S/BS) (Fig. 2.G) in Losartan treated long bones. This suggests that Losartan affects bone remodeling mainly through an anti-resorptive mechanism.
3.3. Osteoclastogenesis is inhibited by blocking Agtr1 pathway
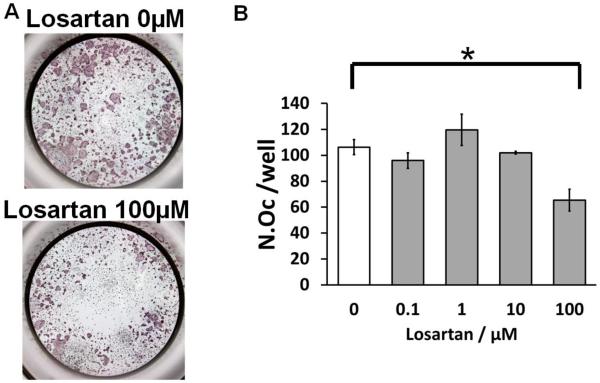
To further test whether Agtr1 signaling blockage directly inhibits osteoclast differentiation, we performed an in vitro osteoclast differentiation assay. Bone marrow monocytes were isolated and differentiated into mature osteoclasts by culturing with RANKL and M-CSF. A mature osteoclast is defined as a TRAP positive cell with three or more nuclei. Treatment with Losartan throughout differentiation led to a reduction in osteoclast number in a dosage dependent manner (Fig. 3.A, 3.B), consistent with a decreased number of osteoclast in Losartan treated group by bone histomorphometric analysis.
Figure 3.
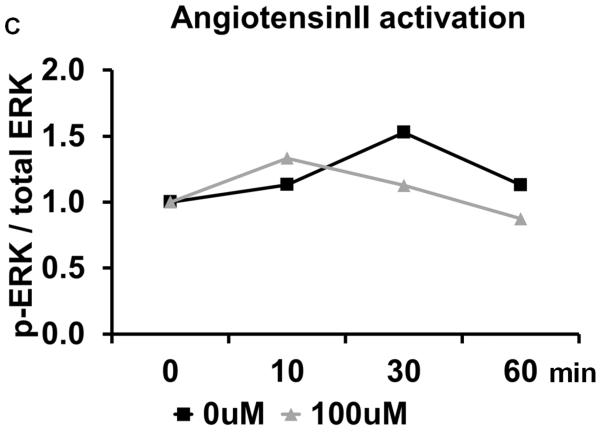
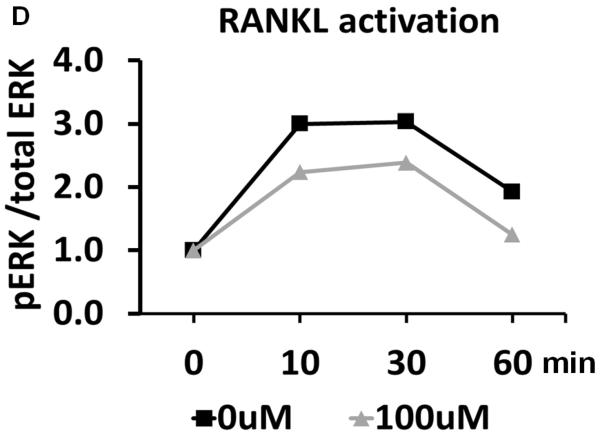
Losartan inhibits in vitro osteoclast differentiation. (A) TRAP staining of osteoclast differentiated from bone marrow monocytes using different concentration of Losartan treatment. (B) Cell counts of TRAP positive osteoclasts cultured under different concentrations of Losartan. (C) Losartan suppresses AngII induced ERK1/2 phosphorylation. (D) Losartan attenuates RANKL induced ERK1/2 phosphorylation. *p<0.05, n=4 for control and Losartan treated group.
The molecular mechanism underlying the attenuated osteoclast differentiation was also examined. As a pleotropic signaling pathway, AngII can elicit a multitude of downstream signaling components, such as mitogen-activated protein kinase (MAPK), protein lipase C (PLC), phosphatidylinositol 3-kinase-dependent (PI3K) and Rho-associated kinase (ROCK) pathway [21]. Despite comprehensive understanding of the mechanisms of AngII signaling in the kidney, heart and blood vessels, little is known about its function in the osteoclast [22]. The MAPK pathway consists of three different members: p38 MAPKs, c-Jun N-terminal kinases (JNKs) and extracellular signal-regulated kinases (ERK1 and ERK2) [22]. To test whether Losartan affects these signaling pathways in the context of osteoclastogenesis, we analyzed MAPKs activation status in an osteoclastic cell line. In contrast to the commonly used RAW 264.7 cell line, the RAW cell line used in our experiments is derived from a single cell clone that has a higher differentiation capacity than its parental cell line, and represents a more homogeneous population of osteoclast progenitors [23]. Western blot showed that AngII stimulation increased the proportion of the phosphorylated ERK1/2 at 30 minutes. This dynamic change in ERK 1/2 measured by phospho-ERK/total-ERK ratio showed a trend of decreasing when Losartan is introduced, suggesting Losartan influence ERK signaling pathway (Fig. 3.C). Other MAPKs such as p38 MAPK was not altered by Losartan treatment (supplemental Fig.1.A and 1.B).
MAPK pathways are part of the signal transduction cascade required for propagating RANKL signaling, which is crucial for osteoclast differentiation [24]. Therefore, we asked if Losartan regulates RANKL induced activation of MAPK signaling. RANKL induced a robust increase in the proportion of phosphorylated ERK1/2 at 10–30 minutes, after which the signal was decreased. When Losartan was pre-incubated with these cells, the RANKL-induced ERK1/2 phosphorylation has a trend of decreasing, suggesting Losartan may influence ERK1/2 signaling pathway (Fig. 3.D). However, RANKL induced JNK phosphorylation showed little change between Losartan treated and control groups (supplemental Fig.1.C and 1.D). In summary, our data suggests Losartan suppresses ERK1/2 activation downstream of AngII and RANKL during osteoclast differentiation.
3.4. Agtr1 signaling blockage increases chondrocyte hypertrophy but not chondrocyte proliferation
To understand the distribution of Agtr1 in cartilage, we analyzed Agtr1 protein expression in the long bones of P1 mice by immunofluorescence. The growth plate is divided into four discrete zones defined by morphology: 1) the small round chondrocytes at the end of long bone constitute resting zone (RZ); 2) flattened chondrocytes with a typical columnar organization constitute proliferative zone (PZ); 3) the enlarged post-mitotic chondrocytes form the hypertrophic zone (HPZ); 4) the transitioning cells between proliferative and hypertrophic chondrocytes are referred to as pre-hypertrophic chondrocytes. There is a prominent Agtr1 signal in the hypertrophic chondrocytes (HPZ) (Fig. 4.A, 4.C) compared to the control (Fig. 4.B). The signal is stronger in the cell membrane than that in the cytoplasm, consistent with the membranous localization of this receptor (Fig. 4.C). The proliferative chondrocytes express a lower level of Agtr1 than hypertrophic chondrocytes do, while resting chondrocytes exhibit nearly absence of Agtr1 expression (Fig. 4.A). In addition, there is a strong signal seen in the bone marrow (BM), consistent with the report that Agtr1 is expressed in bone marrow cells, osteoblasts and osteoclasts lining the surface of trabecular bone (Fig. 4.A) [9,25–27].
Figure 4.

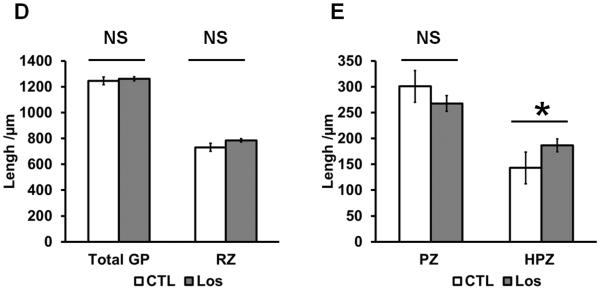
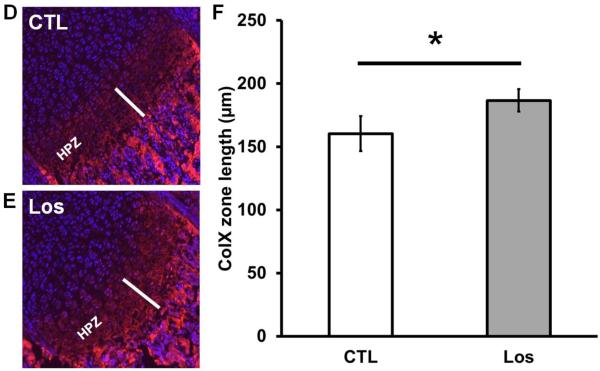
Losartan treatment increased hypertrophic zone of growth plate but no change in proliferative zone. (A) Agtr1 immunofluoresence in the long bone of P1 mice. (10X) (B) Negative control staining without primary antibody. (10X) (C) Higher magnification image of Agtr1 immunofluorescence (20X). (D–E) Measurements of the respective zones of the growth plate of Losartan treated and untreated mice. GP: growth plate, RZ: resting zone, PZ: proliferative zone, HPZ: hypertrophic zone, BM: bone marrow. * p<0.05, n = 3–4.
To evaluate how AngII signaling inhibition affects cartilage development in the long bone, we analyzed the growth plate of mice with or without Losartan treatment in utero from conception until P1. The total length of the growth plate did not show a significant difference between treated and untreated mice (Fig. 4.D). We then examined the respective zones of chondrocyte differentiation. Since it is difficult to consistently measure the length of the pre-hypertrophic and hypertrophic zones separately, we measured the length of these two zones together as post-proliferating chondrocytes. The histomorphometric analysis shows the resting zone (RZ) (Fig. 4.D) and proliferative zone (PZ) (Fig. 4.E) did not differ significantly between treated and untreated mice. However, the post-proliferating chondrocyte zone (HPZ) was significantly longer in the treated compared to untreated mice (Fig. 4.E), suggesting an effect of Losartan on chondrocyte hypertrophy.
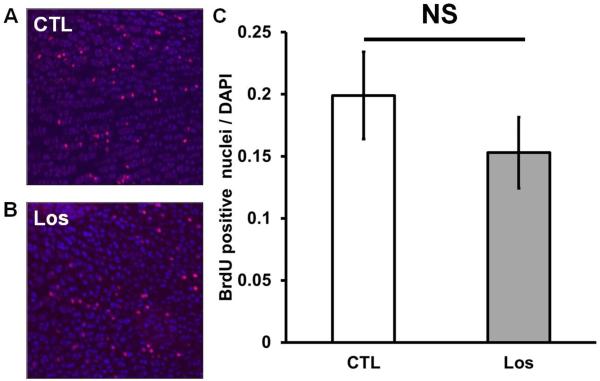
To increase the sensitivity and specificity of the measurement of the proliferative zone, we performed a BrdU incorporation assay, which labels cells in S-phase, as an indicator of proliferating chondrocytes. The proportion of chondrocytes that incorporated BrdU is similar between treated and untreated mice (Fig. 5.A–C), confirming that chondrocyte proliferation is not significantly affected by Losartan treatment.
Figure 5.
Losartan treatment increases Col10a1- expressing zone but has no effects on chondrocyte proliferation. (A–B) BrdU staining of the proliferative chondrocytes of Losartan treated (B) and untreated (A) limbs. (C) Quantification of BrdU incorporation in the Losartan treated and untreated limbs. (D–E) Immunofluorescent staining of Col10a1 in the long bones of Losartan treated (E) and untreated (D) mice. (F) Quantification of the length of the Col10a1- expressing zone. HPZ: hypertrophic zone. * p<0.05, n=4 for control and Losartan treated group.
To better determine the cause of elongation of pre-hypertrophic and hypertrophic zone in the Losartan treated mice, we examined Col10a1 expression, a marker of hypertrophy, by immunofluorescence. The Col10a1-expressing region is significantly expanded in the Losartan treated growth plates compared to the controls (Fig. 5.E–F). This suggests that an accelerated chondrocyte hypertrophy contributes to the elongation of post-proliferating chondrocyte zone.
4. Discussion
Losartan, an angiotensin type 1 receptor antagonist, has been used for treating pediatric hypertension and has an emerging application in other diseases such as Marfan syndrome. However, the effects of Losartan on the growing skeleton are still unclear. We demonstrated that Losartan effectively increased bone mass by reducing osteoclastogenesis. In vitro, Losartan attenuated osteoclastogenesis and suppressed ERK1/2 signaling. We also show that Losartan treatment accelerated chondrocyte hypertrophy without significantly altering the length of growth plate or chondrocyte proliferation. Overall, we demonstrated the effect of Losartan administration during development on skeleton.
4.1. Losartan function in osteoblasts and osteoclasts
Several mouse studies suggest that Agtr1-mediated AngII signaling is a regulator of bone turnover and development. Agtr1a knockout mice of either sex showed a higher BV/TV in the appendicular trabecular bones but not in the appendicular cortical bones [28]. Agtr1a loss-of-function protects against bone loss in both age-related and ovariectomy (OVX)-induced osteoporosis mouse models [28]. Among all of the various in vivo studies on AngII signaling in bone, the protection against OVX-induced bone loss has been the most reproducible in mice [29] and has also been recapitulated in rat models [10,30]. Collective studies emphasize beneficial role to bone health by inactivating Agtr1 signaling.
To elucidate the cellular component that mediates AngII effects in bone, in vitro studies were carried out in osteoblasts and/or osteoclasts, which have raised several mechanistic models: 1) The first model suggests that Agtr1 is dispensable for either osteoclast or osteoblast differentiation, but plays a role in the coupling of the two cell types [28]; 2) The second model suggests that the osteoblast is responsible for AngII signaling in bone whereby AngII elevates the RANKL/OPG ratio to deregulate the balance between bone resorption and formation [10,31]. 3) The third model suggested by our results is that Agtr1 acts directly on osteoclast differentiation possibly through cross-talk with the RANKL-induced ERK1/2 signaling pathway. The difference between the first model and the third is possibly due to a difference in the timing of Agtr1 inactivation. Pharmacological inhibition imposes a transient suppression while a genetic knockout, as with the first model, may involve developmental changes that could induce adaptation or tolerance blunting the effect of Agtr1 inactivation. The second model was mainly supported by co-culture of osteoblasts and osteoclasts, and therefore, it may not fully represent cell type specific effects of AngII. In the future, studies on mice following the intercross of an Agtr1 floxed allele with osteoblast or osteoclast specific Cre line will facilitate the understanding of the differential contribution of these cells to Agtr1a regulation on bone.
4.2. AngII signaling in chondrocytes and its effect on growth plate
AngII is well-known for its potent pro-inflammatory functions in many diseases [32]. The most common bone/cartilage disorders such as rheumatoid arthritis and osteoarthritis have a central feature of evoking an immune response in their pathogenesis [33,34]. AGTR1 is expressed in the articular cartilage of osteoarthritis as well as in rheumatoid arthritis joints without a significant difference in the pattern of distribution. Morphologically, these AGTR1 positive cells are enlarged and surrounded by matrix, resembling hypertrophic chondrocytes [14]. ACE expression is induced in the chondrocytes of bone callus during fracture healing, which suggests AngII signaling is involved in endochondral bone formation. Recently, Tsukamoto group showed that Atgr1 suppressed the hypertrophic differentiation of chondrocytes in vitro [35], which is consistent with our observation that blockage of Agtr1 accelerated hypertrophic differentiation during endochondral bone formation. The accelerated hypertrophy in Losartan treated growth plates may be attributed to alteration in the expression of matrix protein like Col10a1, or may be due to changes in matrix protein metabolism, which was suggested by AngII regulation on matrix metalloproteinase during cardiac remodeling or hypertension [36–38].
Our study has provided evidence that Agtr1 blockage using pharmacological inhibitor, Losartan, increases bone mass through a direct suppression of osteoclastogenesis by affecting the RANKL mediated MAPK signaling. We also demonstrated that inhibition of Agtr1 signaling accelerates chondrocyte hypertrophy in long bone growth plate without significantly altering chondrocyte proliferation during development. Collectively our study suggests the requirement of the long-term studies evaluating the effect of Agtr1 blockage on bone mineral density and growth in children.
Supplementary Material
Highlights.
Losartan treatment increases bone mass by direct suppression of osteoclasts.
Losartan inhibits RANKL mediated MAPK signaling during osteoclastogenesis.
Inhibition of Agtr1 signaling accelerates chondrocyte hypertrophy.
5. Acknowledgements
This study was funded by NIH/NICHD P01 HD070394 (BL), the Rolanette and Berdon Lawrence Disease Program of Texas, and the BCM Intellectual and Developmental Disabilities Research Center (HD024064) from the Eunice Kennedy Shriver National Institute of Child Health & Human Development.
We thank Dr. Bryant G. Darnay and Dr. Betty Lamothe for the generous gift of RAW 264.7 cell line and assistance in osteoclast culture.
Footnotes
Publisher's Disclaimer: This is a PDF file of an unedited manuscript that has been accepted for publication. As a service to our customers we are providing this early version of the manuscript. The manuscript will undergo copyediting, typesetting, and review of the resulting proof before it is published in its final citable form. Please note that during the production process errors may be discovered which could affect the content, and all legal disclaimers that apply to the journal pertain.
References
- 1.Chiu HH, Wu MH, Wang JK, Lu CW, Chiu SN, et al. Losartan Added to beta-Blockade Therapy for Aortic Root Dilation in Marfan Syndrome: A Randomized, Open-Label Pilot Study. Mayo Clin Proc. 2013;88:271–276. doi: 10.1016/j.mayocp.2012.11.005. [DOI] [PubMed] [Google Scholar]
- 2.Habashi JP, Judge DP, Holm TM, Cohn RD, Loeys BL, et al. Losartan, an AT1 antagonist, prevents aortic aneurysm in a mouse model of Marfan syndrome. Science. 2006;312:117–121. doi: 10.1126/science.1124287. [DOI] [PMC free article] [PubMed] [Google Scholar]
- 3.Gross O, Kashtan CE. Treatment of Alport syndrome: beyond animal models. Kidney Int. 2009;76:599–603. doi: 10.1038/ki.2009.223. [DOI] [PubMed] [Google Scholar]
- 4.Grover M, Brunetti-Pierri N, Belmont J, Phan K, Tran A, et al. Assessment of bone mineral status in children with Marfan syndrome. Am J Med Genet A. 2012;158A:2221–2224. doi: 10.1002/ajmg.a.35540. [DOI] [PMC free article] [PubMed] [Google Scholar]
- 5.Giampietro PF, Peterson MG, Schneider R, Davis JG, Burke SW, et al. Bone mineral density determinations by dual-energy x-ray absorptiometry in the management of patients with Marfan syndrome--some factors which affect the measurement. HSS J. 2007;3:89–92. doi: 10.1007/s11420-006-9030-3. [DOI] [PMC free article] [PubMed] [Google Scholar]
- 6.Moura B, Tubach F, Sulpice M, Boileau C, Jondeau G, et al. Bone mineral density in Marfan syndrome. A large case-control study. Joint Bone Spine. 2006;73:733–735. doi: 10.1016/j.jbspin.2006.01.026. [DOI] [PubMed] [Google Scholar]
- 7.Zaman MA, Oparil S, Calhoun DA. Drugs targeting the renin-angiotensin-aldosterone system. Nat Rev Drug Discov. 2002;1:621–636. doi: 10.1038/nrd873. [DOI] [PubMed] [Google Scholar]
- 8.Ma L, Ji JL, Ji H, Yu X, Ding LJ, et al. Telmisartan alleviates rosiglitazone-induced bone loss in ovariectomized spontaneous hypertensive rats. Bone. 2010;47:5–11. doi: 10.1016/j.bone.2010.03.016. [DOI] [PubMed] [Google Scholar]
- 9.Izu Y, Mizoguchi F, Kawamata A, Hayata T, Nakamoto T, et al. Angiotensin II type 2 receptor blockade increases bone mass. J Biol Chem. 2009;284:4857–4864. doi: 10.1074/jbc.A807610200. [DOI] [PMC free article] [PubMed] [Google Scholar]
- 10.Shimizu H, Nakagami H, Osako MK, Hanayama R, Kunugiza Y, et al. Angiotensin II accelerates osteoporosis by activating osteoclasts. FASEB J. 2008;22:2465–2475. doi: 10.1096/fj.07-098954. [DOI] [PubMed] [Google Scholar]
- 11.Garcia P, Schwenzer S, Slotta JE, Scheuer C, Tami AE, et al. Inhibition of angiotensin-converting enzyme stimulates fracture healing and periosteal callus formation - role of a local renin-angiotensin system. Br J Pharmacol. 2010;159:1672–1680. doi: 10.1111/j.1476-5381.2010.00651.x. [DOI] [PMC free article] [PubMed] [Google Scholar]
- 12.Tsubakimoto Y, Yamada H, Yokoi H, Kishida S, Takata H, et al. Bone marrow angiotensin AT1 receptor regulates differentiation of monocyte lineage progenitors from hematopoietic stem cells. Arterioscler Thromb Vasc Biol. 2009;29:1529–1536. doi: 10.1161/ATVBAHA.109.187732. [DOI] [PubMed] [Google Scholar]
- 13.Mannisto TK, Karvonen KE, Kerola TV, Ryhanen LJ. Inhibitory effect of the angiotensin converting enzyme inhibitors captopril and enalapril on the conversion of procollagen to collagen. J Hypertens. 2001;19:1835–1839. doi: 10.1097/00004872-200110000-00018. [DOI] [PubMed] [Google Scholar]
- 14.Kawakami Y, Matsuo K, Murata M, Yudoh K, Nakamura H, et al. Expression of Angiotensin II Receptor-1 in Human Articular Chondrocytes. Arthritis. 2012;2012:648537. doi: 10.1155/2012/648537. [DOI] [PMC free article] [PubMed] [Google Scholar]
- 15.Cohn RD, van Erp C, Habashi JP, Soleimani AA, Klein EC, et al. Angiotensin II type 1 receptor blockade attenuates TGF-beta-induced failure of muscle regeneration in multiple myopathic states. Nat Med. 2007;13:204–210. doi: 10.1038/nm1536. [DOI] [PMC free article] [PubMed] [Google Scholar]
- 16.Yang T, Grafe I, Bae Y, Chen S, Chen Y, et al. E-selectin ligand 1 regulates bone remodeling by limiting bioactive TGF-beta in the bone microenvironment. Proc Natl Acad Sci U S A. 2013;110:7336–7341. doi: 10.1073/pnas.1219748110. [DOI] [PMC free article] [PubMed] [Google Scholar]
- 17.Engin F, Yao Z, Yang T, Zhou G, Bertin T, et al. Dimorphic effects of Notch signaling in bone homeostasis. Nat Med. 2008;14:299–305. doi: 10.1038/nm1712. [DOI] [PMC free article] [PubMed] [Google Scholar]
- 18.Napierala D, Sam K, Morello R, Zheng Q, Munivez E, et al. Uncoupling of chondrocyte differentiation and perichondrial mineralization underlies the skeletal dysplasia in tricho-rhino-phalangeal syndrome. Hum Mol Genet. 2008;17:2244–2254. doi: 10.1093/hmg/ddn125. [DOI] [PMC free article] [PubMed] [Google Scholar]
- 19.Reuter S, Gupta SC, Phromnoi K, Aggarwal BB. Thiocolchicoside suppresses osteoclastogenesis induced by RANKL and cancer cells through inhibition of inflammatory pathways: a new use for an old drug. Br J Pharmacol. 2012;165:2127–2139. doi: 10.1111/j.1476-5381.2011.01702.x. [DOI] [PMC free article] [PubMed] [Google Scholar]
- 20.Hsu H, Lacey DL, Dunstan CR, Solovyev I, Colombero A, et al. Tumor necrosis factor receptor family member RANK mediates osteoclast differentiation and activation induced by osteoprotegerin ligand. Proc Natl Acad Sci U S A. 1999;96:3540–3545. doi: 10.1073/pnas.96.7.3540. [DOI] [PMC free article] [PubMed] [Google Scholar]
- 21.Higuchi S, Ohtsu H, Suzuki H, Shirai H, Frank GD, et al. Angiotensin II signal transduction through the AT1 receptor: novel insights into mechanisms and pathophysiology. Clin Sci (Lond) 2007;112:417–428. doi: 10.1042/CS20060342. [DOI] [PubMed] [Google Scholar]
- 22.Wada T, Nakashima T, Hiroshi N, Penninger JM. RANKL-RANK signaling in osteoclastogenesis and bone disease. Trends Mol Med. 2006;12:17–25. doi: 10.1016/j.molmed.2005.11.007. [DOI] [PubMed] [Google Scholar]
- 23.Lamothe B, Webster WK, Gopinathan A, Besse A, Campos AD, et al. TRAF6 ubiquitin ligase is essential for RANKL signaling and osteoclast differentiation. Biochem Biophys Res Commun. 2007;359:1044–1049. doi: 10.1016/j.bbrc.2007.06.017. [DOI] [PMC free article] [PubMed] [Google Scholar]
- 24.Lee ZH, Kim HH. Signal transduction by receptor activator of nuclear factor kappa B in osteoclasts. Biochem Biophys Res Commun. 2003;305:211–214. doi: 10.1016/s0006-291x(03)00695-8. [DOI] [PubMed] [Google Scholar]
- 25.Cortez-Retamozo V, Etzrodt M, Newton A, Ryan R, Pucci F, et al. Angiotensin II drives the production of tumor-promoting macrophages. Immunity. 2013;38:296–308. doi: 10.1016/j.immuni.2012.10.015. [DOI] [PMC free article] [PubMed] [Google Scholar]
- 26.Fukuda D, Sata M. Role of bone marrow renin-angiotensin system in the pathogenesis of atherosclerosis. Pharmacol Ther. 2008;118:268–276. doi: 10.1016/j.pharmthera.2008.02.007. [DOI] [PubMed] [Google Scholar]
- 27.Haznedaroglu IC, Ozturk MA. Towards the understanding of the local hematopoietic bone marrow renin-angiotensin system. Int J Biochem Cell Biol. 2003;35:867–880. doi: 10.1016/s1357-2725(02)00278-9. [DOI] [PubMed] [Google Scholar]
- 28.Kaneko K, Ito M, Fumoto T, Fukuhara R, Ishida J, et al. Physiological function of the angiotensin AT1a receptor in bone remodeling. J Bone Miner Res. 2011;26:2959–2966. doi: 10.1002/jbmr.501. [DOI] [PubMed] [Google Scholar]
- 29.Zhang Y, Diao TY, Gu SS, Wu SY, Gebru YA, et al. Effects of angiotensin II type 1 receptor blocker on bones in mice with type 1 diabetes induced by streptozotocin. J Renin Angiotensin Aldosterone Syst. 2013 doi: 10.1177/1470320312471229. [DOI] [PubMed] [Google Scholar]
- 30.Donmez BO, Ozdemir S, Sarikanat M, Yaras N, Koc P, et al. Effect of angiotensin II type 1 receptor blocker on osteoporotic rat femurs. Pharmacol Rep. 2012;64:878–888. doi: 10.1016/s1734-1140(12)70882-4. [DOI] [PubMed] [Google Scholar]
- 31.Asaba Y, Ito M, Fumoto T, Watanabe K, Fukuhara R, et al. Activation of renin-angiotensin system induces osteoporosis independently of hypertension. J Bone Miner Res. 2009;24:241–250. doi: 10.1359/jbmr.081006. [DOI] [PubMed] [Google Scholar]
- 32.Luft FC, Dechend R, Muller DN. Immune mechanisms in angiotensin II-induced target-organ damage. Ann Med. 2012;44(Suppl 1):S49–54. doi: 10.3109/07853890.2011.653396. [DOI] [PubMed] [Google Scholar]
- 33.de Lange-Brokaar BJ, Ioan-Facsinay A, van Osch GJ, Zuurmond AM, Schoones J, et al. Synovial inflammation, immune cells and their cytokines in osteoarthritis: a review. Osteoarthritis Cartilage. 2012;20:1484–1499. doi: 10.1016/j.joca.2012.08.027. [DOI] [PubMed] [Google Scholar]
- 34.Dagenais NJ, Jamali F. Protective effects of angiotensin II interruption: evidence for antiinflammatory actions. Pharmacotherapy. 2005;25:1213–1229. doi: 10.1592/phco.2005.25.9.1213. [DOI] [PubMed] [Google Scholar]
- 35.Tsukamoto I, Inoue S, Teramura T, Takehara T, Ohtani K, et al. Activating types 1 and 2 angiotensin II receptors modulate the hypertrophic differentiation of chondrocytes. FEBS Open Bio. 2013;3:279–284. doi: 10.1016/j.fob.2013.07.001. [DOI] [PMC free article] [PubMed] [Google Scholar]
- 36.Sukumaran V, Watanabe K, Veeraveedu PT, Thandavarayan RA, Gurusamy N, et al. Telmisartan, an angiotensin-II receptor blocker ameliorates cardiac remodeling in rats with dilated cardiomyopathy. Hypertens Res. 2010;33:695–702. doi: 10.1038/hr.2010.67. [DOI] [PubMed] [Google Scholar]
- 37.Odenbach J, Wang X, Cooper S, Chow FL, Oka T, et al. MMP-2 mediates angiotensin II-induced hypertension under the transcriptional control of MMP-7 and TACE. Hypertension. 2011;57:123–130. doi: 10.1161/HYPERTENSIONAHA.110.159525. [DOI] [PubMed] [Google Scholar]
- 38.Nagasawa A, Yoshimura K, Suzuki R, Mikamo A, Yamashita O, et al. Important role of the angiotensin II pathway in producing matrix metalloproteinase-9 in human thoracic aortic aneurysms. J Surg Res. 2013 doi: 10.1016/j.jss.2012.12.012. [DOI] [PubMed] [Google Scholar]
Associated Data
This section collects any data citations, data availability statements, or supplementary materials included in this article.


