

Significance
Different cells in a clonal population can be in different phenotypic states, which persist for a few generations before switching to another state. Dynamics of switching between these states determines the extent of correlations between the phenotypes of related cells. Here we demonstrate—using ideas from statistical physics—that it is possible to infer simple stochastic dynamics along lineages from an instantaneous measurement of phenotypic correlations in a cell population with defined genealogy. The approach is validated using experimental observations on Pseudomonas aeruginosa colonies.
Keywords: stochastic dynamics, correlation functions, conformal symmetry, Bethe lattice
Abstract
Populations of isogenic embryonic stem cells or clonal bacteria often exhibit extensive phenotypic heterogeneity that arises from intrinsic stochastic dynamics of cells. The phenotypic state of a cell can be transmitted epigenetically in cell division, leading to correlations in the states of cells related by descent. The extent of these correlations is determined by the rates of transitions between the phenotypic states. Therefore, a snapshot of the phenotypes of a collection of cells with known genealogical structure contains information on phenotypic dynamics. Here, we use a model of phenotypic dynamics on a genealogical tree to define an inference method that allows extraction of an approximate probabilistic description of the dynamics from observed phenotype correlations as a function of the degree of kinship. The approach is tested and validated on the example of Pyoverdine dynamics in Pseudomonas aeruginosa colonies. Interestingly, we find that correlations among pairs and triples of distant relatives have a simple but nontrivial structure indicating that observed phenotypic dynamics on the genealogical tree is approximately conformal—a symmetry characteristic of critical behavior in physical systems. The proposed inference method is sufficiently general to be applied in any system where lineage information is available.
Collectives of nominally isogenic cells, be it a clonal colony of bacteria or a developing multicellular organism, are known to exhibit a great deal of phenotypic diversity and time-dependent physiological variability. While often transient and reversible, phenotypic states of cells can persist on the time scale of the cell cycle and be transmitted from mother to daughter cells. This epigenetic inheritance has been a subject of much recent research and is known to involve a multitude of different molecular mechanisms (1–3), from transcription factor transmission to DNA methylation (4, 5). Stable phenotypic differentiation is at the heart of any animal and plant developmental program (6, 7). The role and extent of phenotypic variability in microbial populations is less well understood, but is coming into focus with the spread of single cell-resolved live imaging (8, 9) and other single-cell phenotyping methods (10). Phenotypic variability within a colony implements the intuitively plausible bet-hedging strategies of survival (11–15), such as persistence (16), sporulation (17), or competence (18). More generally, phenotypic variability may be implementing interesting “separation of labor”-type cooperative behavior within colonies (19), although evolutionary stability of such strategies remains a subject of much theoretical debate (20–22). Phenotypic variation can originate from precisely controlled pattern-forming interactions either from global or local intercellular signaling, as is the case in animal and plant development. For microbes, intracellular stochasticity is seen as playing a leading role in driving transitions between physiologically significant phenotypic states (23–25). It is an open problem to understand the extent to which the phenotypic diversity in a bacterial system is driven by cell-autonomous stochastic processes as opposed to interaction with their neighbors, which could take the form of a feedback through local nutrient availability, secreted factors (26), or direct contact signals (27).
As an example, we consider Pseudomonas aeruginosa, a common bacteria that, like all others, requires iron for metabolism, DNA synthesis, and various other enzymatic activities. To absorb iron from its naturally occurring mineral phase, P. aeruginosa produces and releases iron-chelating molecules called siderophores (28, 29). Pyoverdine (Pvd) is a type of siderophore that is particularly suited for experimental analysis, because it is naturally fluorescent (30). Pvd concentration varies significantly from one cell to another (31), which is largely due to the fact that Pvd is trafficking between cells that either sip or secrete them (29). Moreover, Pvd concentration along lineages has a correlation time of the order of two to three cell cycles (31). The feeder/recipient phenotypes are epigenetically passed on for a few generations before switching—a recent observation (31) that changes the landscape of the discourse on common goods, cooperation, and cheating.
Dynamics of stochastic phenotypes can be followed through multiple generations using fluorescent time-lapse microscopy and single-cell tracking (8, 9). However, the number of distinct fluorescent reporters of gene expression in a single cell is inherently limited by their spectral overlap. Alternatively, phenotypic heterogeneity can be measured with relative ease using destructive or fixed cell methods [such as immunostaining (32) and fluorescence in situ hybridization (FISH) (10)] that only provide static snapshots. Destructive measurements can, however, be supplemented with lineage information (kinship) that can be collected using phase time-lapse microscopy and single-cell tracking. We ask: How much can one say about dynamics from a static snapshot of heterogeneity and the knowledge of the relatedness of the individuals in a population? Below, we shall take a constructive approach to this question, demonstrating that by adopting a certain plausible and quite general probabilistic description of phenotypic dynamics along lineages, it is indeed possible to infer the dynamics from static snapshots. We shall test the method on the example of Pvd dynamics in P. aeruginosa, comparing the inference to direct dynamical measurements.
Thus, our goal here is to provide a tool for the study of epigenetic dynamics within proliferating collectives of cells. We shall focus on the cell-autonomous dynamics and mother-to-daughter transmission and relate the statistical description of phenotypic dynamics along any one lineage to the observable correlations between phenotypic states in a snapshot of cells at any given time, which, as we shall see, explicitly depend on the degree of kinship of the cells. Below, after framing our approach as an inference problem (Inference Problem for Phenotypic Dynamics), we shall define a class of models parameterizing phenotypic dynamics on lineages (The Minimal Model of Stochastic Phenotype Propagation and Effective Interactions Between Siblings) and explicitly calculate the form of “kin correlations” from which the underlying dynamics is to be inferred. In Kin Correlations in the Poverdine Dynamics and Inferring the Interactions in P. aeruginosa, we shall apply the approach to the data on siderophore production in P. aeruginosa colonies (31), which will allow us to compare the inference results with the direct measurement of time-dependent phenotypes of all cells within the colony, validating our approach. Spatial Interactions will address the question of kinship and spatial correlations within a bacterial colony. In Discussion, we shall explain why kin correlations have a structure similar to that of correlations in conformal field theories known in physics (33, 34) and address possible practical applications of the approach.
Results
Inference Problem for Phenotypic Dynamics.
Consider a growing population of asexual individuals. At every generation, each individual gives rise to two daughters that, with some probability, inherit the phenotypic traits of their parent. This growing population is naturally represented as a tree (see Fig. 1): The most current population of cells corresponds to the leaves of the tree, while the branches represent its history back to the founder cell at the root. Phenotypic dynamics unfolds along the lineage linking any one leaf to the root, and correlations between kin arise from the fact that close relatives share more of their history. We shall assume that phenotypic dynamics is stochastic with some well-defined probabilistic rule (e.g., some Markovian random process), so that the state of a cell along its lineage through the genealogical tree is a realization of the random process. Phenotypic variability within cell population defines a distribution of states , where is the state of cell i, denotes averaging over the realization of the random dynamics, is the number of cells, and is equal to 1 if and is equal to 0 otherwise. In practice, averaging over different realizations of the random process is achieved by averaging over multiple observed trees.
Fig. 1.

(A) Phenotypic dynamics on a tree. The phenotypic state (color) of each node stochastically changes when inherited from the parent. Only the boundary nodes are accessible at the time of observation. Stochastic variation on the boundary is characterized by kin correlation functions, for example, the probability of observing blue and red colors on two nodes whose common ancestor was three generations back (). Similarly, the three-point correlation function can be investigated for a set of points, where the common ancestor of the two closest points is two generations back (), and that of all three is an additional two generations back (). (B) Pyoverdine distribution in a P. aeruginosa colony. Genealogy is captured by imaging the growth of the colony. At the last time step (390 min after the start of growth) the phenotype of the bacteria—the intensity of Pvd fluorescence—is imaged and assigned to each node.
Kin correlations are then defined as correlations between the phenotypic states of pairs, triples or, in general, m-tuples of leaves with the same degree of relatedness. More specifically, we characterize kin correlations by the joint distribution describing the probability of different cells being found simultaneously in certain states. For example, for the pair correlator, is defined in a given population (i.e., the single realization of the dynamics) as the fraction of all pairs of cells with the common ancestor u generations in the past that are in states m and n,
| [1] |
where is the genealogical distance, or the level of kinship, between cells , which is defined as the number of generations to their most recent common ancestor. is the number of all pairs at genealogical distance u. Because of the possible correlations, this joint probability may not be equal to the product of probabilities, , to observe n and m on their own. These correlations are explicitly captured by
| [2] |
which explicitly subtracts the uncorrelated (product) term.
Similarly, the triple distribution is defined by
| [3] |
where u is the number of generations to the common ancestor of the more closely related pair, v is the further number of generations back to the common ancestor of all three nodes (see Fig. 1), and is the total number of such triplets. To focus on the correlation effects, we subtract the contribution of independent fluctuations,
| [4] |
which is defined so that it goes to zero when joint probability factorizes. The so-called “connected correlators” and explicitly quantify the extent of pairwise and third-order correlation between the nodes on the boundary of the genealogical tree. How much can these readily measurable correlations, defined as they are by a snapshot of a population with known genealogy, tell us about the dynamics that unfolded on the tree?
The Minimal Model of Stochastic Phenotype Propagation.
Let us begin with the simplest possible model. Assume that stochastic dynamics can be approximated by a Markov process, which means that probability to transition from state n to a state m in the time of a cell cycle depends only on the two states involved; i.e., the dynamics is defined probabilistically by a transition probability matrix (with ). The probability for a cell to start in state n and end up in state m time u generations later is given by the product of the u transition matrices obtained by iterating . We can now calculate the joint distribution for a kin pair descending from a common ancestor in state l, u generations back,
| [5] |
The third-order correlator can be written down in a similar way,
| [6] |
In our minimal model, we assume that phenotypic states effectively form a chain with transitions occurring only between neighboring states (more generally, any graph without loops would behave the same way). In this case, stochastic dynamics satisfies Detailed Balance (33, 35) (see SI Text), meaning that, in equilibrium, the forward and backward fluxes between any pair of states balance: . This allows definition of a symmetric matrix such that . Note that , being the equilibrium probability of state m, satisfies and hence .
We note that thus defined, our minimal model of epigenetic dynamics is mathematically identical to the model studied by Harlow et al. (33) (in a very different context). Following ref. 33, we diagonalize the symmetric matrix, , and rewrite the transition matrix in terms of its orthonormal eigenvectors and eigenvalues ,
| [7] |
The equilibrium distribution corresponds to the largest eigenvalue and corresponding .
To take full advantage of the ensuing simplifications, we define correlators in the basis,
| [8] |
In this basis, pair correlators for our “minimal model” of phenotypic dynamics have a very simple form (33),
| [9] |
and similarly for the three-point correlator expressed in basis in analogy with Eq. 8.
| [10] |
where we have defined constants,
| [11] |
which are analogous to “structure constants” that appear in conformal field theories describing critical phenomena in physics (34, 36)—an interesting connection, explored by Harlow et al. in ref. 33, which we shall explain in Discussion.
Note that since , it follows from the orthonormality of eigenvectors that . It is easy to verify that connected correlators and are nonzero only for and are also given by Eqs. 9 and 10. We emphasize that is determined by , the eigenstates of the pair correlator; thus the pair correlators fully determine the three-point correlation functions.
In fact, it can be shown (see SI Text) that all of the higher-order correlators can be expressed completely in terms of and , which puts a strong and readily testable constraint on predicted correlators: A pair correlator can be used to define model parameters, and higher-order correlators can be used to test the model. Actually, as we shall show next, the simple diagonal form of the expression for is already a nontrivial consequence of assumed dynamics that must be tested to verify the underlying assumptions such as existence of detailed balance.
Kin Correlations in the Pyoverdine Dynamics in P. aeruginosa.
In the experiments of Julou et al. (31), the fluorescence of free Pvd in each bacterium was measured using time-lapse fluorescent microscopy, while the growth of the colony was followed with phase microscopy, providing the genealogical tree. For the analysis below (see Methods), we used only the final snapshots of Pvd distribution for nine colonies, each with cells. Each snapshot gives us Pvd concentrations in individual cells corresponding to the leaves of a genealogical tree nine generations deep. These concentrations were binned to three equally likely states, denoted from 1 to 3, defining, respectively, low, medium, and high concentration states. (Connecting to the general formulation presented above, we note that in analyzing the data, we can choose our freedom to define “bins” to set uniform.)
It is plausible to think of Pvd dynamics in the colony as a stochastic process on a tree subject to interactions that correspond to local exchange of Pvd. We begin by comparing the observed pairwise kin correlations to the prediction of our minimal model given by Eq. 9. To that end, we construct correlation matrices for pairs of leaves conditioned by their relatedness, u, and diagonalize them. Fig. 2A depicts the eigenvalues of the two-point correlation matrices as a function of relatedness u. The eigenvalues are taken to the power of to remove the trivial distance dependence (); for the minimal model considered above, this scaling will result in eigenvalues that are independent of u (see Eq. 9). The observed values, however, are significantly different from constant (see SI Text for the P values), suggesting either a presence of interaction or a deviation from the simple Markovian or detailed balance form of stochastic dynamics.
Fig. 2.
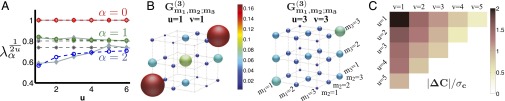
Kin correlations in P. aeruginosa data. (A) Eigenvalues of the two-point correlation matrix of the experimentally observed trees. The trivial distance dependence of the eigenvalues is scaled out (by taking the eigenvalues to the power of ), such that the minimal model would have constant eigenvalues. Solid gray lines are the actual eigenvalues. The largest eigenvalue is always 1, corresponding to the equilibrium mode . The dashed gray lines are the “naive” minimal model prediction calculated using the observed . The colored lines are the best fit of the interacting theory to the observed two-point correlation functions. (B) The three-point correlation function computed from the data at distances , and . The correlation function becomes more uniform as the separation distance increases. (C) Minimal model allows us to calculate the structure constants by observing only the second order correlators. Deviation of the minimal model structure constants (Eq. 11) from the actual structures constants inferred from the data, . The absolute value denotes the norm of matrix (Methods), which is normalized by the SD of the finite-size fluctuations expected in the structure constants (Methods). As expected, as the separation distance of the points on the boundary increases, the correlation functions more closely resemble those of the minimal model. The largest deviation (at ) has a statistical significance of 2 SD.
However, the observed eigenvalues deviate most at and then asymptote to a constant value with increasing u, suggesting the minimal model may still provide a good description of correlations among distant relatives. To test that, we examined third-order correlators, for which the minimal model predicts Eq. 10: an expression defined entirely in terms of the second-order correlators, without any additional parameters. (As noted above, this relation is the consequence of the hidden conformal symmetry of the process.) Fig. 2 B and C depicts the three-point correlation functions of the data. The eigenvectors of at were used as a naive approximation of . The were approximated as eigenvalues of taken to the power of . Within statistical error, Eq. 10, computed using at , seems to correctly predict the at distant boundary points; however, the deviation increases as closer points on the boundary are considered. At distance , the predicted third-order correlation function is significantly different from the experimental observation, which is not surprising, given the already noted deviations in observed pair correlations. However, the approximate agreement observed at longer genealogical distances is nontrivial and supports the validity of the model.
The fact that Eq. 10 correctly predicts the three-point correlation function (based on the measured pair correlator) for sufficiently distant relatives demonstrates that the simple minimal model already provides a reasonable approximation for the long-time dynamics, which is quite remarkable, as it confirms approximate validity of the detailed-balance and Markovian process assumptions. We shall next demonstrate that the deviations at short times can be accounted for by existence of interaction between sisters.
Effective Interactions Between Siblings.
We now generalize our minimal model to allow for interactions between siblings, which can, in effect, be captured in the form of the mother−daughter transmission function . The two-point correlator is now
| [12] |
describes possible correlation in the states of the two daughters as they “inherit” from the mother. [Because the unconditioned effect of the mother−daughter transition is subsumed in , we have ]. Finally, is the probability of the ancestor to be in state l.
Similarly, the third-order correlator is modified to
| [13] |
Without any simplifying assumptions on , we have a more general expression for the pair correlator,
| [14] |
with . Thanks to the consistency condition (and the fact that ), we have , so that the interaction mixes only the (decaying) eigenmodes of T.
In SI Text, we show that and are still recovered as the large u asymptotic eigenfunctions and eigenvalues of . Hence they can be directly estimated from the large u data. With obtained by diagonalizing for distant kin, we can obtain from the observed sister correlations . We can then, by diagonalizing , calculate finite u corrections to and and use these to get a corrected estimate for , defining an iterative process by which we fit interaction correction to the observed pair correlators.
Pair correlators, however, do not fully determine the interaction, and we next consider the third-order functions. Rewriting Eq. 13 in terms of the eigenvectors of the large u (conformal) limit, we find
| [15] |
with the definition
| [16] |
which reduces to a multiple of the symmetric structure constants in the absence of interaction, when . We also observe that is already determined by the analysis of pair correlations. Because decreases with increasing δ, one can approximate by truncating the sum over δ and proceed to define by least-square fitting the (overdetermined, on account of dependence) linear system relating it to . In practice, with limited data, we retain only the leading correction term (), which, as we demonstrate below, can already provide a satisfactory approximation.
Testing Interaction Inference on Simulated Data.
The above inference algorithm was applied to simulated trees with random sibling interactions (see SI Text for details). The empirical second- and third-order correlators were measured by counting occurrences of pairs and triplets of phenotypic states as a function of relatedness using Eqs. 1 and 3. Eigenvectors and eigenvalues of ( and ) were calculated using the two-point correlator at the largest distance . As discussed above, the minimal model is accurate, even with interactions at large separation distances. We then calculated a “naive” prediction from the minimal model of what the correlation functions () should be at other distances and higher orders using Eqs. 9−11.
We used three parameters to fit the deviations using the interactive form of the second-order correlator (corresponding to the unique nonvanishing terms in the matrix ). Another three parameters were fit to the third-order correlators with the series in Eq. 15. terminated at the leading order (SI Text). Correlators at all distances u () were fit simultaneously to determine the free parameters in [truncated ] that minimized the least-square difference between the observed and predicted []. Inferred transition matrix was then computed from using Eq. 16. Fig. 3 shows the reduction in deviation of the predicted correlators from observed correlators as interactions are introduced into the minimal model. Fitting the three-point correlators clearly improves the inference of the transition matrix (Fig. 3D).
Fig. 3.
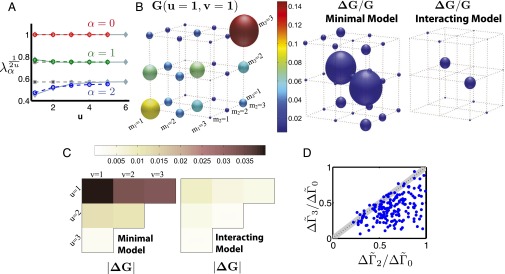
In silico test of the inference algorithm. (A) Eigenvalues of the two-point correlation matrix of nodes whose common ancestor is u generations back for trees generated from a randomly chosen interacting transition matrix . The trivial scaling with distance has been removed, such that the eigenvalues of the minimal model with no sibling interactions would be constant. Solid gray lines are the actual eigenvalues computed from simulated trees with interactions (see SI Text for details). The largest eigenvalue is always 1, corresponding to the stationary mode. The dashed gray lines are the minimal model prediction calculated using the observed . The colored lines are the interactive model fit to the observed two-point correlation functions. (B) The observed three-point correlation function is depicted as matrix for (Left). The fractional deviation of each element of the predicted three-point correlator (Eq. 10) from its actual value, (depicted schematically as the diameter of the spheres), for the minimal model and interacting model (Right). The predicted correlation functions clearly improve with introduction of interactions. (C) The cumulative deviation in the predicted at different distances for the minimal model and with corrections from interactions. Deviation is the norm of the matrix . Deviations are larger for closer boundary points. (D) Deviation of the inferred transition matrix from the actual one for many randomly generated . Distance based on the norm is used to quantify the deviation, , for minimal model , interactions fit to the two-point correlators , and interactions fit to the three-point correlators . Fitting the three-point correlation functions improves the inference.
Inferring the Interactions in P. aeruginosa.
We now return to P. aeruginosa and attempt to infer the form of the interactions from the observed kin correlations of Pvd. Following the above recipe, we have fit the free parameters in to the observed two-point correlation functions, correctly capturing the deviations in the eigenvalues of matrices with u (Fig. 2A, colored curves). The inferred switching rates are consistent with the switching rates that have been measured by observing the phenotypic states of parents and daughters in the bulk of the tree (Fig. 4A). The apparent decrease in the probability of conserving the parental phenotype in the bulk dynamics is due to the ambiguity in determining the parent phenotype; Pvd concentration can fluctuate significantly during a cell cycle.
Fig. 4.

Inferring the form of interactions in P. aeruginosa. (A, Left) The inferred switching rates (probability per generation) between the three Pvd states (low, medium, and high) along a single lineage, . is the transition matrix inferred by fitting the interacting model to the two-point correlation functions of the observed trees up to second cousins. (Right) The transition rates are deduced from direct observations of Pvd states of parents and daughters in the bulk of the tree. The phenotypic state seems less likely to be conserved from direct measurements in the bulk. The discrepancy, however, is due to the ambiguity in determining the state of the parent. (B) The change in likelihood of observing sibling pair 1–3 from a particular parent state s due to interactions (inferred values shown on the left). This is the ratio of the joint distribution of the sibling states over a separable distribution constructed from the marginal distributions . The separable distribution corresponds to independent lineages with no interactions. Occurrence of 1-3 siblings is significantly smaller with interactions. The change in likelihood is also independent of the state of the parent s. This is consistent with exchange interactions that decrease Pvd differentials between neighboring cells regardless of the lineage history. The inferred interaction is consistent with what is directly measured using the phenotypic states in the bulk of the tree (Right). Transitions from parent state 2 to daughter states 1–3 are rare, and their change in likelihood was not statistically significant in our limited data set.
The inferred at this order—the limited nature of data does not allow us to fit higher-order correlators—contains a clear signature of interactions. The probability of one daughter cell having a low Pvd concentration while the other has a high Pvd concentration is significantly reduced compared with the noninteracting case (Fig. 4B). This is consistent with nearest neighbor exchange of Pvd, which reduces sharp gradients (1-3 states) between neighboring cells, in particular, siblings. Fig. 4B also shows that the change in likelihood of occurrence of certain sibling pairs is independent of the state of the parent.
Moreover, from the calculated decrease in the likelihood of observing 1-1 siblings pairs and the time scale for division (40 min), we can crudely estimate the exchange rate between neighbors. Define , the difference between Pvd concentration of a cell and its neighbor. Exchange decreases over time, . If exchange were infinitely fast (or occurred with probability 1 at each generation), we would never observe 1-3 (low-high) pairs. Our inferred interaction indicates that 1-3 pairs occur with 1/2 the frequency expected in the absence of interactions. At each generation, probability of exchange is roughly 1/2. At each exchange, and min, yielding the crude order of magnitude estimate /min. This prediction is consistent with the value calculated from the direct observation of Pvd dynamics following individual cells (31).
Spatial Interactions.
In this section, we address the spatial nature of Pvd exchange. First, we argue that a model that only includes interactions between sisters can be used to infer interactions that take place between all neighboring bacteria in the colony. Next, we try to estimate the expected spatial correlations in Pvd concentration of cells in a colony. To do so, we restore the interactions inferred from siblings to all neighboring pairs of bacteria.
Local interactions in P. aeruginosa colonies are believed to be due to the exchange of Pvd. While exchange of Pvd between neighbors can correlate concentrations found in sister cells, exchange is not limited to siblings and occurs between all adjacent bacteria regardless of the degree of relatedness. Nevertheless, we shall argue that the effect of local exchange on the distribution of Pvd on the genealogical tree can be effectively represented through interactions between siblings.
Fig. 5 shows the relationship between spatial distance and the degree of relatedness in the colonies followed in the experiments. Each bacterium has, on average, seven neighbors, defined as cells located within 1.5 cell widths. Although it is more likely to find the sister as one of cell’s neighbors (with probability 0.4 compared with 0.03 for any particular seventh cousin), the neighborhood is dominated by distant cousins. This is because the number of cousins grows exponentially for each additional generation back to the common ancestor.
Fig. 5.
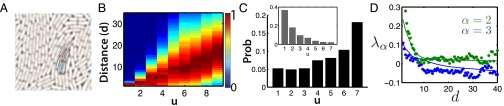
Spatial proximity as a function of relatedness. (A) Neighbors are defined to be within 1.5 cell widths of a given bacterium. The red bacterium has six neighbors shaded in blue. The average number of neighbors is seven. (B) Distribution of pair-wise spatial distances (in units of average bacterium width) between all pairs of bacteria whose common ancestor is u generations back, computed over nine colonies of nine generations. Distribution at each value of u has its maximum normalized to 1; color scale is shown on the right. The spatial distance on average increases with increasing genealogical distance. However, there are large fluctuations. (C) Probability that a randomly chosen nearest neighbor pair has a common ancestor u generations back. It is most likely to find distant cousins () adjacent to each other. This is because there are exponentially more cousins going back each generation to the common ancestor. If we normalize for number of relatives at distance u (Inset), we observe that with probability , the sister will be adjacent to its sibling. However, a particular distant cousin is a neighbor with probability less than 0.03. (D) Second and third eigenvalues of the spatial correlation matrix as a function of separation distance; the first eigenvalue is trivially equal to 1. The solid lines are the prediction of the model (with no fitting parameters) and capture the change in correlation with decreasing separation distance.
Thus, exchange with near neighbors is dominated by the exchange with distant relatives, which effectively averages over the whole distribution without contributing to kin correlations. In the limit of a well-mixed population, where neighbors are random nodes from the current generation, local exchange would contribute exactly nothing to kin correlations: Any interaction that is not systematically coupled to the topology of the tree is irrelevant. Bacteria on the plate, however, are not that well mixed: The sister cell is systematically a neighbor and couples the exchange interaction to the topology of the tree. Although close relatives are also overrepresented among near neighbors, we found that to a good approximation to account for local Pvd exchange, it suffices to introduce interactions between sisters.
In the absence of direct spatial interactions, it is possible to map kin correlations to spatial correlations—the probability of observing a pair of bacteria in states m and n at separation distance d,
| [17] |
where is the probability of observing a relative of lineage distance u at separation distance d. This distribution is determined empirically by tracking the growth of the colony and is depicted in Fig. 5B. Here, is the number of relatives at lineage distance u.
In P. aeruginosa colonies, however, direct spatial interactions exist. Local exchange of Pvd implies that kin correlations do not capture all of the spatial correlations. We must reintroduce interactions between neighbors that were averaged out when we computed the kin correlators on the lineage tree. A simple way to do so is using the following observation: Progenies of distant ancestors that by chance remain nearest neighbors of closer ancestors are, in effect, more highly correlated than would be expected from degree of relatedness alone. This is because nearest neighbors are more likely to be in the same phenotypic state. Using this observation (see Methods) and the empirical measurement of the probability of finding a relative at lineage distance u as a nearest neighbor (Fig. 5C, Inset), we can estimate without using any fitting parameters. Fig. 5D shows that the prediction is in good agreement with the observed spatial correlations.
Discussion
In this study, we have systematically related phenotypic correlation as a function of kinship, or kin correlations, to the underlying epigenetic dynamics. Introducing a rather general class of models, we were able to formulate a method for inferring dynamical parameters from static measurements on cell populations supplemented by the lineage information. This method was then applied to the data on the dynamics of Pyoverdine in P. aeruginosa colonies, with the result validated by the comparison with the direct measurements of Pvd dynamics along cell lineages.
Our analysis was based on the minimal model of epigenetic dynamics which assumed (i) independent transmission of phenotype from mother cell to its two daughters and (ii) detailed balance property of stochastic transitions between phenotypic states. The former assumption was subsequently relaxed, replaced by a general probabilistic model of epigenetic transmission that allowed parameterization of interaction between sister cells. The profound advantage of our minimal model as a starting point is the highly constrained form of the correlations that it entails: Higher-order correlators are completely defined in terms of the pair correlators. Exactly the same relation between correlators is known in field theories describing critical phenomena and is associated with conformal symmetry (33, 34)—a fact noticed by Harlow et al. (33) in the general context of Markovian dynamics on Bethe lattices. It is remarkable that the minimal model of epigenetic dynamics on lineages, with its highly constrained correlators, provides a good description of experimentally observed correlations among distant P. aeruginosa cells (31).
The relation between pair and higher-order kin correlations follows from the Detailed Balance property of the minimal model (33). The assumption of detailed balance in the dynamics makes forward and reverse time directions indistinguishable: There is no “arrow of time” associated with lineage dynamics, and the tree is effectively unrooted. As a result, correlations can depend only on the genealogical distance along the tree and must be explicitly independent of the position relative to the root. Now, any unrooted tree may be regarded as a finite chunk of a “Bethe lattice,” where each vertex joins three infinite binary trees, and all vertices are equivalent.
However, unlike a regular lattice (such as the square grid example in Fig. 6A) where the number of nodes is a polynomial of lattice size, the Bethe lattice grows exponentially in the number of generations. A representation of the Bethe lattice where all of the angles and edge lengths are constant is fundamentally impossible in Euclidean space. It is possible, however, to embed the Bethe lattice in hyperbolic space, where the negative curvature provides exponentially growing room with increasing distance (37). Fig. 6B is a representation of a tree in hyperbolic space using the Poincare disk model (37) (see SI Text for details). The angles between the edges are the same for all of the nodes in this representation, and the Poincare disk metric makes all branch lengths equal.
Fig. 6.

Conformal symmetry of correlation functions on trees. (A) There are transformations that leave the square lattice unchanged, such as rotation by 90 degrees, and translation by integer multiples of a lattice constant. Invariance of the lattice under these transformations implies that the correlation functions must obey rotational and translational symmetries. (B) A tree cannot be represented in Euclidean space as a lattice. However, it is possible to do so in hyperbolic space. Here, a tree in hyperbolic space is visualized using the Poincare disk; all of the angles and branch lengths of the tree are constant (much like the square lattice shown in A). The four images are snapshots of a conformal transformation that maps the tree back onto itself (the color coding is a guide for the eyes). Since the tree is unchanged, the correlation functions on a tree must obey conformal symmetry.
There are transformations, such as rotation by 90 degrees and translations by integer multiples of a lattice constant, that leave the square lattice unchanged (Fig. 6A). The invariance of the square lattice under these transformations implies that its correlation functions obey rotational and translational symmetries. A lattice in hyperbolic space is invariant under additional transformations. An easy way to see this is to consider the Poincare disk representation of trees (Fig. 6B). Conformal transformations of the Poincare disk onto itself (see SI Text) are isometries that leave the lattice invariant (37). Since these transformations do not change the relative position of the bulk nodes, correlation functions on the tree must obey conformal symmetry, which accounts for their strongly constrained form (34).
The connection between our Eqs. 9 and 11 and correlators typically computed in conformal field theories (33, 34) is explained in detail in SI Text. However, this unexpected connection, while providing interesting context for our findings, adds little computational power, as all of the key results followed directly from the analysis of Markovian dynamics on a tree.
Despite its generality, the proposed approach has a number of obvious limitations. Virtually by definition, it is blind to phenotypic dynamics that occur on a time scale shorter than a cell cycle and phenotypes that are not transmitted from mother to daughter. Such fluctuations do not contribute to kin correlations; furthermore, they would tend to mask the epigenetically heritable phenotypic variation. Another limitation was evident in our analysis of Pvd dynamics. Our focus on epigenetic dynamics along lineages does not allow for easy incorporation of information on spatial proximity. As a result, instead of directly estimating the interactions due to local exchange of Pvd, we estimated the effect of this interaction on kin correlation, which comes about because siblings are more likely to be exchanging with each other than with anyone else. Hence, our inference yields effective interactions, the origin of which must be examined to be properly interpreted. Other limitations of the present approach, such as discretization of the phenotypic state space state and discretization of time (corresponding to synchronously dividing population), are less fundamental. The model can be generalized to relax these assumptions if warranted by the system under consideration and the extent of available data.
Our example of inferring Pvd dynamics should be thought of as a proof of principle. Dynamics of (naturally fluorescent) Pvd can be directly observed using time-lapse fluorescent microscopy. Dynamic reporters in general, however, require nontrivial genome engineering, and, at best, are limited to a few spectrally distinct fluorophores. By contrast, measurements such as FISH and immunostaining do not have these limitations, but only provide static snap shots (10, 32, 38). High throughput technologies can simultaneously measure numerous biomarkers in large populations at a single-cell resolution (10, 39–45), resulting in a snapshot of a high-dimensional phenotypic space. Our approach is ideally suited for these applications.
More specifically, we envision our analysis applied to understanding developmental programs and dynamics of epigenetic states in stem cells. In these systems, lineage information can be obtained from nonintrusive time-lapse microscopy, and fixed cell measurements such as FISH can provide a snapshot of the expression levels of many genes simultaneously (46). Evidence of broken detailed balance in stem cell epigenetic states can potentially shed light on the underlying pluripotency network. Similar analysis on cancer cellular states (32) can elucidate the dynamics of phenotypic switching in cancer cells without a need for dynamic reporters. Moreover, lineage structure of antibody repertoires (47) and tumor cells (48, 49), when supplemented with single-cell phenotyping, are ideally suited for analysis using our framework. Lastly, our approach can be used to disentangle phenotypic correlations due to shared lineage from those due to other factors such as signaling, which is of particular interest for understanding differentiation and reprogramming (50).
Methods
Analyzing the Experimental Data.
The experimental data were in the form of a series of images captured from the growth of P. aeruginosa microcolonies; for details of the experiments, see ref. 31. Nine microcolonies were analyzed. The boundary was defined to be the population on the last image. The distance of a pair of boundary nodes was calculated by counting the number of divisions from each node to their common ancestor (CA)—determined by tracing back their history in the images. Although the division time of the bacteria was on average 40 min, fluctuations were observed; number of generations to the CA was sometimes not the same for the two nodes. For these cases, we randomly selected the value for one of the nodes as the distance. The same method was used to determine the distances between three boundary points (values of u and v).
The signal (Pvd concentration) in each image was calculated as follows: The fluorescence intensity in the cell was subtracted from background fluorescence in that image and then normalized by the mean signal of all of the cells in the image. Normalization removes the effect of increase in the total Pvd concentration in the microcolony over time. The resultant signal distribution is stationary (see SI Text). For the boundary cells, we discretized the signal into three phenotypes (low, medium, and high Pvd levels; respectively, 1–3) by binning the signal to ensure a uniform distribution (equal numbers) of each phenotype.
In Fig. 2C, the statistical error of the experimental data was estimated by simulating the inferred transition matrix for 64,000 iterations of nine trees of nine generations. The eigenvalues and eigenvectors of the inferred transition matrix were obtained from the observed two-point correlation at . The are the eigenvectors of , and are its eigenvalues to the power of 1/10. is calculated using the and Eq. 11. is estimated from the third-order correlators using Eq. 10. The deviation is calculated using the matrix norm, , divided by the SD of over the 64,000 iterations. We use Frobenius norm, which for a matrix is defined by .
The bulk transition rates in Fig. 4 were determined by counting all occurrences of the phenotypic states of parent and daughter cells in the observed trees. The phenotypic state of a bulk node was taken to be the Pvd state at the last time point of the cell cycle. The results were not sensitive to this choice.
Lineages in Space.
Distance between any pair of bacteria in a colony is defined as the minimum distance between either pole or centroid of one bacterium and either pole or centroid of the other. Nearest neighbors are defined as pairs whose distance is less than 1.5 times the average cell width. Fig. 5 was computed using spatial information from nine colonies of nine generations. The average coordination number is 7.
Predicting Spatial Correlations.
The descendants of an ancestor at lineage distance that remain nearest neighbors of the ancestor at lineage distance u have undergone exchange with the latter ancestor for generations. These bacteria contribute to the spatial correlations as relatives not of distance but rather of distance u.
We include the contribution of these “effective” ancestors as follows:
| [18] |
where is the probability that exchange has not happened in generations. Here, τ is the mean waiting time for exchange, which we estimated roughly as two generations using our inference, . is probability of finding an individual of relatedness u at spatial distance r, and is the empirically observed probability that a particular cousin at lineage distance u is a nearest neighbor (Fig. 5C, Inset). is the normalization constant.
Supplementary Material
Acknowledgments
The authors thank Stephen Shenker, Douglas Stanford, Richard Neher, and David Bensimon for stimulating discussions and helpful comments. This research was supported in part by the National Science Foundation under Grant NSF PHY11-25915. B.I.S. also acknowledges support from National Institutes of Health Grant R01-GM086793. N.D. acknowledges support from Grant ANR-2011-JSV5-005-01.
Footnotes
The authors declare no conflict of interest.
This article contains supporting information online at www.pnas.org/lookup/suppl/doi:10.1073/pnas.1504407112/-/DCSupplemental.
References
- 1.Probst AV, Dunleavy E, Almouzni G. Epigenetic inheritance during the cell cycle. Nat Rev Mol Cell Biol. 2009;10(3):192–206. doi: 10.1038/nrm2640. [DOI] [PubMed] [Google Scholar]
- 2.Goldberg AD, Allis CD, Bernstein E. Epigenetics: A landscape takes shape. Cell. 2007;128(4):635–638. doi: 10.1016/j.cell.2007.02.006. [DOI] [PubMed] [Google Scholar]
- 3.Rando OJ, Verstrepen KJ. Timescales of genetic and epigenetic inheritance. Cell. 2007;128(4):655–668. doi: 10.1016/j.cell.2007.01.023. [DOI] [PubMed] [Google Scholar]
- 4.Bird A. DNA methylation patterns and epigenetic memory. Genes Dev. 2002;16(1):6–21. doi: 10.1101/gad.947102. [DOI] [PubMed] [Google Scholar]
- 5.Riggs AD. DNA methylation and cell memory. Cell Biophys. 1989;15(1-2):1–13. doi: 10.1007/BF02991574. [DOI] [PubMed] [Google Scholar]
- 6.Li E. Chromatin modification and epigenetic reprogramming in mammalian development. Nat Rev Genet. 2002;3(9):662–673. doi: 10.1038/nrg887. [DOI] [PubMed] [Google Scholar]
- 7.Hemberger M, Dean W, Reik W. Epigenetic dynamics of stem cells and cell lineage commitment: Digging Waddington’s canal. Nat Rev Mol Cell Biol. 2009;10(8):526–537. doi: 10.1038/nrm2727. [DOI] [PubMed] [Google Scholar]
- 8.Locke JCW, Elowitz MB. Using movies to analyse gene circuit dynamics in single cells. Nat Rev Microbiol. 2009;7(5):383–392. doi: 10.1038/nrmicro2056. [DOI] [PMC free article] [PubMed] [Google Scholar]
- 9.Young JW, et al. Measuring single-cell gene expression dynamics in bacteria using fluorescence time-lapse microscopy. Nat Protoc. 2012;7(1):80–88. doi: 10.1038/nprot.2011.432. [DOI] [PMC free article] [PubMed] [Google Scholar]
- 10.Lubeck E, Cai L. Single-cell systems biology by super-resolution imaging and combinatorial labeling. Nat Methods. 2012;9(7):743–748. doi: 10.1038/nmeth.2069. [DOI] [PMC free article] [PubMed] [Google Scholar]
- 11.Lachmann M, Jablonka E. The inheritance of phenotypes: An adaptation to fluctuating environments. J Theor Biol. 1996;181(1):1–9. doi: 10.1006/jtbi.1996.0109. [DOI] [PubMed] [Google Scholar]
- 12.Kussell E, Leibler S. Phenotypic diversity, population growth, and information in fluctuating environments. Science. 2005;309(5743):2075–2078. doi: 10.1126/science.1114383. [DOI] [PubMed] [Google Scholar]
- 13.Raj A, van Oudenaarden A. Nature, nurture, or chance: Stochastic gene expression and its consequences. Cell. 2008;135(2):216–226. doi: 10.1016/j.cell.2008.09.050. [DOI] [PMC free article] [PubMed] [Google Scholar]
- 14.Thattai M, van Oudenaarden A. Stochastic gene expression in fluctuating environments. Genetics. 2004;167(1):523–530. doi: 10.1534/genetics.167.1.523. [DOI] [PMC free article] [PubMed] [Google Scholar]
- 15.Ratcliff WC, Denison RF. Individual-level bet hedging in the bacterium Sinorhizobium meliloti. Curr Biol. 2010;20(19):1740–1744. doi: 10.1016/j.cub.2010.08.036. [DOI] [PubMed] [Google Scholar]
- 16.Balaban NQ, Merrin J, Chait R, Kowalik L, Leibler S. Bacterial persistence as a phenotypic switch. Science. 2004;305(5690):1622–1625. doi: 10.1126/science.1099390. [DOI] [PubMed] [Google Scholar]
- 17.Veening JW, et al. Bet-hedging and epigenetic inheritance in bacterial cell development. Proc Natl Acad Sci USA. 2008;105(11):4393–4398. doi: 10.1073/pnas.0700463105. [DOI] [PMC free article] [PubMed] [Google Scholar]
- 18.Cağatay T, Turcotte M, Elowitz MB, Garcia-Ojalvo J, Süel GM. Architecture-dependent noise discriminates functionally analogous differentiation circuits. Cell. 2009;139(3):512–522. doi: 10.1016/j.cell.2009.07.046. [DOI] [PubMed] [Google Scholar]
- 19.Celiker H, Gore J. Cellular cooperation: Insights from microbes. Trends Cell Biol. 2013;23(1):9–15. doi: 10.1016/j.tcb.2012.08.010. [DOI] [PubMed] [Google Scholar]
- 20.Hamilton WD. The genetical evolution of social behaviour. I. J Theor Biol. 1964;7(1):1–16. doi: 10.1016/0022-5193(64)90038-4. [DOI] [PubMed] [Google Scholar]
- 21.West SA, Griffin AS, Gardner A. Evolutionary explanations for cooperation. Curr Biol. 2007;17(16):R661–R672. doi: 10.1016/j.cub.2007.06.004. [DOI] [PubMed] [Google Scholar]
- 22.Wilson DS, Wilson EO. Rethinking the theoretical foundation of sociobiology. Q Rev Biol. 2007;82(4):327–348. doi: 10.1086/522809. [DOI] [PubMed] [Google Scholar]
- 23.Losick R, Desplan C. Stochasticity and cell fate. Science. 2008;320(5872):65–68. doi: 10.1126/science.1147888. [DOI] [PMC free article] [PubMed] [Google Scholar]
- 24.Eldar A, Elowitz MB. Functional roles for noise in genetic circuits. Nature. 2010;467(7312):167–173. doi: 10.1038/nature09326. [DOI] [PMC free article] [PubMed] [Google Scholar]
- 25.Balázsi G, van Oudenaarden A, Collins JJ. Cellular decision making and biological noise: From microbes to mammals. Cell. 2011;144(6):910–925. doi: 10.1016/j.cell.2011.01.030. [DOI] [PMC free article] [PubMed] [Google Scholar]
- 26.Waters CM, Bassler BL. Quorum sensing: Cell-to-cell communication in bacteria. Annu Rev Cell Dev Biol. 2005;21:319–346. doi: 10.1146/annurev.cellbio.21.012704.131001. [DOI] [PubMed] [Google Scholar]
- 27.Ruhe ZC, Low DA, Hayes CS. Bacterial contact-dependent growth inhibition. Trends Microbiol. 2013;21(5):230–237. doi: 10.1016/j.tim.2013.02.003. [DOI] [PMC free article] [PubMed] [Google Scholar]
- 28.Hider RC, Kong X. Chemistry and biology of siderophores. Nat Prod Rep. 2010;27(5):637–657. doi: 10.1039/b906679a. [DOI] [PubMed] [Google Scholar]
- 29.Buckling A, et al. Siderophore-mediated cooperation and virulence in Pseudomonas aeruginosa. FEMS Microbiol Ecol. 2007;62(2):135–141. doi: 10.1111/j.1574-6941.2007.00388.x. [DOI] [PubMed] [Google Scholar]
- 30.Schalk IJ. Metal trafficking via siderophores in Gram-negative bacteria: Specificities and characteristics of the pyoverdine pathway. J Inorg Biochem. 2008;102(5-6):1159–1169. doi: 10.1016/j.jinorgbio.2007.11.017. [DOI] [PubMed] [Google Scholar]
- 31.Julou T, et al. Cell−cell contacts confine public goods diffusion inside Pseudomonas aeruginosa clonal microcolonies. Proc Natl Acad Sci USA. 2013;110(31):12577–12582. doi: 10.1073/pnas.1301428110. [DOI] [PMC free article] [PubMed] [Google Scholar]
- 32.Gupta PB, et al. Stochastic state transitions give rise to phenotypic equilibrium in populations of cancer cells. Cell. 2011;146(4):633–644. doi: 10.1016/j.cell.2011.07.026. [DOI] [PubMed] [Google Scholar]
- 33.Harlow D, Shenker S, Stanford D, Susskind L. 2011. Eternal symmetree. arXiv:1110.0496.
- 34.DiFrancesco P, Mathieu P, Senechal D. Conformal Field Theory. Springer; New York: 1999. [Google Scholar]
- 35.Isihara A. Statistical Physics. Academic; New York: 1971. [Google Scholar]
- 36.Itzykson C, Drouffe JM. Statistical Field Theory. Cambridge Univ Press; Cambridge, UK: 1989. [Google Scholar]
- 37.Anderson JW. Hyperbolic Geometry. Springer; London: 2005. [Google Scholar]
- 38.Kalisky T, Quake SR. Single-cell genomics. Nat Methods. 2011;8(4):311–314. doi: 10.1038/nmeth0411-311. [DOI] [PubMed] [Google Scholar]
- 39.Kitano H. Systems biology: A brief overview. Science. 2002;295(5560):1662–1664. doi: 10.1126/science.1069492. [DOI] [PubMed] [Google Scholar]
- 40.Loo LH, Wu LF, Altschuler SJ. Image-based multivariate profiling of drug responses from single cells. Nat Methods. 2007;4(5):445–453. doi: 10.1038/nmeth1032. [DOI] [PubMed] [Google Scholar]
- 41.Rauch T, Pfeifer GP. Methylated-CpG island recovery assay: A new technique for the rapid detection of methylated-CpG islands in cancer. Lab Invest. 2005;85(9):1172–1180. doi: 10.1038/labinvest.3700311. [DOI] [PubMed] [Google Scholar]
- 42.Bibikova M, et al. High-throughput DNA methylation profiling using universal bead arrays. Genome Res. 2006;16(3):383–393. doi: 10.1101/gr.4410706. [DOI] [PMC free article] [PubMed] [Google Scholar]
- 43.Kalisky T, Blainey P, Quake SR. Genomic analysis at the single-cell level. Annu Rev Genet. 2011;45:431–445. doi: 10.1146/annurev-genet-102209-163607. [DOI] [PMC free article] [PubMed] [Google Scholar]
- 44.Segata N, et al. Computational meta’omics for microbial community studies. Mol Syst Biol. 2013;9:666. doi: 10.1038/msb.2013.22. [DOI] [PMC free article] [PubMed] [Google Scholar]
- 45.Soon WW, Hariharan M, Snyder MP. High-throughput sequencing for biology and medicine. Mol Syst Biol. 2013;9:640. doi: 10.1038/msb.2012.61. [DOI] [PMC free article] [PubMed] [Google Scholar]
- 46.Singer ZS, et al. Dynamic heterogeneity and DNA methylation in embryonic stem cells. Mol Cell. 2014;55(2):319–331. doi: 10.1016/j.molcel.2014.06.029. [DOI] [PMC free article] [PubMed] [Google Scholar]
- 47.Jiang N, et al. Lineage structure of the human antibody repertoire in response to influenza vaccination. Sci Transl Med. 2013;5(171):171ra119. doi: 10.1126/scitranslmed.3004794. [DOI] [PMC free article] [PubMed] [Google Scholar]
- 48.Navin N, et al. Tumour evolution inferred by single-cell sequencing. Nature. 2011;472(7341):90–94. doi: 10.1038/nature09807. [DOI] [PMC free article] [PubMed] [Google Scholar]
- 49.Wang Y, et al. Clonal evolution in breast cancer revealed by single nucleus genome sequencing. Nature. 2014;512(7513):155–160. doi: 10.1038/nature13600. [DOI] [PMC free article] [PubMed] [Google Scholar]
- 50.Plath K, Lowry WE. Progress in understanding reprogramming to the induced pluripotent state. Nat Rev Genet. 2011;12(4):253–265. doi: 10.1038/nrg2955. [DOI] [PMC free article] [PubMed] [Google Scholar]
Associated Data
This section collects any data citations, data availability statements, or supplementary materials included in this article.