

Abstract
The neural substrate of sleep homeostasis is unclear, but both cortical and subcortical structures are thought to be involved in sleep regulation. To test whether prior neuronal activity in the cortex or in subcortical regions drives sleep rebound, we systemically administered atropine (100 mg/kg) to rats, producing a dissociated state with slow-wave cortical EEG but waking behavior (eg. locomotion). Atropine injections during the light period produced six hours of slow-wave cortical EEG but also subcortical arousal. Afterwards, rats showed a significant increase in non-rapid eye movement (NREM) sleep, compared to the same period on a baseline day. Consistent with the behavioral and cortical EEG state produced by systemic atropine, c-Fos expression was low in the cortex but high in multiple subcortical arousal systems. These data suggest that subcortical arousal and behavior are sufficient to drive sleep homeostasis, while a sleep-like pattern of cortical activity is not sufficient to satisfy sleep homeostasis.
Keywords: cortex, arousal, atropine, c-Fos, homeostasis
INTRODUCTION
Sleep homeostasis is a fundamental mechanism that regulates and maintains the quantity and quality of sleep. Extended wakefulness increases homeostatic sleep drive, or sleep pressure. This homeostatic drive manifests as an increase, or rebound, in the amount of sleep, as well as an increase in the delta power (0.5–4 Hz) of the cortical electroencephalogram (EEG). Delta EEG, along with total sleep time, is hypothesized to be the primary biomarker of the sleep homeostatic drive. Supporting this, recent studies have shown that local cortical activity during wakefulness increases cortical slow wave activity (SWA) during the subsequent NREM sleep period (Vyazovskiy et al., 2011). However, others have argued that delta power is an epiphenomenon of sleep homeostasis (Davis et al., 2011). Complete midbrain transection in rat pups and adult cats show that the forebrain is necessary for sleep homeostasis (de Andres et al., 2003, Villablanca, 2004, Todd et al., 2010). Specifically, these and other studies (Gvilia et al., 2006a, Gvilia et al., 2006b, Gvilia et al., 2011) speculate that the hypothalamus may be the key neuronal substrate for sleep homeostasis. SWA is clearly a marker for local sleep homeostasis and may drive a local cortical homeostatic response, but it is unclear if SWA per se is sufficient to satisfy the global sleep homeostatic drive.
Systemic atropine administration in rodents slows the cortical EEG and reduces expression of the neuronal activity marker c-Fos throughout the cortex, but during this state rodents exhibit normal behavior (eating, drinking, grooming and walking) and a wake-like increase in electromyographic (EMG) activity (Vanderwolf, 1988, 1992, Qiu et al., 2014). Consistent with the animal’s behavioral state, atropine induces c-Fos in arousal systems such as the tuberomammillary nucleus (TMN) and locus ceruleus (LC) but not in the sleep systems such as the ventrolateral preoptic nucleus (VLPO) (Qiu et al., 2014). Atropine thus creates a dissociated state, with cortical sleep-like EEG but wake-like subcortical arousal behavior (Irmis, 1971, Davis et al., 2011, Qiu et al., 2014). This dissociation allows us to examine whether sleep-like cortical activity can satisfy the sleep homeostasic drive. We administered atropine to rats during the light period, producing a six hour dissociated state when rats would otherwise be sleeping. We then recorded sleep-wake behavior afterwards to determine if induction of this sleep-like cortical activity was sufficient to satisfy homeostatic sleep need and prevent sleep rebound.
Experimental procedures
Animals
Pathogen-free adult male Sprague-Dawley rats (280–300 g, Harlan) were individually housed with ad libitum access to food and water. All animals were housed under light-controlled conditions (12 h light/12 h dark cycle, with lights on at 07:00 h; 100 lux) in an isolated ventilated chamber maintained at 20–22°C. All protocols were approved by the Institutional Animal Care and Use Committees of Beth Israel Deaconess Medical Center, and these experiments were carried out in accordance with U.S. National Institutes of Health guidelines regarding the care and use of animals for experimental procedures. Every effort was made to minimize the number of animals used and any pain and discomfort experienced by the animals.
Polygraphic recording and analysis
Under anesthetia (ketamine 100mg/kg and xylazine 10mg/kg, i.p.), eight rats were implanted with electrodes for recording EEG and EMG as described previously (Lu et al., 2000, Qiu et al., 2010) and were allowed to recover for 7–10 days. After recovery, animals were transferred to the recording room and habituated to the recording cables and room for 2 days. Following this habituation period, 48 hr EEG/EMG activity (AM systems, USA) from the beginning of the light period (07:00) was recorded from all the rats. The cortical EEG and EMG signal were amplified, digitized at a sampling rate of 256 Hz, and recorded using VitalRecorder (Kissei Comtec, Nagano, Japan). The behavior of the animals was recorded simultaneously with time-locked video recordings. EEG/EMG were filtered (EEG, 0.5–40 Hz band-pass; EMG 10 Hz high-pass) and automatically scored offline in 10-sec epochs as wake, non-rapid eye movement (NREM) sleep, or rapid eye movement (REM) sleep in SleepSign (Kissei Comtec, Nagano, Japan) using established criteria (Lu et al., 2000, Lu et al., 2001). After automatic scoring, sleep-wake stages were examined and manually corrected. The data collected during the first 24 hr period served as the baseline data for comparison to the experimental day (second 24 hr period). The amount of time spent in wake, NREM sleep and REM sleep was determined from the scored EEG/EMG data. EEG power spectra for wake epochs were analyzed offline using Fast Fourier Transformation (512 point, Hanning window, 0–24.5 Hz with 0.5 Hz resolution using SleepSign).
Atropine injections
Atropine sulfate (100 mg/kg, Sigma) in saline was injected by i.p. at 2:00 PM and 4:00 PM in order to maintain a 6-hour effect on the experimental day. For baseline data, rats were injected i.p. with saline vehicle (2 ml/kg) at 2:00 PM and 4 PM.
Perfusion and immunohistochemistry
After completing all experiments, rats were returned to their normal housing for another week before perfusion. For perfusion, rats were given an atropine administration, then two hours later were deeply anesthetized with 10% chloral hydrate and perfused via the heart with saline followed by neutral phosphate buffered formalin (Fischer Scientific Co.). The brains were harvested, post-fixed, and cryoprotected in 20% sucrose in PBS overnight, then sectioned in the coronal plane on a freezing microtome into 4 series of 40 um sections. Immunohistochemistry was performed in accordance with the free floating method described previously (Qiu et al., 2010). Briefly, sections were incubated with 0.3% H2O2 for 15 min to quench endogenous peroxidase activity. After washing in 0.1M PBS (pH 7.4), the sections were incubated with a rabbit polyclonal primary antibody against c-Fos (Ab5, Cat# PC38, Oncogene Research Products) at a 1:10000 dilution in PBS containing 0.25% Triton X-100 for 24 hr at room temperature. On the second day, the sections were washed in PBS and incubated in biotinylated donkey anti-rabbit secondary antiserum (Jackson ImmunoResearch Laboratories, PA, USA; 1:1000 dilution) for 1 hr, followed by a 1:1000 dilution of avidin-biotin-peroxidase (Vector Laboratories, CA, USA) for 1 hr at room temperature. The peroxidase reaction was visualized with 0.05% 3, 3-diaminobenzidine tetrahydrochloride (Sigma, MO, USA) in PBS and 0.01% H2O2 and strengthened with 0.002% Ni, 0.001% CoCl2. After staining, sections were washed, mounted, dehydrated and coverslipped. As controls, adjacent sections were incubated without the primary antibody to confirm that no non-specific staining had occurred.
Statistical analysis
The quantitative data are presented as the mean ± standard error of mean (SEM). Statistical significance was assessed with the paired t-test, with p < 0.05 taken as the threshold of significance.
Results
Two atropine injections at 2 PM and 4 PM induced a 6 hrs waking state with slow-wave EEG (2:00 PM to 8:00 PM). In agreement with a previous series of studies (Vanderwolf and Baker, 1986, Vanderwolf, 1988, 1992), rats under the influence of atropine walked, groomed, ate, and drank during this 6 hour period. These “automatic” behaviors were strikingly similar to behavior during normal wakefulness. Occasionally, rats displayed a typical sleep posture, which we defined as “NREM sleep.” EEG/EMG recordings and the corresponding hypnograms and delta power spectra of a rat in Figure 1 illustrate the distinctive dissociated state produced by atropine: high amplitude, slow-wave, sleep-like EEG with wake-like high EMG and movements (confirmed by time-locked video). Atropine-induced EEG delta power was much higher than that of the baseline period prior to the injection (Figure 1, A lower panel; B and C). Average slow-wave-activity (SWA, 0.5–4 HZ) during per hour showed that both SWA of the wake and NREM sleep by atropine were significantly increased, compared to that of the vehicle controls (Figure 1B). The total amount of SWA (slow wave energy, SWE) for the 6hrs of atropine effects was significantly increased compared to the corresponding vehicle period (Figure 1C). Compared to the waking EEG during the same period of the baseline day, atropine significantly increased slow-wave EEG components (Figure 1, A lower panel; D and E). In the atropine-induced state, the EEG power spectrum contained prominent slow-wave 1.0 Hz oscillations but suppression of other EEG frequencies (Figure 1D and E). REM sleep, as defined by the loss of muscle tone and high theta band EEG (6–10Hz), was completely suppressed by atropine. In the subsequent six hours (9:00 PM–2:00 AM) after the atropine state abated and delta power diminished, animals slept significantly more than during the same period on the baseline day (baseline: 86.5 ± 12.0 min NREM sleep; Atropine: 146.6 ± 13.6 min NREM sleep, p=0.008) (Figure 2A–C).
Figure 1.

Atropine produces wake state with sleep-like EEG. A. Typical examples of EEG/EMG recordings and corresponding hypnograms and FFT delta power following vehicle or atropine injections (n=8). Compared to baseline saline injection, atropine induced high amplitude and overall delta power but mostly in waking state with high EMG activity and motor activity (video). EEG FFT delta power of each stage by atropine was much higher than that prior to the injection and the baseline (black dots: Wake; yellow dots: NREM sleep; Red dots: REM sleep). NREM sleep under atropine is defined by sleep posture (video) and low EMG. B. Average SWA (0.5–4 Hz) changes of wake and NREM sleep after atropine administration. Each circle represents mean (per minute) ± SEM of SWA of wake and NREM sleep during each hour. C. Total amount of wake and NREM sleep SWE during 6 h after atropine administration. Open and filled bars present the baseline day (vehicle injection) and experimental day (atropine injection), respectively. *, p < 0.05; n=8. D: EEG power density of atropine-induced-wakefulness. The horizontal bars indicate statistical difference (p < 0.05) between atropine and vehicle control. Power spectrum analysis indicates atropine inducing coma-like oscillation peaking around 1.0 Hz. E: Amount of EEG power density of atropine induced wakefulness and control wakefulness in 0–2 Hz, 6–10 Hz and 12–24.5 Hz. *, p < 0.05; **, p < 0.01; n=8.
Figure 2.

Sleep rebound after atropine effect abated. A: Time course changes produced by saline and atropine injections (100 mg/kg) at 2:00 PM and 4:00 PM. Open and filled circles represent the hourly mean ± SEM of NREM, REM sleep, and wakefulness by vehicle and atropine injections respectively. B: Hourly accumulated amount of Wake, REM and NREM sleep during the dark phase. C: Total time spent in wakefulness, REM and NREM sleep during 6 hrs (from 9:00 PM to 2:00 AM). D: EEG power density of NREM sleep during the sleep rebound (from 9:00 PM to 2:00 AM) and control shows the same pattern. E: Average SWA (0.5–4 Hz) changes of wake and NREM sleep during the sleep rebound period. Each circle represents mean (per minute) ± SEM of SWA of wake and NREM sleep during each hour. F: Total amount of wake and NREM sleep SWE during the sleep rebound period. Open and filled bars present the control and atropine group respectively (n=8).
During the period of sleep rebound, there was no difference in EEG power density of NREM sleep between control and atropine treatment (P > 0.05, paired t-test) (Figure 2D). The wake SWA of atropine group was still higher than the baseline level (Figure 2E) during 9PM–0:00AM. The SWA of NREM sleep of atropine group was higher than the baseline level during the first two hours (Figure 2E). The SWE of atropine group during 9:00PM–2:00AM was higher than the baseline control, although it was lower than that of atropine induced state (Figure 2F, Figure 1C). REM sleep reappeared around midnight (00:00 AM), and in contrast to NREM sleep, the total REM sleep amount from 9:00 PM–2:00 AM was significantly lower after atropine compared to baseline (control: 17.1 ± 2.3 min; Atropine: 7.6 ± 2.1 min, p=0.024) (Figure 2A–C).
To further confirm the neuronal effects of atropine, we examined c-Fos expression two hours following atropine injection or saline injection (control) at 12:00 PM. Consistent with our previous study (Qiu et al., 2014), atropine administration resulted in low c-Fos expression throughout the cortex, similar to sleeping control animals. In contrast, atropine administration resulted in high c-Fos expression in subcortical arousal systems such as the basal forebrain cholinergic neurons, locus coeruleus (LC), and tuberomammillary nucleus (TMN), compared to sleeping control animals. Atropine administration resulted in low c-Fos expression in neurons of the sleep-active ventrolateral preoptic area (VLPO, Figure 3) and high c-Fos expression in pedunculopontine tegmental nucleus-lateral dorsal tegmental nuclues (PPT-LDT) cholinergic neurons (Figure 4). Although PPT cholinergic neurons fire fastest in wakefulness and REM sleep (Boucetta et al., 2014), c-Fos was rarely seen in PPT-LDT cholinergic neurons even in normal active-wake conditions. Finally, we found that atropine induced c-Fos expression in the ventral periaqueductal gray (vPAG) wake-active dopamine neurons (Figure 5), hypothalamic orexin neurons and the TMN (Figure 6). c-Fos expression in these sleep-wake systems indicate that atropine induced a very strong subcortical arousal.
Figure 3.
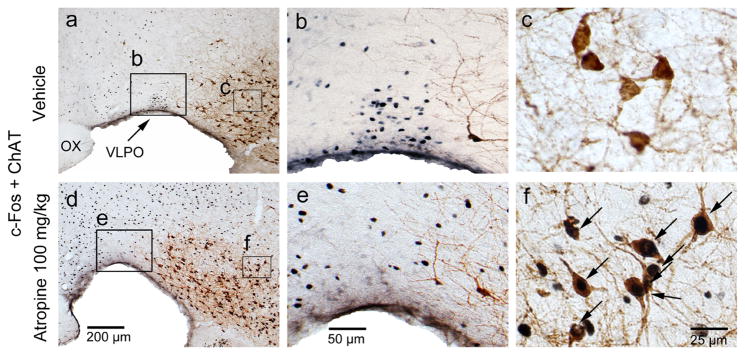
Atropine induces c-Fos expression in the basal forebrain cholinergic neurons and suppresses c-Fos expression in sleep-active VLPO neurons. Representative photomicrographs of c-Fos (black) and ChAT (brown) double immunostaining in the VLPO and basal forebrain cholinergic neurons of vehicle- (a, b and c) and 100mg/kg atropine (d, e and f) administered rats (b, c, e and f: high-magnification views of the rectangular areas marked in “a”, and “d” respectively). Arrows indicate the c-Fos and ChAT double-stained cells. Scale bars: a and d, 200 μm; b and e, 50 μm; c and f, 25μm. VLPO: ventrolateral preoptic nucleus.
Figure 4.
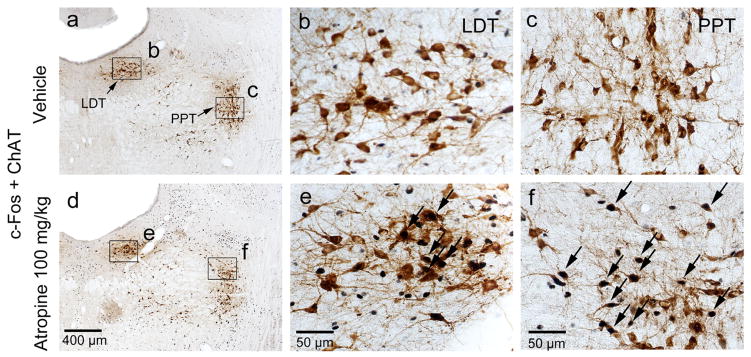
Atropine induces c-Fos expression in PPT-LDT cholinergic neurons. Representative photomicrographs of c-Fos (black) and ChAT (brown) double immunostaining in the PPT-LDT of vehicle- (a, b and c) and 100mg/kg atropine (d, e and f) administered rats (b, c, e and f: high-magnification views of the rectangular areas marked in “a”, and “d” respectively). Scale bars: a and d, 400 μm; b, c, e and f, 50 μm. Arrows indicate the c-Fos and ChAT double stained cells. ChAT: choline acetyltransferase; LDT: lateral dorsal tegmental nucleus; PPT: pedunculopontine tegmental nucleus.
Figure 5.

Atropine induces c-Fos expression in the vPAG dopaminergic neurons. Representative photomicrographs of c-Fos (black) and TH (brown) double immunostaining in the vPAG of vehicle- (a and b) and 100mg/kg atropine (c and d) administered rats (b and d: high-magnification views of the rectangular areas marked in “a”, and “c” respectively). Arrows indicate the c-Fos and TH double stained cells. Scale bars: a and c, 200 μm; b and d, 50 μm. Aq: aqueduct; TH: tyrosine hydroxylase; vPAG: ventral periaqueductal gray.
Figure 6.

Atropine induces c-Fos expression in lateral hypothalamic orexin neurons and histaminergic neurons.
a, b, c and d: representative photomicrographs of c-Fos (black) and orexin A (brown) double immunostaining in the LH of vehicle- (a and b) and 100mg/kg atropine (c and d) administered rats (b and d: high-magnification views of the rectangular areas marked in “a”, and “c” respectively). Arrows indicate the c-Fos and orexin A double-stained cells. e and f: representative photomicrographs of c-Fos (black) immunostaining in the TMN of vehicle-(e) and 100 mg/kg atropine (f) administrated rats. Scale bars: a and c, 400 μm; b and d, 50 μm. e and f, 100μm. 3V: third ventricle; f: fornix; LH: lateral hypothalamus; mt: mammillothalamic tract. TMN: tuberomammillary nucleus.
Discussion
EEG/EMG, video recording, and c-Fos expression all indicate that systemic atropine administration induces neuronal “off” states and SWA in the cortex but waking behavior and strong activity in subcortical structures. If prior sleep-like cortical activity is the primary factor for fulfilling sleep homoeostasis, we would expect a sleep reduction after the effect of atropine abated; in contrast, if subcortical activity determines sleep homeostasis, we would expect a subsequent sleep increase or rebound. Rats slept significantly more after the atropine induced state, supporting the notion that subcortical activation is sufficient, even with an inactive cortex, to drive homeostatic sleep need and sleep rebound. This suggests that subcortical neuronal activity, not cortical activity, regulates sleep homeostasis.
This conclusion, while surprising, is supported by previous observations. Rat pups can exhibit sleep homeostasis without cortical activity (Larkin and Heller, 1999, Villablanca, 2004, Todd et al., 2010). Animals have slow-wave EEG during hibernation, yet will immediately sleep once aroused from hibernation (Canguilhem and Boissin, 1996, Larkin and Heller, 1999, Arzt et al., 2005). Other drugs can induce NREM sleep but reduce delta power (Szentirmai and Krueger, 2006). Finally, rats with complete removal of the cerebral cortex and hippocampus retain circadian and subcortically-driven waking behaviors (Wanderwolf et al., 1978). Clearly slow-wave EEG is not necessarily indicative of sleep need and is not essential for sleep-wake regulation. Our results, along with previous midbrain transection and developmental studies, suggest that the forebrain substrate of sleep homeostasis is not the cortex.
The pattern of EEG produced by atropine remarkably resembles the coma-like state seen following ablation of the parabrachial nucleus or basal forebrain (Fuller et al., 2011). Similar states are also seen in deep anesthesia (Kroeger and Amzica, 2007) and hibernation/torpor (Daan et al., 1991). This ultra-slow oscillation and very low neuronal activity is likely intrinsically generated within the neurons of the cortex (Steriade et al., 1993a, Steriade et al., 1993b, c). In contrast to the suppression of cortical activity, subcortical arousal systems are very active after systemic atropine administration. This may reflect the role of acetylcholine and its cortical receptors in regulating cortical activity and desynchronization; basal forebrain cholinergic neurons are the major source of acetylcholine in the cortex and hippocampus. It is unclear exactly how atropine activates the subcortical arousal systems. One possible mechanism is through inhibition of inhibitory cholinergic M2 and M4 receptors expressed in the cholinergic neurons in the basal forebrain and pons and spinal cord and in non-cholinergic neurons in the thalamus, hypothalamus and brainstem (Vilaro et al., 1992, Sugaya et al., 1997).
Sleep rebound with high delta oscillation is also seen after a sub-anesthetic dose of ketamine in rats (Feinberg and Campbell, 1993, 1995). At those doses, ketamine also induces movements (Feinberg and Campbell, 1993, 1995, Lu et al., 2008). However, unlike atropine, ketamine at sub-anesthetic doses results in a c-Fos expression pattern in brain and EEG pattern that resembles active arousal (Lu et al., 2008, Qiu et al., 2014). Thus the sleep rebound after ketamine is not surprising. Conversely, GABAergic anesthetics inhibit both cortical and subcortical regions, reducing sleep pressure (Nelson et al., 2010, Pal et al., 2011).
Where in the forebrain is the critical sleep hemeostat? Midbrain transection studies eliminate the brainstem as the necessary site of NREM and REM sleep homeostasis, and here we eliminate the cerebral cortex as the necessary site of sleep homeostasis. The remaining candidates are the basal ganglia, basal forebrain, thalamus, and hypothalamus. As the basal ganglia and thalamus interact primarily with the cortex (Qiu et al., 2010, Qiu et al., 2014), we may eliminate these structures as possibilities. Of the remaining structures, the basal forebrain has relatively few descending projections that might control behavioral states. In fact, most of these descending projections target the only remaining forebrain candidate, the hypothalamus (Gritti et al., 1994). Thus we hypothesize that the hypothalamus contains the sleep homeostat. Within the hypothalamus, sleep-active neurons of anterior hypothalamus and wake-active neurons in the posterior lateral hypothalamus are the best candidates. In the anterior hypothalamus, the median preoptic nucleus (MnPO) and VLPO neurons increase firing in response to sleep pressure, although more evidence is needed to prove these neurons actually drive sleep homeostasis (Gvilia et al., 2006a, Gvilia et al., 2006b, Gvilia et al., 2011). In the posterior hypothalamus, we can eliminate orexin and MCH neurons of the posterior hypothalamus, as neither orexin (Mochizuki et al., 2004) nor MCH (Willie et al., 2008) knockouts affect sleep homeostasis. Given that lesions of the posterior lateral hypothalamus reduce wakefulness by about 30% (Gerashchenko et al., 2001), we hypothesize that wake-active--possibly glutamatergic--neurons in the posterior lateral hypothalamus that function as a sleep homeostat. These neurons should have extensive ascending and descending projections, will receive input from other sleep-wake regulatory systems, and will be necessary and sufficient to drive sleep homeostasis.
Our results do not contradict the role of sleep in shaping cortical plasticity in learning and memory, a phenomenon overwhelmingly supported by animal and human studies (Tononi and Cirelli, 2014). Our results also do not question the existence of local sleep in the cortex (Tononi, 2005) in response to sleep pressure, or the idea of SWA as a marker of sleep homeostatic need in normal conditions. Indeed local sleep may be present in many regions of the brain and may drive local SWA response to sleep deprivation. However, global cortical activity may serve more as an indicator of sleep homeostasis than as the sleep homeostat controlling an animal’s overall behavioral state.
Conclusion
Subcortical arousal activity and behavior are sufficient to drive sleep homeostasis in rats, while cortical activity does not regulate sleep homeostasis.
Highlights.
Atropine induces a state of high-amplitude slow-wave EEG and movements.
Atropine reduces c-Fos expression throughout the cortex but induces c-Fos expression in subcortical arousal systems
The atropine-induced state is followed by a sleep rebound
Acknowledgments
This work was supported by the National Institutes of Health (NS061841, NS062727), National Natural Science Foundation of China (31171049), Shanghai Committee of Science and Technology (11ZR1401800) and by the Scientific Research Foundation for the Returned Overseas Chinese Scholars, State Education Ministry.
Abbreviations
- EEG
electroencephalogram
- EMG
electromyogram
- LC
locus coeruleus
- LDT
laterodorsal tegmental nucleus
- NREM
non-rapid eye movement
- PPT
pedunculopontine tegmental nucleus
- REM
rapid eye movement
- SWA
slow wave activity
- SWE
slow wave energy
- TMN
tuberomammillary nucleus
- VLPO
ventrolateral preoptic area
- vPAG
ventral periaqueductal gray
Footnotes
Publisher's Disclaimer: This is a PDF file of an unedited manuscript that has been accepted for publication. As a service to our customers we are providing this early version of the manuscript. The manuscript will undergo copyediting, typesetting, and review of the resulting proof before it is published in its final citable form. Please note that during the production process errors may be discovered which could affect the content, and all legal disclaimers that apply to the journal pertain.
References
- Arzt M, Schulz M, Wensel R, Montalvan S, Blumberg FC, Riegger GA, Pfeifer M. Nocturnal continuous positive airway pressure improves ventilatory efficiency during exercise in patients with chronic heart failure. Chest. 2005;127:794–802. doi: 10.1378/chest.127.3.794. [DOI] [PubMed] [Google Scholar]
- Boucetta S, Cisse Y, Mainville L, Morales M, Jones BE. Discharge profiles across the sleep-waking cycle of identified cholinergic, GABAergic, and glutamatergic neurons in the pontomesencephalic tegmentum of the rat. The Journal of neuroscience : the official journal of the Society for Neuroscience. 2014;34:4708–4727. doi: 10.1523/JNEUROSCI.2617-13.2014. [DOI] [PMC free article] [PubMed] [Google Scholar]
- Canguilhem B, Boissin J. Is the animal in hibernal sleep awake? Neurophysiol Clin. 1996;26:1–7. doi: 10.1016/0987-7053(96)81528-0. [DOI] [PubMed] [Google Scholar]
- Daan S, Barnes BM, Strijkstra AM. Warming up for sleep? Ground squirrels sleep during arousals from hibernation. Neuroscience letters. 1991;128:265–268. doi: 10.1016/0304-3940(91)90276-y. [DOI] [PubMed] [Google Scholar]
- Davis CJ, Clinton JM, Jewett KA, Zielinski MR, Krueger JM. Delta wave power: an independent sleep phenotype or epiphenomenon? J Clin Sleep Med. 2011;7:S16–18. doi: 10.5664/JCSM.1346. [DOI] [PMC free article] [PubMed] [Google Scholar]
- de Andres I, Garzon M, Villablanca JR. The disconnected brain stem does not support rapid eye movement sleep rebound following selective deprivation. Sleep. 2003;26:419–425. doi: 10.1093/sleep/26.4.419. [DOI] [PubMed] [Google Scholar]
- Feinberg I, Campbell IG. Ketamine administration during waking increases delta EEG intensity in rat sleep. Neuropsychopharmacology : official publication of the American College of Neuropsychopharmacology. 1993;9:41–48. doi: 10.1038/npp.1993.41. [DOI] [PubMed] [Google Scholar]
- Feinberg I, Campbell IG. Stimulation of NREM delta EEG by ketamine administration during waking: demonstration of dose dependence. Neuropsychopharmacology : official publication of the American College of Neuropsychopharmacology. 1995;12:89–90. doi: 10.1038/sj.npp.1380242. [DOI] [PubMed] [Google Scholar]
- Fuller PM, Sherman D, Pedersen NP, Saper CB, Lu J. Reassessment of the structural basis of the ascending arousal system. The Journal of comparative neurology. 2011;519:933–956. doi: 10.1002/cne.22559. [DOI] [PMC free article] [PubMed] [Google Scholar]
- Gerashchenko D, Kohls MD, Greco M, Waleh NS, Salin-Pascual R, Kilduff TS, Lappi DA, Shiromani PJ. Hypocretin-2-saporin lesions of the lateral hypothalamus produce narcoleptic-like sleep behavior in the rat. The Journal of neuroscience : the official journal of the Society for Neuroscience. 2001;21:7273–7283. doi: 10.1523/JNEUROSCI.21-18-07273.2001. [DOI] [PMC free article] [PubMed] [Google Scholar]
- Gritti I, Mainville L, Jones BE. Projections of GABAergic and cholinergic basal forebrain and GABAergic preoptic-anterior hypothalamic neurons to the posterior lateral hypothalamus of the rat. The Journal of comparative neurology. 1994;339:251–268. doi: 10.1002/cne.903390206. [DOI] [PubMed] [Google Scholar]
- Gvilia I, Suntsova N, Angara B, McGinty D, Szymusiak R. Maturation of sleep homeostasis in developing rats: a role for preoptic area neurons. American journal of physiology Regulatory, integrative and comparative physiology. 2011;300:R885–894. doi: 10.1152/ajpregu.00727.2010. [DOI] [PMC free article] [PubMed] [Google Scholar]
- Gvilia I, Turner A, McGinty D, Szymusiak R. Preoptic area neurons and the homeostatic regulation of rapid eye movement sleep. The Journal of neuroscience : the official journal of the Society for Neuroscience. 2006a;26:3037–3044. doi: 10.1523/JNEUROSCI.4827-05.2006. [DOI] [PMC free article] [PubMed] [Google Scholar]
- Gvilia I, Xu F, McGinty D, Szymusiak R. Homeostatic regulation of sleep: a role for preoptic area neurons. The Journal of neuroscience : the official journal of the Society for Neuroscience. 2006b;26:9426–9433. doi: 10.1523/JNEUROSCI.2012-06.2006. [DOI] [PMC free article] [PubMed] [Google Scholar]
- Irmis F. Dissociation between EEG and spontaneous behaviour of rats after atropine. Activitas nervosa superior. 1971;13:217–218. [PubMed] [Google Scholar]
- Kroeger D, Amzica F. Hypersensitivity of the anesthesia-induced comatose brain. The Journal of neuroscience : the official journal of the Society for Neuroscience. 2007;27:10597–10607. doi: 10.1523/JNEUROSCI.3440-07.2007. [DOI] [PMC free article] [PubMed] [Google Scholar]
- Larkin JE, Heller HC. Sleep after arousal from hibernation is not homeostatically regulated. Am J Physiol. 1999;276:R522–529. doi: 10.1152/ajpregu.1999.276.2.R522. [DOI] [PubMed] [Google Scholar]
- Lu J, Greco MA, Shiromani P, Saper CB. Effect of lesions of the ventrolateral preoptic nucleus on NREM and REM sleep. The Journal of neuroscience : the official journal of the Society for Neuroscience. 2000;20:3830–3842. doi: 10.1523/JNEUROSCI.20-10-03830.2000. [DOI] [PMC free article] [PubMed] [Google Scholar]
- Lu J, Nelson LE, Franks N, Maze M, Chamberlin NL, Saper CB. Role of endogenous sleep-wake and analgesic systems in anesthesia. The Journal of comparative neurology. 2008;508:648–662. doi: 10.1002/cne.21685. [DOI] [PMC free article] [PubMed] [Google Scholar]
- Lu J, Zhang YH, Chou TC, Gaus SE, Elmquist JK, Shiromani P, Saper CB. Contrasting effects of ibotenate lesions of the paraventricular nucleus and subparaventricular zone on sleep-wake cycle and temperature regulation. The Journal of neuroscience : the official journal of the Society for Neuroscience. 2001;21:4864–4874. doi: 10.1523/JNEUROSCI.21-13-04864.2001. [DOI] [PMC free article] [PubMed] [Google Scholar]
- Mochizuki T, Crocker A, McCormack S, Yanagisawa M, Sakurai T, Scammell TE. Behavioral state instability in orexin knock-out mice. The Journal of neuroscience : the official journal of the Society for Neuroscience. 2004;24:6291–6300. doi: 10.1523/JNEUROSCI.0586-04.2004. [DOI] [PMC free article] [PubMed] [Google Scholar]
- Nelson AB, Faraguna U, Tononi G, Cirelli C. Effects of anesthesia on the response to sleep deprivation. Sleep. 2010;33:1659–1667. doi: 10.1093/sleep/33.12.1659. [DOI] [PMC free article] [PubMed] [Google Scholar]
- Pal D, Lipinski WJ, Walker AJ, Turner AM, Mashour GA. State-specific effects of sevoflurane anesthesia on sleep homeostasis: selective recovery of slow wave but not rapid eye movement sleep. Anesthesiology. 2011;114:302–310. doi: 10.1097/ALN.0b013e318204e064. [DOI] [PubMed] [Google Scholar]
- Qiu MH, Chen MC, Huang ZL, Lu J. Neuronal activity (c-Fos) delineating interactions of the cerebral cortex and basal ganglia. Frontiers in neuroanatomy. 2014;8:13. doi: 10.3389/fnana.2014.00013. [DOI] [PMC free article] [PubMed] [Google Scholar]
- Qiu MH, Vetrivelan R, Fuller PM, Lu J. Basal ganglia control of sleep-wake behavior and cortical activation. The European journal of neuroscience. 2010;31:499–507. doi: 10.1111/j.1460-9568.2009.07062.x. [DOI] [PMC free article] [PubMed] [Google Scholar]
- Sugaya K, Clamp C, Bryan D, McKinney M. mRNA for the m4 muscarinic receptor subtype is expressed in adult rat brain cholinergic neurons. Brain research Molecular brain research. 1997;50:305–313. doi: 10.1016/s0169-328x(97)00199-x. [DOI] [PubMed] [Google Scholar]
- Steriade M, Contreras D, Curro Dossi R, Nunez A. The slow (< 1 Hz) oscillation in reticular thalamic and thalamocortical neurons: scenario of sleep rhythm generation in interacting thalamic and neocortical networks. The Journal of neuroscience : the official journal of the Society for Neuroscience. 1993a;13:3284–3299. doi: 10.1523/JNEUROSCI.13-08-03284.1993. [DOI] [PMC free article] [PubMed] [Google Scholar]
- Steriade M, Nunez A, Amzica F. Intracellular analysis of relations between the slow (< 1 Hz) neocortical oscillation and other sleep rhythms of the electroencephalogram. The Journal of neuroscience : the official journal of the Society for Neuroscience. 1993b;13:3266–3283. doi: 10.1523/JNEUROSCI.13-08-03266.1993. [DOI] [PMC free article] [PubMed] [Google Scholar]
- Steriade M, Nunez A, Amzica F. A novel slow (< 1 Hz) oscillation of neocortical neurons in vivo: depolarizing and hyperpolarizing components. The Journal of neuroscience : the official journal of the Society for Neuroscience. 1993c;13:3252–3265. doi: 10.1523/JNEUROSCI.13-08-03252.1993. [DOI] [PMC free article] [PubMed] [Google Scholar]
- Szentirmai E, Krueger JM. Obestatin alters sleep in rats. Neuroscience letters. 2006;404:222–226. doi: 10.1016/j.neulet.2006.05.053. [DOI] [PubMed] [Google Scholar]
- Todd WD, Gibson JL, Shaw CS, Blumberg MS. Brainstem and hypothalamic regulation of sleep pressure and rebound in newborn rats. Behavioral neuroscience. 2010;124:69–78. doi: 10.1037/a0018100. [DOI] [PMC free article] [PubMed] [Google Scholar]
- Tononi G. The neuro-biomolecular basis of alertness in sleep disorders. Sleep Med. 2005;6(Suppl 1):S8–12. doi: 10.1016/s1389-9457(05)80003-6. [DOI] [PubMed] [Google Scholar]
- Tononi G, Cirelli C. Sleep and the price of plasticity: from synaptic and cellular homeostasis to memory consolidation and integration. Neuron. 2014;81:12–34. doi: 10.1016/j.neuron.2013.12.025. [DOI] [PMC free article] [PubMed] [Google Scholar]
- Vanderwolf CH. Cerebral activity and behavior: control by central cholinergic and serotonergic systems. International review of neurobiology. 1988;30:225–340. doi: 10.1016/s0074-7742(08)60050-1. [DOI] [PubMed] [Google Scholar]
- Vanderwolf CH. Behavior-related cortical activity and swim-to-platform performance in the aged rat. Behavioural brain research. 1992;52:153–158. doi: 10.1016/s0166-4328(05)80225-6. [DOI] [PubMed] [Google Scholar]
- Vanderwolf CH, Baker GB. Evidence that serotonin mediates non-cholinergic neocortical low voltage fast activity, non-cholinergic hippocampal rhythmical slow activity and contributes to intelligent behavior. Brain research. 1986;374:342–356. doi: 10.1016/0006-8993(86)90428-2. [DOI] [PubMed] [Google Scholar]
- Vilaro MT, Wiederhold KH, Palacios JM, Mengod G. Muscarinic M2 receptor mRNA expression and receptor binding in cholinergic and non-cholinergic cells in the rat brain: a correlative study using in situ hybridization histochemistry and receptor autoradiography. Neuroscience. 1992;47:367–393. doi: 10.1016/0306-4522(92)90253-x. [DOI] [PubMed] [Google Scholar]
- Villablanca JR. Counterpointing the functional role of the forebrain and of the brainstem in the control of the sleep-waking system. J Sleep Res. 2004;13:179–208. doi: 10.1111/j.1365-2869.2004.00412.x. [DOI] [PubMed] [Google Scholar]
- Vyazovskiy VV, Olcese U, Hanlon EC, Nir Y, Cirelli C, Tononi G. Local sleep in awake rats. Nature. 2011;472:443–447. doi: 10.1038/nature10009. [DOI] [PMC free article] [PubMed] [Google Scholar]
- Willie JT, Sinton CM, Maratos-Flier E, Yanagisawa M. Abnormal response of melanin-concentrating hormone deficient mice to fasting: hyperactivity and rapid eye movement sleep suppression. Neuroscience. 2008;156:819–829. doi: 10.1016/j.neuroscience.2008.08.048. [DOI] [PMC free article] [PubMed] [Google Scholar]