Summary
Tuberculosis (TB) is a communicable disease of major global importance and causes metabolic disorder of the patients. In a previous study, we found that the plasma metabolite profile of TB patients differs from that of healthy control subjects based on nuclear magnetic resonance (NMR) spectroscopy. In order to evaluate the TB specificity of the metabolite profile, a total of 110 patients, including 40 with diabetes, 40 with malignancy, and 30 with community-acquired pneumonia (CAP), assessed by NMR spectroscopy, and compared to those of patients with TB. Based on the orthogonal partial least-squares discriminant analysis (OPLS-DA), the metabolic profiles of these diseases were significant different, as compared to the healthy controls and TB patients, respectively. The score plots of the OPLS-DA model demonstrated that TB was easily distinguishable from diabetes, CAP and malignancy. Plasma levels of ketone bodies, lactate, and pyruvate were increased in TB patient compared to healthy control, but lower than CAP and malignancy. We conclude that the metabolic profiles were TB-specific and reflected MTB infection. Our results strongly support the NMR spectroscopy-based metabolomics could contribute to an improved understanding of disease mechanisms and may offer clues to new TB clinic diagnosis and therapies.
Keywords: tuberculosis, metabolite, plasma, diabetes, malignancy, community-acquired pneumonia
Introduction
Tuberculosis (TB) remains a major global health problem. In 2012, an estimated 8.6 million people developed TB and 1.3 million died from the disease. Mycobacterium tuberculosis (MTB) predominantly affects the lungs, but can also affect other parts of the body, including the pleura, lymphatic system, central nervous system, eye, genitourinary system, gastrointestinal tract, bones, and skin.
The metabolome is the ultimate downstream result of genome transcription, and may be described as a compilation of all the low-molecular weight compounds present in a specific cell or organism, participating in metabolic reactions during normal cell function, growth and maintenance. The last several decades have witnessed the accelerated development of robust, high throughput analytical techniques, such as 1H nuclear magnetic resonance (NMR) spectroscopy and mass spectroscopy (MS), which allow the simultaneous measurement of large numbers of metabolites from a single biological sample.
Using NMR spectroscopy, we previously found an altered metabolite profile in the plasma of TB patients, indicating that MTB infection has a profound impact on the host metabolome [1]. In order to evaluate the TB specificity of this metabolite profile, plasma samples were prospectively obtained from a total of 110 patients, including 40 with diabetes, 40 with malignancy, and 30 with community-acquired pneumonia, assessed by NMR spectroscopy, and compared to those of patients with TB.
Materials and Methods
Participants
In this study, a total 110 patients were enrolled, including 40 patients with diabetes mellitus (Type 2), 40 patients with malignancy, and 30 patients with CAP. All participants were recruited from Shanghai Renji Hospital, Shanghai Ruijin Hospital between May 2012 and August 2013, and the diagnosis was established by the treating physicians at each participating hospital. The diagnosis of type 2 diabetes was established by fasting plasma glucose. Among 40 patients with malignancy, 10 had lung cancer, 9 colon cancer, 9 colorectal cancer, 5 esophageal cancer, 4 stomach cancer, 2 pancreatic cancer, and 1 spleen cancer. The plasma samples were obtained from malignancy patients prior to initiation of treatment. CAP was diagnosed based on history and chest X-ray. Active tuberculosis was diagnosed based on a positive mycobacterial culture in the context of relevant clinical symptoms (chronic cough and/or fevers, chills, and night sweats). Detailed information regarding all test subjects is presented in Table 1 and Table S1. None of the non-TB patients was found to have latent TB infection, as determined by negative tuberculin skin test (TST) and interferon-gamma release assay (IGRA). All study participants gave informed consent for the investigation, which was approved by the Ethical Committee of the Shanghai Jiao Tong University School of Medicine.
| Community-acquired pneumonia | Diabetes mellitus (Type 2) | Malignancy | |
|---|---|---|---|
| Total individuals (n) | 30 | 40 | 40 |
| Age (years)* | 75.33±18.38 | 63.35±9.07 | 64.35±12.83 |
| Age range (years) | 32-99 | 43-81 | 28-82 |
| Gender (F/M) | 11/19 | 14/26 | 18/22 |
Data are presented as mean ± SD.
NMR acquisition and Metabolomics Data Analysis
The method of plasma samples preparation and metabolomics data analysis were described previously [1]. Plasma resonance assignments were performed according to references from existing literature and public and in-house NMR databases [1-3]. After the overview of the NMR data using Principle Component Analysis (PCA), the data were subjected to a supervised multivariate approach, named orthogonal partial least-squares discriminant analysis (OPLS-DA), which was used to build a model to identify marker metabolites accounting for the differentiation of all groups [4]. A 20-fold cross-validation was employed to obtain Q2 and R2 values, which represent the predictive ability of the model and the explained variance, respectively [5]. To rule out the non-randomness of separation between groups, 300 iterations were performed [6]. The sensitivity, specificity, and classification rate (percentage of samples classified correctly) of OPLS-DA models were then depicted [7]. The coefficient loading plots of the OPLS-DA model were used to identify the spectral variables responsible for sample differentiation on the scores plot [8]. Based on the number of samples used to construct the OPLS-DA models, a correlation coefficient of |r| >0.325 was adopted as a cut -off value for statistical significance based on a discrimination significance at the level of p=0.05.
Results
Metabolomics analysis of plasma samples
The 1H Carr-Purcell-Meiboom-Gill (CPMG) superimposed spectra of plasma samples from subjects with type 2 diabetes, malignancy, and CAP are shown in Fig. 1. The spectrum resonances assigned to the key metabolites are noted. A total of 34 different metabolites were identified according to extant literature, based on their chemical shifts and signal multiplicity. The main differences in peaks between the two groups are concentrated in the areas of 0.5-5.6 ppm and 5.6-9.5 ppm (Fig. 1).
Fig. 1. Representation of 600 MHz 1H NMR CPMG spectrum (δ0.5-5.6 and δ5.6-9.5) of plasma obtained from subjects with malignancy (M), community-acquired pneumonia (P), diabetes mellitus (D), TB (A), and healthy controls (C).
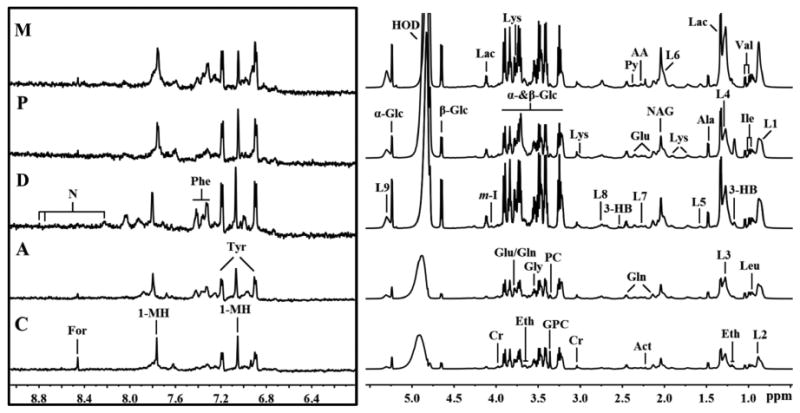
The region of δ5.6-9.5 (in the box) was magnified 16 times compared with the corresponding region of δ0.5-5.6 for the purpose of clarity. Keys: 1-MH: 1-Methylhistidene; AA: Acetoacetate; Ace: Acetate; Act: Acetone; Ala: Alanine; Cr: Creatine; Eth: Ethanol; For: Formate; Gln: Glutamine; Glu: Glutamate; Gly: Glycine; GPC: Glycerolphosphocholine; Ileu: Isoleucine; L1: LDL, CH3- (CH2)n-; L2: VLDL, CH3- (CH2)n-; L3: LDL, CH3- (CH2)n-; L4: VLDL, CH3- (CH2)n-; L5: VLDL, -CH2-CH2-C=O; L6: Lipid, -CH2-CH=CH-; L7: Lipid, -CH2-C=O; L8: Lipid, =CH-CH2-CH=; L9: Lipid, -CH=CH-; Lac: Lactate; Leu: Leucine; Lys: Lysine; MA: Methylamine; NAG: N-acetyl glycoprotein signals; PC: Phosphocholine: Phe: Phenylalanine; Py: Pyruvate; Tyr: Tyrosine; Val: Valine; α-Glc: α-Glucose; β-Glc:β-Glucose.
OPLS-DA analyses were carried out to explore the metabolic differences between non-TB disease subjects and healthy controls, and non-TB disease subjects and TB patients, respectively. The score plots of the OPLS-DA models showed that subjects with diabetes, malignancy, and CAP were distinguishable from healthy controls and the plasma metabolite profile in these patients was different from that of TB patients (Fig. 2). Furthermore, a 300 Y-permutation test was employed to validate these OPLS-DA models. The goodness-of-fit (R2 and Q2) of the models were visualized in validation plots (Fig. 3), which clearly demonstrated that the models were efficient, as the Q2 and R2 values on the left were lower than the original Q2 and R2 Y points on the right. The OPLS-DA coefficients and key metabolites derived from the NMR data obtained from different pair-wise groups are presented in Table 1.
Fig. 2. OPLS-DA scores plots derived from 1H NMR spectra of plasma and corresponding coefficient loading plots obtained from subjects with malignancy (M), community-acquired pneumonia (P), diabetes mellitus (D), TB (A), and healthy controls (C).
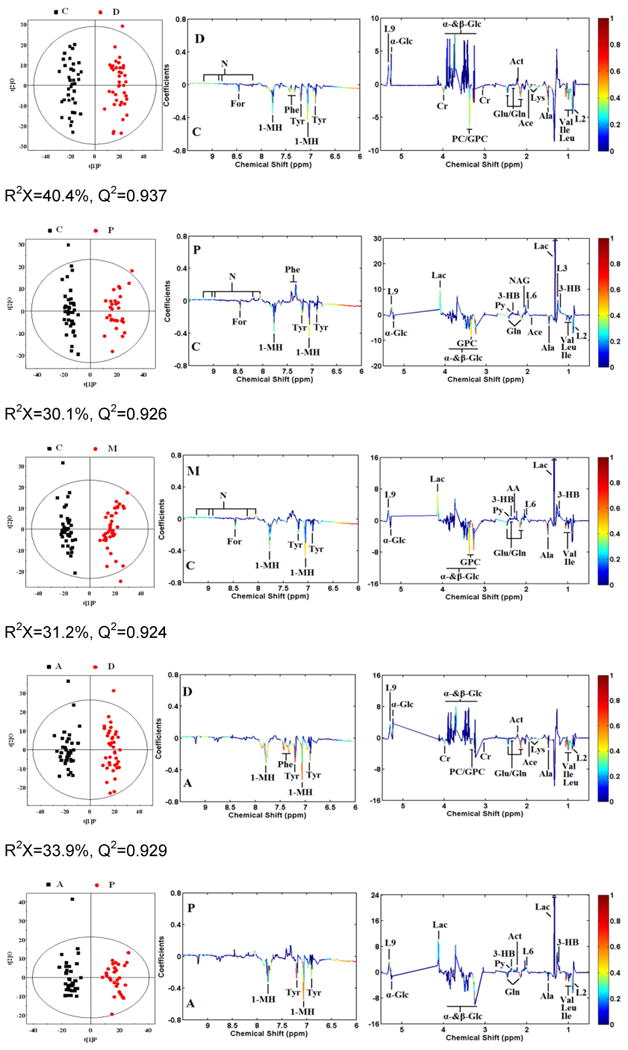
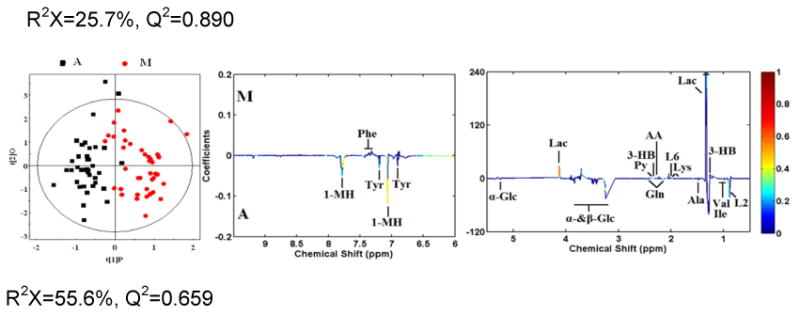
OPLS-DA scores plots (left panel) derived from 1H NMR spectra of plasma and corresponding coefficient loading plots (right panel) obtained from pair-wise comparisons. The color map shows the significance of variations in metabolite concentrations between the two classes. Peaks in the positive direction indicate metabolites that are more abundant in the groups in the positive direction of first principal component. Consequently, metabolites that are more abundant in the groups in the negative direction of first primary component are presented as peaks in the negative direction. Keys of the assignments are shown in Fig. 1.
Fig. 3. Plots of permutation tests (n=300) of PLS-DA for plasma profiles of control (black box ▪) and disease (red dot ●) groups.
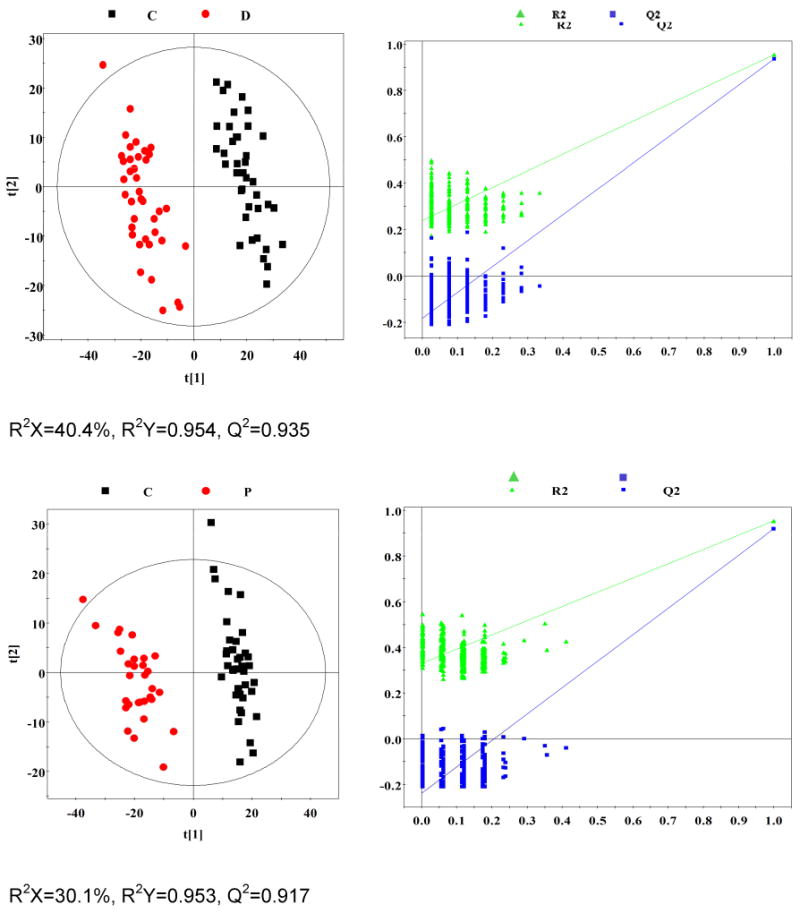
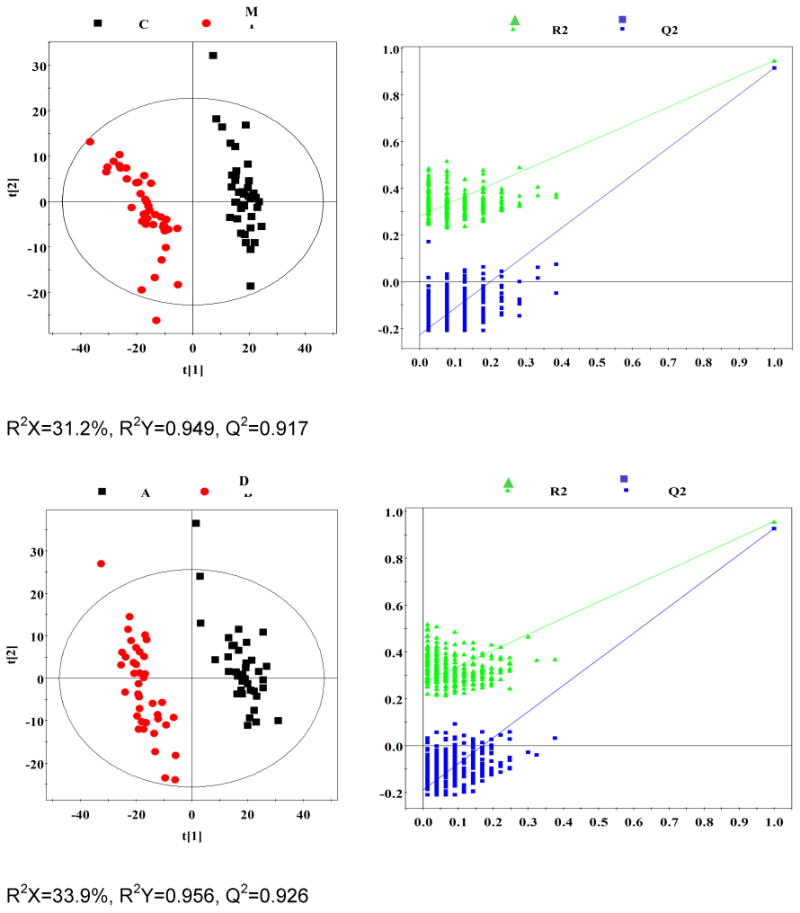
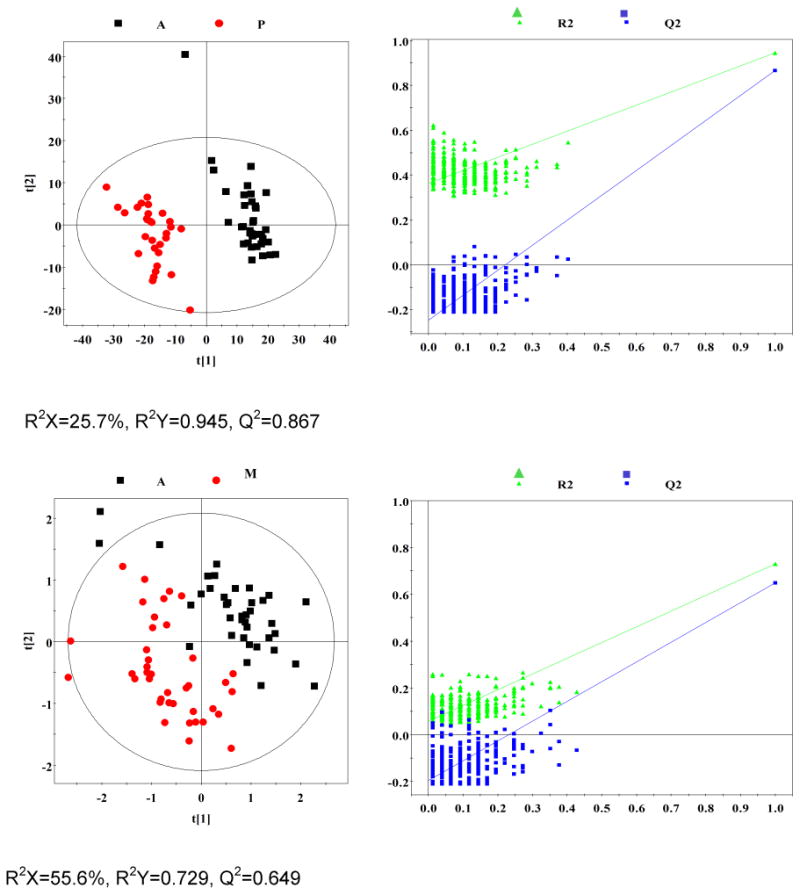
Permutation test showing the original R2 and Q2 values (top right) as significantly higher than corresponding permuted values (bottom left), demonstrating the robustness of the OPLS-DA model. Clear metabolic differences are observed between the two groups.
Multivariate statistics
Analysis of the OPLS-DA loading coefficient plots resulted in identification of differential metabolites with a correlation coefficient of |r| > 0.325. The OPLS-DA coefficients and key metabolites derived from the NMR data obtained from different pair-wise groups are presented in Table 2. Compared to healthy controls, 30 metabolites differed significantly in concentration in patients with diabetes (8 increased and 22 reduced); 26 in patients with CAP (12 increased and 14 reduced); and 28 in patients with malignancy (12 increased and 16 reduced). Compared with active TB patients, 26 metabolites differed significantly in concentration in patients with diabetes (8 increased and 18 reduced); 27 in patients with CAP (14 increased and 13 reduced); and 24 in patients with malignancy (14 increased and 10 reduced). Metabolites found not to be significantly altered between different pair-wise comparison groups are also included in Table 2.
from different pair-wise comparisons.
| Metabolites | ra | |||||
|---|---|---|---|---|---|---|
|
| ||||||
| C-D | C-P | C-M | A-D | A-P | A-M | |
| 1-Methylhistidine | -0.819 | -0.810 | -0.842 | -0.865 | -0.838 | -0.784 |
| 3-Hydroxybutyrate | 0.421 | 0.603 | 0.531 | -0.562 | 0.555 | 0.623 |
| Acetate | -0.775 | -0.525 | -0.451 | -0.777 | -0.385 | - |
| Acetoacetate | -0.472 | 0.373 | 0.508 | -0.431 | 0.397 | 0.525 |
| Acetone | 0.507 | 0.433 | 0.498 | 0.528 | 0.520 | 0.426 |
| Alanine | -0.826 | -0.748 | -0.834 | -0.775 | -0.569 | -0.717 |
| Creatine | -0.665 | - | -0.468 | -0.638 | 0.391 | 0.386 |
| Formate | -0.630 | -0.690 | -0.733 | 0.486 | 0.473 | 0.418 |
| Glutamate | -0.577 | -0.498 | -0.546 | -0.565 | 0.642 | 0.682 |
| Glutamine | -0.843 | -0.733 | -0.819 | -0.883 | -0.796 | -0.736 |
| Glycine | -0.446 | - | -0.353 | 0.429 | 0.364 | 0.447 |
| Glycerolphosphocholine | -0.744 | -0.740 | -0.766 | -0.677 | -0.479 | -0.466 |
| Isoleucine | -0.881 | -0.822 | -0.819 | -0.897 | -0.841 | -0.723 |
| L1: LDL, CH3-(CH2)n- | 0.366 | 0.402 | - | 0.470 | - | - |
| L2: VLDL, CH3-(CH2)n- | -0.634 | -0.604 | -0.412 | -0.559 | -0.624 | -0.633 |
| L3: LDL, CH3-(CH2)n- | - | 0.592 | 0.427 | 0.326 | 0.490 | - |
| L4: VLDL, CH3-(CH2)n- | -0.563 | -0.498 | - | -0.498 | -0.486 | -0.378 |
| L5: VLDL, -CH2-CH2-C=O | - | - | - | 0.415 | 0.331 | - |
| L6: Lipid, -CH2-CH=CH- | 0.358 | 0.695 | 0.673 | 0.328 | 0.650 | 0.613 |
| L7: Lipid, -CH2-C=O | - | - | 0.451 | - | - | 0.373 |
| L8: Lipid, =CH-CH2-CH= | -0.333 | - | - | 0.474 | 0.550 | -0.339 |
| L9: Lipid, -CH=CH- | 0.675 | 0.756 | 0.659 | 0.671 | 0.709 | 0.479 |
| Lactate | -0.580 | 0.671 | 0.757 | -0.454 | 0.624 | 0.895 |
| Leucine | -0.732 | -0.565 | -0.358 | -0.726 | -0.511 | - |
| Lysine | -0.782 | -0.486 | - | -0.824 | -0.446 | 0.571 |
| NAG | - | 0.618 | 0.438 | - | 0.412 | 0.399 |
| Nicotinate | 0.711 | 0.658 | 0.702 | -0.478 | -0.476 | - |
| PC | -0.551 | - | - | -0.563 | - | - |
| Phenylalanine | -0.826 | 0.581 | 0.581 | -0.839 | 0.434 | 0.581 |
| Pyruvate | -0.366 | 0.541 | 0.582 | -0.479 | 0.553 | 0.662 |
| Tyrosine | -0.815 | -0.730 | -0.710 | -0.843 | -0.793 | -0.615 |
| Valine | -0.839 | -0.828 | -0.835 | -0.849 | -0.821 | -0.744 |
| α-Glucose | 0.769 | -0.645 | -0.670 | 0.753 | -0.646 | -0.534 |
| β-Glucose | 0.592 | -0.843 | -0.865 | 0.546 | -0.745 | -0.689 |
Correlation coefficients, positive and negative signs indicate positive and negative correlation in the concentrations, respectively. The correlation coefficient of |r| > 0.325 was used as the cutoff value for statistical significance based on the discrimination significance at the level of p=0.05 and df (degree of freedom) = 37 or 29. “-” signifies that the correlation coefficient |r| is less than the cutoff value.
C-D represents comparison of healthy control and diabetes mellitus; C-P represents comparison of healthy control and CAP; C-M represents comparison of healthy control and malignancy; A-D represents comparison of TB and diabetes mellitus; A-P represents comparison of TB and CAP; A-M represents comparison of TB and malignancy.
Using NMR spectroscopy, we previously found evidence of significant dysregulation of metabolic pathways during pulmonary TB [1]. However, it was not possible to conclude whether these differences in metabolic profiles were TB-specific or merely reflected lung inflammation or the general wasting nature of the disease.
1H NMR spectroscopy is a stable and reproducible approach, which has been demonstrated in many studies. In the current study, we recruited subjects of representative metabolism-related diseases (diabetes mellitus), wasting diseases (malignancy), and lung inflammatory diseases (CAP) to characterize the specificity of our previous TB metabolic profile. A total of 110 plasma samples obtained from patients with diabetes (n=40), malignancy (n=40), and CAP (n=30) were investigated. Based on multivariate pattern recognition (PR) analysis, the metabolic profiles of these diseases were significantly different, as compared to healthy controls and TB patients (Table 2). The score plots of the OPLS-DA model demonstrated that TB, a chronic wasting inflammatory disease, was easily distinguishable from diabetes (R2X=33.9%, R2Y=0.956, Q2=0.926), and CAP (R2X=25.7%, R2Y=0.945, Q2=0.867), and was distinguishable from malignancy, with mild overlap (R2X=55.6%, R2Y=0.729, Q2=0.649). These data strongly support the specificity of the plasma metabolic biomarkers were TB-specific and reflected MTB infection.
Plasma metabolic profiling of malignancy patients
Plasma samples obtained from 40 patients with different malignancies were studied, and these metabolite profiles were compared to those of patients with TB. The OPLS-DA model can segregated TB from malignancy (R2X=55.6%, Q2=0.65). Although cancer has historically been viewed as a disorder of cellular proliferation, recent evidence has suggested that it should be characterized as a metabolic disease. Metabolomics approaches have been used extensively to study malignancies [9-12]. In normal tissues, most pyruvate enters the tricarboxylic acid (TCA) cycle and is oxidized in the mitochondria via oxidative phosphorylation. However, in malignant tissues, pyruvate is largely converted to lactate and energy is produced anaerobically through the Warburg effect, even when there is sufficient oxygen to support mitochondrial function. The metabolic profile observed in cancer cells often includes increased consumption of glucose and glutamine, increased glycolysis, and increased secretion of lactate. Most of the previous literature focuses on the metabolic profiles of cancer cells or tissues. In the present study, plasma samples were used to study the global metabolomic profile of patients with malignancy. Consistent with previous studies, we observed increased levels of lactate, pyruvate, lipid and ketone bodies (3-hydroxybutyrate, acetoacetate and acetone), and decreased levels of glucose, glutamate, glutamine, branched-chain amino acids (leucine, isoleucine, and valine), glycerophosphocholine, and very low-density lipoprotein. These results suggest that the plasma metabolic profile may to some extent reflect the metabolism of tumor cells or tissues.
We observed some overlap between the plasma profiles of patients with malignancy and those with TB in that the levels of lactate, pyruvate, and ketone bodies were elevated relative to healthy controls, although the mechanism may be very different. In TB, anaerobic glycolysis is increased and more pyruvate is converted into lactate rather than entering into the TCA cycle pathway, likely as a result of lung injury, tissue hypoxia, and insufficient oxygen supply. Glycolysis is advantageous because it provides ATP more rapidly than oxidative phosphorylation [13]. It was reported that activated T cells use glycolysis and rely on the efficient secretion of lactic acid, as its intracellular accumulation disturbs their metabolism, and the shift to glycolysis in lymphocytes supports cytokine secretion [14]. When activated T cells are provided with co-stimulatory molecules and growth factors but are blocked from engaging glycolysis, their ability to produce IFN-γ is markedly compromised. It is now well established that active T cells are required for immunity to MTB and tumor cells [15]. Since TB and cancer are immunosuppressive conditions, strengthening the function of activated T cells could be helpful for TB and cancer therapy. Dichloroacetate, a pyruvate mimetic that inhibits pyruvate dehydrogenase kinase, has been shown to increase pyruvate dehydrogenase activity and the oxidation of glucose, reduce the proliferation of breast cancer cell lines, inhibit proliferation, and slow xenograft tumor growth [16]. Due to the metabolite profile of TB, approaches to reducing glycolytic flux and high-carbohydrate diets are being considered as potential TB therapies.
Plasma metabolic profiling of patients with CAP
CAP refers to an infection of the lower respiratory tract, which can be caused by any of a number of different pathogens including bacteria, viruses, fungi, and parasites. Infectious diseases usually alter host metabolism, by altering carbohydrate and energy consumption and utilization [17-19]. Furthermore, the same infectious diseases caused by different pathogens induce different patterns of metabolite changes [20]. A previous study found that patterns of cerebrospinal fluid (CSF) metabolites were altered following bacterial and viral meningitis, and gram-stain negative samples of meningococcal meningitis were clearly differentiated from all other cases of bacterial meningitis by the application of NMR spectroscopy -based metabolic profiling [20].
Lung infection by different microorganisms induces unique metabolite patterns in the urine of mice and humans [21, 22], suggesting that systemic metabolism shifts can aid in the diagnosis of lung pathogens. In the present study, 30 subjects with CAP caused by non-MTB microbes were recruited to compare their plasma metabolite with that of TB patients based on 1H NMR spectroscopy and multivariate pattern recognition (PR) analytical techniques. Compared with healthy controls, we observed increased plasma concentrations of ketone bodies and lactate and reduced levels of 1-methylhistidine in patients with CAP. This result is consistent with a previous metabolomics study examining the urine of patients with pneumonia. Increased concentrations of pyruvate and ketone bodies in the plasma of patients with CAP are consistent with increased energy consumption and lipid degradation in this patient population. Given the low plasma concentrations of glucose and high concentrations of lactate observed, we surmise that anaerobic glycolysis is increased in CAP due to lung inflammation and low ventilatory capacity. Increased plasma levels of nicotinate and decreased levels of 1-methylhistidine in patients with CAP suggest impairment of the nicotinamide metabolism pathway, indicating alterations in mitochondrial function in these patients. Compared to patients with TB, plasma levels of lipids, ketone bodies, lactate, and pyruvate were increased and those of 1-methylhistidine, branched-chain amino acids, glucose, nicotinate, and glycerophosphocholine were decreased in the CAP group. Based on the 1H NMR spectroscopy and multivariate PR analytical techniques, we found that patients with CAP produced a distinct plasma metabolite pattern compared with healthy controls, and furthermore, a good separation between TB and CAP was observed in OPLS-DA plots (R2X=25.7%, Q2=0.890).
Plasma metabolic profiling of patients with diabetes
Diabetes represents a group of metabolic diseases characterized by elevated plasma glucose, either due to insulin deficiency or resistance [23, 24]. In this study, we evaluated the plasma metabolite profile of 40 patients with type 2 diabetes patients. Compared to healthy controls, 23 of 34 metabolites detected were present at significantly different concentrations (p<0.001, |r| > 0. 5), including 5 increased and 18 decreased in subjects with diabetes relative to healthy controls. Our results are partially consistent with a previous study by Suhre et al [25], who used three different techniques (NMR, LC-MS, and GC-MS) to study the metabolic footprint of diabetes. As compared with the TB group, a total of 20 metabolites were significantly (p<0.001, |r| > 0.5) changed in the diabetes group, including 4 present at higher concentrations and 16 present at lower concentrations. In this study, we observed evidence of lipid degradation and gluconeogenesis in the diabetes group likely due to insufficient insulin function.
In conclusion, our results indicate these unbiased metabolomic profiles are able to distinguish TB from diabetes, malignancy, and CAP. The metabolic profile of plasma from TB patients was TB-specific and reflected MTB infection. Overall, lactate, lipids, and glucose were the primary metabolites responsible for group separation (Fig. 4). Our results strongly support the NMR-based metabolomics could contribute to an improved understanding of disease mechanisms and may offer clues to new TB clinic therapies.
Fig. 4. Summary of the significant dysregulation of metabolic pathways in TB patients.
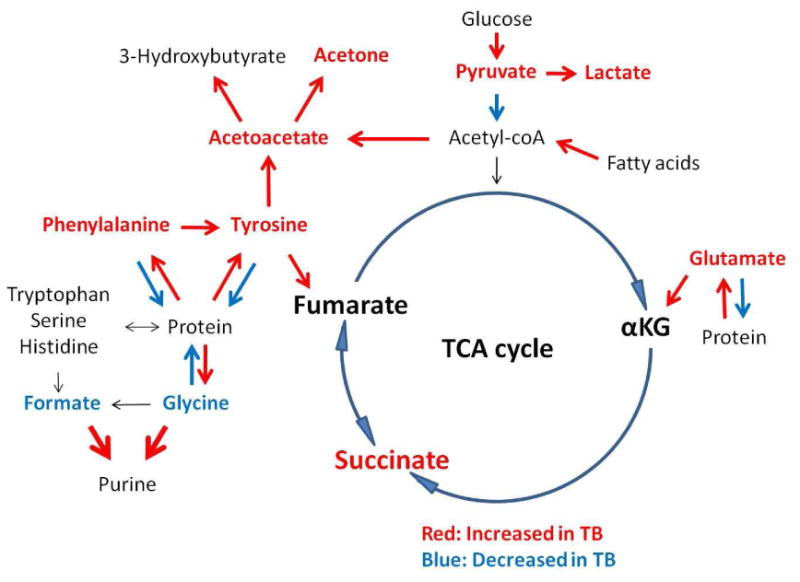
TB disease was associated with amino acid and lipid catabolism and enhanced glycolysis.
Supplementary Material
Table S1 The information of the patients
Acknowledgments
Funding
This work was supported by grants from the National Natural Science Foundation of China (No. 81361120383, No.31200109, No.81201340, No.31070114), Shanghai Rising-Star Program, Science and Technology Commission of Shanghai Municipality (No.12QH1401300), the Program for Professor of Special Appointment (Eastern Scholar) at Shanghai Institutions of Higher Learning, and AI106613 and HL106786 (NIH).
Footnotes
Transparency Declarations: The authors declare no conflicts of interest.
Publisher's Disclaimer: This is a PDF file of an unedited manuscript that has been accepted for publication. As a service to our customers we are providing this early version of the manuscript. The manuscript will undergo copyediting, typesetting, and review of the resulting proof before it is published in its final citable form. Please note that during the production process errors may be discovered which could affect the content, and all legal disclaimers that apply to the journal pertain.
Contributor Information
Aiping Zhou, Email: abby_aiping@126.com.
Jinjing Ni, Email: nijinjing45@163.com.
Zhihong Xu, Email: xvzhihong@126.com.
Ying Wang, Email: ywang@sibs.ac.cn.
Haomin Zhang, Email: zhanghaomin1976@163.com.
Wenjuan Wu, Email: wwj1210@126.com.
Shuihua Lu, Email: tubercle@shaphc.org.
Petros C. Karakousis, Email: petros@jhmi.edu.
References
- 1.Zhou A, et al. Application of (1)H NMR spectroscopy-based metabolomics to sera of tuberculosis patients. J Proteome Res. 2013;12(10):4642–9. doi: 10.1021/pr4007359. [DOI] [PMC free article] [PubMed] [Google Scholar]
- 2.Beckwith-Hall BM, et al. Nuclear magnetic resonance spectroscopic and principal components analysis investigations into biochemical effects of three model hepatotoxins. Chem Res Toxicol. 1998;11(4):260–72. doi: 10.1021/tx9700679. [DOI] [PubMed] [Google Scholar]
- 3.Shin JH, et al. (1)H NMR-based metabolomic profiling in mice infected with Mycobacterium tuberculosis. J Proteome Res. 2011;10(5):2238–47. doi: 10.1021/pr101054m. [DOI] [PubMed] [Google Scholar]
- 4.Trygg J, Holmes E, Lundstedt T. Chemometrics in metabonomics. J Proteome Res. 2007;6(2):469–79. doi: 10.1021/pr060594q. [DOI] [PubMed] [Google Scholar]
- 5.Mahadevan S, et al. Analysis of metabolomic data using support vector machines. Anal Chem. 2008;80(19):7562–70. doi: 10.1021/ac800954c. [DOI] [PubMed] [Google Scholar]
- 6.Jung Y, et al. Discrimination of the geographical origin of beef by (1)H NMR-based metabolomics. J Agric Food Chem. 2010;58(19):10458–66. doi: 10.1021/jf102194t. [DOI] [PubMed] [Google Scholar]
- 7.Ni Y, et al. Metabolic profiling reveals disorder of amino acid metabolism in four brain regions from a rat model of chronic unpredictable mild stress. FEBS Lett. 2008;582(17):2627–36. doi: 10.1016/j.febslet.2008.06.040. [DOI] [PubMed] [Google Scholar]
- 8.Cloarec O, et al. Evaluation of the orthogonal projection on latent structure model limitations caused by chemical shift variability and improved visualization of biomarker changes in 1H NMR spectroscopic metabonomic studies. Anal Chem. 2005;77(2):517–26. doi: 10.1021/ac048803i. [DOI] [PubMed] [Google Scholar]
- 9.Son J, et al. Glutamine supports pancreatic cancer growth through a KRAS-regulated metabolic pathway. Nature. 2013;496(7443):101–5. doi: 10.1038/nature12040. [DOI] [PMC free article] [PubMed] [Google Scholar]
- 10.Wang H, et al. 1H NMR-based metabolic profiling of human rectal cancer tissue. Mol Cancer. 2013;12(1):121. doi: 10.1186/1476-4598-12-121. [DOI] [PMC free article] [PubMed] [Google Scholar]
- 11.Tan C, Chen H, Xia C. Early prediction of lung cancer based on the combination of trace element analysis in urine and an Adaboost algorithm. J Pharm Biomed Anal. 2009;49(3):746–52. doi: 10.1016/j.jpba.2008.12.010. [DOI] [PubMed] [Google Scholar]
- 12.Gao H, et al. Application of 1H NMR-based metabonomics in the study of metabolic profiling of human hepatocellular carcinoma and liver cirrhosis. Cancer Sci. 2009;100(4):782–5. doi: 10.1111/j.1349-7006.2009.01086.x. [DOI] [PMC free article] [PubMed] [Google Scholar]
- 13.Guppy M, et al. Contribution by different fuels and metabolic pathways to the total ATP turnover of proliferating MCF-7 breast cancer cells. Biochem J. 2002;364(Pt 1):309–15. doi: 10.1042/bj3640309. [DOI] [PMC free article] [PubMed] [Google Scholar]
- 14.Chang CH, et al. Posttranscriptional control of T cell effector function by aerobic glycolysis. Cell. 2013;153(6):1239–51. doi: 10.1016/j.cell.2013.05.016. [DOI] [PMC free article] [PubMed] [Google Scholar]
- 15.Lande R, et al. IFN-alpha beta released by Mycobacterium tuberculosis-infected human dendritic cells induces the expression of CXCL10: selective recruitment of NK and activated T cells. J Immunol. 2003;170(3):1174–82. doi: 10.4049/jimmunol.170.3.1174. [DOI] [PubMed] [Google Scholar]
- 16.Sun RC, et al. Reversal of the glycolytic phenotype by dichloroacetate inhibits metastatic breast cancer cell growth in vitro and in vivo. Breast Cancer Res Treat. 2010;120(1):253–60. doi: 10.1007/s10549-009-0435-9. [DOI] [PubMed] [Google Scholar]
- 17.Long CL. Energy balance and carbohydrate metabolism in infection and sepsis. Am J Clin Nutr. 1977;30(8):1301–10. doi: 10.1093/ajcn/30.8.1301. [DOI] [PubMed] [Google Scholar]
- 18.Rose H, et al. The effect of HIV infection on atherosclerosis and lipoprotein metabolism: a one year prospective study. Atherosclerosis. 2013;229(1):206–11. doi: 10.1016/j.atherosclerosis.2013.04.010. [DOI] [PMC free article] [PubMed] [Google Scholar]
- 19.Kroeker AL, et al. Influenza A infection of primary human airway epithelial cells up-regulates proteins related to purine metabolism and ubiquitin-related signaling. J Proteome Res. 2013;12(7):3139–51. doi: 10.1021/pr400464p. [DOI] [PubMed] [Google Scholar]
- 20.Coen M, Holmes E. BMC Proceedings. BioMed Central Ltd.; 2010. Translation of metabolite profiling to infectious diseases. [Google Scholar]
- 21.Slupsky CM, et al. Streptococcus pneumoniae and Staphylococcus aureus pneumonia induce distinct metabolic responses. J Proteome Res. 2009;8(6):3029–36. doi: 10.1021/pr900103y. [DOI] [PubMed] [Google Scholar]
- 22.Slupsky CM, et al. Pneumococcal pneumonia: potential for diagnosis through a urinary metabolic profile. Journal of proteome research. 2009;8(12):5550–5558. doi: 10.1021/pr9006427. [DOI] [PubMed] [Google Scholar]
- 23.Golay A, et al. Metabolic basis of obesity and noninsulin-dependent diabetes mellitus. Diabetes Metab Rev. 1988;4(8):727–47. doi: 10.1002/dmr.5610040803. [DOI] [PubMed] [Google Scholar]
- 24.Fujimoto WY. The importance of insulin resistance in the pathogenesis of type 2 diabetes mellitus. Am J Med. 2000;108(Suppl 6a):9S–14S. doi: 10.1016/s0002-9343(00)00337-5. [DOI] [PubMed] [Google Scholar]
- 25.Suhre K, et al. Metabolic footprint of diabetes: a multiplatform metabolomics study in an epidemiological setting. PLoS One. 2010;5(11):e13953. doi: 10.1371/journal.pone.0013953. [DOI] [PMC free article] [PubMed] [Google Scholar]
Associated Data
This section collects any data citations, data availability statements, or supplementary materials included in this article.
Supplementary Materials
Table S1 The information of the patients


