Abstract
This study presents a novel computational approach to find relevant pathways from dose-dependent time series gene expression data which are significantly associated with a phenotype pattern pathological patterns in the comprehensive evaluation of database of pathways. Our system uses four steps: 1) identify a set of genes which change significantly in dose or time; 2) find phenotype patterns and gene coefficients for the genes found in step 1; 3) expand to genome-wide coefficients, and 4) identify pathways which are significantly relevant to a phenotype pattern. Our technique finds biologically relevant pathways with and without phenotype-constraints. Our system has been used on genome-wide expression profiles of mouse lungs (n=160) following aspiration of well dispersed multi-walled carbon nanotubes (MWCNT), in order to detect MWCNT-induced lung inflammation and related pathways. The identified significant pathways are supported by evidence in the literature and biological validation.
Keywords: dose-dependent time series microarray data, pathways, nanoparticles, toxicogenomics
I. Introduction
Identifying biologically relevant pathways from time series dose-response toxicogenomics data is important to reveal toxicity mechanisms. Recently, multi-walled carbon nanotubes (MWCNT) have been widely used for various industrial applications [1]. It was found that MWCNT exposure causes rapid lung inflammation, fibrosis and toxicity in the treated mice [2]. However, molecular mechanisms underlying MWCNT-induced pathogenesis are unknown.
Finding biologically relevant pathways to a given phenotype from time course and dose dependent gene expression microarray data is a difficult problem. Dynamic Bayesian Networks (DBN) have been used to identify potential mechanisms through gene interaction networks [3;4]. DBN systems allow for feedback mechanisms but suffer from relatively low accuracy [5]. While DBN systems are able to find potential new networks, it is difficult to incorporate known pathological data. Clustering is often used in analyzing microarray data. Though techniques are being developed for incorporating phenotype information in clustering [6;7], traditional clustering algorithms and data mining techniques try to force each gene into a single coexpression group, although genes are often coexpressed in different groups depending on time or dose conditions.
Non-negative matrix factorization (NMF) was first introduced by Lee and Seung [8;9]. NMF is widely used in computational biology [10] with many different variations and related techniques [11]. NMF attempts to find basis vectors, which can be used to reconstruct the original data. The basis vectors (patterns) provide biologically relevant information and coefficients which can be used to describe how a gene is related to a particular pattern. Unlike Principal Components Analysis [12], the basis vectors do not have to be orthonormal. Like NMF, Bayesian Decomposition (BD) allows for genes to be assigned to multiple coexpression groups but also allows for prior biological information to be encoded [13;14].
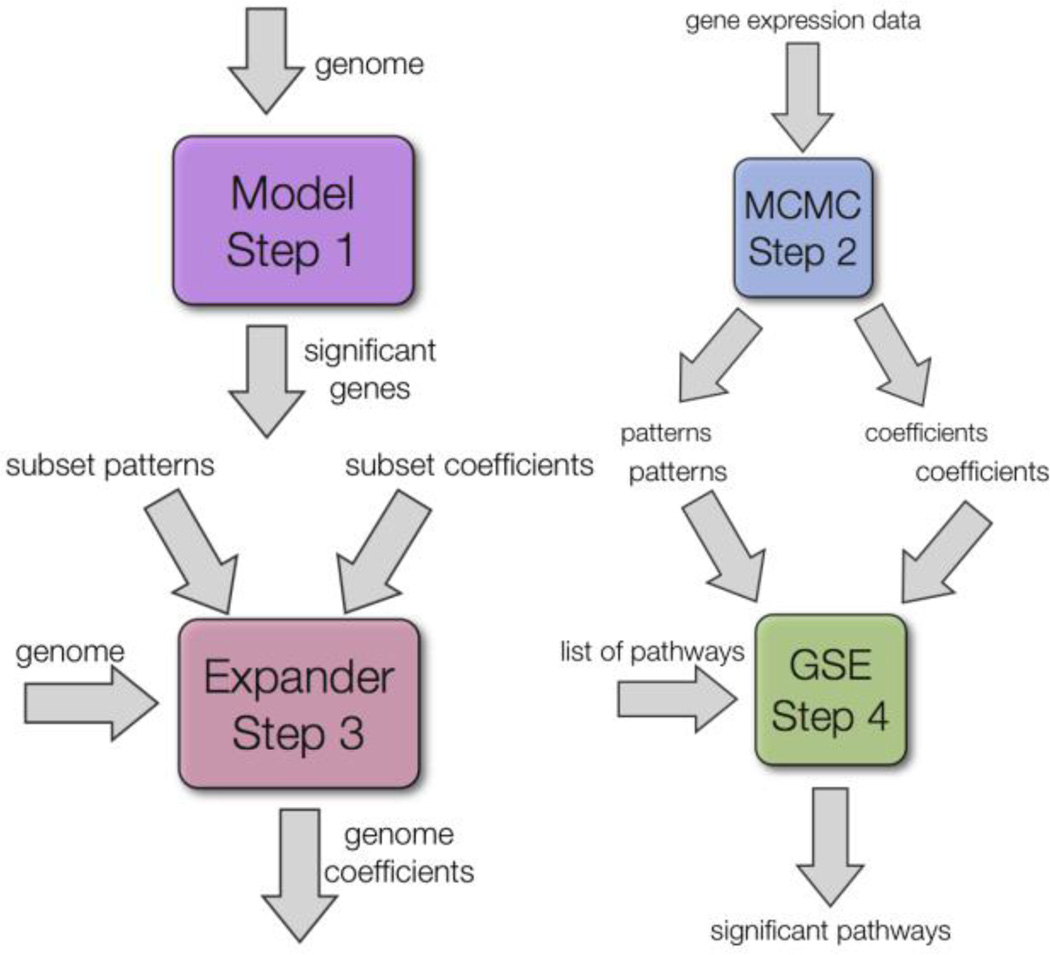
Figure 1 shows our system (MEGPath) which uses a database of curated pathways in order to find pathways which are significantly represented by a phenotype pattern. To accomplish this, MEGPath uses a NMF algorithm to generate patterns and corresponding genome wide coefficients for both dose and time dependent data. Phenotype data can easily be incorporated as prior information. To reduce noise in the patterns, MEGPath first finds patterns on genes which were found to be significant in a linear model, coefficients are then found genome wide. Finally, pathways significant to patterns are identified.
Figure 1.
The four components of the MEGPath system. Step 1: Linear Model and pair-wise SAM. Step 2: The MCMC process takes in gene expression data and outputs both patterns and coefficients. Step 3: If using a subset of the genome to generate patterns, the Coefficient Expander is used to find coefficients for the entire genome given the patterns generated from the subset. Step 4: The pathways, patterns and coefficients are used to identify significant pathways.
II. Method
A. Data Set
The data set consisted of dose-dependent time series mRNA microarray expression data. One hundred and sixty mice were exposed each to 0, 10, 20, 40, or 80 µg of MWCNT. Total RNA was extracted from the mouse lungs at 1, 7, 28, and 56 days post-exposure for each dose condition. Agilent Mouse Whole Genome Arrays were used for expression profiling. In total our genome consisted of 41,059 probes. Our data has been deposited to the NCBI Gene Expression Omnibus (GEO) repository with accession number GSE29042. The microarray data were log-transformed for analysis.
B. The System
Our system is divided into four main components: a linear model and pairwise Significance Analysis of Microarrays (SAM) [15] methods, the Monte Carlo Markov Chain (MCMC) component, the Coefficient Expander (CE) component, and finally the Gene Set Enrichment (GSE) component as shown in Figure 1.
First, a linear model was fit to the data, modeling the expression of each gene in turn as a function of time, dose, and the interaction of time with dose. Then, the pairwise SAM algorithm was used to generate a list of genes with expression values that were significantly dependent on dose and a list of gene whose expression values were significantly dependent on dose in a time dependent manner (Figure 1, Step 1).
The MCMC component is used as a NMF algorithm. Our algorithm attempts to find a set of nonorthogonal basis vectors (patterns) which can be linearly combined to reconstruct the original gene expression data. Patterns can be thought of as the average response of similar genes. As well as the patterns, the algorithm finds coefficients for each gene to each pattern. The most important feature of the MCMC algorithm is the ability for genes to be associated with multiple patterns.
The MCMC algorithm works as a Monte Carlo Markov Chain [16]. In order to reduce the search space, gene expressions are normalized to the [0–1) domain. Each location in the coefficient and pattern matrices has an associated probability density function (PDF). The PDFs are updated during the MCMC steps. After generating the PDFs, the MCMC component uses simulated annealing to minimize the overall error, using a standard annealing function [17] (Figure 1, Step 2).
Our third step is to apply the CE component (Figure 1, Step 3). This program attempts, through the use of simulated annealing, to find optimal coefficients for each gene in the genome from the patterns found in the MCMC step.
The final step is to calculate the GSE score for a given pathway of genes. The GSE score is based on the score from Gene Set Enrichment Analysis [18]. Each gene’s coefficients are normalized to obtain the relative importance of each pattern on the gene. Genes which are not common to both the pathway and genome are ignored and not used in computing the score. If a gene has multiple probes, the probe with least error is chosen. A pathway’s p-value is found by comparing its GSE score to the score of thousands of randomly generated gene sets.
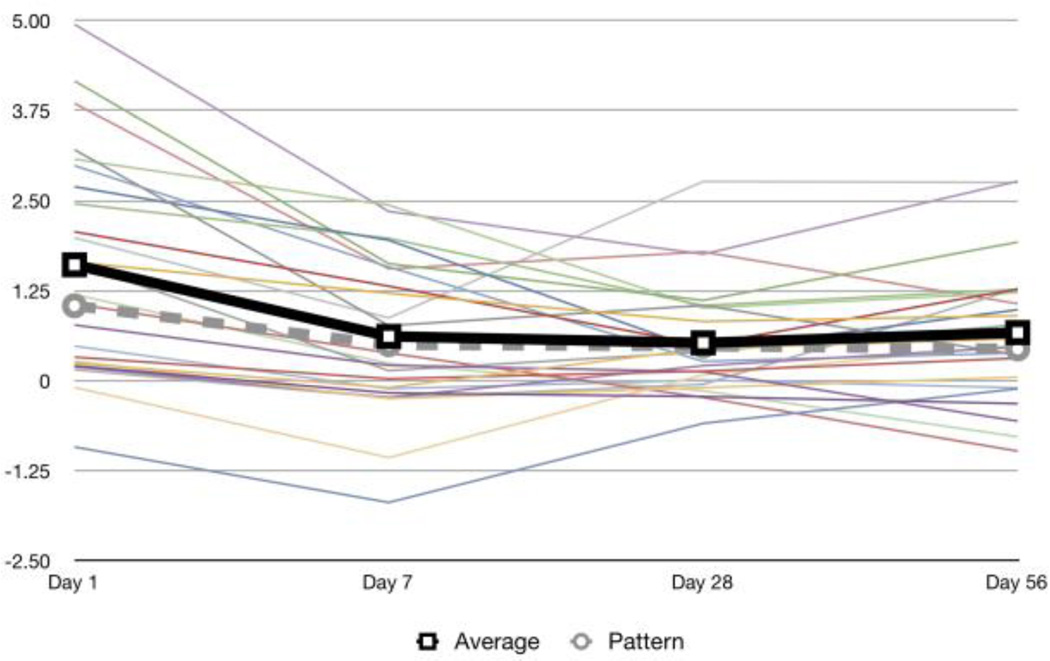
After p-values have been calculated for all the pathways, we used Benjamini-Hochberg to adjust for multiple hypothesis testing [19]. The leading set of a pathway is the subset of genes which were used to compute the GSE score. Since genes are allowed in multiple coexpression groups, not all genes in a pathway’s leading set have to have a similar looking expression. As seen in Figure 2, the average expression of the leading set closely resembles the pattern.
Figure 2.
Example leading set of a pathway with average gene expression in bold. The expressions of the genes in the leading set vary but the average expression matches Pattern 2 for Dose 80 using a non-constrained search. The pathway is REACTOME CHEMOKINE RECEPTORS BIND CHEMOKINES
III. Results and Implementation
A. Implementation
Average gene expressions were computed for the 8 mice in each group for the 5 doses and 4 time points. The 0 dose was used as a control, leaving 4 remaining doses. In order to avoid a trivial solution there must be fewer patterns than conditions, so 3 patterns were used.
We employed a linear model to find a set of genes which were changing significantly in either dose, or dose and time [20]. Our model produced a combined list of approximately 3,000 genes.
We used Broad Institute’s C2 [18] pathway database in the GSE component. The C2 database consists of approximately 800 curated gene sets which represent pathways. Only pathways with 15 or more genes in common with the mouse genome were tested for significance. Additional databases could be used such as the C5 Gene Oncology functions database.
B. Non-Constrained Results
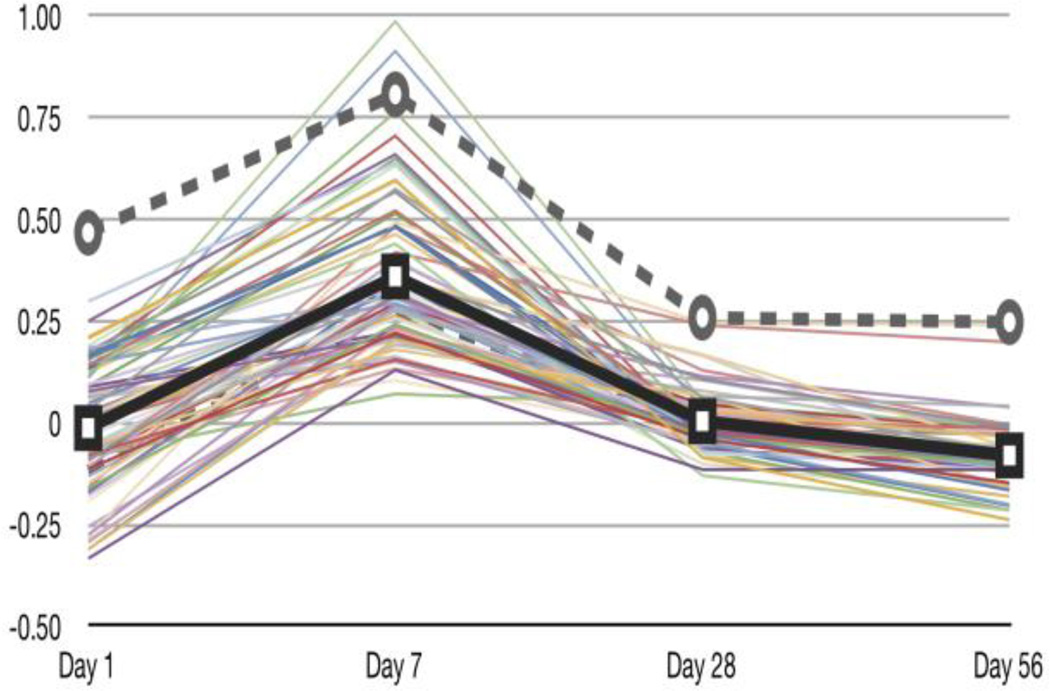
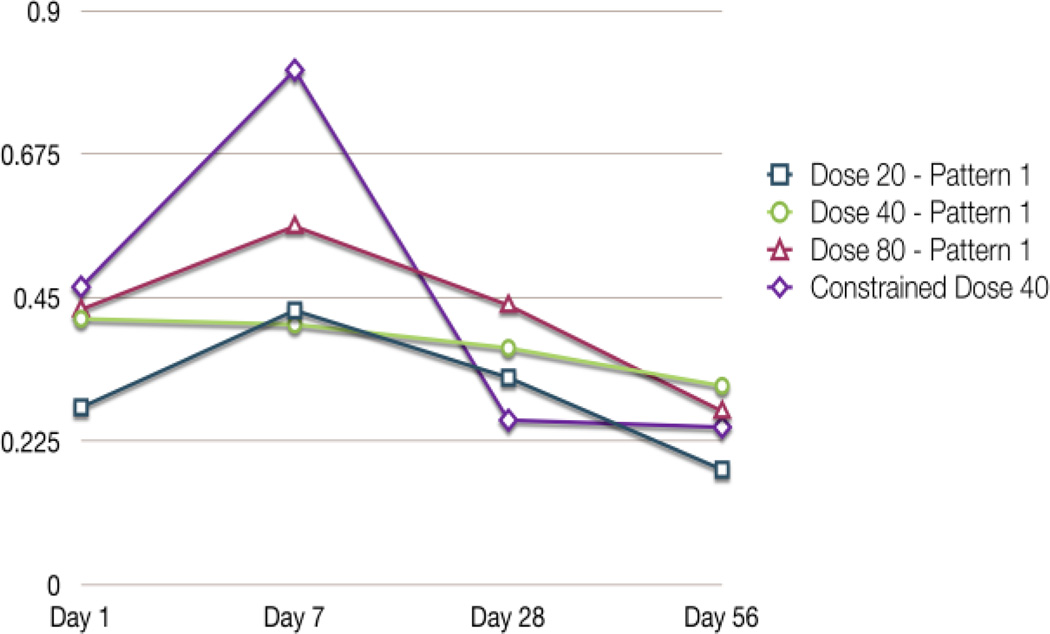
The MEGPath system was first run as a non-constrained search for patterns by looking at different doses across days. Figure 3 demonstrates that the system finds pathways which may vary at points but all resemble the pattern. As shown in Figure 4, we were able to detect similar patterns between the 20 µg, 40 µg and 80 µg doses.
Figure 3.
Average gene expression of the leading sets of pathways significant in Pattern 1 of Dose 80 using a non-constrained search. The average gene expression of the leading sets is in bold. Pattern 1 of Dose 80 resembles the lung inflammation phenotype (dashed line) for Dose 40 from Porter et al. [2]
Figure 4.
Patterns found from doses across days without phenotype constraints. The three patterns appear to be similar in all doses. Pattern 1 in Dose 20, Dose 40, and Dose 80. Also included is the the lung inflammation phenotype from Porter et al. [2] used for the constrained search.
Table I lists the significant pathways which were found to match Pattern 1 for Dose 40. Pattern 1 resembles the lung inflammation pattern reported by Porter et al. [2] in the same animal studies. The results show that when no phenotype data is provided, our system is capable of finding potential pathological patterns and related pathways from time series gene expression data.
TABLE I.
Pathways significant to pattern 1 for Dose 40 using a non-constrainted search
| Pathway | Adjusted P-Value |
|---|---|
| LYSOSOME | 0.0 |
| GPCR LIGAND BINDING | 0.0 |
| INTEGRIN CELL SURFACE INTERACTIONS | 0.0 |
| PEPTIDE LIGAND BINDING RECEPTORS | 0.0 |
| PRIMARY IMMUNODEFICIENCY | 0.0439 |
| CLASS A1 RHODOPSIN LIKE RECEPTORS | 0.0439 |
C. Phenotype Constrained
Next, we used phenotype data (histopathological scores of pulmonary inflammation) found for Dose 40 across the time points [2] to identify inflammation related pathways. As shown in Figure 4, we normalized the phenotype data to generate a constraint within the range 0 to 1. The constraint data was used as Pattern 1 with the other two patterns found automatically by the system.
Some of the significant pathways for the inflammation phenotype are shown in Table II. In total 50 pathways were found to be significant with Pattern 1 for Dose 40 with a constrained search. Several significant pathways are related to cell proliferation, immune response and chemokine, which are reported to be relevant to inflammation in the literature.
TABLE II.
Selected Pathways significant to pattern 1 for Dose 40 using a constrainted search
| Pathway | Adjusted P-Value |
|---|---|
| SIGNALING IN IMMUNE SYSTEM | 0.0 |
| REGULATION OF INSULIN SECRETION | 0.0 |
| SIGNALING IN IMMUNE SYSTEM | 0.0 |
| REGULATION OF INSULIN SECRETION | 0.0 |
| LYSOSOME | 0.0 |
| T CELL RECEPTOR SIGNALING PATHWAY | 0.0 |
| ECM RECEPTOR INTERACTION | 0.0 |
| PRIMARY IMMUNODEFICIENCY | 0.0 |
| G2 PATHWAY | 0.0 |
| CELL CYCLE MITOTIC | 0.01318 |
| CHEMOKINE SIGNALING PATHWAY | 0.01318 |
| G1 S TRANSITION | 0.01318 |
| PLATELET ACTIVATION TRIGGERS | 0.01318 |
| FMLP PATHWAY | 0.01318 |
| INTESTINAL IMMUNE NETWORK FOR IGA PRODUCTION | 0.02292 |
| FORMATION OF PLATELET PLUG | 0.02726 |
| IL2RB PATHWAY | 0.02726 |
IV. Conclusion
MWCNT exposure causes lung inflammation, fibrosis, and lung damage [2]. Nevertheless, the molecular mechanisms underlying these pathogenesis processes remain unknown. This study develops an innovative computational system to identify MWCNT-activated pathways matching the histopathology data observed in the animal studies. The identified significant pathways generate novel hypotheses for mechanistic studies of MWCNT-induced inflammation and fibrosis for intervention. The MEGPath system, involving a combination of the Monte Carlo Markov Chain, Coefficient Expansion and Gene Set Enrichment Analysis methods, is computationally efficient to model dose dependent time series microarray genome-scale expression data. Given pathological data observed in MWCNT-treated mice, this system can return biologically relevant signaling pathways supported in the literature and bench validation (results not shown). When no phenotype data is available, this system is able to identify potential pathological phenomena and related pathways. In addition to lung inflammation, we have identified significant pathways related to fibrosis for experimental validation.
Acknowledgment
We would like to thank Dr. James Denvir for his help and for providing the linear model code. We are grateful for Dr. Dale Porter and Dr. Vincent Castranova at NIOSH for providing the histopathology data in MWCNT-exposed mice.
Footnotes
Software package available at: http://www.hsc.wvu.edu/mbrcc/fs/GuoLab/products.asp
Contributor Information
Julian Dymacek, Email: jdymacek@mix.wvu.edu.
Nancy Lan Guo, Email: lguo@hsc.wvu.edu.
References
- 1.Pacurari M, Qian Y, Porter D, Wolfarth M, Wan Y, Luo D, Ding M, Castranova V, Guo N. Multi-walled carbon nano-tube induced gene expression in the mouse lung: association with lung pathology. Toxicology and Applied Pharmacology. 2011 Aug.255(1):18–31. doi: 10.1016/j.taap.2011.05.012. [DOI] [PMC free article] [PubMed] [Google Scholar]
- 2.Porter DW, Hubbs AF, Mercer RR, Wu N, Wolfarth MG, Sriram K, Leonard S, Battelli L, Schwegler-Berry D, Friend S, Andrew M, Chen BT, Tsuruoka S, Endo M, Castranova V. Mouse pulmonary dose- and time course-responses induced by exposure to multi-walled carbon nanotubes. Toxicology. 2011 Oct.269:136–147. doi: 10.1016/j.tox.2009.10.017. [DOI] [PubMed] [Google Scholar]
- 3.Morrissey ER, Juarez MA, Denby KJ, Burroughs NJ. On reverse engineering of gene interaction networks using time course data with repeated measurements. Bioinformatics. 2010 Jul;26(18):2305–2312. doi: 10.1093/bioinformatics/btq421. [DOI] [PubMed] [Google Scholar]
- 4.Kim SY, Imoto S, Miyano S. Inferring gene networks from time series microarray data using dynamic Bayesian networks. Briefings in Bioinformatics. 2003;4(3):228–235. doi: 10.1093/bib/4.3.228. [DOI] [PubMed] [Google Scholar]
- 5.Zou M, Conzen SD. A new dynamic Bayesian network (DBN) approach for identifying gene regulatory networks from time course microarray data. Bioinformatics. 2004 Aug.21(1):71–79. doi: 10.1093/bioinformatics/bth463. [DOI] [PubMed] [Google Scholar]
- 6.Bushel PR, Wolfinger RD, Gibson G. Simultaneous clustering of gene expression data with clinical chemistry and pathological evaluations reveals phenotypic prototypes. BMC Systems Biology. 2007 Feb.1(15) doi: 10.1186/1752-0509-1-15. [DOI] [PMC free article] [PubMed] [Google Scholar]
- 7.Afshari CA, Hamadeh HK, Bushel PR. The evolution of bioinformatics in toxicology: advancing toxicogenomics. Toxicological Sciences. 2010 Dec.120(S1):S225–S237. doi: 10.1093/toxsci/kfq373. [DOI] [PMC free article] [PubMed] [Google Scholar]
- 8.Lee DD, Seung HS. Learning the parts of objects by non-negative matrix factorization. Nature. 1999 Oct.401(6755):759–760. doi: 10.1038/44565. [DOI] [PubMed] [Google Scholar]
- 9.Lee DD, Seung HS. Algorithms for nonnegative matrix factorization. Advances in Neural Information Processing Systems. 2001;13:556–562. [Google Scholar]
- 10.Devarajan K. Non-negative matrix factorization: an analytical and interpretive tool in computaional biology. PLoS Computational Biology. 2008 Jul;4(7):e1000029. doi: 10.1371/journal.pcbi.1000029. [DOI] [PMC free article] [PubMed] [Google Scholar]
- 11.Kossenkov A, V, Ochs MF. Matrix Factorization for Recovery of Biological Processes from Microarray Data. Methods in Enzymology. 2009;467:59–77. doi: 10.1016/S0076-6879(09)67003-8. [DOI] [PMC free article] [PubMed] [Google Scholar]
- 12.Alter O, Brown PO, Botstein D. Singular value decomposition for genome-wide expression data processing and modeling. Proceedings of the National Academy of Sciences of the USA. 2000 Aug.97(18):10101–10106. doi: 10.1073/pnas.97.18.10101. [DOI] [PMC free article] [PubMed] [Google Scholar]
- 13.Moloshok TD, Klevecz RR, Grand JD, Manion FJ, Ochs MF. Application of Bayesian decomposition for analyzing microarray data. Bioinformatics. 2002;(18):566–575. doi: 10.1093/bioinformatics/18.4.566. [DOI] [PubMed] [Google Scholar]
- 14.Ochs MF, Rink L, Tarn C, Mbruru S, Taguchi T, Eisenberg B, Godwin AK. Detection of treatment-induced changes in signalling pathways in gastrointestinal stromal tumors using transcriptomic data. Cancer Research. 2009 Dec.69(23):9125–9132. doi: 10.1158/0008-5472.CAN-09-1709. [DOI] [PMC free article] [PubMed] [Google Scholar]
- 15.Tusher VG, Tibshirani R, Chu G. Significance analysis of microarrays applied to the ionizing radiation response. Proceedings of the National Academy of Sciences of the USA. 2001 Apr.98(9):5116–5121. doi: 10.1073/pnas.091062498. [DOI] [PMC free article] [PubMed] [Google Scholar]
- 16.Russell S, Norwig P. Artificial Intelligence: A Modern Approach. New Jersey: Prentice Hall; 2003. [Google Scholar]
- 17.Press WH, Teukolsky SA, Vetterling WT, Flannery BP. Numerical Recipes in C. New York: Cambridge University Press; 1999. [Google Scholar]
- 18.Subramanian A, Tamayo P, Mootha VK, Mukherjee S, Ebert BL, Gillette MA, Paulovich A, Pomeroy SL, Golub TR, Lander ES, Mesirov JP. Gene Set Enrichment Analysis: a knowledge-based approach for interpreting genome-wide expression profiles. Proceedings of the National Academy of Sciences of the USA. 2005 Oct.102(43):15545–15550. doi: 10.1073/pnas.0506580102. [DOI] [PMC free article] [PubMed] [Google Scholar]
- 19.Benjamini Y, Hockberg Y. Controlling the False Discovery Rate: a Practical and Powerful Approach to Multiple Testing. Journal of the Royal Statistical Society. Series B (Methodological) 1995;57(1):289–399. [Google Scholar]
- 20.Guo NL, Wan YW, Denvir J, Porter DW, Pacurari M, Wolfarth MG, Castranova V, Qian Y. Multi-walled Carbon Nanotube-induced gene signatures in the mouse lung are predictive of human lung cancer risk and prognosis, in review. Particle and Fibre Toxicology. 2011 [Google Scholar]


