

Abstract
Borrelia burgdorferi, the agent of Lyme disease, is maintained in nature within an enzootic cycle involving a mammalian reservoir and an Ixodes sp. tick vector. The transmission, survival and pathogenic potential of B. burgdorferi depend on the bacterium’s ability to modulate its transcriptome as it transits between vector and reservoir host. Herein, we employed an amplification-microarray approach to define the B. burgdorferi transcriptomes in fed larvae, fed nymphs and in mammalian host-adapted organisms cultivated in dialysis membrane chambers. The results show clearly that spirochetes exhibit unique expression profiles during each tick stage and during cultivation within the mammal; importantly, none of these profiles resembles that exhibited by in vitro-grown organisms. Profound shifts in transcript levels were observed for genes encoding known or predicted lipoproteins as well as proteins involved in nutrient uptake, carbon utilization and lipid synthesis. Stage-specific expression patterns of chemotaxis-associated genes also were noted, suggesting that the composition and interactivities of the chemotaxis machinery components vary considerably in the feeding tick and mammal. The results as a whole make clear that environmental sensing by B. burgdorferi directly or indirectly drives an extensive and tightly integrated modulation of cell envelope constituents, chemotaxis/motility machinery, intermediary metabolism and cellular physiology. These findings provide the necessary transcriptional framework for delineating B. burgdorferi regulatory pathways throughout the enzootic cycle as well as defining the contribution(s) of individual genes to spirochete survival in nature and virulence in humans.
Introduction
Lyme disease, a multi-system disorder with cutaneous, neurologic, cardiac and rheumatologic manifestations, is caused by infection with the spirochete, Borrelia burgdorferi (Steere, 2001; Radolf et al., 2012). Approximately 30,000 new cases of Lyme disease are reported to the Centers for Disease Control and Prevention (CDC) each year, making it the most commonly reported arthropod-borne disease in the United States (Bacon et al., 2008; Hall-Baker et al., 2010). A recent report from the CDC suggests that the true number of cases per year in the US may be as high as 300,000 (Kuehn, 2013).
B. burgdorferi is maintained in nature within an enzootic cycle involving a mammalian reservoir (typically small rodents, such as the white-footed mouse, Peromyscus leucopus) and an arthropod vector (Ixodes scapularis or Ixodes pacificus in North America) (Steere et al., 2004; Kurtenbach et al., 2006; Radolf et al., 2012). Following deposition in the mammal by a feeding tick, usually a nymph, the spirochete must establish itself locally at the bite site and then disseminate to peripheral tissues while evading host innate and adaptive immune responses (Tilly et al., 2008; Schwan and Piesman, 2002). During larval acquisition, chemotactic signals emanating from the bite site induce borreliae to migrate from the skin of the reservoir host into the tick midgut where they colonize the epithelium without being internalized and digested by it (Tilly et al., 2008; Schwan and Piesman, 2000). Acquired spirochetes also must adjust physiologically to their new arthropod host in the midst of a variety of bactericidal molecules (e.g., reactive oxygen species, degradative enzymes, and activated complement) generated by the midgut epithelium and/or derived from ingested blood (Boylan et al., 2008; Bourret et al., 2011; Pal and Fikrig, 2010; Pappas et al., 2011; Kraiczy and Stevenson, 2013). Following the molt, spirochetes endure a protracted period in a nutrient-poor milieu, the unfed nymphal midgut, by adopting a quiescent and still poorly understood metabolic state (Revel et al., 2002; Pal and Fikrig, 2010). During transmission, signals originating from the nymphal blood meal induce a tightly orchestrated sequence of events closely coordinated with complex morphologic and developmental changes occurring in the digestive midgut (Pal and Fikrig, 2010; Dunham-Ems et al., 2009). As feeding progresses, B. burgdorferi undergo exponential replication, upregulate expression of genes/proteins required for dissemination within the vector, and eventually traverse the midgut, presumably while fending blood meal-derived threats comparable to those encountered during larval acquisition. A relatively small number of organisms overcome these anatomic and physiologic barriers to reach the hemocoel (Dunham-Ems et al., 2009; Coleman et al., 1997). They then attach to and penetrate the salivary glands and are deposited along with saliva at the feeding site of their next mammalian host, thereby completing the cycle (Ohnishi et al., 2001; Ribeiro et al., 1987).
The transmission, survival and pathogenic potential of B. burgdorferi depend on the bacterium’s ability to modulate its transcriptome in response to environmental cues encountered as it transits between arthropod vector and reservoir host (Pal and Fikrig, 2010; Skare et al., 2010; Samuels, 2011; Radolf et al., 2012; Groshong and Blevins, 2014). In bacteria, global regulation of gene expression in response to environmental cues is often mediated by alternative sigma factors or two-component systems (TCS) (Beier and Gross, 2006; Kazmierczak et al., 2005). Remarkably, the B. burgdorferi genome encodes only two alternative sigma factors and two TCS (Fraser et al., 1997; Radolf et al., 2012; Samuels, 2011; Groshong and Blevins, 2014). Seminal studies by Norgard and co-workers (Hubner et al., 2001; Yang et al., 2003; Smith et al., 2007) demonstrated a link between one TCS, Hk2-Rrp2, and the alternative sigma factors RpoN and RpoS. RpoN-dependent transcription of rpoS, triggered by the nymphal blood meal (Caimano et al., 2007), results in the induction of a cohort of approximately 100 genes, at least some of which are required for tick transmission and mammalian infectivity (Radolf et al., 2012; Groshong and Blevins, 2014; Fisher et al., 2005; Caimano et al., 2004; Dunham-Ems et al., 2012). RpoS also represses genes expressed exclusively during the tick phase, hence its designation as ‘the gatekeeper’ (Caimano et al., 2007). Evidence from several laboratories suggests that B. burgdorferi, an extreme auxotroph (Fraser et al., 1997; Gherardini et al., 2010), senses the environmental cues that activate or modulate the Rrp2-RpoN-RpoS network through products of intermediary metabolism. Phosphorylation of the response regulator Rrp2 occurs via the small, high-energy, phosphoryl-donor acetyl phosphate, the intermediate of the acetate kinase-phosphate acetyltransferase (AckA-Pta) pathway that converts acetate to acetyl-CoA (Burtnick et al., 2007; Xu et al., 2010). Sze et al. (Sze and Li, 2011) reported that the small RNA binding protein carbon storage regulator A (CsrA) inhibits expression of Pta, thereby increasing phosphorylation of Rrp2, although Norgard and co-workers (Ouyang et al., 2014) recently reported that deletion of CsrA had no effect on RpoS-dependent gene expression or B. burgdorferi virulence. Lastly, Miller et al. (Miller et al., 2013) reported that the trans-acting factor Borrelia host adaptation regulator (BadR) binds to the rpoS promoter, preventing transcription of RpoS, and that phosphorylated sugars abrogate its DNA-binding activity. Activation of the spirochete’s second TCS, Hk1/Rrp1, by as yet unidentified exogenous ligands, results in synthesis of the signaling molecule cyclic-di-GMP (c-di-GMP) and is essential for survival of both the larval and nymphal blood meals but not for mammalian infectivity (Kostick et al., 2011; He et al., 2011; Caimano et al., 2011). This protective effect is mediated, at least in part, by c-di-GMP-dependent transcription of the glp operon (He et al., 2011), which promotes uptake and utilization of glycerol (Ojaimi et al., 2003), an important carbon source during the tick phase of the cycle (Pappas et al., 2011). Remodeling of the cell envelope also may be an important contributor to this protective effect (Caimano et al., 2011).
Despite the above studies, we possess only a rudimentary understanding of the transcriptional and physiological changes that spirochetes undergo as they respond and adapt to their arthropod vector and reservoir host. Moreover, it is also likely that many of the spirochete’s differentially expressed genes are controlled by regulatory pathways outside of the Rrp2-RpoN-RpoS and Hk1/Rrp1 networks. Along these lines, in recent years, several B. burgdorferi transcriptional factors have been described although their regulatory properties have, thus far, been characterized only in vitro (Jutras et al., 2012; Jutras et al., 2013a; Jutras et al., 2013b; Ouyang et al., 2011; Hyde et al., 2009; Samuels, 2011). Herein we employed microarray analysis to interrogate the transcriptome of B. burgdorferi as it transits through the enzootic cycle and compared it to that of spirochetes cultivated in BSK II medium. As surrogates for spirochetes infecting the mammal, we used organisms cultivated in dialysis membrane chambers (DMCs), a well utilized model system for generating large numbers of mammalian host-adapted B. burgdorferi (Akins et al., 1998; Revel et al., 2002; Ristow et al., 2012; Caimano et al., 2007). The results show clearly that spirochetes adopt unique transcriptional profiles during each blood meal and during cultivation within the mammal, none of which closely resemble that exhibited by in vitro-grown organisms. On the other hand, we also observed substantial overlaps in the expression profiles of organisms during the two blood meals and between organisms in DMCs and fed nymphs as one would expect given the environmental cues and obstacles presumed to be shared during these life cycle phases (Tilly et al., 2008; Radolf et al., 2012). Lastly, we noted profound shifts in transcript levels for B. burgdorferi metabolic enzymes within ticks and mammals, particularly with respect to carbon utilization and lipid synthesis, along with major differences in expression patterns of chemotaxis-associated genes. As a whole, these results provide the necessary transcriptional framework for delineating B. burgdorferi regulatory pathways throughout the enzootic cycle, as well as informing mutagenesis strategies to define the contribution(s) of individual B. burgdorferi genes to spirochete survival in nature and virulence in humans.
Results and Discussion
Enrichment and amplification of tick-derived B. burgdorferi RNA
The relatively small numbers of bacteria that can be obtained from either infected ticks or mammals, coupled with the presence of contaminating host RNA, present a formidable technical barrier for robust transcriptome analysis of B. burgdorferi from in vivo sources. For the mammalian phase, this problem has been circumvented to a substantial extent by cultivation of B. burgdorferi in DMCs (Akins et al., 1998; Caimano et al., 2007). Pal et al. (Pal et al., 2008) described a method for enrichment of B. burgdorferi RNA from infected ticks and amplification prior to application to a microarray. Modifications to this approach were systematically investigated in preliminary studies, yielding the protocol described in detail in Experimental Procedures. Briefly, ribosomal RNA was removed from total RNA obtained from pools of infected ticks and the bacterial RNA was specifically amplified (aRNA); aminoallyl UTP for subsequent coupling with fluorescent dye was also incorporated into the amplification step. Finally, Cy3 or Cy5 was coupled to the aRNA which then was employed for hybridization.
Preferential amplification of B. burgdorferi transcripts is a potential concern with this procedure. To assess the extent of this problem, we compared the hybridization results obtained using 5 μg each of aRNA and unamplified RNA isolated from temperature-shifted spirochetes cultivated in vitro at 37°C to late-log phase. Hybridization above background was detected for >70% of the spotted ORFs in both RNA samples. Figure S1 reveals that most genes had equivalent signal intensities. We concluded that the enrichment and amplification procedures do not introduce a substantial bias in transcript abundance and that aRNA can be used for global transcriptome analyses. In subsequent pilot experiments, we determined that aRNAs containing a minimum of 5 × 10⁵ flaB transcript copies were required for robust and reproducible microarray results. Consequently, all microarray data reported below were obtained with aRNAs containing between 5 × 10⁵ and 2 × 10⁶ flaB transcripts.
Validation of microarray expression data
To ensure at the outset that the biological samples yielded expected expression profiles, we compared the microarray data for 20 genes in the current dataset to those previously determined by quantitative reverse transcription polymerase chain reaction (qRT-PCR) in ticks, DMCs or mammalian tissues (Table S1) (Wang et al., 2002; Bykowski et al., 2007; Caimano et al., 2007; Mulay et al., 2009; Kumar et al., 2010; Pappas et al., 2011; Dunham-Ems et al., 2012). With the exception of bbi42, the expression profiles observed by microarray conformed to those reported previously. In addition, to validate the array results, transcript levels for 30 selected genes were measured by qRT-PCR (Table 1); the microarray and qRT-PCR data were consistent for 24 of the 30 genes tested. Regression analysis of transcript levels for these genes in all three biological conditions as determined by either qRT-PCR or microarray is presented in Figure S2. The good correlation between the microarray and qRT-PCR datasets further enhanced our confidence that transcript levels could be measured reliably by the microarray methodology employed herein.
Table 1.
qRT-PCR of selected genes
| Gene Name | Description | qRT-PCR (copies/100 copies of flaB± SEM) | Microarray pixel intensity (log2) | ||||
|---|---|---|---|---|---|---|---|
|
| |||||||
| Larvae | Nymph | DMC | Larvae | Nymph | DMC | ||
| bb0037 | 1-acyl-sn-glycerol-3-phosphate acyltransferase | 5.2± 0.32 | 11 ± 2.83 | 2.8 ± 0.56 | 8.4848 | 9.8357 | 7.5906 |
| bb0137 | long-chain-fatty-acid CoA ligase | 4.76±0.36 | 4.2±0.24 | 2.4 ± 0.02 | 9.9857 | 10.1181 | 7.4924 |
| bb0327 | glycerol-3-phosphate O-acyltransferase, putative | 3.3 ±0.58 | 3.6 ±0.52 | 3.2 ±0.71 | 11.2179 | 8.1747 | 9.6740 |
| bb0328 | oligopeptide ABC transporter, OppA1 | 14.4 ± 4.7 | 11.7 ± 1.9 | 1.8 ± 0.5 | 9.8014 | 8.6381 | 6.4445 |
| bb0329 | oligopeptide ABC transporter, OppA2 | 11.3 ± 2.5 | 7.8 ± 0.4 | 5.8 ± 1.0 | 5.3483 | 5.5640 | 8.4836 |
| bb0330 | oligopeptide ABC transporter, OppA3 | 15.7 ± 1.4 | 17.0 ± 1.3 | 0.9 ± 0.14 | 5.5162 | 6.3240 | 5.7805 |
| bb0570 | chemotaxis response regulator, CheY2 | 2.5 ± 0.87 | 4.4 ± 0.45 | 2.05 ±0.72 | 8.6473 | 13.1963 | 8.6079 |
| bb0589 | phosphate acetyltransferase, Pta | 0.0 | 0.24 ± 0.05 | 0.5± 0.3 | 4.4254 | 8.5186 | 2.8350 |
| bb0593 | long-chain-fatty-acid CoA ligase | 7.34 ±0.36 | 9.25 ±0.32 | 5.2 ± 0.81 | 6.2528 | 8.0338 | 2.0981 |
| bb0603 | membrane-associated protein p66 | 14.3±0.86 | 9.3 ± 1.27 | 2.9 ± 0.84 | 8.5244 | 8.1466 | 5.5759 |
| bb0604 | L-lactate permease, LctP | 2.2 ± 0.65 | 1.7 ± 0.68 | 0.34 ± 0.15 | 9.0930 | 8.2296 | 5.0828 |
| bb0622 | acetate kinase, AckA | 0.0 | 1.1 ± 0.25 | 0.8 ± 0.34 | 2.9295 | 5.8065 | 1.1463 |
| bb0640 | spermidine/putrescine ABC transporter, permease protein, PotC | 3.7 ± 1.0 | 1.5 ± 0.29 | 0.7 ± 0.7 | 4.7017 | 7.3889 | 2.0000 |
| bb0647 | BosR | 1.3 ±0.53 | 2.1 ±0.31 | 0.20±0.1 | 8.2039 | 6.0497 | 4.3931 |
| bb0657 | ribose 5-phosphate isomerase, Rpi | 3.8± 1.3 | 1.83 ± 0.08 | 0.17± 0.17 | 9.8228 | 7.8449 | 5.4750 |
| bb0670 | purine-binding chemotaxis protein, CheW3 | 1.5 ± 0.21 | 1.7 ±0.2 | 0.8 ± 0.07 | 8.1075 | 8.8756 | 9.2785 |
| bb0672 | chemotaxis response regulator, CheY3 | 4.8 ± 1.6 | 7.32 ±3.31 | 7.0 ± 0.5 | 8.1317 | 8.8051 | 9.0366 |
| bb0690 | DpsA | 12.8 ±2.22 | 13.3 ±0.88 | 3.1 ±1.4 | 11.6371 | 10.7164 | 8.6349 |
| bb0729 | transporter, dicarboxylate/amino acid:cation (Na+ or H+) symporter | 2.6 ± 1.0 | 15.0 ±2.2 | 2.7 ± 0.83 | 7.5394 | 14.3295 | 7.8432 |
| bb0785 | spoVG (stage V sporulation protein G) | 76.0 ± 16.4 | 175 ±11 | 50.0 ± 6.2 | 10.8007 | 11.2237 | 8.5024 |
| bb0841 | arginine deiminase, ArcA | 17.6± 2.72 | 7.4 ± 0.26 | 0.43 ± 0.06 | 7.3074 | 9.8850 | 7.6696 |
| bba15 | outer surface protein A, OspA | 94.0±20.0 | 57.0± 18.9 | 6.6± 2.1 | 11.6302 | 10.4052 | 8.6642 |
| bba34 | oligopeptide ABC transporter, OppA5 | 0.03 ± 0.002 | 0.13 ± 0.04 | 1.54 ± 0.3 | 2.4237 | 3.2322 | 7.2541 |
| bba62 | lipoprotein | 230 ± 11.3 | 103 ± 18.4 | 13.6± 0.55 | 13.5743 | 13.1152 | 9.3169 |
| bba64 | antigen, P35 | 0.53 ±0.12 | 4.3 ±0.77 | 5.6 ±0.26 | 4.4970 | 4.2953 | 7.5493 |
| bba74 | periplasmic protein | 197 ± 16.9 | 80.0 ± 3.15 | 11.0 ± 6.7 | 13.3145 | 11.7127 | 10.2803 |
| bbb05 | PTS system, chitobiose-specific IIA component, ChbA | 0.6±0.13 | 4.7 ± 0.23 | 7.0 ± 2.1 | 6.1208 | 8.7611 | 9.0729 |
| bbb16 | oligopeptide ABC transporter, OppA4 | 2.0 ± 0.5 | 1.2 ± 0.4 | 1.45 ± 0.3 | 5.8903 | 6.5782 | 9.0747 |
| bbb19 | outer surface protein C, OspC | 1.78±0.4 | 52.0 ± 12.4 | 81.0± 1.7 | 5.3030 | 11.8807 | 12.7225 |
| bbb29 | PTS system, maltose and glucose-specific IIABC component, MalX | 100 ± 20.3 | 53.0 ± 12.0 | 12.0 ±0.6 | 12.0319 | 10.8203 | 9.0398 |
Overall characteristics of the B. burgdorferi transcriptomes
An overall snapshot of the B. burgdorferi transcriptomes in fed ticks and DMCs was generated using the normalized, background adjusted pixel intensities and criteria described in Experimental Procedures; transcripts that yielded pixel intensities >75 above background in a particular condition were considered to be expressed. We detected 559, 950, and 1200 B. burgdorferi transcripts in fed larvae, fed nymphs and DMCs, respectively (Figure 1A). The much lower spirochete numbers in fed larvae, as compared to engorged nymphs, necessitated isolation of RNA from considerably larger larval pools (minimum of 50 larvae vs. 5 nymphs per pool). This resulted in higher backgrounds on microarrays hybridized with samples from fed larvae. Consequently, lack of detection of a specific transcript in fed larvae cannot be interpreted as definitive evidence that the gene is not expressed in this environment. On the other hand, given that tick transmission and infection/virulence-related genetic programs are in the off state during larval acquisition (Caimano et al., 2007; Mulay et al., 2009; Dunham-Ems et al., 2012), it is biologically plausible that fewer genes are expressed by spirochetes during this enzootic phase.
Figure 1. B. burgdorferi transcriptome during growth in infected ticks, DMCs or in vitro culture.
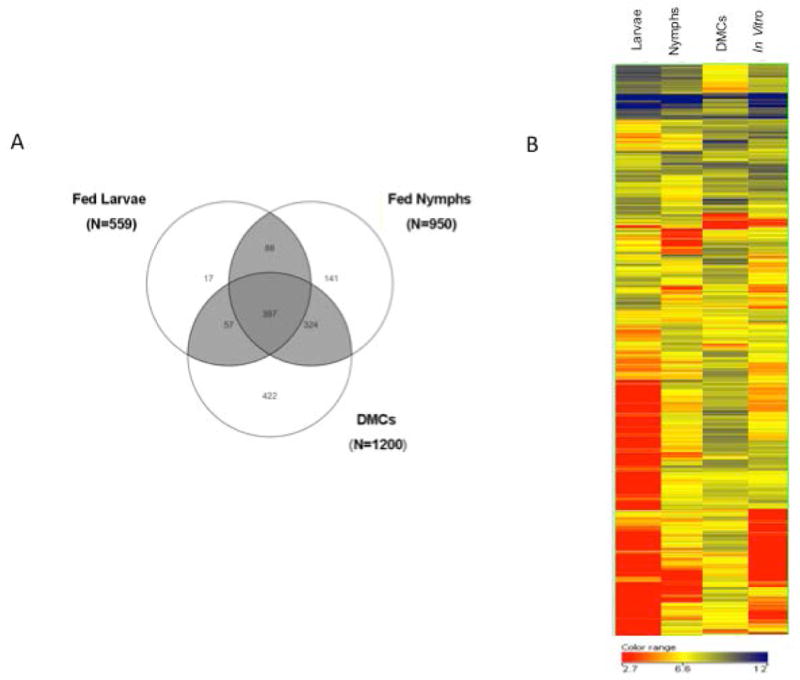
A) Venn diagram depicting the number of genes expressed in fed larvae, fed nymphs and DMCs. B) Hierarchical clustering of microarray data sets of gene expression in fed ticks and cells cultivated in DMCs or in vitro at 37°C. Analysis was performed for 742 transcripts that displayed significantly different expression levels between at least two conditions.
Comparison of the three in vivo transcriptomes revealed 397 gene transcripts, 66 % chromosomally-encoded, that were expressed under all conditions (Figure 1A); these transcripts presumably constitute the “core transcriptome” necessary for B. burgdorferi survival in nature (Table S2). Among these are 74 genes involved in information processing (replication, transcription or translation), 23 genes related to chemotaxis and motility, 23 encoding components of the cell envelope and 36 genes encoding metabolic or transport-related functions. In addition, we identified 246 transcripts that were detected only in ticks; 88 of these were detected in both larvae and nymphs, while 17 and 141 were detected, respectively, only in fed larvae or nymphs (Figure 1A). Four hundred twenty-two transcripts were expressed only in B. burgdorferi grown in DMCs, with a remarkable 80% plasmid-encoded. Thus, not only is a substantial proportion of the spirochete’s transcriptome restricted to the mammalian host-adapted state but, as widely presumed (Radolf et al., 2012), the plasmid complement of the genome serves as the repository for the large majority of these differentially expressed genes. Interestingly, DMCs and fed nymphs shared 324 transcripts, whereas DMCs and larvae shared only 57. The much greater overlap of the fed nymph and DMC transcriptomes likely reflects the fact that spirochetes in engorged nymphs are not just negotiating barriers within the tick in order to be transmitted, but also are adapting physiologically to their future mammalian host; in contrast, in engorged larvae, the spirochete’s genetic programs are orienting it for colonization of the vector.
The 100 transcripts most highly expressed across all four growth states are listed in Table S3. As would be expected, these include many genes encoding proteins involved in information processing and flagellar function. Transcripts for several well-characterized outer surface lipoproteins (BBA15/16 [OspA/B], BBA59, BBA62 [Lp6.6], BB0365 [LA7]) and those encoding transporters or enzymes for carbohydrate or lipid metabolism (lactate dehydrogenase, acyl carrier protein, BB0557 [PtsH-2], BB0559 (glucose-specific EIIA PTS component), BBB29 [MalX2]) are also highly expressed. Table 2 lists the 100 most highly expressed genes in fed nymphs and, for comparison, also includes the relative expression ranks for these transcripts in fed larvae, DMCs and spirochetes grown in vitro. While there is substantial overlap (53 transcripts) between these transcripts and those that are most abundant in all four conditions tested (Table S3), the table also includes 38 transcripts with significantly different levels in fed nymphs relative to either DMCs or fed larvae. Transcripts that had significantly different abundances (fold change >2; p<.02) in the various in vivo environments are listed in tables S4–S8. Many of these genes are discussed in greater detail in the following sections.
Table 2.
100 most highly expressed B. burgdorferi transcripts in Fed Nymphsa
| Gene Name | Description | Expression Rank | |||
|---|---|---|---|---|---|
|
| |||||
| Nymph | Larvae | DMC | In Vitro | ||
|
|
|||||
| bb0049 | hypothetical protein | 1 | 1 | 3 | 1 |
| bb0729 | transporter, dicarboxylate/amino acid:cation (Na+ or H+) symporter | 2 | 101 | 735 | 30 |
| bbi29 | virulent strain associated lipoprotein (chemotaxis-motility) | 3 | 21 | 938 | 89 |
| bb0048 | hypothetical protein | 4 | 7 | 4 | 2 |
| bb0570 | chemotaxis response regulator, CheY2 | 5 | 111 | 336 | 26 |
| bba62 | lipoprotein | 6 | 3 | 142 | 6 |
| bba59 | lipoprotein | 7 | 4 | 11 | 15 |
| bbb19 | outer surface protein C, OspC | 8 | 711 | 1 | 816 |
| bba74 | periplasmic protein | 9 | 2 | 36 | 7 |
| bba16 | outer surface protein B, OspB | 10 | 6 | 47 | 4 |
| bb0034 | outer membrane porin, P13 | 11 | 5 | 46 | 3 |
| bb0238 | hypothetical protein | 12 | 19 | 146 | 17 |
| bbr33 | plasmid partition protein, putative | 13 | 1418 | 1136 | 1643 |
| bb0425 | hypothetical protein | 14 | 16 | 5 | 21 |
| bb0167 | outer membrane protein, ompA-like, putative peptidoglycan-binding | 15 | 52 | 1439 | 34 |
| bb0785 | SpoVG (stage V sporulation protein G) | 16 | 18 | 391 | 11 |
| bb0541 | hypothetical protein | 17 | 14 | 9 | 25 |
| bbk04 | Hypothetical protein | 18 | 176 | 991 | 322 |
| bba15 | outer surface protein A, OspA | 19 | 10 | 356 | 8 |
| bb0690 | DpsA | 20 | 11 | 328 | 33 |
| bbb29 | PTS system, maltose and glucose-specific IIABC component, MalX | 21 | 9 | 167 | 10 |
| bb0457 | excinuclease ABC, subunit C, UvrC | 22 | 640 | 977 | 219 |
| bb0295 | heat shock protein, HslU | 23 | 15 | 15 | 19 |
| bb0396 | ribosomal protein L33 | 24 | 35 | 23 | 22 |
| bb0232 | hbbU protein | 25 | 25 | 62 | 38 |
| bb0233 | ribosomal protein S20 | 26 | 31 | 344 | 70 |
| bb0423 | hypothetical protein | 27 | 22 | 7 | 9 |
| bb0293 | flagellar basal-body rod protein, FlgC | 28 | 108 | 123 | 39 |
| bb0355 | CarD-like transcriptional regulator, LtpA | 29 | 109 | 68 | 73 |
| bb0298 | TPR domain protein | 30 | 261 | 646 | 225 |
| bb0037 | 1-acyl-sn-glycerol-3-phosphate acyltransferase (1-agpat) | 31 | 60 | 815 | 101 |
| bb0272 | flagellar biosynthesis protein, FlhB | 32 | 48 | 98 | 28 |
| bb0612 | ATP-dependent Clp protease, subunit X, ClpX | 33 | 64 | 1452 | 256 |
| bb0327 | glycerol-3-phosphate O-acyltransferase | 34 | 12 | 77 | 20 |
| bb0240 | glycerol uptake facilitator, GlpF | 35 | 66 | 1189 | 158 |
| bba73 | antigen, P35 | 36 | 916 | 149 | 1413 |
| bba58 | hypothetical protein | 37 | 354 | 218 | 23 |
| bb0285 | flagellar protein, FlbC | 38 | 134 | 43 | 29 |
| bbj15 | Hypothetical protein | 39 | 143 | 1404 | 545 |
| bbb07 | alpha3-beta1 integrin-binding protein, putative | 40 | 121 | 651 | 966 |
| bb0786 | ribosomal protein L25, Ctc-form | 41 | 46 | 78 | 16 |
| bb0636 | glucose-6-phosphate 1-dehydrogenase | 42 | 77 | 1413 | 263 |
| bb0137 | long-chain-fatty-acid CoA ligase | 43 | 63 | 895 | 166 |
| bbh24 | hypothetical protein | 44 | 8 | 791 | 14 |
| bb0346 | export chaperone, Outer membrane lipoprotein carrier protein, LolA | 45 | 348 | 416 | 115 |
| bbb04 | PTS system, chitobiose-specific IIC component, ChbC | 46 | 90 | 790 | 587 |
| bb0395 | preprotein translocase subunit SecE | 47 | 20 | 26 | 54 |
| bb0424 | hypothetical protein | 48 | 147 | 19 | 5 |
| bb0841 | arginine deiminase (arcA) | 49 | 424 | 803 | 570 |
| bb0822 | hypothetical protein | 50 | 23 | 100 | 153 |
| bb0182 | flagellar hook-associated protein 3 (flgL) | 51 | 45 | 1437 | 224 |
| bb0061 | thioredoxin | 52 | 135 | 227 | 103 |
| bb0407 | mannose-6-phosphate isomerase | 53 | 805 | 114 | 493 |
| bb0435 | DNA gyrase, subunit A | 54 | 62 | 6 | 46 |
| bbq89 | hypothetical protein | 55 | 625 | 158 | 127 |
| bb0284 | flagellar hook assembly protein FlgD | 56 | 76 | 129 | 55 |
| bb0440 | ribosomal protein L34 | 57 | 141 | 27 | 40 |
| bb0465 | Organic solvent tolerance protein, OstA | 58 | 54 | 53 | 171 |
| bb0654 | hypothetical protein | 59 | 26 | 1206 | 84 |
| bb0188 | ribosomal protein L20 | 60 | 17 | 96 | 31 |
| bb0365 | lipoprotein LA7 | 61 | 13 | 386 | 35 |
| bbb02 | hypothetical protein | 62 | 1241 | 341 | 377 |
| bb0638 | Na+/H+ antiporter, NhaC-2 | 63 | 130 | 1528 | 435 |
| bb0699 | ribosomal protein L19 | 64 | 50 | 71 | 63 |
| bb0229 | ribosomal protein L31 | 65 | 36 | 60 | 90 |
| bb0698 | tRNA (guanine-N1)-methyltransferase | 66 | 84 | 73 | 36 |
| bb0749 | hypothetical protein | 67 | 190 | 519 | 281 |
| bb0328 | oligopeptide ABC transporter, periplasmic oligopeptide-binding protein, OppA1 | 68 | 34 | 1014 | 88 |
| bb0579 | DNA polymerase III, subunit alpha | 69 | 47 | 1342 | 215 |
| bb0741 | chaperonin, GroES | 70 | 28 | 195 | 110 |
| bb0652 | protein-export membrane protein, SecD | 71 | 67 | 1336 | 266 |
| bb0601 | serine hydroxymethyltransferase | 72 | 41 | 1146 | 211 |
| bb0576 | hypothetical protein | 73 | 43 | 1250 | 258 |
| bb0693 | xylose operon regulatory protein (xylR-1), BadR | 74 | 271 | 390 | 242 |
| bb0379 | protein kinase C1 inhibitor | 75 | 85 | 260 | 27 |
| bbb06 | PTS system, chitobiose-specific IIB component, ChbB | 76 | 150 | 156 | 345 |
| bb0619 | phosphoesterase, RecJ, putative | 77 | 157 | 1192 | 456 |
| bb0385 | basic membrane protein D, BmpD | 78 | 124 | 903 | 97 |
| bba63 | hypothetical protein | 79 | 29 | 619 | 69 |
| bb0588 | 5′-methylthioadenosine/S-adenosylhomocysteine nucleosidase, putative, Pfs-2 | 80 | 55 | 1156 | 427 |
| bb0778 | ribosomal protein L21 | 81 | 264 | 117 | 71 |
| bb0294 | flagellar basal-body rod protein, FlgB | 82 | 40 | 236 | 100 |
| bb0339 | ribosomal protein L13 | 83 | 286 | 55 | 50 |
| bb0577 | hypothetical protein (3′ end is dsrA) | 84 | 42 | 1043 | 209 |
| bb0282 | flagellar protein, FlbD | 85 | 148 | 196 | 126 |
| bb0657 | ribose 5-phosphate isomerase | 86 | 80 | 1463 | 1027 |
| bb0645 | PTS system, glucose-specific IIBC component | 87 | 294 | 453 | 244 |
| bb0557 | phosphocarrier protein HPr | 88 | 180 | 188 | 129 |
| bba07 | chpAI protein | 89 | 1419 | 562 | 1234 |
| bb0269 | minD-related ATP-binding protein, YlxH-1 | 90 | 58 | 220 | 176 |
| bbq88 | hypothetical protein | 91 | 1373 | 548 | 1420 |
| bb0716 | rod shape-determining protein, mreC | 92 | 546 | 555 | 109 |
| bb0492 | ribosomal protein S8 | 93 | 195 | 102 | 207 |
| bb0590 | dimethyladenosine transferase | 94 | 33 | 1309 | 361 |
| bb0321 | hypothetical protein | 95 | 119 | 1053 | 505 |
| bbb05 | PTS system, chitobiose-specific IIA component, ChbA | 96 | 373 | 189 | 1115 |
| bb0715 | rod shape-determining protein, MreB-1 | 97 | 149 | 105 | 78 |
| bbm41 | hypothetical protein | 98 | 770 | 405 | 790 |
| bb0540 | translation elongation factor G | 99 | 159 | 376 | 58 |
| bb0567 | chemotaxis histidine kinase, CheA1 | 100 | 232 | 1380 | 481 |
Transcripts with significantly different expression (fold change <>2; P<.02) in nymphs relative to DMC are indicated in bold.
Transcripts with significantly different expression (fold change <>2; P<.02) in nymphs relative to larvae are indicated in italics.
In order to visualize and compare how Lyme disease spirochetes modulate their transcriptome(s) across all three in vivo conditions and during in vitro growth, we performed hierarchical clustering of the 742 genes that displayed statistically significant expression differences between at least two conditions. As shown in Figure 1B, there is an extraordinary degree of differential gene expression within all four environments. Of the three in vivo conditions, DMC-cultivated spirochetes not only have the greatest number of expressed genes, they also exhibit the greatest overall levels of expression across the genome; these results further underscore the large proportion of the spirochete genome that appears to be devoted to survival during the mammalian phase. By comparison, the transcriptome of B. burgdorferi within larvae is the most disparate, in large part because of the huge swath of genes that are below the level of detection. Interestingly, despite the extensive overlap in nymphal and DMC transcriptomes alluded to above, the heat maps reveal that the two profiles are quite distinct. Of particular importance, all three in vivo transcriptomes not only differ substantially from each other, they also differ markedly from that of spirochetes grown at physiological temperature in BSK II medium. In line with previous studies delineating the RpoS regulon (Caimano et al., 2007), these results are the most compelling evidence to date regarding the limitations of using in vitro-grown spirochetes to study B. burgdorferi gene regulation.
Differential expression of chemotaxis-related genes
Motility, a spirochete hallmark (Charon et al., 2012), is essential for transit of B. burgdorferi between arthropod vector and reservoir host during the enzootic cycle as well as for dissemination and tissue invasion within humans who inadvertently provide blood meals for infected Ixodid ticks. While it is well established that B. burgdorferi contains Orthologs of chemotaxis-related proteins found in other bacteria, little is known about how these signaling molecules act coordinately to modulate motility in vivo. In archetypal eubacteria, such as E. coli, chemotaxis is initiated with the sensing of a chemoattractant by membrane-spanning chemoreceptors called methyl-accepting chemotaxis proteins (MCPs) (Porter et al., 2011). The conformation of an MCP is determined by its methylation state which is mediated by CheR (a methyltransferase) and CheB (a methylesterase). CheA, a histidine kinase, interacts with the chemoreceptor within the cytoplasm, undergoes autophosphorylation, and transfers the phosphoryl group to CheB or the response regulator CheY. CheW interacts with MCPs and CheA, coupling these two proteins to form the core structural unit in the chemotaxis pathway, visualized as arrays comprised of “trimer of dimers” ternary complexes (Briegel et al., 2009). Phosphorylated CheY binds to the flagellar switch protein FliM, promoting a switch in the direction of rotation of the flagellar motor from counterclockwise to clockwise. B. burgdorferi contains five mcp genes (mcp1–5), the products of which have been collectively localized at the cell ends near the flagellar motors (Xu et al., 2011). In contrast to enteric bacteria, which contain only single copies of the components of the chemotaxis machinery, B. burgdorferi harbors genes for two CheAs, two CheRs, two CheBs, three CheYs and three CheWs (Figure 2A). CheX functions in place of CheZ as a CheY-P phosphatase (Charon et al., 2012; Groshong and Blevins, 2014).
Figure 2. Differential expression of components of the chemotaxis machinery.
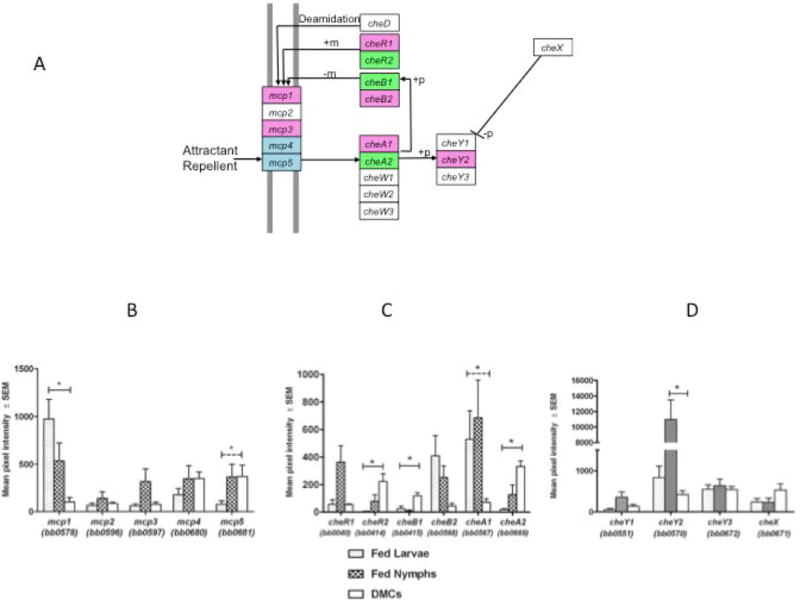
A) Schematic diagram of chemotaxis components based on the KEGG database (http://www.genome.jp/kegg-bin/show_pathway?bbu02030). Methylation (+m), de-methylation (−m), phosphorylation (+p) and de-phosphorylation (−p) events are shown. Colors indicate genes with differential expression: Magenta, elevated in fed nymphs and/or fed larvae relative to DMCs; Green elevated in DMCs relative to fed ticks; Blue, elevated in fed nymphs and DMCs relative to fed larvae. B-D) Transcript levels for MCP genes (B); CheA, CheB and CheR genes (C); CheY and CheX genes (D). Solid bar indicates significant difference in expression between fed ticks and DMCs; dashed bar indicates significant difference in expression between fed larvae and DMCs. *, P<.05.
Spirochetes transmitted by feeding nymphs exhibit dramatically different migratory behavior as compared to spirochetes acquired by feeding larvae. As the nymphal blood meal proceeds, organisms transition from a non-motile to a motile state, enabling them to penetrate the junctions between midgut epithelial cells and the surrounding basement membrane and gain access to the hemocoel and salivary glands (Dunham-Ems et al., 2009). In contrast, spirochetes acquired from the reservoir host during the larval blood meal remain largely associated with the luminal surface of the midgut epithelium (Yang et al., 2004; Zung et al., 1989). Once within the mammal, some Lyme disease spirochetes remain localized at the site of inoculation, displaying a variety of motility states, while others disseminate hematogenously (Harman et al., 2012). One would anticipate that these behaviors require distinct chemotaxis/motility programs that, in addition to sensing of diverse chemotactic stimuli, involve differential expression of components of the chemotaxis apparatus. Indeed, the microarray analyses shown in Figure 2 support this notion, while providing clues as to their interactivities. For example, mcp1 is highly expressed in larvae, whereas mcp4 and mcp5 are preferentially expressed in nymphs and DMCs (Figure 2B), consistent with their known RpoS-dependent co-transcription (Caimano et al., 2007). CheA1 and CheA2 also display markedly divergent expression profiles (Figure 2C). CheA1 is expressed at much higher levels in feeding larvae and nymphs compared to DMCs, suggesting a sensing function within the midguts of feeding ticks, while the expression profile of CheA2, greater in nymphs and DMCs than larvae, suggests a transmission/infectivity-related function. Sze et al. (Sze et al., 2012) concluded from comparative immunoblot analyses that CheA2 is constitutively expressed during the enzootic cycle; our results for CheA2 demonstrate a more nuanced profile with expression fluctuating as the spirochete progresses through the enzootic cycle. Pairing of specific CheBs and CheRs with CheAs is suggested by the finding that the expression profiles of CheB2 and CheR1 roughly correspond to that of CheA1, while those of CheB1 and CheR2 roughly parallel that of CheA2 (Figure 2C). Lastly, in contrast to CheY3, which is expressed at similar levels in fed ticks and mammals, CheY2 is induced in transmitting nymphs (Figure 2D). It is tempting to speculate that the interactions between CheY2 and the flagellar switch protein are involved in regulating at the level of the motor the transition between dimorphic motility states observed when spirochetes disseminate within feeding nymphs (Dunham-Ems et al., 2009).
Elegant mutational studies, in concert with genomics, have helped to clarify the functional roles and interactivities of B. burgdorferi chemotaxis components (Li et al., 2002; Goldstein et al., 2010; Motaleb et al., 2011; Zhang et al., 2012; Sze et al., 2012; Groshong and Blevins, 2014; Charon et al., 2012). Mutants lacking CheA2, CheW1, CheW3 or CheY3 display altered swimming behaviors and chemotactic responses in vitro; CheA2 mutants survive in ticks but are unable to establish mammalian infection by either tick or needle inoculation. By contrast, neither motility nor chemotaxis was altered appreciably in spirochetes deficient in CheA1, CheW2, CheY1, or CheY2. In co-immunoprecipitation experiments, CheW1 and CheW3 were found to interact with CheA2, while CheW2 bound only CheA1 (Zhang et al., 2012). The genes encoding CheA2, CheW3, CheX, and CheY3 are encoded in a single operon, whereas those for CheW2, CheA1, CheB2 and CheY2 are part of a separate operon located elsewhere on the chromosome. Taken together, these findings have led to the proposal that B. burgdorferi possesses two distinct chemosensory pathways, one (CheA2-CheW3-CheX-CheY3) which functions under standard laboratory conditions and during mammalian infection and the other (CheW2-CheA1-CheB2-CheY2) presumably mediates chemotaxis within the tick (Sze et al., 2012). The in vivo expression data presented here are generally in line with this two-pathway hypothesis, although intimating as well, that it appears to be an oversimplification. Most notably, they reveal that the specific subunits comprising the MCP/CheA/CheW ternary complex change markedly as spirochetes transit between vector and mammal. Undoubtedly, such dynamic, compositional changes endow B. burgdorferi with the capacity to sense the multitude of environmental signals it must respond to in order to complete its enzootic cycle.
Expression profile of RpoS-dependent genes and regulators of RpoS expression
As noted earlier, previous studies have led us to propose that RpoS-dependent gene expression commences during the nymphal blood meal, continues during infection of the mammalian host, and turns off during larval acquisition (Caimano et al., 2007; Mulay et al., 2009; Dunham-Ems et al., 2012; Radolf et al., 2012). Microarray analysis across the enzootic cycle supported these proposed ON and OFF states of the RpoS regulon while providing novel insights into how the contours of the regulon change as spirochetes progress from nymph to mammal and back to the vector. The rpoS gene followed the predicted pattern (Caimano et al., 2007), with expression in fed nymphs and DMCs and little to no expression in fed larvae (Table S1). Of the 104 genes whose transcription was defined as RpoS-dependent in a previously published analysis of DMC-cultivated spirochetes (Caimano et al., 2007), 93 were expressed by DMC-cultivated spirochetes herein (Table 3). In contrast, expression of only 47 of 104 was detected in spirochetes in engorged nymphs. As expected, only a relative handful (i.e., 18) of the 104 genes within the DMC-defined RpoS regulon were detected in spirochetes transiting in the opposite direction, that is, being acquired by feeding larvae. These include only three genes with an annotated function — mcp1 (bb0578), recB (bb0633) and cdr (bb0728) (Table 3); by analogy to cdr, whose transcription is only partially RpoS-dependent (Caimano et al., 2007; Eggers et al., 2011), it is possible that these 18 genes also can be transcribed from a canonical sigma-70 promoter. We also performed hierarchical clustering to further delineate in vivo and in vitro changes in our previously identified cohort of RpoS-induced genes (Caimano et al., 2007). Figure 3 reveals the relatively intense level of expression of these genes in DMCs as compared to the more nuanced levels of expression within nymphs and their generally OFF state within larvae. The in vitro regulon appears to be more or less a composite of the nymphal and larval regulons with several large clusters of OFF genes, as in larvae, and few genes expressed at the same levels as in DMCs. As a whole, these results point to progressive fine-tuning and recruitment of genes within the “umbrella” of the Rrp2/RpoN/RpoS pathway as transmission progresses and spirochetes establish themselves within the mammal. Per above, they further illustrate the importance of mammalian host-derived environmental cues as drivers of B. burgdorferi gene expression.
Table 3.
Expression of RpoS-induced genesa in fed ticks and DMCs.
| Gene Name | Description | Fed Larvaeb | Fed Nymph | DMC |
|---|---|---|---|---|
| bb0116 | PTS system, maltose and glucose-specific IIABC component, MalX | − | + | − |
| bb0363 | cyclic-di-GMP phosphodiesterase, PdeA | − | − | − |
| bb0384 | basic membrane protein C, BmpC | − | + | + |
| bb0400 | hypothetical protein | − | − | + |
| bb0447 | Na+/H+ antiporter, NapA | − | − | + |
| bb0467 | Multicopper polyphenol oxidase (laccase), putative | − | + | + |
| bb0548 | DNA polymerase I, PolA | − | + | + |
| bb0563 | hypothetical protein | − | + | + |
| bb0565 | purine-binding chemotaxis protein, CheW-2 | − | + | + |
| bb0566 | hypothetical protein | − | + | + |
| bb0578 | methyl-accepting chemotaxis protein, Mcp-1 | + | + | − |
| bb0633 | exodeoxyribonuclease V, beta chain, RecB | + | + | − |
| bb0680 | methyl-accepting chemotaxis protein, Mcp-4 | − | + | + |
| bb0681 | methyl-accepting chemotaxis protein, Mcp-5 | − | + | + |
| bb0689 | hypothetical protein | − | + | + |
| bb0728 | CoA disulfide reductase | + | + | + |
| bb0771 | RNA polymerase sigma factor, RpoS | − | − | + |
| bb0812 | pantothenate metabolism flavoprotein, Dfp | − | − | + |
| bb0834 | ATP-dependent Clp protease, subunit C, ClpC | − | − | − |
| bb0844 | hypothetical protein | − | + | + |
| bba01 | conserved hypothetical protein | − | + | + |
| bba04 | antigen, S2 | − | + | + |
| bba05 | antigen, S1 | − | + | − |
| bba07 | ChpAI protein, putative | − | + | + |
| bba09 | conserved hypothetical protein | − | + | − |
| bba24 | decorin binding protein A, DbpA | − | + | + |
| bba25 | decorin binding protein B, DbpB | − | + | + |
| bba26 | hypothetical protein | − | + | + |
| bba32 | hypothetical protein | − | − | + |
| bba33 | hypothetical protein | − | − | + |
| bba34 | oligopeptide ABC transporter, periplasmic oligopeptide-binding protein, OppAV | − | − | + |
| bba36 | lipoprotein | − | − | + |
| bba37 | hypothetical protein | − | + | + |
| bba57 | lipoprotein, trigger of murine arthritis | − | − | + |
| bba64 | antigen, P35 | − | + | + |
| bba65 | hypothetical protein | − | − | + |
| bba66 | antigen, P35, putative | − | − | + |
| bba71 | hypothetical protein | − | + | + |
| bba72 | hypothetical protein | − | + | + |
| bba73 | antigen, P35, putative | − | + | + |
| bbb09 | hypothetical protein | − | + | + |
| bbb14 | hypothetical protein | + | + | + |
| bbb19 | outer surface protein C, OspC | − | + | + |
| bbd01 | conserved hypothetical protein | − | − | + |
| bbd19 | hypothetical protein | − | − | + |
| bbg03 | conserved hypothetical protein, authentic frameshift | − | + | + |
| bbg05 | transposase-like protein, authentic frameshift | − | − | + |
| bbg10 | hypothetical protein | − | + | + |
| bbg11 | hypothetical protein | − | − | + |
| bbg12 | hypothetical protein | − | − | + |
| bbg13 | hypothetical protein | − | − | + |
| bbg14 | hypothetical protein | + | + | + |
| bbg16 | hypothetical protein | + | + | + |
| bbg17 | hypothetical protein | − | − | + |
| bbg18 | hypothetical protein | + | + | + |
| bbg19 | hypothetical protein | − | − | + |
| bbg20 | hypothetical protein | + | − | + |
| bbg21 | hypothetical protein | − | − | + |
| bbg23 | hypothetical protein | + | − | + |
| bbg24 | hypothetical protein | + | − | + |
| bbg26 | hypothetical protein | − | − | + |
| bbg30 | hypothetical protein | − | − | + |
| bbh10 | hypothetical protein | − | + | + |
| bbi31 | conserved hypothetical protein, pseudogene | − | − | − |
| bbi42 | outer membrane protein, putative | − | − | + |
| bbi43 | conserved hypothetical protein | − | + | + |
| bbj23 | hypothetical protein | − | − | + |
| bbj24 | hypothetical protein | − | − | + |
| bbj27 | hypothetical protein | − | − | + |
| bbj28 | hypothetical protein | − | − | + |
| bbk02 | hypothetical protein | − | + | − |
| bbk52.1 | conserved hypothetical protein, pseudogene | − | + | + |
| bbk54 | conserved hypothetical protein | + | − | + |
| bbl01 | hypothetical protein | − | − | + |
| bbl02 | hypothetical protein | + | + | + |
| bbl03 | hypothetical protein | − | + | + |
| bbl04 | hypothetical protein | + | + | + |
| bbl29 | conserved hypothetical protein | + | + | + |
| bbl36 | conserved hypothetical protein | − | + | + |
| bbm01 | hypothetical protein | − | − | + |
| bbm02 | hypothetical protein | − | − | + |
| bbn01 | hypothetical protein | − | − | + |
| bbo01 | hypothetical protein | − | − | − |
| bbo02 | hypothetical protein | − | − | + |
| bbo03 | hypothetical protein | − | − | + |
| bbo04 | hypothetical protein | − | + | + |
| bbo06 | conserved hypothetical protein | − | − | + |
| bbo25 | conserved hypothetical protein | − | − | + |
| bbo26 | conserved hypothetical protein | − | − | + |
| bbp01 | hypothetical protein | + | + | + |
| bbp27 | rev protein, Rev | − | − | + |
| bbp29 | conserved hypothetical protein | − | − | + |
| bbq02 | hypothetical protein | − | − | + |
| bbq06 | conserved hypothetical protein | + | − | + |
| bbq43 | conserved hypothetical protein | + | + | + |
| bbq44 | conserved hypothetical protein | − | − | + |
| bbq58 | hypothetical protein | − | − | + |
| bbq64 | hypothetical protein | − | − | + |
| bbq65 | conserved hypothetical protein, pseudogene | − | − | − |
| bbr01 | hypothetical protein | − | − | + |
| bbr02 | hypothetical protein, paralogous family 147, authentic frameshift | − | − | + |
| bbs01 | hypothetical protein | − | − | + |
| bbs03 | hypothetical protein | − | − | + |
| bbu09 | conserved hypothetical protein | + | − | + |
Based on Caimano et al. (Caimano et al., 2007).
−, transcript not detected; +, transcript detected.
Figure 3. Regulation of RpoS-dependent genes.
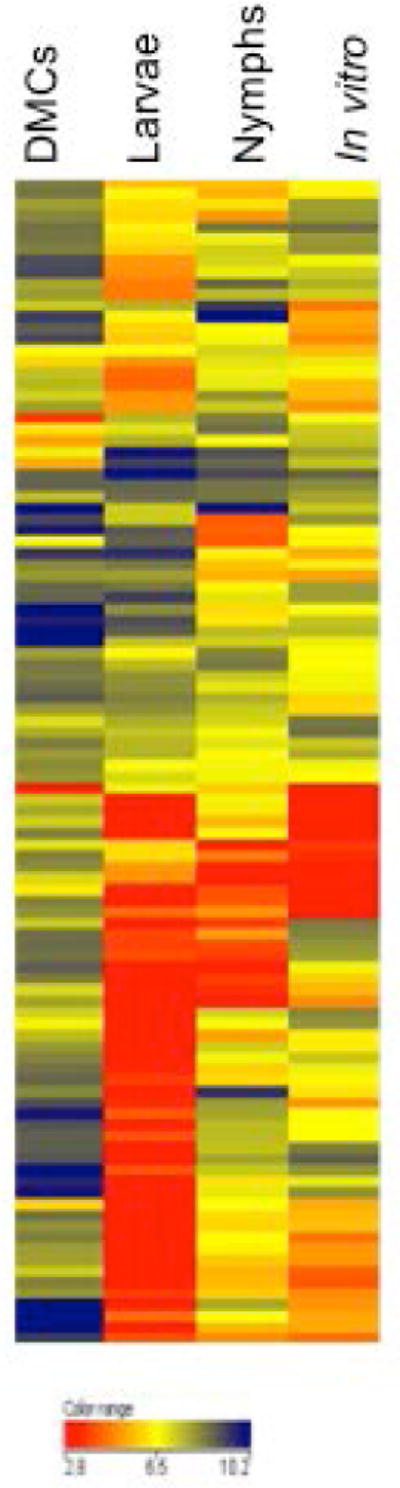
Hierarchical clustering of microarray data for expression of 104 RpoS-dependent genes (Caimano et al., 2007) in fed ticks and in spirochetes cultivated in DMCs or in vitro at 37°C.
The B. burgdorferi Fur ortholog, BosR (BB0647), originally was described as a zinc-dependent transcriptional activator of B. burgdorferi oxidative stress genes (Boylan et al., 2003; Katona et al., 2004). Subsequently two groups reported that its DNA-binding activity also is essential for RpoN-mediated transcription of RpoS and infectivity of spirochetes delivered by needle inoculation (Hyde et al., 2009; Ouyang et al., 2009; Ouyang et al., 2011). Thus, the expression profile of bosR in this microarray study presented a rather provocative sidelight to the above analysis of the RpoS regulon. Unexpectedly, bosR was better expressed in in both tick phases than in DMCs (Table 1). These results imply that the requirement of BosR for transcription of rpoS is variable and, paradoxically, appears to be lower during the mammalian phase when RpoS-dependent gene expression is greater. In larvae, BosR would have to function as a transcriptional regulator independent of its activity at the RpoS promoter, a notion supported by the identification of numerous putative BosR binding sites throughout the B. burgdorferi genome (Ouyang et al., 2009; Ouyang et al., 2011). Li and coworkers recently proposed that BosR acts as a repressor for ospA by direct binding at the ospA promoter (Wang et al., 2013). Our finding that transcripts for bosR are relatively well expressed in feeding larvae, when ospA expression is no longer subject to mammalian phase repression seems discordant with this idea, although BosR levels may be subject to post-transcriptional regulation (Hyde et al., 2007).
B. burgdorferi utilizes the AckA-Pta pathway to synthesize acetyl-CoA, a process designated acetate activation (Wolfe, 2005; Xu et al., 2010; Wolfe, 2010), as the spirochete does not appear to encode other acetyl-CoA biosynthetic pathways (Fraser et al., 1997; Gherardini et al., 2010). Acetate can diffuse into cells (Wolfe, 2005; Xu et al., 2010) or may enter via a dedicated transporter (Raju et al., 2011; Van Laar et al., 2012). Transcription of ackA and pta is quite low and occurs at essentially equivalent levels in both fed ticks and DMCs (Table 1) As noted earlier, acetyl phosphate, the intermediate in this pathway, is a phosphoryl donor for Rrp2. Thus, the enhanced expression of RpoS in DMCs occurs without increases in either bosR, ackA or pta transcript. The apparent disconnect between transcript levels for rpoS and those for its upstream regulatory effectors could be explained by complex post-transcriptional modulation of RpoS (Samuels, 2011). Clearly, the transcription data reveal a more intricate and complex regulatory network for RpoS-dependent gene expression than was appreciated previously.
Transcriptional variation of genes involved in cell envelope biogenesis
Lipoproteins
B. burgdorferi continuously modulates the expression of its extensive lipoprotein repertoire in order to adapt its physiology and cell surface to the dynamic, hostile milieus it encounters as it transits between arthropod vector and mammalian reservoir (Bergstrom and Zuckert, 2010; Skare et al., 2010; Samuels, 2011; Radolf et al., 2012; Groshong and Blevins, 2014; Kenedy et al., 2012). The microarray analyses performed herein enabled us to assess the transcriptional changes this entire cohort of membrane-tethered polypeptides undergoes throughout the enzootic cycle. Several earlier genomic analyses predicted between 105–140 lipoproteins in B. burgdorferi B31(Fraser et al., 1997; Casjens et al., 2000; Setubal et al., 2006). Using the bioinformatic approach outlined in Experimental Procedures, we generated our own “consensus” list of 131 known or putative lipoprotein-encoding genes for expression profiling (Table S9). The hierarchical clustering presented in figure 4 reveals that the spirochete’s presumptive lipoproteome is highly variable with respect to both the levels of individual transcripts and the overall expression patterns across the four environmental conditions tested. The obvious disparity between in vitro and in vivo lipoprotein gene expression profiles underscores that in vitro-cultivated spirochetes exhibit only a limited facsimile of the spirochetal surface during any phase within nature. Figure 5 presents transcript levels for selected differentially expressed lipoproteins. In addition to previously characterized lipoproteins (e.g. BBA15/16, BBA24/25, BBA62, BBH06), expression patterns for some lipoproteins not previously reported to be differentially expressed also are shown. Complete expression data for all 131 lipoproteins are provided in Table S9, while a number of individual lipoprotein genes are discussed in later sections.
Figure 4. Differential Expression of Lipoprotein Genes.
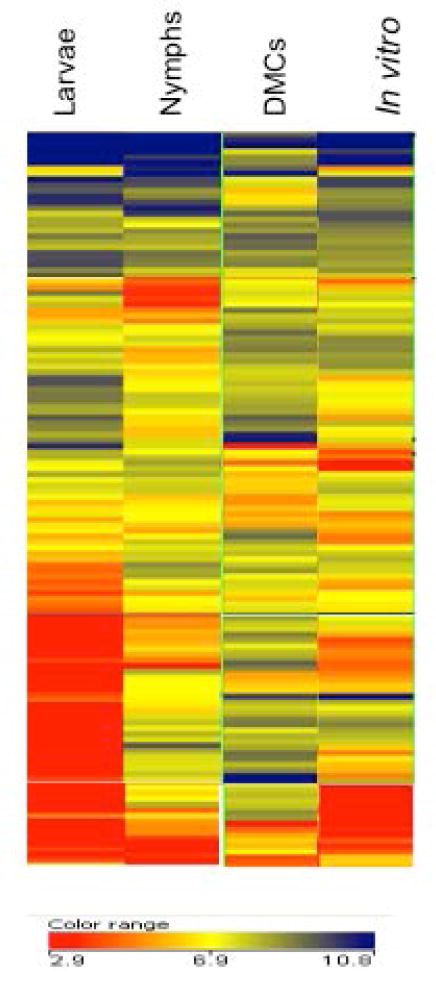
Hierarchical clustering of microarray data for 131 lipoprotein genes in fed ticks and cells cultivated in DMCs or in vitro at 37°C.
Figure 5. Transcript levels for selected lipoprotein genes.
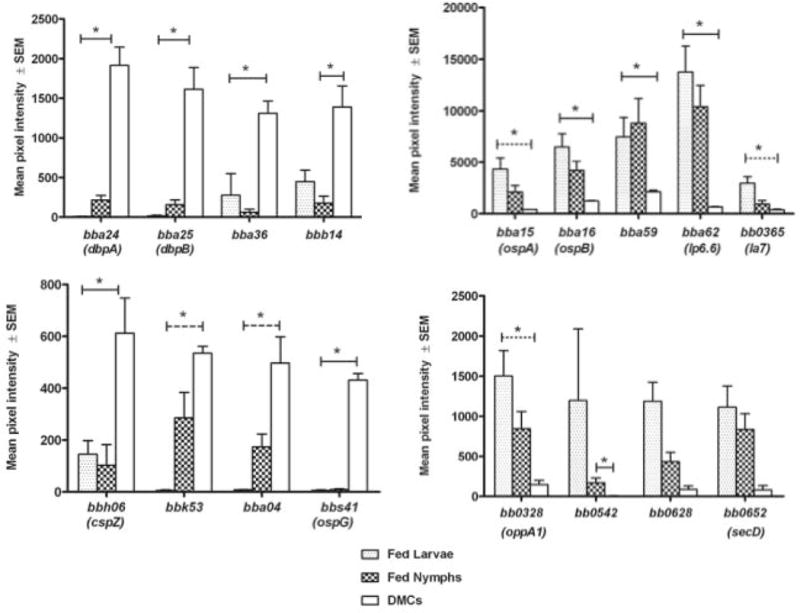
Expression levels are given as mean pixel intensities under the indicated growth conditions. Left panels, lipoprotein genes with greater expression in DMCs relative to fed ticks; right panels, lipoprotein genes with elevated transcription in fed larvae or nymphs relative to DMCs. Solid line indicates significant differences in transcript levels between both fed tick conditions and DMCs or fed nymph and DMC. Dashed line indicates significant difference only between fed larvae and DMC. Asterisk indicates P<0.05.
Glycerophospholipid biosynthesis
B. burgdorferi contains a three gene operon (glp operon) that encodes for a glycerol uptake facilitator (glpF), glycerol kinase (glpK) and glycerol 3-phosphate dehydrogenase (glpD) (Fraser et al., 1997). glp gene expression is repressed in DMC-cultivated spirochetes and infected mouse tissue and this repression is dependent on RpoS (Caimano et al., 2007; Pappas et al., 2011). The operon also is positively regulated by Rrp1/c-di-GMP (Rogers et al., 2009; He et al., 2011; Sze et al., 2013) and the inability of an rrp1 mutant to survive in feeding ticks could be partially complemented by constitutive expression of the glp operon (He et al., 2011). Consistent with previous studies, expression of glpF and glpK was elevated in fed ticks relative to levels in DMC-cultivated spirochetes (10.2 fold and 6.7 fold for glpF and 2.7 fold and 4.4 fold for glpK in nymphs and larvae, respectively) (Figure 6). After facilitated uptake via GlpF, glycerol is converted to glycerol 3-phosphate (G3P) by the action of GlpK. G3P has two potential fates; one is diversion to glycolysis by the combined action of GlpD and triose phosphate isomerase. Interestingly, GlpD mutants can complete the mammal-tick-mammal infectious cycle, but have a fitness defect in feeding nymphs that results in delayed spirochete replication and a lower spirochete load (Pappas et al., 2011). This suggests that glycerol is an important nutrient source for the spirochete during the tick phase of the enzootic cycle, but other carbohydrates must be available to support B. burgdorferi survival. This aspect of glycerol metabolism is discussed in greater detail in a later section.
Figure 6. Glycerophospholipid synthesis pathway is induced in fed ticks.
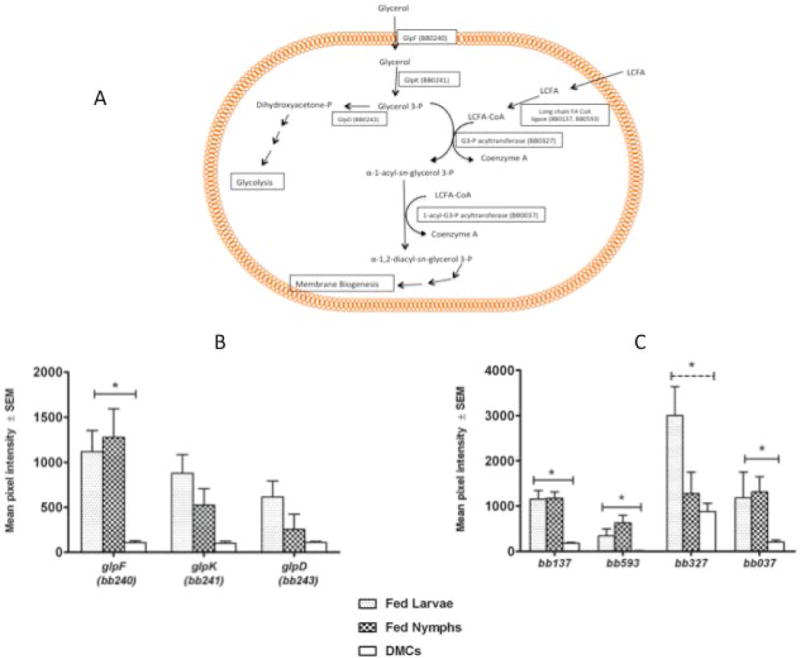
A) Schematic diagram of glycerophospholipid pathway in B. burgdorferi; LCFA, long chain fatty acid. B) Transcript levels for genes encoding components of the glycerophospholipid pathway. Solid line indicates significant differences in transcript levels between both fed tick conditions and DMCs. Dashed line indicates significant difference only between fed larvae and DMCs. Asterisk indicates P<0.05.
Alternatively, G3P can be coupled with fatty acyl CoA (FA CoA) in two acyltransferase reactions to yield phosphatidic acid (figure 6). B. burgdorferi encodes all the enzymes necessary for production of phosphatidic acid; fatty acyl CoA ligase (BB0137, BB0593), G3P acyltransferase (BB0327) and 1-acyl-G3P acyltransferase (BB0037) (Fraser et al., 1997). Cox and Radolf have shown that fatty acids can insert into the B. burgdorferi outer membrane (Cox and Radolf, 2001) and could presumably be converted to long chain fatty acyl CoA by the ligases (either BB0137 or BB0593). The successive addition of long chain fatty acids to the G3P backbone by the acyltransferases (BB0327 and BB0037) would yield phosphatidic acid that would be utilized for membrane lipid biosynthesis (Gherardini et al., 2010). As shown in figure 6C, transcript levels for the fatty acyl CoA ligases and the acyltransferases are all higher in fed ticks than in DMCs. The upregulation of the pathway leading from G3P to phosphatidic acid suggests a second important role for glycerol uptake. B. burgdorferi experiences a replicative burst in the feeding nymph midgut during which the spirochete levels increase exponentially over a 2–3 day period (Piesman et al., 2001; Pappas et al., 2011). This rapid growth would require extensive new membrane synthesis. The signals that might control the flux of G3P to either glycolysis or membrane biogenesis are currently not known, but could be governed by the relative availability of other carbohydrates to drive ATP production via glycolysis (Monahan et al., 2014)(see below) and the relative demand for new membrane biogenesis.
Isoprenoid biosynthesis
Isoprenoids, a class of natural products composed of repeating isopentenyl pyrophosphate (IPP) units, are ubiquitous in nature (Lange et al., 2000). Among the important isoprenoids in bacteria is undecaprenol, the lipid carrier for newly synthesized peptidoglycan monomers (White, 1996). Two pathways for IPP biosynthesis exist in bacteria. The first, employed by the vast majority of prokaryotes, is based on condensation of glyceraldehyde 3-phosphate and pyruvate. The alternate route to IPP is the classic mevalonate pathway that is found in most eukaryotes and archaea (Lange et al., 2000); most Gram-positive cocci employ this pathway for isoprenoid biosynthesis (Lange et al., 2000; Wilding et al., 2000). B. burgdorferi contains a gene cluster (BB0683-BB0688) that encodes all of the enzymes in the mevalonate pathway (Figure 7) (Fraser et al., 1997; Van Laar et al., 2012). It is presumed that this pathway in B. burgdorferi is required for cell wall biogenesis. However, this assumption has not been confirmed experimentally as no mutants in the pathway have been described, although B. burgdorferi growth in vitro is impaired by addition of statins to the culture medium (Van Laar et al., 2012).
Figure 7. Expression of mevalonate pathway genes in fed ticks and DMCs.
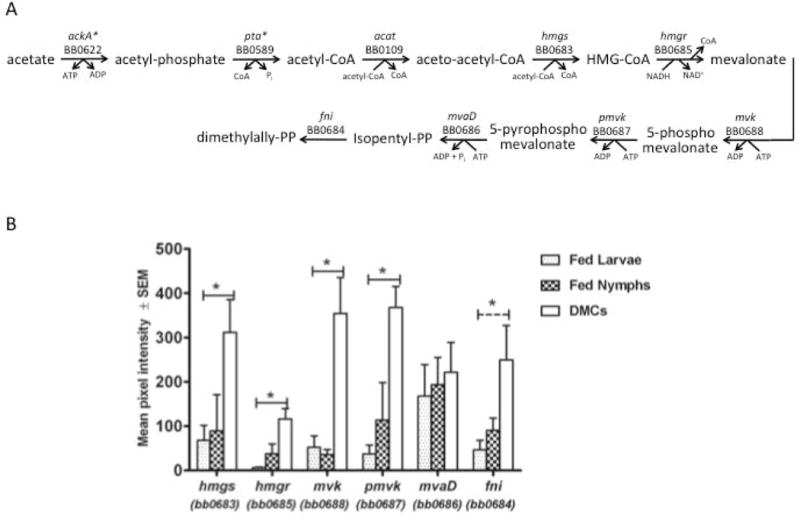
A) Mevalonate pathway in B. burgdorferi. B) Transcript levels for mevalonate pathway genes. Solid line indicates significant differences in transcript levels between both fed tick conditions and DMCs. Dashed line indicates significant difference only between fed larvae and DMC. Asterisk indicates P<0.05.
Expression of all the genes in the mevalonate pathway is induced in DMCs relative to either fed tick state (Figure 7). In addition, expression of the genes encoding enzymes that would catalyze the conversion of IPP to lipid I and lipid II (BB0120 [undecanyl-PP synthase], BB0258 [undecaprenyl-diphosphatase], BB0303 [phospho-MurNAc-pentapeptide transferase], BB0767 [MurG]) is either unchanged or elevated in DMCs (data not shown). The data suggest that B. burgdorferi cell wall biogenesis is induced under mammalian host-like conditions. Van Laar et al. (Van Laar et al., 2012) were unable to detect co-transcription of any of the contiguous genes in the gene cluster and concluded that each gene is transcribed from an independent promoter. Further, these investigators reported that HMG-CoA reductase protein is induced in vitro under so-called “fed tick” conditions, whereas several other proteins of the pathway are elevated during in vitro growth in “unfed tick” conditions (Van Laar et al., 2012). Our data indicating that all genes in this cluster are differentially expressed in a similar manner in fed ticks and DMCs would be more consistent with the cluster functioning as an operon with similar modes of regulation for all genes in the cluster.
The first step in the mevalonate pathway is formation of HMG-CoA from acetyl-CoA and acetoacetyl-CoA. As described earlier, B. burgdorferi utilizes the AckA-Pta pathway to synthesize acetyl-CoA (Gherardini et al., 2010; Xu et al., 2010; Van Laar et al., 2012). It is, therefore, of interest that, contrary to the mevalonate pathway, transcript levels for ackA and pta are not elevated in DMCs (Table 1). As already noted, acetyl phosphate, an intermediate in the AckA-Pta pathway, is a phosphoryl donor for Rrp2 and activates the RpoS regulon (Xu et al., 2010). Supplementation of culture medium with sodium acetate resulted in induction of mevalonate pathway enzymes, as well as RpoS (Xu et al., 2010; Van Laar et al., 2012), suggesting that variation in levels of extracellular acetate could play a role in adjusting acetyl-CoA and acetyl phosphate levels, thereby modulating both RpoS activity and peptidoglycan biosynthesis.
Transporters
ATP-binding cassette (ABC) transporters
ABC transporters utilize ATP to import a variety of solutes across the cytoplasmic membrane (Higgins, 1992; Davidson et al., 2008). B. burgdorferi contains annotated ABC transporters for glycine betaine/proline (BB0144–46), phosphate (BB0215–18), oligopeptides (BB0328–30, BB0332–35, BB0746–47, BBA34, BBB16), spermidine/putrescine (BB0639–642) and ribose/galactose (BB0677–79). It has been suggested that this latter complex is related to MglAC1C2 and is instead responsible for glucose uptake (von Lackum and Stevenson, 2005;(Gherardini et al., 2010). In B. burgdorferi, the transporter constituents that bind specific substrates within the periplasm and furnish them to their cognate permeases are lipoproteins, emphasizing that lipid modification of a protein does not necessarily indicate that it is destined for export to the spirochetal surface. Below, we focus on two ABC transporter complexes that display substantial expression differences in fed ticks and DMCs.
B. burgdorferi has been reported to be a spermidine auxotroph (Wyss and Emert, 1996); the putative polyamine (pot) transporter encoded by bb0639–642 could provide this nutrient. E. coli mutants that lack polyamines are viable (Tabor and Tabor, 1985), but exhibit attenuated growth rates, protein synthesis, maintenance of membrane and cell wall integrity, and DNA replication fork movement (Tabor and Tabor, 1985). More recent studies indicate that polyamines also enhance response to oxidative stress (Shah and Swiatlo, 2008; Chattopadhyay et al., 2003). Figure 8A shows that expression of the pot operon is dramatically elevated during both larval and nymphal feeding as compared to growth in DMCs. One can speculate that B. burgdorferi requires increased levels of polyamines to attain the replicative bursts characteristic of larval and nymphal feeding (Piesman et al., 1990; De Silva and Fikrig, 1995; Soares et al., 2006; Dunham-Ems et al., 2009), as well as to cope with noxious reactive oxygen products generated within the tick midgut during the blood meal (Li et al., 2007; Boylan et al., 2008).
Figure 8. Differential expression of selected ABC transporter genes.
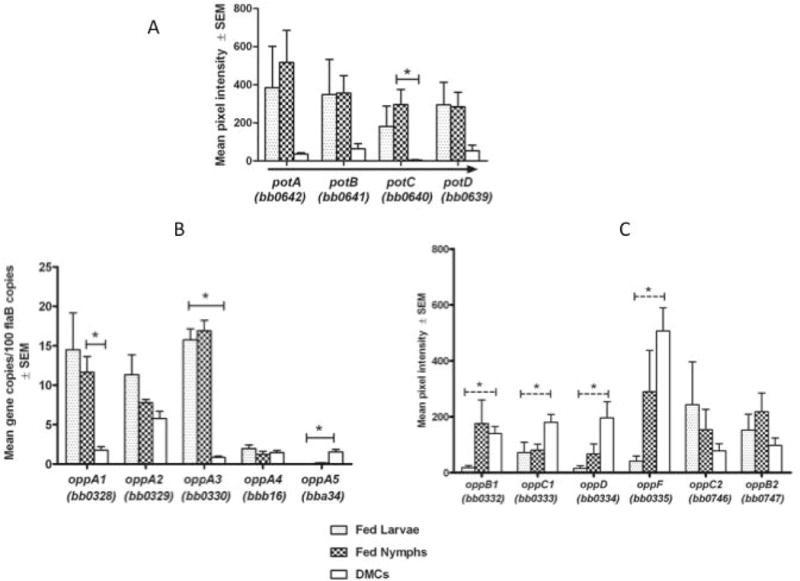
A) Transcript levels for the spermidine/putrescine operon. Arrow shows direction of transcription. Asterisk indicates significant difference between nymph and DMC, p<.002. B, C) Expression levels for genes encoding OppA (B) and permease and ATP-binding (C) components of the oligopeptide transporter. Expression data for oppA genes is based on qRT-PCR data (Table 1). Solid line indicates significant differences in transcript levels between both fed tick conditions and DMCs or fed nymph and DMCs. Dashed line indicates significant difference only between fed larvae and DMCs. Asterisk indicates P<0.05.
B. burgdorferi does not encode any pathways for amino acid biosynthesis and apparently does not have uptake systems for single amino acids other than glycine/proline (Fraser et al., 1997; Gherardini et al., 2010) and perhaps cysteine (BB0729) (Eggers et al., 2011). Instead, it appears to rely on an eleven gene oligopeptide uptake system to satisfy most of its requirements for amino acids (Bono et al., 1998; Wang et al., 2004b; Wang et al., 2002; Medrano et al., 2007). Encoded on the chromosome are two permease heterodimers (OppB1 [BB0332]/OppC1 [BB0333] and OppB2 [BB0747]/OppC2 [BB0746]) and two ATP-binding proteins OppD (BB0334) and OppF (BB0335). The system also contains five distinct oligopeptide-binding lipoproteins (OppA1-OppA5). The genes encoding OppA1-A3 (bb0328, bb0329, bb0330) are immediately upstream of oppB1 and oppC1, while those for OppA4 (bbb16) and OppA5 (bba34) are located on cp26 and lp54, respectively. Although not well understood, it is assumed that differential expression of opp genes, along with combinatorial interactions among the components, confers sufficient flexibility in oligopeptide uptake to meet the bacterium’s needs in any host environment. Consistent with this notion are data in Figure 8B and Table 1 showing that expression of the five oppA genes varies substantially. oppA1 and oppA3 are the most abundantly expressed in fed ticks, with levels of expression 6.5–19 fold greater than in DMC-cultivated spirochetes, whereas oppA5 transcripts are significantly greater in DMCs than in fed ticks (Figure 8B), albeit at quite low levels compared to the other two. In contrast, transcript levels for oppA2 and oppA4 varied little between the three in vivo conditions. These findings are consistent with earlier observations that each of the five oppA genes could be transcribed individually from their own promoters (Bono et al., 1998; Wang et al., 2002). Of note, of the five oppA genes, only oppA5 is RpoS-dependent (Caimano et al., 2007; Medrano et al., 2007). Presumably, the substrate bound by this protein is unique and either required or available exclusively during the RpoS “ON” phases of the enzootic cycle, particularly within the mammal.
The oligopeptide transporter permease and ATP binding components are also differentially expressed (Figure 8C). Transcripts for the permease heterodimer OppB1/C1 (BB0332/333) are elevated in DMCs relative to fed larvae, whereas expression of OppB2/C2 (BB0746/747) were greater in fed ticks. Interestingly, transcript levels for the ATP binding subunits (BB0334–335) were higher in DMC-cultivated spirochetes than in fed ticks. Thus, in addition to being subject to complex regulation, the data as a whole, indicate that the subunit composition of the transporter changes considerably throughout the enzootic cycle in order to meet the spirochete’s amino acids requirements. A cell signaling role for the Opp transporter also might be envisioned, as originally proposed by Bono et al. (Bono et al., 1998).
Phosphoenolpyruvate (PEP)-dependent phosphotransferase systems (PTS)
PEP-PTS are ubiquitous and highly conserved among bacteria (Barabote and Saier, 2005). PTS couple permease-specific importation of a carbohydrate substrate with its phosphorylation via a cascade in which the phosphoryl group is derived from PEP (Gorke and Stulke, 2008; Deutscher et al., 2014). PTS are composed of a number of proteins referred to as enzyme I (EI), enzyme II (EII) and histidine phospocarrier protein (HPr). EII components are typically composed of two cytoplasmic domains (EIIA, EIIB) and a transmembrane domain (EIIC). These domains can be located on a single polypeptide or separate protein molecules (Clore and Venditti, 2013). The phosphorelay begins with PEP transferring its phosphoryl group to EI which, in turn, transfers it to HPr, the phosphoryl donor for EIIA. Ultimately, the phosphate is transferred to the incoming sugar concomitant with its importation across the cytoplasmic membrane by EIIC (Gorke and Stulke, 2008; Clore and Venditti, 2013). The carbohydrate specificity of a PTS is defined by the EII components (Barabote and Saier, 2005; Clore and Venditti, 2013).
B. burgdorferi encodes all the components of a complete PTS machinery (Fraser et al., 1997). These include EI (BB0558), two genes annotated as HPr (BB0557, BB0448) and carbohydrate-specific EII components for uptake of glucose, N-acetylglucosamine (GlcNAc), mannose, maltose, trehalose and chitobiose (Figure 9A). By homology, BB0559 (EIIA) and BB0645 (EIIBC) are annotated as glucose-specific, whereas BB0116 and BBB29 (EIIABC) are annotated as maltose- and glucose-specific (Fraser et al., 1997). Presumably, GlcNAc can also be transported into the cell via these EII components. BB0408 and BB0629 initially were annotated as fructose-specific (Fraser et al., 1997), but fructose does not support B. burgdorferi growth in vitro (von Lackum and Stevenson, 2005; Gherardini et al., 2010). As a result, these EII components now are presumed to be mannose-specific (von Lackum and Stevenson, 2005; Gherardini et al., 2010). The chitobiose-specific PTS is encoded on plasmid cp26 (Fraser et al., 1997). It is important to note, however, that, with the exception of chitobiose (Tilly et al., 2001; Tilly et al., 2004; Rhodes et al., 2010), the substrate specificities of these components have not yet been confirmed by direct biochemical or genetic studies.
Figure 9. Expression of phosphoenolpyruvate phosphotransferase system (PEP-PTS) genes.
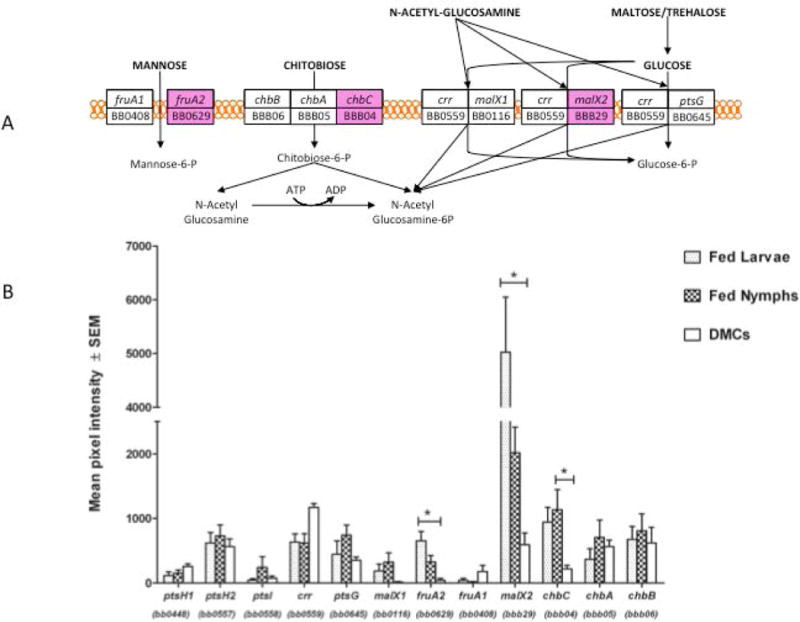
A) Schematic diagram of PEP-PTS systems in B. burgdorferi. Figure is adapted from Von Lackum and Stevenson (von Lackum and Stevenson, 2005). Genes colored magenta indicate those with elevated expression in fed ticks relative to DMCs. B) Transcript levels for PTS components. Asterisk indicates significant difference between both fed larvae and fed nymph relative to expression in DMC (in all cases, p<0.01).
Expression data for these PTS components are presented in Figure 9. HPr-2 (PtsH-2), EI and glucose-specific EIIA are located adjacently on the chromosome and in the same orientation (BB0557–0559); interestingly, while BB0557 and BB0559 are well expressed, only minimal expression was detected for BB0558, suggesting that there may be individual (or additional) promoter elements for BB0557 and BB0559. In general, the glucose-specific EII components (BB0559, BB0645 and BBB29) are expressed at relatively high levels and are among the most abundant B. burgdorferi transcripts (Table 2). It is noteworthy that BBB29 (maltose/glucose-specific EIIABC) is induced 8-fold and 3.4 fold in fed larvae or fed nymphs relative to DMCs (P<.0001 and P=.004, respectively) (Figure 9B), a finding confirmed by qRT-PCR (Table 1). The putative mannose-specific EIIABC (BB0629) also is induced in feeding ticks (23-fold [P=0.0003] in fed larvae; 10-fold [P=.01] in fed nymphs) relative to DMCs. Glucose should be abundantly available in a mammalian environment and during the early stages of the blood meal, while competition with midgut epithelial cells might limit its availability towards the end of the blood meal. The elevated expression of BB0559 and BB0645 during all in vivo stages suggests that they comprise the “constitutive” PTS for glucose uptake. Diminished glucose availability may signal the spirochete to induce expression of BBB29 and BB0629 to allow for enhanced uptake of glucose as well as utilization of other available carbohydrates, such as mannose.
Although the genes for the EII components of the chitobiose PTS are adjacently located on plasmid cp26, the EIIC permease component (chbC; bbb04) is divergently transcribed from chbA (bbb05) and chbB (bbb06). The array data in Figure 9B show that expression of chbC markedly increases during the fed tick phases of the enzootic cycle, while the somewhat lower expression levels of chbAB appear to be roughly equivalent in the mammalian and tick environments. Consistent with this finding, Pappas et al. (Pappas et al., 2011) previously reported that chbC expression is elevated during the tick phases relative to its expression in infected mouse joints. The increased expression of chbC during both blood meals suggests an adaptation to facilitate uptake of chitobiose, which would become available in relatively high amounts as a result of the formation of the peritrophic membrane and remodeling of the cuticle (Shao et al., 2001; Kariu et al., 2013).
Stage-specific Regulation of Central Carbon Metabolism
Pentose Phosphate Pathway
Glucose-6-P, produced by virtue of PTS-mediated uptake of glucose, can undergo two fates within the cytoplasm. It can be converted to fructose 6-P by the action of glucose 6-P isomerase and enter glycolysis for substrate level phosphorylation of ADP. Alternatively, it can be a substrate for glucose 6-P dehydrogenase (G6PD [BB0636]) and converted to ribose 5-P, a precursor for nucleotide biosynthesis, via the oxidative branch of the pentose phosphate pathway (Figure 10A). G6PD is widely distributed in most organisms including bacteria, requires NADP+ as a co-factor, and is the committed step of the pathway; the resultant NADPH provides reducing power for several enzymatic pathways, including those that alleviate oxidative stress (e.g., thioredoxin reductase/thioredoxin) (Parsonage et al., 2010; Moat et al., 2002). Consistent with the need for NADPH to protect against reactive oxygen species generated within the midgut during the larval and nymphal blood meals (Li et al., 2007; Boylan et al., 2008; Gherardini et al., 2010; Yang et al., 2014), transcripts encoding G6PD are greatly elevated in fed ticks (Figure 10B). Indeed, transcript levels for two other genes with roles in an oxidative stress response, superoxide dismutase (SOD, BB0153) and Dps (BB0690, also referred to as BicA), are significantly elevated in both fed nymphs and fed larvae relative to expression in DMCs (3-fold [p<0.001] and 4.2-fold [p=0.004] in fed nymphs and 1.3 fold and 8 fold [p<0.001] in fed larvae for SOD and Dps, respectively). The finding for Dps expression is consistent with a previous report demonstrating elevated Dps transcripts in fed ticks relative to mouse tissues and that spirochetes lacking this ferritin-like molecule are destroyed by the nymphal blood meal (Li et al., 2007).
Figure 10. Expression of pentose phosphate pathway genes is induced in fed ticks.
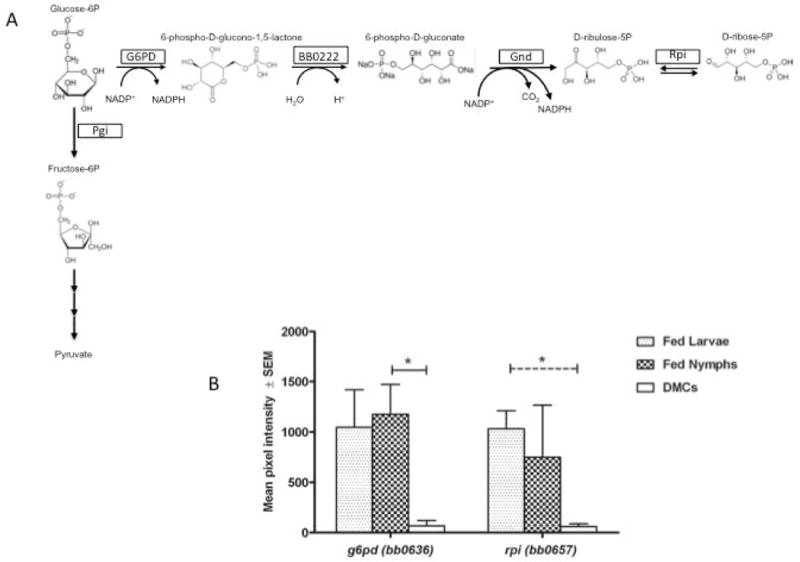
A) Oxidative branch of the pentose phosphate pathway. B) Transcript levels for glucose 6-phosphate dehydrogenase (G6PD, BB0636) and ribose phosphate isomerase (Rpi, BB0657) genes. Solid line indicates significant differences in transcript levels between fed nymph and DMCs and dashed line indicates significant differences in transcript levels between fed larvae and DMCs. Asterisk indicates P<0.05.
It also has been demonstrated that B. burgdorferi cannot utilize ribose as the principal carbon source to support in vitro growth (von Lackum and Stevenson, 2005). Thus, synthesis of ribose 5-phosphate from glucose 6-phosphate via this pathway is most likely required for nucleotide biosynthesis. Presumably the rapid growth of B. burgdorferi in the tick midgut during feeding (Piesman et al., 2001; Pappas et al., 2011) requires enhanced rates of RNA and DNA synthesis and elevated production of ribose 5-phosphate would be necessary to meet cellular needs. Consistent with this notion, the gene encoding ribose phosphate isomerase (rpi, BB0657) that catalyzes the conversion of ribulose 5-P to ribose-5-P (Figure 10B), is transcribed at considerably higher levels in fed ticks than in DMCs (5.2 fold and 20.4 fold relative to DMC in nymphs and larvae, respectively), a finding confirmed by qRT-PCR (Table 1).
Regulation of B. burgdorferi Carbohydrate Metabolism During the Enzootic Cycle
Glycolysis, the central metabolic pathway in B. burgdorferi (Fraser et al., 1997; Gherardini et al., 2010), is responsible for all ATP production (Figure 11). There is little variation in the transcript levels of glycolytic pathway enzymes in fed ticks and DMCs, with the exception of enolase (BB0337) and aldolase (BB0445), whose expression was significantly elevated in DMCs relative to fed larvae (data not shown). The reactions catalyzed by these enzymes are thermodynamically reversible and elevated concentrations of these enzymes may serve to drive the glycolytic flux from glucose to pyruvate. Alternatively, both enolase and aldolase have been classified as “moonlighting proteins” because they exhibit functional activities aside from their roles in the glycolytic pathway (Sriram et al., 2005; Huberts and van der Klei, 2010). Indeed, enolase is found in B. burgdorferi membrane vesicles and can bind plasminogen (Floden et al., 2011; Toledo et al., 2012); its differential expression may be related to its plasminogen-binding function.
Figure 11. Model for Regulation of Glycolysis in B. burgdorferi.
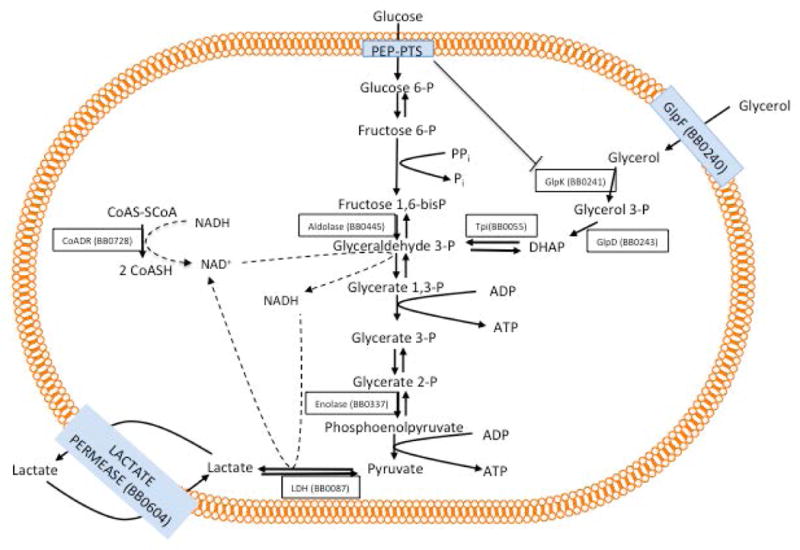
In an environment with abundant glucose the sugar will be taken up by the glucose-specific PTS and enter the glycolytic pathway yielding lactate, which is excreted. The abundance of glucose also results in inhibition of GlpK by phosphorylated EIIAGlc (crr). In a glucose-limiting state (e.g. fed larvae or nymphs), the spirochete will utilize alternative energy sources. B. burgdorferi encodes a lactate permease (LctP, BB0604) whose expression is significantly induced in both feeding larvae and nymphs. This will promote lactate uptake resulting in conversion of lactate to pyruvate and production of NADH. The elevated pyruvate level alters the PEP/pyruvate ratio resulting in lower levels of phosphorylated EIIAGlc (crr), thus decreasing the import of glucose. In addition, inhibition of GlpK will be relieved, allowing uptake and utilization of glycerol. Cellular levels of NAD+, required for continued glycolysis, would be replenished by CoADR.
When B. burgdorferi is growing in an environment with abundant glucose (e.g., a mammal), the sugar will enter the glycolytic pathway following uptake by the glucose-specific PTS and ultimately be converted by lactate dehydrogenase (BB0087) to lactate, which is excreted, and NAD+, which promotes glycolysis. The abundance of glucose also licenses a process known as inducer exclusion, whereby phosphorylated EIIAGlc (crr) interacts with GlpK, preventing conversion of glycerol to glycerol 3-phosphate, and blocks uptake of alternative carbohydrates via their cognate PTSs (Deutscher et al., 2014). As the larval and nymphal blood meals proceed, glucose presumably will become limiting due to increasing competition with midgut epithelial cells. To cope with this situation, the spirochete must modify its transport processes and intermediary metabolism to make use of alternative energy sources. B. burgdorferi encodes a lactate permease (LctP, BB0604) which mediates uptake of extracellular lactate, likely as a lactate:H+ symporter (Saier et al., 1999). Transcription of lctP is significantly induced (5–16 fold) in both feeding larvae and nymphs (Table 1). Elevated levels of LctP will promote importation of lactate accumulating within the “closed space” of the tick midgut, particularly post-repletion. The reaction catalyzed by lactate dehydrogenase is reversible, resulting in conversion of lactate to pyruvate and production of NADH (Figure 11). However, because the spirochete lacks pyruvate dehydrogenase (and a TCA cycle), pyruvate-formate lyase or lactate oxidase (Fraser et al., 1997), it cannot use the pyruvate to make ATP. Compounding this potential problem, production of NADH will alter the NAD+/NADH ratio unfavorably for glycolysis.
B. burgdorferi appears to have devised an elegant solution to these ostensible metabolic dilemmas arising from the arthropod phases of its lifecycle. In E. coli the PEP/pyruvate ratio is directly correlated with the phosphorylation state of EIIAGlc (Hogema et al., 1998). Thus, when the PEP/pyruvate ratio is low (i.e., when pyruvate is high), the EIIA component is dephosphorylated and the import of glucose through its specific PTS is blocked (Lengeler and Jahreis, 2009; Deutscher et al., 2014). In addition, inducer exclusion would be relieved, thereby facilitating GlpK-mediated conversion of glycerol to glycerol 3-phosphate and allowing uptake of alternate carbohydrates, such as chitobiose, via their specific PTS transporters (Figure 11). The significant increases in glp operon and chbC expression during the tick feeding stages (Pappas et al., 2011) are consistent with this model. The potential solution to the increased NADH resulting from conversion of lactate to pyruvate is provided by coenzyme A disulfide reductase (CoADR). This enzyme regenerates coenzyme A from CoA disulfides using NADH as the co-factor (Boylan et al., 2006; Eggers et al., 2011). CoADR would replenish cellular levels of NAD+ while maintaining the CoA pool, under disulfide stress by the oxidative environment within the feeding midgut, for other essential processes, such as glycerophospholipid and peptidoglycan biosynthesis. Indeed, maintenance of CoA homeostasis during the blood meal may require enhanced NADH production. Within the mouse there would be no uptake of excreted lactate and less oxidative stress on the CoA pool. The NADH produced by glycolysis would suffice for CoADR which, along with the NAD+ provided by conversion of pyruvate to lactate, would maintain a NAD+/NADH ratio favorable for glycolysis.
Concluding remarks
Current understanding of differential gene expression as fundamental to the dual host lifestyle of Lyme disease spirochetes has been two decades in the making. In the mid-1990s, reports appeared showing that changes in in vitro growth conditions, most notably a shift from ambient to physiologic temperature, induced the expression of OspC and OspE and OspF paralogs (Stevenson et al., 1995; Schwan et al., 1995). During this same period, investigators identified B. burgdorferi lipoproteins expressed within the mammalian host but not in vitro (Suk et al., 1995; Wallich et al., 1995; Fikrig et al., 1997; Akins et al., 1995) and discovered that spirochetes dramatically downregulate expression of ospA following transit from tick to mammal (Zhong et al., 1997; de Silva et al., 1996; Montgomery et al., 1996). The inability to consistently reproduce these in vivo-associated antigenic changes by manipulating in vitro cultivation parameters prompted the development of the dialysis membrane chamber model (Akins et al., 1998; Hefty et al., 2002). Investigators wishing to study vector-associated B. burgdorferi gene expression profiles have had to rely upon in vitro conditions presumed to simulate those within “unfed” and “fed” tick ticks (Yang et al., 2000; Revel et al., 2002) or employ RT-PCR on a gene-by-gene basis. The combined amplification-microarray methodology described herein has addressed this constraint, enabling the first global comparative transcriptional analysis of B. burgdorferi in ticks and mammals. Viewed broadly, the results sound a strong cautionary note about drawing conclusions from in vitro gene regulation studies in the absence of in vivo corroboration. Nevertheless, our approach is not without caveats. While amplification bias for the dataset as a whole was ruled out experimentally and by comparison of microarray data with published results for selected genes, it is likely that levels of some transcripts were skewed from their natural counterparts. Ideally, one would like to have comparable microarray data for spirochetes within unfed ticks in order to elucidate this poorly understood, quiescent state and identify B. burgdorferi genes induced by feeding; unfortunately, the low bacterial burdens in unfed ticks precluded such an analysis even with amplification. Further, while cultivation of spirochetes in DMCs is believed to capture the principal physiologic adaptations to the mammalian host environment (Purser et al., 2003; Ristow et al., 2012), possible tissue-specific transcripts and changes in gene expression in response to local and systemic host defenses cannot be elucidated. Lastly, the microarrays are composed of 70-mer oligonucleotides targeting ORFs and thus are not informative with regard to small, non-coding RNAs.
We found that a substantial portion of the spirochete genome is differentially expressed in vivo with the largest number of transcripts in DMCs, the least in larvae, and significant overlaps between stages (aside from “core” housekeeping genes). The overlaps support the notions that (i) physiologic adaptations are shared between stages; (ii) during the transitional phases of the enzootic cycle, represented by the blood meals, the spirochete positions itself transcriptionally in anticipation of its subsequent host, and (iii) regardless of whether spirochetes are being acquired or transmitted, some genes are required for survival within the midguts of feeding larvae and nymphs. The B. burgdorferi genome’s relatively small size (Fraser et al., 1997; Casjens et al., 2000) belies its compositional and regulatory complexity; the bulk of reductive evolution undergone by the spirochete reflects the jettisoning of metabolic pathways no longer needed for growth within environments providing virtually unlimited sources of carbon, nitrogen, and micro-nutrients (Fraser et al., 1997; Gherardini et al., 2010). Not surprisingly, therefore, many differentially expressed genes in all three in vivo conditions encode proteins of unknown function. Indeed, our results not only underscore the myriad, yet still obscure, functionalities required for transit between such divergent hosts during the narrow window of opportunity provided by the blood meal, they provide a transcriptional map to inform the design of targeted mutagenesis studies to dissect these activities. They also substantiate the widely held view that the plasmid complement of the spirochete’s genome serves as a repository for differentially expressed genes; that plasmid gene expression was greatest in the mammal appears consistent with the need for a multitude of unique, and likely redundant, infectivity-related functions.
Investigation of differential gene expression by B. burgdorferi has focused traditionally on known or likely surface-exposed lipoproteins based on the logical assumptions that molecules residing at the host-pathogen interface are candidate vaccinogens and potential virulence determinants (Radolf et al., 2012; Bergstrom and Zuckert, 2010; Schuijt et al., 2011). As anticipated, we observed changes in the putative lipoproteome indicating extensive remodeling of the spirochete surface as the enzootic cycle progresses. However, we also observed host and stage-specific differential expression of genes affecting a broad range of homeostatic processes; the breadth of these changes is probably the most novel and important global finding in our report. One example is the chemotaxis system for which we observed complex alterations in expression profiles of genes encoding chemoattractant receptors (MCPs) as well as the components of the apparatus that transduces signals from exogenous ligands to the flagellar motor. Another major implication of our data is that B. burgdorferi employs its PTS system and some variant of carbon catabolite repression for utilization of glucose as its sole or predominant energy substrate within mammals and adjusts to the availability of multiple alternate carbon sources (glycerol as well as other carbohydrates) within ticks. Amino acid uptake via the Opp system also appears to change dramatically between ticks and mammals, although the specificities of the OppA substrate-binding proteins and the availabilities of their cognate peptide ligands throughout the enzootic cycle are too poorly understood to place these findings in a meaningful biological context. Lastly, we noted that transcripts for enzymes required for biosynthesis of the lipid carrier for peptidoglycan also vary greatly between ticks and mammals, albeit in a pattern that is not easily interpreted from a structural standpoint. The results as a whole make clear that environmental sensing by B. burgdorferi directly or indirectly drives a wholesale, temporally defined, and tightly integrated modulation of cell envelope constituents, chemotaxis/motility machinery, intermediary metabolism and cellular physiology.
As noted earlier, B. burgdorferi accomplishes the extraordinary feat of transitioning between invertebrate and vertebrate hosts using only two TCS (Radolf et al., 2012; Groshong and Blevins, 2014). The Hk1/Rrp1 system, which almost certainly responds to unidentified exogenous ligand(s) given the periplasmic location of the HK1 sensing domains, is required for survival of both blood meals but dispensable within the mammal (Caimano et al., 2011; He et al., 2011). Defining the in vivo Hk1/Rrp1 regulon will be key to understanding how fluctuations in c-di-GMP levels regulate fate-determining modifications in the structure, physiology, and motility state of the B. burgdorferi cell. The other TCS, Hk2/Rrp2, controls the alternative sigma factor RpoS (Hubner et al., 2001; Yang et al., 2003; Smith et al., 2007; Radolf et al., 2012; Samuels, 2011), which is induced only during the nymphal blood meal (Caimano et al., 2007) and transcribes genes required for both tick transmission and mammalian infectivity (Caimano et al., 2004; Dunham-Ems et al., 2012). It is currently believed that, rather than Hk2, acetyl phosphate generated from blood-derived acetate via the AckA/Pta pathway serves as the phosphoryl donor for Rrp2 (Burtnick et al., 2007; Xu et al., 2010). BosR also forms part of the complex that licenses RpoN to transcribe RpoS (Ouyang et al., 2009; Ouyang et al., 2011; Hyde et al., 2009). The data presented herein demonstrate that the contours of the RpoS regulon differ far more between nymph and mammal than would have anticipated and, paradoxically, that the enhanced expression of RpoS and RpoS-dependent genes observed in DMCs occurs in the face of downregulated transcription of ackA, pta, and bosR.
It is intuitively obvious from our data that the known TCS signaling pathways account for only a fraction of the Lyme disease spirochete’s differentially expressed transcriptome. The ultimate conundrum arising from our dataset is how the bacterium accomplishes the intricate, highly coordinated gene expression patterns required for perpetuation of its enzootic cycle. The handful of newly identified regulatory factors identified in recent years is part of the puzzle (Samuels, 2011; Hyde et al., 2009; Ouyang et al., 2009; Jutras et al., 2012; Jutras et al., 2013a; Jutras et al., 2013b;(Miller et al., 2013). But what are these and other as-yet-to-be-identified factors sensing? We predict that many environmental signals are filtered endogenously through the B. burgdorferi metabolome and that real-time monitoring of carbon and probably nitrogen flux plays a critical role in enabling the bacterium to determine where it is and where it wants to go.
Experimental Procedures
Bacterial strains and growth conditions
B. burgdorferi wild-type strain B31 5A4 NP1 GFP+ (BbP1286) was employed throughout. This strain was generated using the same strategy as described previously for BbP914 (Dunham-Ems et al., 2009). The suicide plasmid pMC2498 (GenBank Accession number KMS576780) used to insert a PflaB-gfp/PflgB-aacC1 cassette on to the endogenous strain B31 cp26 is shown in Figure S3. Competent B31 5A4 NP1 (Kawabata et al., 2004), prepared using the method described by Samuels (Samuels, 1995), were electroporated with approximately 20 μg of pMC2498 plasmid DNA; transformants were selected in BSK-II containing gentamicin and kanamycin as previously described (Yang et al., 2003). One transformant, BbP1286, containing a full complement of B. burgdorferi plasmids, was selected based on its ability to complete the enzootic cycle.
Spirochetes were first cultivated at 23°C to mid-logarithmic phase (5 × 10⁷/ml) in modified BSK-H medium (Wang et al., 2004a) supplemented with 6 % rabbit serum (Pelfreeze) containing kanamycin (40 μg /ml) and gentamicin (100 μg/ml). Cultures then were diluted to a starting density of 3,000 organisms/ml and cultivated either at 37°C or in dialysis membrane chambers (DMC) implanted into the peritoneal cavities of rats in 10 ml BSK medium as described (Akins et al., 1998). Cells were harvested from the DMCs after 12 days. Spirochetes were enumerated by dark field microscopy as described previously (Schwartz et al., 1992).
Generation of infected I. scapularis ticks
C3H/HeJ mice (Jackson Labs) were inoculated intradermally with 1 × 10⁴ B. burgdorferi and the infection status of mice was confirmed by culture of ear biopsies at 2 weeks and serology at 4 weeks post-inoculation as previously described (Wang et al., 2001). Naïve I. scapularis larvae were obtained from Oklahoma State University, Stillwater, OK. 150–200 larvae were placed on infected mice and allowed to feed until repletion (72–96 hours). 100–150 fed larvae collected from each mouse were maintained for 8–10 weeks in desiccator chambers at 21°C and 100% humidity to facilitate molting to the nymphal stage. Ten infected, unfed nymphs were placed on uninfected C3H/HeJ mice and allowed to feed to repletion. All mice became infected as confirmed by culture of ear tissues. Ticks were homogenized in TRIzol reagent (see below) and homogenates were stored at −80°C until RNA isolation.
Isolation of B. burgdorferi RNA from ticks
Pools of 100 B. burgdorferi-infected fed larvae or ten B. burgdorferi-infected fed nymphs were homogenized manually in 500 μl of TRIZol (Invitrogen) denaturing solution using a glass homogenizer until all ticks were crushed and midgut contents were released. Lysates were centrifuged at 450 × g for 2 minutes to remove debris. RNA was isolated from debris-free supernatant employing TRIzol reagent according to manufacturer’s instructions. Contaminating genomic DNA was removed from isolated RNA by treatment with 10 U of RNase-free DNase (Turbo DNA free, Ambion). RNA was further purified using Qiagen RNeasy columns and a second “on column” DNase digestion was performed to remove traces of DNA.
Removal of ribosomal RNA
Since RNA preparations from fed ticks contain arthropod and murine ribosomal RNA, removal of rRNA was required to enrich for bacterial mRNA. This was accomplished with the Ribo-Zero rRNA removal kit (Epicentre Biotechnologies), using ten μg of total RNA according to the manufacturer’s protocol. rRNA- depleted samples were concentrated on a ZYMO pure RNA concentrator column (Zymo Research); RNA was eluted in 20 μl of RNase- and DNase-free water and concentrated to 5 μl on an Eppendorf Vacufuge. The entire 5 ul sample was utilized in an amplification protocol (see below) to generate amplified RNA (aRNA) for microarray hybridization.
Isolation of RNA from DMCs
RNA was isolated from 5 × 10⁶ B. burgdorferi cells grown in DMCs using the TRIzol protocol described above for tick RNA isolation. Since there is no contaminating host RNA in these preparations, the Ribo-Zero step was omitted and total RNA isolated from DMCs was treated twice with DNase and concentrated using ZYMO pure RNA concentrator columns. Five μl of purified RNA was used to generate aminoallyl-labeled aRNA.
Isolation of RNA from B. burgdorferi cultivated in vitro
For comparison of the B. burgdorferi transcriptome in ticks and DMCs to that of spirochetes grown in vitro, 5 × 10⁵ temperature-shifted B. burgdorferi cells (see above) were added to ten uninfected, fed nymphs; the mixture was homogenized in TRIzol reagent, and RNA was isolated as described above for infected ticks. rRNA then was removed and the rRNA-depleted samples were used for preparation of aminoallyl-labeled aRNA. RNA obtained in this manner is referred as “in vitro RNA” throughout the manuscript.
Preparation of aminoallyl-labeled aRNA
rRNA-depleted RNAs were amplified using the Ambion MessageAmp II bacterial kit (Ambion), essentially according to the manufacturer’s protocol but with the following modification. Aminoallyl-UTP was incorporated into aRNA during the in vitro transcription reaction step instead of biotin-UTP to allow subsequent coupling with fluorescent dye for array hybridization. The quality and purity of aRNA was determined on an Eppendorf Biophotometer. Aminoallyl-labeled aRNA was concentrated and resuspended in 0.1M sodium bicarbonate (pH 9.6) at a concentration of 3–6 μg/μl.
Pilot in vitro studies revealed that aRNA containing approximately 1 × 10⁶ copies of flaB transcript was required to obtain reproducible signals when hybridized to microarrays. Accordingly, 40–60 μg of aminoallyl-labeled aRNA from fed ticks, 5 μg of aminoallyl-labeled aRNA from in vitro-cultivated spirochetes or 3 μg of aminoallyl-labeled aRNA obtained with DMC-grown organisms was used for coupling to Cy3 fluorescent dye prior to hybridization to microarrays as described below. The yields of labeled B. burgdorferi RNA from infected ticks were determined. Ten and 40 μg of total RNA were obtained from 50 fed larvae and 10 fed nymphs, respectively. 1.5 μg of rRNA-depleted RNA yielded 280 μg of aRNA, of which 60 μg was used for microarray hybridization.
Array hybridization
Aminoallyl-labeled aRNA was coupled to fluorescent Cy3 dye (Post labeling reactive Cy-Dye packs, Amersham) as previously described (Caimano et al., 2007). Dye-labeled aRNA was fragmented at 70°C for 15 min using the Ambion fragmentation reagent (Ambion) prior to array hybridization. B. burgdorferi 70-mer oligonucleotide arrays, array hybridization, scanning and data acquisition were all done as described previously (Caimano et al., 2007). As an internal standard for array hybridization, 3 μg of B. burgdorferi genomic DNA was labeled with Cy5 fluorescent dye (Amersham) and hybridized simultaneously with Cy3-labeled aRNA. Arrays were scanned on a GenePix 4000B microarray scanner (Axon Instruments). Data acquired using GenePix software were transferred to Microsoft Excel for background subtraction, normalization and filtering essentially as described (Caimano et al., 2007). Microarray data are available in the ArrayExpress database (www.ebi.ac.uk/arrayexpress) under accession number E-MTAB-2957.
Bioinformatic prediction of B. burgdorferi lipoproteins
Initially, 1,607 sequences in the B. burgdorferi genome (http://cmr.jcvi.org) were analyzed for proteins predicted to be lipoproteins using the following three computational programs: LIPO (http://services.cbu.uib.no/tools/lipo) (Berven et al., 2006), LipoP 1.0 (http://www.cbs.dtu.dk/services/LipoP/) (Juncker et al., 2003), and SpLip (Setubal et al., 2006). The outputs from each program were then were then clustered using venny server (http://bioinfogp.cnb.csic.es/tools/venny/) based on the number of programs predicting lipoproteins. The N-termini of some proteins were manually inspected to identify or confirm the presence of a lipobox motif (Sutcliffe and Harrington, 2002).
Data analysis and Statistics
Background subtracted spot intensities were generated for each gene by subtracting mean pixel intensity values of 200 buffer (3XSSC) spots from the pixel intensities of individual spots. Mean pixel intensity values were calculated for each putative B. burgdorferi ORF represented on the array. The background-subtracted pixel values for all genes were summed for each array; one array was used as a reference to which the total pixel intensities for all other arrays were normalized. The normalization factor (sum of pixel intensities of the reference array/sum of pixel intensities of the experimental array) was applied to the intensity of each background-subtracted spot; the normalized, log2-transformed signal intensities were employed for subsequent analyses.
Fifteen array hybridizations with RNAs from 6 biological replicates of fed larvae, 13 array hybridizations with RNA from 4 biological replicates of fed nymphs, 4 array hybridizations with DMC-derived RNA from two biological replicates (i.e. two separate rats) and 4 array hybridizations with RNA from two separate in vitro cultivations were carried out. A correlation coefficient matrix table was generated using GeneSpring GX12.5 software for all arrays for each condition in order to assess reproducibility and identify outliers in the data sets. Based on this analysis, the final array data sets consisted of 10 larval arrays (from 5 biological replicates), 7 nymphal arrays (from 4 biological replicates) and four arrays each (from 2 biological replicates) for DMC or in vitro cultivated B. burgdorferi. Differentially expressed genes were identified through gene-by-gene comparison of normalized expression data sets using an unpaired t-test within GeneSpring GX12.5. Differentially expressed genes were identified as those with a fold change >2 at P<0.02.
Hierarchical clustering
To visualize the levels of individual transcripts at each condition, hierarchical clustering was performed using the normalized, log2-transformed signal intensity values for each gene. The input data for clustering included either all genes represented on the array or gene subsets grouped according to specific functional characteristics. Clustering was performed in GeneSpring GX12.5 with average linkage using the Pearson-centered correlation coefficient as the distance metric.
qRT-PCR
4 μg of total tick RNA or 1 μg of in vitro or DMC cultivated B. burgdorferi RNA were converted to cDNA in a 20 μl reaction in AMV buffer (Promega, WI) containing 10 units of AMV reverse transcriptase (Promega), 500 ng of random hexamers (Promega), 250 μm of dNTPs and RNasin (5 U). Reactions were carried out at 42°C for 60 min as described (Iyer et al., 2013), and the resultant cDNA was stored at −20°C until further use. A control reaction lacking reverse transcriptase was performed for each primer set using total RNA to ensure that samples were not contaminated with DNA. cDNAs were used as templates for qPCR using gene specific primers. Oligonucleotide primers for qRT-PCR were designed using Primer Express software, version 2.0 (Applied Biosystems, CA), and purchased from Integrated DNA Technology, IA. All primers used in this study are listed in Table S10.
20 pmoles of gene specific primers and 40 ng of cDNA were used for each PCR reaction and amplification was performed in 25 μl containing 1X SYBR Green PCR master mix (Roche Diagnostics). Duplicate assays were carried out with each RNA sample and were performed with RNA obtained from three separate pools of fed larvae, three separate pools of fed nymphs and RNA obtained from two independent in vitro or DMC cultivations. All reactions were carried out on the ABI Prism 7900 HT SDS system using thermal cycling parameters consisting of 2 minutes at 55°C, denaturation at 95°C for 10 min followed by 40 cycles of 95°C for 15 seconds and 60°C for 1 minute. To verify the purity of the PCR product, melting curve analyses were performed. In addition, a no-template control was included in each PCR run. Expression for each gene was normalized against flaB transcript levels using the absolute standard curve method (Iyer et al., 2013). For statistical analysis of expression levels for a given gene at two different environmental conditions, normalized transcript quantities for the gene at the two conditions were compared. The statistical significance of expression differences was evaluated by a two-tailed unpaired t-test and significance was defined as p<.05.
Supplementary Material
Figure S1. Assessment of B. burgdorferi RNA amplification. One μg of RNA isolated from in vitro-cultivated B. burgdorferi (equivalent to the yield from 2 × 10⁷ cells) was amplified as described in Experimental Procedures. Five μg of the resultant aRNA and 5 μg of unamplified RNA were co-hybridized to microarrays; this represents a comparison of RNA isolated from 3 × 10⁵ cells (amplified) to that obtained from 1 × 10⁸ cells (unamplified). Background-subtracted pixel intensities for each spotted ORF were obtained as described in Material and Methods. Regression analysis yielded an R2 value of 0.82.
Figure S2. Correlation of microarray and qRT-PCR data for selected genes. Microarray pixel intensities and transcript copies for genes listed in Table 1 were determined as described in Experimental Procedures. Regression analysis of transcript levels for these genes in all three biological conditions as determined by either qRT-PCR or microarray, after removal of the circled data points that were designated as outliers, yielded an R2 value of 0.83.
Figure S3. Suicide plasmid pMC2498. Map of the suicide vector, pMC2498, used to insert the gentamicin-resistance marker (PflgB-aacC1) and gfp (PflaB-gfp) into the bbb20-bbb21 intergenic region of the endogenous cp26 in B. burgdorferi strain B31 5A4 NP1.
Acknowledgments
This work was supported by NIH grants AI45801 (IS) and AI29735 (JDR and MJC). JDR and MJC also acknowledge the support of Connecticut Children’s Medical Center. The authors thank Frank Gherardini for helpful discussions and David Vernik for assistance in preparation of the Tables.
References
- Akins DR, Bourell KW, Caimano MJ, Norgard MV, Radolf JD. A new animal model for studying Lyme disease spirochetes in a mammalian host-adapted state. J Clin Invest. 1998;101:2240–2250. doi: 10.1172/JCI2325. [DOI] [PMC free article] [PubMed] [Google Scholar]
- Akins DR, Porcella SF, Popova TG, Shevchenko D, Baker SI, Li M, Norgard MV, Radolf JD. Evidence for in vivo but not in vitro expression of a Borrelia burgdorferi outer surface protein F (OspF) homologue. Mol Microbiol. 1995;18:507–520. doi: 10.1111/j.1365-2958.1995.mmi_18030507.x. [DOI] [PubMed] [Google Scholar]
- Bacon RM, Kugeler KJ, Mead PS. Surveillance for Lyme disease–United States, 1992–2006. MMWR Surveill Summ. 2008;57:1–9. [PubMed] [Google Scholar]
- Barabote RD, Saier MH., Jr Comparative genomic analyses of the bacterial phosphotransferase system. Microbiol Mol Biol Rev. 2005;69:608–634. doi: 10.1128/MMBR.69.4.608-634.2005. [DOI] [PMC free article] [PubMed] [Google Scholar]
- Beier D, Gross R. Regulation of bacterial virulence by two-component systems. Curr Opin Microbiol. 2006;9:143–152. doi: 10.1016/j.mib.2006.01.005. [DOI] [PubMed] [Google Scholar]
- Bergstrom S, Zuckert WR. Structure, Function, and Biogenesis of the Cell Envelope. In: Samuels DS, Radolf JD, editors. Borrelia: Molecular Biology, Host Interaction, and Pathogenesis. Norfolk, UK: Caister Academic Press; 2010. pp. 139–166. [Google Scholar]
- Berven FS, Karlsen OA, Straume AH, Flikka K, Murrell JC, Fjellbirkeland A, Lillehaug JR, Eidhammer I, Jensen HB. Analysing the outer membrane subproteome of Methylococcus capsulatus (Bath) using proteomics and novel biocomputing tools. Arch Microbiol. 2006;184:362–377. doi: 10.1007/s00203-005-0055-7. [DOI] [PubMed] [Google Scholar]
- Bono JL, Tilly K, Stevenson B, Hogan D, Rosa P. Oligopeptide permease in Borrelia burgdorferi: putative peptide-binding components encoded by both chromosomal and plasmid loci. Microbiology. 1998;144:1033–1044. doi: 10.1099/00221287-144-4-1033. [DOI] [PubMed] [Google Scholar]
- Bourret TJ, Boylan JA, Lawrence KA, Gherardini FC. Nitrosative damage to free and zinc-bound cysteine thiols underlies nitric oxide toxicity in wild-type. Mol Microbiol. 2011;81:259–273. doi: 10.1111/j.1365-2958.2011.07691.x. [DOI] [PMC free article] [PubMed] [Google Scholar]
- Boylan JA, Hummel CS, Benoit S, Garcia-Lara J, Treglown-Downey J, Crane EJ, 3rd, Gherardini FC. Borrelia burgdorferi bb0728 encodes a coenzyme A disulphide reductase whose function suggests a role in intracellular redox and the oxidative stress response. Mol Microbiol. 2006;59:475–486. doi: 10.1111/j.1365-2958.2005.04963.x. [DOI] [PubMed] [Google Scholar]
- Boylan JA, Lawrence KA, Downey JS, Gherardini FC. Borrelia burgdorferi membranes are the primary targets of reactive oxygen species. Mol Microbiol. 2008;68:786–799. doi: 10.1111/j.1365-2958.2008.06204.x. [DOI] [PMC free article] [PubMed] [Google Scholar]
- Boylan JA, Posey JE, Gherardini FC. Borrelia oxidative stress response regulator, BosR: a distinctive Zn-dependent transcriptional activator. Proc Natl Acad Sci U S A. 2003;100:11684–11689. doi: 10.1073/pnas.2032956100. [DOI] [PMC free article] [PubMed] [Google Scholar]
- Briegel A, Ortega DR, Tocheva EI, Wuichet K, Li Z, Chen S, Muller A, Iancu CV, Murphy GE, Dobro MJ, Zhulin IB, Jensen GJ. Universal architecture of bacterial chemoreceptor arrays. Proc Natl Acad Sci U S A. 2009;106:17181–17186. doi: 10.1073/pnas.0905181106. [DOI] [PMC free article] [PubMed] [Google Scholar]
- Burtnick MN, Downey JS, Brett PJ, Boylan JA, Frye JG, Hoover TR, Gherardini FC. Insights into the complex regulation of rpoS in Borrelia burgdorferi. Mol Microbiol. 2007;65:277–293. doi: 10.1111/j.1365-2958.2007.05813.x. [DOI] [PMC free article] [PubMed] [Google Scholar]
- Bykowski T, Woodman ME, Cooley AE, Brissette CA, Brade V, Wallich R, Kraiczy P, Stevenson B. Coordinated expression of Borrelia burgdorferi complement regulator-acquiring surface proteins during the Lyme disease spirochete’s mammal-tick infection cycle. Infect Immun. 2007;75:4227–4236. doi: 10.1128/IAI.00604-07. [DOI] [PMC free article] [PubMed] [Google Scholar]
- Caimano MJ, Eggers CH, Hazlett KR, Radolf JD. RpoS is not central to the general stress response in Borrelia burgdorferi but does control expression of one or more essential virulence determinants. Infect Immun. 2004;72:6433–6445. doi: 10.1128/IAI.72.11.6433-6445.2004. [DOI] [PMC free article] [PubMed] [Google Scholar]
- Caimano MJ, Iyer R, Eggers CH, Gonzalez C, Morton EA, Gilbert MA, Schwartz I, Radolf JD. Analysis of the RpoS regulon in Borrelia burgdorferi in response to mammalian host signals provides insight into RpoS function during the enzootic cycle. Mol Microbiol. 2007;65:1193–1217. doi: 10.1111/j.1365-2958.2007.05860.x. [DOI] [PMC free article] [PubMed] [Google Scholar]
- Caimano MJ, Kenedy MR, Kairu T, Desrosiers DC, Harman M, Dunham-Ems S, Akins DR, Pal U, Radolf JD. The hybrid histidine kinase Hk1 is part of a two-component system that is essential for survival of Borrelia burgdorferi in feeding Ixodes scapularis ticks. Infect Immun. 2011;79:3117–3130. doi: 10.1128/IAI.05136-11. [DOI] [PMC free article] [PubMed] [Google Scholar]
- Casjens S, Palmer N, van Vugt R, Huang WM, Stevenson B, Rosa P, Lathigra R, Sutton G, Peterson J, Dodson RJ, Haft D, Hickey E, Gwinn M, White O, Fraser CM. A bacterial genome in flux: the twelve linear and nine circular extrachromosomal DNAs in an infectious isolate of the Lyme disease spirochete Borrelia burgdorferi. Mol Microbiol. 2000;35:490–516. doi: 10.1046/j.1365-2958.2000.01698.x. [DOI] [PubMed] [Google Scholar]
- Charon NW, Cockburn A, Li C, Liu J, Miller KA, Miller MR, Motaleb MA, Wolgemuth CW. The unique paradigm of spirochete motility and chemotaxis. Annu Rev Microbiol. 2012;66:349–370. doi: 10.1146/annurev-micro-092611-150145. [DOI] [PMC free article] [PubMed] [Google Scholar]
- Chattopadhyay MK, Tabor CW, Tabor H. Polyamines protect Escherichia coli cells from the toxic effect of oxygen. Proc Natl Acad Sci U S A. 2003;100:2261–2265. doi: 10.1073/pnas.2627990100. [DOI] [PMC free article] [PubMed] [Google Scholar]
- Clore GM, Venditti V. Structure, dynamics and biophysics of the cytoplasmic protein-protein complexes of the bacterial phosphoenolpyruvate: sugar phosphotransferase system. Trends Biochem Sci. 2013;38:515–530. doi: 10.1016/j.tibs.2013.08.003. [DOI] [PMC free article] [PubMed] [Google Scholar]
- Coleman JL, Gebbia JA, Piesman J, Degen JL, Bugge TH, Benach JL. Plasminogen is required for efficient dissemination of B. burgdorferi in ticks and for enhancement of spirochetemia in mice. Cell. 1997;89:1111–1119. doi: 10.1016/s0092-8674(00)80298-6. [DOI] [PubMed] [Google Scholar]
- Cox DL, Radolf JD. Insertion of fluorescent fatty acid probes into the outer membranes of the pathogenic spirochaetes Treponema pallidum and Borrelia burgdorferi. Microbiology. 2001;147:1161–1169. doi: 10.1099/00221287-147-5-1161. [DOI] [PubMed] [Google Scholar]
- Davidson AL, Dassa E, Orelle C, Chen J. Structure, function, and evolution of bacterial ATP-binding cassette systems. Microbiol Mol Biol Rev. 2008;72:317–364. doi: 10.1128/MMBR.00031-07. [DOI] [PMC free article] [PubMed] [Google Scholar]
- De Silva AM, Fikrig E. Growth and migration of Borrelia burgdorferi in Ixodes ticks during blood feeding. Am J Trop Med Hyg. 1995;53:397–404. doi: 10.4269/ajtmh.1995.53.397. [DOI] [PubMed] [Google Scholar]
- de Silva AM, Telford SR, Brunet LR, 3rd, Barthold SW, Fikrig E. Borrelia burgdorferi OspA is an arthropod-specific transmission-blocking Lyme disease vaccine. J Exp Med. 1996;183:271–275. doi: 10.1084/jem.183.1.271. [DOI] [PMC free article] [PubMed] [Google Scholar]
- Deutscher J, Ake FM, Derkaoui M, Zebre AC, Cao TN, Bouraoui H, Kentache T, Mokhtari A, Milohanic E, Joyet P. The bacterial phosphoenolpyruvate:carbohydrate phosphotransferase system: regulation by protein phosphorylation and phosphorylation-dependent protein-protein interactions. Microbiol Mol Biol Rev. 2014;78:231–256. doi: 10.1128/MMBR.00001-14. [DOI] [PMC free article] [PubMed] [Google Scholar]
- Dunham-Ems SM, Caimano MJ, Eggers CH, Radolf JD. Borrelia burgdorferi requires the alternative sigma factor RpoS for dissemination within the vector during tick-to-mammal transmission. PLoS Pathog. 2012;8:e1002532. doi: 10.1371/journal.ppat.1002532. [DOI] [PMC free article] [PubMed] [Google Scholar]
- Dunham-Ems SM, Caimano MJ, Pal U, Wolgemuth CW, Eggers CH, Balic A, Radolf JD. Live imaging reveals a biphasic mode of dissemination of Borrelia burgdorferi within ticks. J Clin Invest. 2009;119:3652–3665. doi: 10.1172/JCI39401. [DOI] [PMC free article] [PubMed] [Google Scholar]
- Eggers CH, Caimano MJ, Malizia RA, Kariu T, Cusack B, Desrosiers DC, Hazlett KR, Claiborne A, Pal U, Radolf JD. The coenzyme A disulfide reductase of Borrelia burgdorferi is important for rapid growth throughout the enzootic cycle and essential for infection of the mammalian host. Mol Microbiol. 2011;82:679–697. doi: 10.1111/j.1365-2958.2011.07845.x. [DOI] [PMC free article] [PubMed] [Google Scholar]
- Fikrig E, Barthold SW, Sun W, Feng W, Telford SR, 3rd, Flavell RA. Borrelia burgdorferi P35 and P37 proteins, expressed in vivo, elicit protective immunity. Immunity. 1997;6:531–539. doi: 10.1016/s1074-7613(00)80341-6. [DOI] [PubMed] [Google Scholar]
- Fisher MA, Grimm D, Henion AK, Elias AF, Stewart PE, Rosa PA, Gherardini FC. Borrelia burgdorferi σ54 is required for mammalian infection and vector transmission but not for tick colonization. Proc Natl Acad Sci U S A. 2005;102:5162–5167. doi: 10.1073/pnas.0408536102. [DOI] [PMC free article] [PubMed] [Google Scholar]
- Floden AM, Watt JA, Brissette CA. Borrelia burgdorferi enolase is a surface-exposed plasminogen binding protein. PLoS One. 2011;6:e27502. doi: 10.1371/journal.pone.0027502. [DOI] [PMC free article] [PubMed] [Google Scholar]
- Fraser CM, Casjens S, Huang WM, Sutton GG, Clayton R, Lathigra R, White O, Ketchum KA, Dodson R, Hickey EK, Gwinn M, Dougherty B, Tomb JF, Fleischmann RD, Richardson D, Peterson J, Kerlavage AR, Quackenbush J, Salzberg S, Hanson M, van Vugt R, Palmer N, Adams MD, Gocayne J, Weidman J, Utterback T, Watthey L, McDonald L, Artiach P, Bowman C, Garland S, Fuji C, Cotton MD, Horst K, Roberts K, Hatch B, Smith HO, Venter JC. Genomic sequence of a Lyme disease spirochaete, Borrelia burgdorferi. Nature. 1997;390:580–586. doi: 10.1038/37551. [DOI] [PubMed] [Google Scholar]
- Gherardini F, Boylan J, Lawrence K, Skare J. Metabolism and Physiology of Borrelia. In: Samuels DS, Radolf JD, editors. Borrelia Molecular Biology, Host Interaction, and Pathogenesis. Norfolk, UK: Caister Academic Press; 2010. pp. 103–138. [Google Scholar]
- Goldstein SF, Li C, Miller M, Motaleb MA, Norris SJ, Silversmith RE, Wolgemuth CW, Charon NW. The chic motility and chemotaxis of Borrelia burgdorferi. In: Samuels DS, Radolf JD, editors. Borrelia: Molecular Biology, Host Interaction, and Pathogenesis. Norfolk, UK: Caister Academic Press; 2010. pp. 167–187. [Google Scholar]
- Gorke B, Stulke J. Carbon catabolite repression in bacteria: many ways to make the most out of nutrients. Nat Rev Microbiol. 2008;6:613–624. doi: 10.1038/nrmicro1932. [DOI] [PubMed] [Google Scholar]
- Groshong AM, Blevins JS. Insights into the biology of Borrelia burgdorferi gained through the application of molecular genetics. Adv Appl Microbiol. 2014;86:41–143. doi: 10.1016/B978-0-12-800262-9.00002-0. [DOI] [PubMed] [Google Scholar]
- Hall-Baker PA, Nieves E, Jr, Jojosky RA, Adams DA, Sharp P, Anderson WJ, Aponte JJ, Aranas AE, Katz SB, Mayes M, Wodajo MS, Onweh DH, Baille J, Meeyoung P. Summary of Notifiable Diseases-United States, 2008. MMWR. 2010;57:1–94. [Google Scholar]
- Harman MW, Dunham-Ems SM, Caimano MJ, Belperron AA, Bockenstedt LK, Fu HC, Radolf JD, Wolgemuth CW. The heterogeneous motility of the Lyme disease spirochete in gelatin mimics dissemination through tissue. Proc Natl Acad Sci U S A. 2012;109:3059–3064. doi: 10.1073/pnas.1114362109. [DOI] [PMC free article] [PubMed] [Google Scholar]
- He M, Ouyang Z, Troxell B, Xu H, Moh A, Fu XY, Piesman J, Norgard MV, Gomelsky M, Yang XF. Cyclic di-GMP is essential for the survival of Borrelia burgdorferi in ticks. PLOS Pathogens. 2011;7:e1002133. doi: 10.1371/journal.ppat.1002133. [DOI] [PMC free article] [PubMed] [Google Scholar]
- Hefty PS, Jolliff SE, Caimano MJ, Wikel SK, Akins DR. Changes in temporal and spatial patterns of outer surface lipoprotein expression generate population heterogeneity and antigenic diversity in the Lyme disease spirochete, Borrelia burgdorferi. Infect Immun. 2002;70:3468–3478. doi: 10.1128/IAI.70.7.3468-3478.2002. [DOI] [PMC free article] [PubMed] [Google Scholar]
- Higgins CF. ABC transporters: from microorganisms to man. Annual review of cell biology. 1992;8:67–113. doi: 10.1146/annurev.cb.08.110192.000435. [DOI] [PubMed] [Google Scholar]
- Hogema BM, Arents JC, Bader R, Eijkemans K, Yoshida H, Takahashi H, Aiba H, Postma PW. Inducer exclusion in Escherichia coli by non-PTS substrates: the role of the PEP to pyruvate ratio in determining the phosphorylation state of enzyme IIAGlc. Mol Microbiol. 1998;30:487–498. doi: 10.1046/j.1365-2958.1998.01053.x. [DOI] [PubMed] [Google Scholar]
- Huberts DH, van der Klei IJ. Moonlighting proteins: an intriguing mode of multitasking. Biochim Biophys Acta. 2010;1803:520–525. doi: 10.1016/j.bbamcr.2010.01.022. [DOI] [PubMed] [Google Scholar]
- Hubner A, Yang X, Nolen DM, Popova TG, Cabello FC, Norgard MV. Expression of Borrelia burgdorferi OspC and DbpA is controlled by a RpoN-RpoS regulatory pathway. Proc Natl Acad Sci U S A. 2001;98:12724–12729. doi: 10.1073/pnas.231442498. [DOI] [PMC free article] [PubMed] [Google Scholar]
- Hyde JA, Shaw DK, Smith R, III, Trzeciakowski JP, Skare JT. The BosR regulatory protein of Borrelia burgdorferi interfaces with the RpoS regulatory pathway and modulates both the oxidative stress response and pathogenic properties of the Lyme disease spirochete. Mol Microbiol. 2009;74:1344–1355. doi: 10.1111/j.1365-2958.2009.06951.x. [DOI] [PMC free article] [PubMed] [Google Scholar]
- Hyde JA, Trzeciakowski JP, Skare JT. Borrelia burgdorferi alters its gene expression and antigenic profile in response to CO2 levels. J Bacteriol. 2007;189:437–445. doi: 10.1128/JB.01109-06. [DOI] [PMC free article] [PubMed] [Google Scholar]
- Iyer R, Mukherjee P, Wang K, Simons J, Wormser GP, Schwartz I. Detection of Borrelia burgdorferi nucleic acids after antibiotic treatment does not confirm viability. J Clin Microbiol. 2013;51:857–862. doi: 10.1128/JCM.02785-12. [DOI] [PMC free article] [PubMed] [Google Scholar]
- Juncker AS, Willenbrock H, Von Heijne G, Brunak S, Nielsen H, Krogh A. Prediction of lipoprotein signal peptides in Gram-negative bacteria. Protein Sci. 2003;12:1652–1662. doi: 10.1110/ps.0303703. [DOI] [PMC free article] [PubMed] [Google Scholar]
- Jutras BL, Chenail AM, Carroll DW, Miller MC, Zhu H, Bowman A, Stevenson B. Bpur, the Lyme Disease Spirochete’s PUR Domain Protein: Identification as a transcriptional modulator and characterization of nucleic acid interactions. J Biol Chem. 2013a;288:26220–26234. doi: 10.1074/jbc.M113.491357. [DOI] [PMC free article] [PubMed] [Google Scholar]
- Jutras BL, Chenail AM, Rowland CL, Carroll D, Miller MC, Bykowski T, Stevenson B. Eubacterial SpoVG homologs constitute a new family of site-specific DNA-binding proteins. PLoS One. 2013b;8:e66683. doi: 10.1371/journal.pone.0066683. [DOI] [PMC free article] [PubMed] [Google Scholar]
- Jutras BL, Verma A, Adams CA, Brissette CA, Burns LH, Whetstine CR, Bowman A, Chenail AM, Zuckert WR, Stevenson B. BpaB and EbfC DNA-binding proteins regulate production of the Lyme disease spirochete’s infection-associated Erp surface proteins. J Bacteriol. 2012;194:778–786. doi: 10.1128/JB.06394-11. [DOI] [PMC free article] [PubMed] [Google Scholar]
- Kariu T, Smith A, Yang X, Pal U. A chitin deacetylase-like protein is a predominant constituent of tick peritrophic membrane that influences the persistence of Lyme disease pathogens within the vector. PLoS One. 2013;8:e78376. doi: 10.1371/journal.pone.0078376. [DOI] [PMC free article] [PubMed] [Google Scholar]
- Katona LI, Tokarz R, Kuhlow CJ, Benach J, Benach JL. The fur homologue in Borrelia burgdorferi. J Bacteriol. 2004;186:6443–6456. doi: 10.1128/JB.186.19.6443-6456.2004. [DOI] [PMC free article] [PubMed] [Google Scholar]
- Kawabata H, Norris SJ, Watanabe H. BBE02 disruption mutants of Borrelia burgdorferi B31 have a highly transformable, infectious phenotype. Infect Immun. 2004;72:7147–7154. doi: 10.1128/IAI.72.12.7147-7154.2004. [DOI] [PMC free article] [PubMed] [Google Scholar]
- Kazmierczak MJ, Wiedmann M, Boor KJ. Alternative sigma factors and their roles in bacterial virulence. Microbiol Mol Biol Rev. 2005;69:527–543. doi: 10.1128/MMBR.69.4.527-543.2005. [DOI] [PMC free article] [PubMed] [Google Scholar]
- Kenedy MR, Lenhart TR, Akins DR. The role of Borrelia burgdorferi outer surface proteins. FEMS Immunol Med Microbiol. 2012;66:1–19. doi: 10.1111/j.1574-695X.2012.00980.x. [DOI] [PMC free article] [PubMed] [Google Scholar]
- Kostick JL, Szkotnicki LT, Rogers EA, Bocci P, Raffaelli N, Marconi RT. The diguanylate cyclase, Rrp1, regulates critical steps in the enzootic cycle of the Lyme disease spirochetes. Mol Microbiol. 2011;81:219–231. doi: 10.1111/j.1365-2958.2011.07687.x. [DOI] [PMC free article] [PubMed] [Google Scholar]
- Kraiczy P, Stevenson B. Complement regulator-acquiring surface proteins of Borrelia burgdorferi: Structure, function and regulation of gene expression. Ticks Tick Borne Dis. 2013;4:26–34. doi: 10.1016/j.ttbdis.2012.10.039. [DOI] [PMC free article] [PubMed] [Google Scholar]
- Kuehn BM. CDC estimates 300,000 US cases of Lyme disease annually. JAMA. 2013;310:1110. doi: 10.1001/jama.2013.278331. [DOI] [PubMed] [Google Scholar]
- Kumar M, Yang X, Coleman AS, Pal U. BBA52 facilitates Borrelia burgdorferi transmission from feeding ticks to murine hosts. J Infect Dis. 2010;201:1084–1095. doi: 10.1086/651172. [DOI] [PMC free article] [PubMed] [Google Scholar]
- Kurtenbach K, Hanincova K, Tsao JI, Margos G, Fish D, Ogden NH. Fundamental processes in the evolutionary ecology of Lyme borreliosis. Nat Rev Microbiol. 2006;4:660–669. doi: 10.1038/nrmicro1475. [DOI] [PubMed] [Google Scholar]
- Lange BM, Rujan T, Martin W, Croteau R. Isoprenoid biosynthesis: the evolution of two ancient and distinct pathways across genomes. Proc Natl Acad Sci U S A. 2000;97:13172–13177. doi: 10.1073/pnas.240454797. [DOI] [PMC free article] [PubMed] [Google Scholar]
- Lengeler JW, Jahreis K. Bacterial PEP-dependent carbohydrate: phosphotransferase systems couple sensing and global control mechanisms. Contrib Microbiol. 2009;16:65–87. doi: 10.1159/000219373. [DOI] [PubMed] [Google Scholar]
- Li C, Bakker RG, Motaleb MA, Sartakova ML, Cabello FC, Charon NW. Asymmetrical flagellar rotation in Borrelia burgdorferi nonchemotactic mutants. Proc Natl Acad Sci U S A. 2002;99:6169–6174. doi: 10.1073/pnas.092010499. [DOI] [PMC free article] [PubMed] [Google Scholar]
- Li X, Pal U, Ramamoorthi N, Liu X, Desrosiers DC, Eggers CH, Anderson JF, Radolf JD, Fikrig E. The Lyme disease agent Borrelia burgdorferi requires BB0690, a Dps homologue, to persist within ticks. Mol Microbiol. 2007;63:694–710. doi: 10.1111/j.1365-2958.2006.05550.x. [DOI] [PubMed] [Google Scholar]
- Medrano MS, Ding Y, Wang XG, Lu P, Coburn J, Hu LT. Regulators of expression of the oligopeptide permease A proteins of Borrelia burgdorferi. J Bacteriol. 2007;189:2653–2659. doi: 10.1128/JB.01760-06. [DOI] [PMC free article] [PubMed] [Google Scholar]
- Miller CL, Karna SL, Seshu J. Borrelia host adaptation regulator (BadR) regulates rpoS to modulate host adaptation and virulence factors in Borrelia burgdorferi. Mol Microbiol. 2013;88:105–124. doi: 10.1111/mmi.12171. [DOI] [PMC free article] [PubMed] [Google Scholar]
- Moat AG, Foster JW, Spector MP. Microbial Physiology. Wiley-Liss; New York: 2002. [Google Scholar]
- Monahan LG, Hajduk IV, Blaber SP, Charles IG, Harry EJ. Coordinating bacterial cell division with nutrient availability: a role for glycolysis. MBio. 2014;5:e00935–e00914. doi: 10.1128/mBio.00935-14. [DOI] [PMC free article] [PubMed] [Google Scholar]
- Montgomery RR, Malawista SE, Feen KJ, Bockenstedt LK. Direct demonstration of antigenic substitution of Borrelia burgdorferi ex vivo: exploration of the paradox of the early immune response to outer surface proteins A and C in Lyme disease. J Exp Med. 1996;183:261–269. doi: 10.1084/jem.183.1.261. [DOI] [PMC free article] [PubMed] [Google Scholar]
- Motaleb MA, Sultan SZ, Miller MR, Li C, Charon NW. CheY3 of Borrelia burgdorferi is the key response regulator essential for chemotaxis and forms a long-lived phosphorylated Intermediate. J Bacteriol. 2011;193:3332–3341. doi: 10.1128/JB.00362-11. [DOI] [PMC free article] [PubMed] [Google Scholar]
- Mulay VB, Caimano MJ, Iyer R, Dunham-Ems S, Liveris D, Petzke MM, Schwartz I, Radolf JD. Borrelia burgdorferi bba74 is expressed exclusively during tick feeding and is regulated by both arthropod- and mammalian host-specific signals. J Bacteriol. 2009;191:2783–2794. doi: 10.1128/JB.01802-08. [DOI] [PMC free article] [PubMed] [Google Scholar]
- Ohnishi J, Piesman J, de Silva AM. Antigenic and genetic heterogeneity of Borrelia burgdorferi populations transmitted by ticks. Proc Natl Acad Sci U S A. 2001;98:670–675. doi: 10.1073/pnas.98.2.670. [DOI] [PMC free article] [PubMed] [Google Scholar]
- Ojaimi C, Brooks C, Casjens S, Rosa P, Elias A, Barbour A, Jasinskas A, Benach J, Katona L, Radolf J, Caimano M, Skare J, Swingle K, Akins D, Schwartz I. Profiling of temperature-induced changes in Borrelia burgdorferi gene expression by using whole genome arrays. Infect Immun. 2003;71:1689–1705. doi: 10.1128/IAI.71.4.1689-1705.2003. [DOI] [PMC free article] [PubMed] [Google Scholar]
- Ouyang Z, Deka RK, Norgard MV. BosR (BB0647) controls the RpoN-RpoS regulatory pathway and virulence expression in Borrelia burgdorferi by a novel DNA-binding mechanism. PLoS Pathog. 2011;7:e1001272. doi: 10.1371/journal.ppat.1001272. [DOI] [PMC free article] [PubMed] [Google Scholar]
- Ouyang Z, Kumar M, Kariu T, Haq S, Goldberg M, Pal U, Norgard MV. BosR (BB0647) governs virulence expression in Borrelia burgdorferi. Mol Microbiol. 2009;74:1331–1343. doi: 10.1111/j.1365-2958.2009.06945.x. [DOI] [PMC free article] [PubMed] [Google Scholar]
- Ouyang Z, Zhou J, Norgard MV. CsrA (BB0184) is not involved in activation of the RpoN-RpoS regulatory pathway in Borrelia burgdorferi. Infect Immun. 2014;82:1511–1522. doi: 10.1128/IAI.01555-13. [DOI] [PMC free article] [PubMed] [Google Scholar]
- Pal U, Dai J, Li X, Neelakanta G, Luo P, Kumar M, Wang P, Yang X, Anderson JF, Fikrig E. A differential role for BB0365 in the persistence of Borrelia burgdorferi in mice and ticks. J Infect Dis. 2008;197:148–155. doi: 10.1086/523764. [DOI] [PubMed] [Google Scholar]
- Pal U, Fikrig E. Tick Interactions. In: Samuels DS, Radolf JD, editors. Borrelia: Molecular Biology, Host Interactions, and Pathogenesis. Norfold, UK: Caister Academic Press; 2010. pp. 279–298. [Google Scholar]
- Pappas CJ, Iyer R, Petze MM, Caimano MJ, Radolf JD, Schwartz I. Borrelia burgdorferi requires glycerol for maximum fitness during the tick phase of the enzootic cycle. PLoS Pathog. 2011;7:e1002102. doi: 10.1371/journal.ppat.1002102. [DOI] [PMC free article] [PubMed] [Google Scholar]
- Parsonage D, Desrosiers DC, Hazlett KR, Sun Y, Nelson KJ, Cox DL, Radolf JD, Poole LB. Broad specificity AhpC-like peroxiredoxin and its thioredoxin reductant in the sparse antioxidant defense system of Treponema pallidum. Proc Natl Acad Sci U S A. 2010;107:6240–6245. doi: 10.1073/pnas.0910057107. [DOI] [PMC free article] [PubMed] [Google Scholar]
- Piesman J, Oliver JR, Sinsky RJ. Growth kinetics of the Lyme disease spirochete (Borrelia burgdorferi) in vector ticks (Ixodes dammini) Am J Trop Med Hyg. 1990;42:352–357. doi: 10.4269/ajtmh.1990.42.352. [DOI] [PubMed] [Google Scholar]
- Piesman J, Schneider BS, Zeidner NS. Use of quantitative PCR to measure density of Borrelia burgdorferi in the midgut and salivary glands of feeding tick vectors. J Clin Microbiol. 2001;39:4145–4148. doi: 10.1128/JCM.39.11.4145-4148.2001. [DOI] [PMC free article] [PubMed] [Google Scholar]
- Porter SL, Wadhams GH, Armitage JP. Signal processing in complex chemotaxis pathways. Nat Rev Microbiol. 2011;9:153–165. doi: 10.1038/nrmicro2505. [DOI] [PubMed] [Google Scholar]
- Purser JE, Lawrenz MB, Caimano MJ, Howell JK, Radolf JD, Norris SJ. A plasmid-encoded nicotinamidase (PncA) is essential for infectivity of Borrelia burgdorferi in a mammalian host. Mol Microbiol. 2003;48:753–764. doi: 10.1046/j.1365-2958.2003.03452.x. [DOI] [PubMed] [Google Scholar]
- Radolf JD, Caimano MJ, Stevenson B, Hu LT. Of ticks, mice and men: understanding the dual-host lifestyle of Lyme disease spirochaetes. Nat Rev Microbiol. 2012;10:87–99. doi: 10.1038/nrmicro2714. [DOI] [PMC free article] [PubMed] [Google Scholar]
- Raju BV, Esteve-Gassent MD, Karna SL, Miller CL, Van Laar TA, Seshu J. Oligopeptide permease A5 modulates vertebrate host-specific adaptation of Borrelia burgdorferi. Infect Immun. 2011;79:3407–3420. doi: 10.1128/IAI.05234-11. [DOI] [PMC free article] [PubMed] [Google Scholar]
- Revel AT, Talaat AM, Norgard MV. DNA microarray analysis of differential gene expression in Borrelia burgdorferi, the Lyme disease spirochete. Proc Natl Acad Sci U S A. 2002;99:1562–1567. doi: 10.1073/pnas.032667699. [DOI] [PMC free article] [PubMed] [Google Scholar]
- Rhodes RG, Atoyan JA, Nelson DR. The chitobiose transporter, chbC, is required for chitin utilization in Borrelia burgdorferi. BMC Microbiol. 2010;10:21. doi: 10.1186/1471-2180-10-21. [DOI] [PMC free article] [PubMed] [Google Scholar]
- Ribeiro JM, Mather TN, Piesman J, Spielman A. Dissemination and salivary delivery of Lyme disease spirochetes in vector ticks (Acari: Ixodidae) J Med Entomol. 1987;24:201–205. doi: 10.1093/jmedent/24.2.201. [DOI] [PubMed] [Google Scholar]
- Ristow LC, Miller HE, Padmore LJ, Chettri R, Salzman N, Caimano MJ, Rosa PA, Coburn J. The b3-integrin ligand of Borrelia burgdorferi is critical for infection of mice but not ticks. Mol Microbiol. 2012;85:1105–1118. doi: 10.1111/j.1365-2958.2012.08160.x. [DOI] [PMC free article] [PubMed] [Google Scholar]
- Rogers EA, Terekhova D, Zhang HM, Hovis KM, Schwartz I, Marconi RT. Rrp1, a cyclic-di-GMP-producing response regulator, is an important regulator of Borrelia burgdorferi core cellular functions. Mol Microbiol. 2009;71:1551–1573. doi: 10.1111/j.1365-2958.2009.06621.x. [DOI] [PMC free article] [PubMed] [Google Scholar]
- Saier MH, Jr, Eng BH, Fard S, Garg J, Haggerty DA, Hutchinson WJ, Jack DL, Lai EC, Liu HJ, Nusinew DP, Omar AM, Pao SS, Paulsen IT, Quan JA, Sliwinski M, Tseng TT, Wachi S, Young GB. Phylogenetic characterization of novel transport protein families revealed by genome analyses. Biochim Biophys Acta. 1999;1422:1–56. doi: 10.1016/s0304-4157(98)00023-9. [DOI] [PubMed] [Google Scholar]
- Samuels DS. Electrotransformation of the spirochete Borrelia burgdorferi. Methods Mol Biol. 1995;47:253–259. doi: 10.1385/0-89603-310-4:253. [DOI] [PMC free article] [PubMed] [Google Scholar]
- Samuels DS. Gene regulation in Borrelia burgdorferi. Annu Rev Microbiol. 2011;65:479–499. doi: 10.1146/annurev.micro.112408.134040. [DOI] [PubMed] [Google Scholar]
- Schuijt TJ, Hovius JW, van der Poll T, van Dam AP, Fikrig E. Lyme borreliosis vaccination: the facts, the challenge, the future. Trends Parasitol. 2011;27:40–47. doi: 10.1016/j.pt.2010.06.006. [DOI] [PubMed] [Google Scholar]
- Schwan TG, Piesman J. Temporal changes in outer surface proteins A and C of the Lyme disease-associated spirochete, Borrelia burgdorferi, during the chain of infection in ticks and mice. J Clin Microbiol. 2000;38:382–388. doi: 10.1128/jcm.38.1.382-388.2000. [DOI] [PMC free article] [PubMed] [Google Scholar]
- Schwan TG, Piesman J. Vector interactions and molecular adaptations of lyme disease and relapsing fever spirochetes associated with transmission by ticks. Emerg Infect Dis. 2002;8:115–121. doi: 10.3201/eid0802.010198. [DOI] [PMC free article] [PubMed] [Google Scholar]
- Schwan TG, Piesman J, Golde WT, Dolan MC, Rosa PA. Induction of an outer surface protein on Borrelia burgdorferi during tick feeding. Proc Natl Acad Sci U S A. 1995;92:2909–2913. doi: 10.1073/pnas.92.7.2909. [DOI] [PMC free article] [PubMed] [Google Scholar]
- Schwartz I, Wormser GP, Schwartz JJ, Cooper D, Weissensee P, Gazumyan A, Zimmermann E, Goldberg NS, Bittker S, Campbell GL, Pavia CS. Diagnosis of early Lyme disease by polymerase chain reaction amplification and culture of skin biopsies from erythema migrans lesions. J Clin Microbiol. 1992;30:3082–3088. doi: 10.1128/jcm.30.12.3082-3088.1992. [DOI] [PMC free article] [PubMed] [Google Scholar]
- Setubal JC, Reis M, Matsunaga J, Haake DA. Lipoprotein computational prediction in spirochaetal genomes. Microbiology. 2006;152:113–121. doi: 10.1099/mic.0.28317-0. [DOI] [PMC free article] [PubMed] [Google Scholar]
- Shah P, Swiatlo E. A multifaceted role for polyamines in bacterial pathogens. Mol Microbiol. 2008;68:4–16. doi: 10.1111/j.1365-2958.2008.06126.x. [DOI] [PubMed] [Google Scholar]
- Shao L, Devenport M, Jacobs-Lorena M. The peritrophic matrix of hematophagous insects. Arch Insect Biochem Physiol. 2001;47:119–125. doi: 10.1002/arch.1042. [DOI] [PubMed] [Google Scholar]
- Skare JT, Carroll JA, Yang XF, Samuels DS, Akins DR. Gene Regulation, Transcriptomics, and Proteomics. In: Samuels DS, Radolf JD, editors. Borrelia: Molecular Biology, Host Interaction, and Pathogenesis. Norfolk, UK: Caister Academic Press; 2010. pp. 67–101. [Google Scholar]
- Smith AH, Blevins JS, Bachlani GN, Yang XF, Norgard MV. Evidence that RpoS (sS) in Borrelia burgdorferi is controlled directly by RpoN (s54/sN) J Bacteriol. 2007;189:2139–2144. doi: 10.1128/JB.01653-06. [DOI] [PMC free article] [PubMed] [Google Scholar]
- Soares CA, Zeidner NS, Beard CB, Dolan MC, Dietrich G, Piesman J. Kinetics of Borrelia burgdorferi infection in larvae of refractory and competent tick vectors. J Med Entomol. 2006;43:61–67. doi: 10.1093/jmedent/43.1.61. [DOI] [PubMed] [Google Scholar]
- Sriram G, Martinez JA, McCabe ER, Liao JC, Dipple KM. Single-gene disorders: what role could moonlighting enzymes play? Am J Human Genet. 2005;76:911–924. doi: 10.1086/430799. [DOI] [PMC free article] [PubMed] [Google Scholar]
- Steere AC. Lyme disease. N Engl J Med. 2001;345:115–125. doi: 10.1056/NEJM200107123450207. [DOI] [PubMed] [Google Scholar]
- Steere AC, Coburn J, Glickstein L. The emergence of Lyme disease. J Clin Invest. 2004;113:1093–1101. doi: 10.1172/JCI21681. [DOI] [PMC free article] [PubMed] [Google Scholar]
- Stevenson B, Schwan TG, Rosa PA. Temperature-related differential expression of antigens in the Lyme disease spirochete, Borrelia burgdorferi. Infect Immun. 1995;63:4535–4539. doi: 10.1128/iai.63.11.4535-4539.1995. [DOI] [PMC free article] [PubMed] [Google Scholar]
- Suk K, Das S, Sun W, Jwang B, Barthold SW, Flavell RA, Fikrig E. Borrelia burgdorferi genes selectively expressed in the infected host. Proc Natl Acad Sci U S A. 1995;92:4269–4273. doi: 10.1073/pnas.92.10.4269. [DOI] [PMC free article] [PubMed] [Google Scholar]
- Sutcliffe IC, Harrington DJ. Pattern searches for the identification of putative lipoprotein genes in Gram-positive bacterial genomes. Microbiology. 2002;148:2065–2077. doi: 10.1099/00221287-148-7-2065. [DOI] [PubMed] [Google Scholar]
- Sze CW, Li C. Inactivation of bb0184, which encodes carbon storage regulator A, represses the infectivity of Borrelia burgdorferi. Infect Immun. 2011;79:1270–1279. doi: 10.1128/IAI.00871-10. [DOI] [PMC free article] [PubMed] [Google Scholar]
- Sze CW, Smith A, Choi YH, Yang X, Pal U, Yu A, Li C. Study of the response regulator Rrp1 reveals its regulatory role in chitobiose utilization and virulence of Borrelia burgdorferi. Infect Immun. 2013;81:1775–1787. doi: 10.1128/IAI.00050-13. [DOI] [PMC free article] [PubMed] [Google Scholar]
- Sze CW, Zhang K, Kariu T, Pal U, Li C. Borrelia burgdorferi needs chemotaxis to establish infection in mammals and to accomplish its enzootic cycle. Infect Immun. 2012;80:2485–2492. doi: 10.1128/IAI.00145-12. [DOI] [PMC free article] [PubMed] [Google Scholar]
- Tabor CW, Tabor H. Polyamines in microorganisms. Microbiol Rev. 1985;49:81–99. doi: 10.1128/mr.49.1.81-99.1985. [DOI] [PMC free article] [PubMed] [Google Scholar]
- Tilly K, Elias AF, Errett J, Fischer E, Iyer R, Schwartz I, Bono JL, Rosa P. Genetics and regulation of chitobiose utilization in Borrelia burgdorferi. J Bacteriol. 2001;183:5544–5553. doi: 10.1128/JB.183.19.5544-5553.2001. [DOI] [PMC free article] [PubMed] [Google Scholar]
- Tilly K, Grimm D, Bueschel DM, Krum JG, Rosa P. Infectious cycle analysis of a Borrelia burgdorferi mutant defective in transport of chitobiose, a tick cuticle component. Vector Borne Zoonotic Dis. 2004;4:159–168. doi: 10.1089/1530366041210738. [DOI] [PubMed] [Google Scholar]
- Tilly K, Rosa PA, Stewart PE. Biology of infection with Borrelia burgdorferi. Infect Dis Clin North Am. 2008;22:217–234. doi: 10.1016/j.idc.2007.12.013. [DOI] [PMC free article] [PubMed] [Google Scholar]
- Toledo A, Coleman JL, Kuhlow CJ, Crowley JT, Benach JL. The enolase of Borrelia burgdorferi is a plasminogen receptor released in outer membrane vesicles. Infect Immun. 2012;80:359–368. doi: 10.1128/IAI.05836-11. [DOI] [PMC free article] [PubMed] [Google Scholar]
- Van Laar TA, Lin YH, Miller CL, Karna SL, Chambers JP, Seshu J. Effect of levels of acetate on the mevalonate pathway of Borrelia burgdorferi. PLoS One. 2012;7:e38171. doi: 10.1371/journal.pone.0038171. [DOI] [PMC free article] [PubMed] [Google Scholar]
- von Lackum K, Stevenson B. Carbohydrate utilization by the Lyme borreliosis spirochete, Borrelia burgdorferi. FEMS Microbiol Lett. 2005;243:173–179. doi: 10.1016/j.femsle.2004.12.002. [DOI] [PubMed] [Google Scholar]
- Wallich R, Brenner C, Kramer MD, Simon MM. Molecular cloning and immunological characterization of a novel linear-plasmid-encoded gene, pG, of Borrelia burgdorferi expressed only in vivo. Infect Immun. 1995;63:3327–3335. doi: 10.1128/iai.63.9.3327-3335.1995. [DOI] [PMC free article] [PubMed] [Google Scholar]
- Wang G, Iyer R, Bittker S, Cooper D, Small J, Wormser GP, Schwartz I. Variations in Barbour-Stoenner-Kelly culture medium modulate infectivity and pathogenicity of Borrelia burgdorferi clinical isolates. Infect Immun. 2004a;72:6702–6706. doi: 10.1128/IAI.72.11.6702-6706.2004. [DOI] [PMC free article] [PubMed] [Google Scholar]
- Wang G, Ojaimi C, Iyer R, Saksenberg V, McClain SA, Wormser GP, Schwartz I. Impact of genotypic variation of Borrelia burgdorferi sensu stricto on kinetics of dissemination and severity of disease in C3H/HeJ mice. Infect Immun. 2001;69:4303–4312. doi: 10.1128/IAI.69.7.4303-4312.2001. [DOI] [PMC free article] [PubMed] [Google Scholar]
- Wang P, Dadhwal P, Cheng Z, Zianni MR, Rikihisa Y, Liang FT, Li X. Borrelia burgdorferi oxidative stress regulator BosR directly represses lipoproteins primarily expressed in the tick during mammalian infection. Mol Microbiol. 2013;89:1140–1153. doi: 10.1111/mmi.12337. [DOI] [PMC free article] [PubMed] [Google Scholar]
- Wang XG, Kidder JM, Scagliotti JP, Klempner MS, Noring R, Hu LT. Analysis of differences in the functional properties of the substrate binding proteins of the Borrelia burgdorferi oligopeptide permease (Opp) operon. J Bacteriol. 2004b;186:51–60. doi: 10.1128/JB.186.1.51-60.2004. [DOI] [PMC free article] [PubMed] [Google Scholar]
- Wang XG, Lin B, Kidder JM, Telford S, Hu LT. Effects of environmental changes on expression of the oligopeptide permease (opp) genes of Borrelia burgdorferi. J Bacteriol. 2002;184:6198–6206. doi: 10.1128/JB.184.22.6198-6206.2002. [DOI] [PMC free article] [PubMed] [Google Scholar]
- White RW. Biosynthesis of isoprenoids in bacteria. In: Neidhardt FC, editor. Escherichia coli and Salmonella. Washington DC: ASM Press; 1996. pp. 637–641. [Google Scholar]
- Wilding EI, Kim DY, Bryant AP, Gwynn MN, Lunsford RD, McDevitt D, Myers JE, Jr, Rosenberg M, Sylvester D, Stauffacher CV, Rodwell VW. Essentiality, expression, and characterization of the class II 3-hydroxy-3-methylglutaryl coenzyme A reductase of Staphylococcus aureus. J Bacteriol. 2000;182:5147–5152. doi: 10.1128/jb.182.18.5147-5152.2000. [DOI] [PMC free article] [PubMed] [Google Scholar]
- Wolfe AJ. The acetate switch. Microbiol Mol Biol Rev. 2005;69:12–50. doi: 10.1128/MMBR.69.1.12-50.2005. [DOI] [PMC free article] [PubMed] [Google Scholar]
- Wolfe AJ. Physiologically relevant small phosphodonors link metabolism to signal transduction. Curr Opin Microbiol. 2010;13:204–209. doi: 10.1016/j.mib.2010.01.002. [DOI] [PMC free article] [PubMed] [Google Scholar]
- Wyss C, Emert P. Borrelia burgdorferi is an adenine and spermidine auxotroph. Microbial Ecol Health Dis. 1996;9:181–185. [Google Scholar]
- Xu H, Caimano MJ, Lin T, He M, Radolf JD, Norris SJ, Gheradini F, Wolfe AJ, Yang XF. Role of acetyl-phosphate in activation of the Rrp2-RpoN-RpoS pathway in Borrelia burgdorferi. PLoS Pathog. 2010;6:e1001104. doi: 10.1371/journal.ppat.1001104. [DOI] [PMC free article] [PubMed] [Google Scholar]
- Xu H, Raddi G, Liu J, Charon NW, Li C. Chemoreceptors and flagellar motors are subterminally located in close proximity at the two cell poles in spirochetes. J Bacteriol. 2011;193:2652–2656. doi: 10.1128/JB.01530-10. [DOI] [PMC free article] [PubMed] [Google Scholar]
- Yang X, Goldberg MS, Popova TG, Schoeler GB, Wikel SK, Hagman KE, Norgard MV. Interdependence of environmental factors influencing reciprocal patterns of gene expression in virulent Borrelia burgdorferi. Mol Microbiol. 2000;37:1470–1479. doi: 10.1046/j.1365-2958.2000.02104.x. [DOI] [PubMed] [Google Scholar]
- Yang X, Smith AA, Williams MS, Pal U. A dityrosine network mediated by dual oxidase and peroxidase influences the persistence of Lyme disease pathogens within the vector. J Biol Chem. 2014;289:12813–12822. doi: 10.1074/jbc.M113.538272. [DOI] [PMC free article] [PubMed] [Google Scholar]
- Yang XF, Alani SM, Norgard MV. The response regulator Rrp2 is essential for the expression of major membrane lipoproteins in Borrelia burgdorferi. Proc Natl Acad Sci U S A. 2003;100:11001–11006. doi: 10.1073/pnas.1834315100. [DOI] [PMC free article] [PubMed] [Google Scholar]
- Yang XF, Pal U, Alani SM, Fikrig E, Norgard MV. Essential role for OspA/B in the life cycle of the Lyme disease spirochete. J Exp Med. 2004;199:641–648. doi: 10.1084/jem.20031960. [DOI] [PMC free article] [PubMed] [Google Scholar]
- Zhang K, Liu J, Tu Y, Xu H, Charon NW, Li C. Two CheW coupling proteins are essential in a chemosensory pathway of Borrelia burgdorferi. Mol Microbiol. 2012;85:782–794. doi: 10.1111/j.1365-2958.2012.08139.x. [DOI] [PMC free article] [PubMed] [Google Scholar]
- Zhong W, Stehle T, Museteanu C, Siebers A, Gern L, Kramer M, Wallich R, Simon MM. Therapeutic passive vaccination against chronic Lyme disease in mice. Proc Natl Acad Sci U S A. 1997;94:12533–12538. doi: 10.1073/pnas.94.23.12533. [DOI] [PMC free article] [PubMed] [Google Scholar]
- Zung JL, Lewengrub S, Rudzinska MA, Spielman A, Telford SR, Piesman J. Fine structural evidence for the penetration of the Lyme disease spirochete Borrelia burgdorferi through the gut and salivary tissues of Ixodes dammini. Can J Zool. 1989;67:1737–1748. [Google Scholar]
Associated Data
This section collects any data citations, data availability statements, or supplementary materials included in this article.
Supplementary Materials
Figure S1. Assessment of B. burgdorferi RNA amplification. One μg of RNA isolated from in vitro-cultivated B. burgdorferi (equivalent to the yield from 2 × 10⁷ cells) was amplified as described in Experimental Procedures. Five μg of the resultant aRNA and 5 μg of unamplified RNA were co-hybridized to microarrays; this represents a comparison of RNA isolated from 3 × 10⁵ cells (amplified) to that obtained from 1 × 10⁸ cells (unamplified). Background-subtracted pixel intensities for each spotted ORF were obtained as described in Material and Methods. Regression analysis yielded an R2 value of 0.82.
Figure S2. Correlation of microarray and qRT-PCR data for selected genes. Microarray pixel intensities and transcript copies for genes listed in Table 1 were determined as described in Experimental Procedures. Regression analysis of transcript levels for these genes in all three biological conditions as determined by either qRT-PCR or microarray, after removal of the circled data points that were designated as outliers, yielded an R2 value of 0.83.
Figure S3. Suicide plasmid pMC2498. Map of the suicide vector, pMC2498, used to insert the gentamicin-resistance marker (PflgB-aacC1) and gfp (PflaB-gfp) into the bbb20-bbb21 intergenic region of the endogenous cp26 in B. burgdorferi strain B31 5A4 NP1.