

Abstract
Study Objectives:
Despite differences between American Academy of Sleep Medicine (AASM) and Rechtschaffen and Kales scoring criteria, normative values following the current AASM criteria are lacking. We investigated sleep and respiratory variables in healthy adults over the lifespan, and established polysomnographic normative values according to current standards.
Design:
Prospective polysomnographic investigation.
Setting:
Academic referral hospital sleep laboratory.
Participants:
One hundred healthy sleepers aged 19–77 y were selected from a representative population sample by a two-step screening.
Interventions:
N/A.
Measurements and Results:
All subjects underwent one full-night polysomnography. Sleep and arousals were scored according to AASM standards. Respiration was scored according to AASM 2007 and 2012 criteria in order to compare both methods. Percentile curves showed age-related differences in sleep architecture: a decrease was found for sleep efficiency [≤ 30 y: 87.0 (71.9–94.1)% versus > 60 y: 79.7 (44.5–90.9)%], total sleep time [≤ 30 y: 413.5 (345.6–451.9) min versus > 60 y: 378.3 (216.0–440.0) min], the percentages of N3 [≤ 30 y 20.7 (15.2–37.5)% versus > 60 y: 14.9 (2.4–35.6)%] and rapid eye movement sleep [≤ 30 y 15.5 (7.5–23.6)% versus. > 60 y: 10.3 (1.9–21.9)%], whereas the percentage of wake time after sleep onset increased with age [≤ 30 y 6.0 (1.9–22.8)% versus > 60 y: 15.2 (6.3–48.7)%]. The apnea-hypopnea index (AHI) was higher when applying the AASM 2012 criteria [AHI AASM 2007 0.7 (0.0–21.5)/h versus 2012: 1.7 (0.0–25)/h; P < 0.001]. Eight percent of subjects had an AHI > 15/h.
Conclusions:
This study provides normative data on sleep macrostructure, microstructure, and respiration in adults following AASM standards. Furthermore, we demonstrated that respiration scoring according to AASM 2012 results in higher AHIs, and challenge the use of age-independent respiratory cutoff values.
Citation:
Mitterling T, Högl B, Schönwald SV, Hackner H, Gabelia D, Biermayr M, Frauscher B. Sleep and respiration in 100 healthy Caucasian sleepers—a polysomnographic study according to American Academy of Sleep Medicine standards. SLEEP 2015;38(6):867–875.
Keywords: gender, normative, polysomnography, sleep architecture, sleep disordered breathing
INTRODUCTION
Up to now only seven studies on normative values of sleep or respiration reporting results of at least 100 healthy subjects have been published.1–7 All of these studies were performed before the introduction of the currently valid criteria for the recording and scoring of sleep.8,9 Especially older studies were published before the introduction of current technologies, and results were exclusively based on electroencephalography (EEG).1–4 The existing studies on normative values for respiratory indices are difficult to compare, on the one hand because of the technology used in older publications, and on the other hand because of the marked differences in the applied scoring criteria for hypopneas.6,7 Up to now only one study on respiration during sleep in healthy subjects used current technology and criteria that were similar to American Academy of Sleep Medicine (AASM) 2012 version 2.0 criteria.7 Normative values, however, following the AASM 2012 version 2.0 scoring criteria do not exist.
Because several studies have demonstrated that application of different scoring criteria has a significant influence on the outcome of the reported sleep or respiratory values,7,10,11 normative data derived from older publications cannot be adopted for AASM 2012 version 2.0, and a comparison with current results must be made with caution. In this light, the aim of the current study was to investigate objective sleep, arousal, and respiratory parameters in healthy adults, and to establish polysomnographic normative values according to currently valid AASM criteria.8 Because during the progress of this work, a revision of the AASM criteria was published, which major difference was exhibited in the scoring of respiratory events, respiration was rescored according to AASM 2012 version 2.0 criteria9 to compare both methods.
METHODS
Study Participants
This study was part of a large polysomnographic evaluation of sleep in healthy normal study participants.12 The findings on motor activity during normal sleep and subjective sleep parameters have been published elsewhere.12,13 The data on sexand age-related changes of sleep macrostructure (sleep stages), sleep microstructure (arousals), and respiration have not been published, and these data derive from the same cohort of 100 healthy sleepers.
All potential candidates, who were recruited from an existing population sample representative for the population of Tyrol/ Austria, underwent a two-step screening process consisting of a telephone interview and a face-to-face semi-structured 1-h interview including a complete neurological examination (for details see Frauscher et al. 2014).12 All eligible subjects had to be free of any relevant sleep disorder according to the International Classification of Sleep Disorders,14 especially insomnia, excessive daytime sleepiness as defined by an Epworth Sleepiness Scale score > 1015 and suspected sleep related breathing disorder defined as a positive history of cessation of breath during the night observed by the participant or bed partner. In addition, a body mass index (BMI) of more than 30 kg/m2, use of any psychiatric or neurological medication, as well as any neurological, psychiatric, or relevant general medical disease represented exclusion criteria.12
One hundred ten of 400 contacted subjects were eligible to proceed to step two. In step two, 10 subjects had to be omitted from the study because of increased body mass index > 30 kg/ m2 (n = 4), drop out (n = 2), hepatitis C (n = 1), major depression (n = 1), spastic cerebral palsy (n = 1), and sick sinus syndrome (n = 1). In total, 100 healthy sleepers (60 women, 40 men) were included in the study. All participants were instructed to keep their usual sleep-wake schedule prior to investigation in the sleep laboratory.
The median age at the time of polysomnography (PSG) was 43 (19–77) y. The subjects were divided in five different age groups: subjects younger than 30 y (total 20; 9 women, 11 men), subjects between 31 and 40 y (total 21; 10 women, 11 men), subjects between 41 and 50 y (total 20; 15 women, 5 men), subjects between 51 and 60 y (total 15; 9 women, 6 men), and subjects older than 60 y (total 24; 17 women, 7 men).
This study was approved by the local ethical committee of Innsbruck Medical University and all subjects gave written informed consent.
Polysomnographic Recording
All subjects underwent 1 night of 8-h video-PSG (vPSG) (Brain RT, OSG Belgium Rumst) according to current standards8 as well as an extended electromyography (EMG) montage. Video-PSG included EEG (F3, F4, C3, C4, O1, O2, M1, and M2 electrodes), electrooculography (vertical and horizontal eye movements), EMG (mental, both flexor digitorum superficialis muscles, both anterior tibialis muscles), and cardiorespiratory recording (single-channel electrocardiography, nasal airflow [thermocouple]), nasal pressure transducer, tracheal microphone, thoracic and abdominal respiratory movements [piezo], transcutaneous oxygen saturation).
The EEG signal was recorded with a sampling rate of 250 Hz, the low-frequency filter was 0.53 Hz, and the high-frequency filter was 70 Hz. Routine bipolar surface EMG according to SINBAR (Sleep Innsbruck Barcelona) criteria16 was recorded with a sampling rate of 1,000 Hz, the low-frequency filter was 50 Hz, and the high-frequency filter was 300 Hz. The nasal pressure transducer was recorded with a sampling rate of 250 Hz. The thermistor, thoracic, and abdominal respiratory movements were recorded with a sampling rate of 25 Hz.
Analysis of Sleep, Arousals, and Respiratory Events
The scoring of sleep macrostructure, microstructure, and respiration was performed visually according to the 2007 AASM criteria by the same board-certified scorers (sleep staging: BF, arousal scoring: SVS, respiration: HH).8
During the progression of this study, the scoring criteria for sleep and associated events of the AASM in the version of 2007 were revised and published as the 2012 version 2.0.8,9 Consequently, respiration was rescored according to the 2012 2.0 version to compare those two methods by the same board-certified sleep scorer blinded for the outcome of the scoring. The scoring of respiratory events according to AASM 2007 was done in the recommended way.8
Statistics
Statistics were calculated with SPSS 19.0 for Windows (IBM Corp., Armonk, NY, USA). All data were tested for normal distribution using the Kolmogorov-Smirnov test. Participants were grouped into subjects ≤ 30 y, 31–40 y, 41–50 y, 51–60 y, and subjects older than 60 y. Because data were not normally distributed, data are given as median and range in the text and tables. For group-comparisons, nonparametric statistics (Mann-Whitney U test in case of two groups, Kruskal-Wallis test in case of more than two groups) were applied. For categorical variables, chi-square tests were performed. For analysis of combined variables, the Wilcoxon rank-sum test was applied. To account for sex- and age-dependent changes of various rates of polysomnographic, arousal, and respiratory variables, a linear regression analysis was calculated. For the linear regression analysis, variables were naturally log-transformed, as rates of polysomnographic, arousal, and respiratory variables were not normally distributed. A P value less than 0.05 was considered to indicate statistical significance.
In order to establish cutoff values for which 90% of subjects were above or 10% of subjects were below, we calculated the 10th and 90th percentiles (P10 and P90, respectively) for each age group. Percentile curves were obtained by using the least mean squares method.17 For graphical presentation, the 25th, 50th, and 75th percentiles are shown.
RESULTS
General Sleep Data
Table 1 provides the polysomnographic data for the entire study sample. Age-related changes of evaluated sleep parameters are outlined in Tables 2 and 3 and Figure 1A–1G as well as in the supplemental material. Percentile curves showed that sleep architecture differed between decades. We found a decrease in sleep efficiency (P = 0.019), total sleep time (P = 0.038), the percentages of sleep stages N3 (P < 0.001) and rapid eye movement (REM) sleep (P = 0.002), whereas the percentage of wake time after sleep onset increased (P = 0.001). No differences were found for sleep period time (P = 0.251), sleep onset latency (P = 0.194), and REM sleep latency (P = 0.098) as well as the percentages of N1 (P = 0.464) and N2 sleep (P = 0.912). Adjustment for sex did not change these results (sleep efficiency: standardized coefficient: −0.352, P = 0.001; total sleep time: standardized coefficient: −0.312, P = 0.002 ; N3 sleep standardized coefficient: −0.413, P < 0.001; REM sleep: standardized coefficient: −0.292, P = 0.004; wake time after sleep onset: standardized coefficient: 0.457, P < 0.001).
Table 1.
Polysomnographic sleep and arousal data for the whole sample (n = 100).
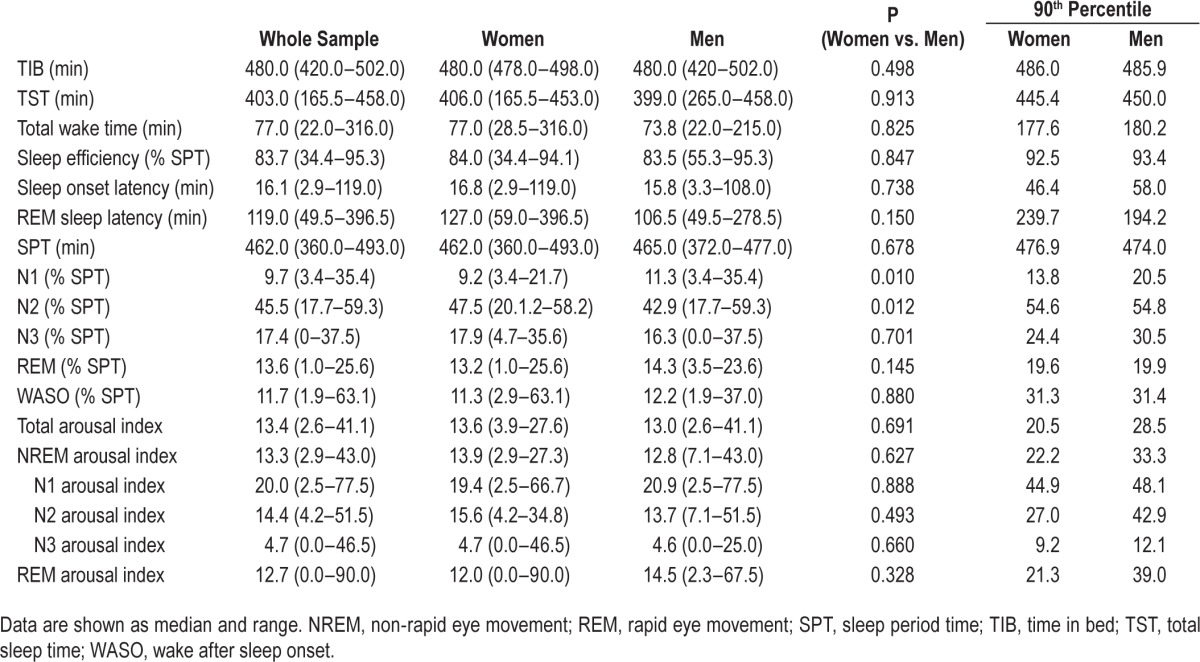
Table 2.
Polysomnographic sleep and arousal data for age decades.
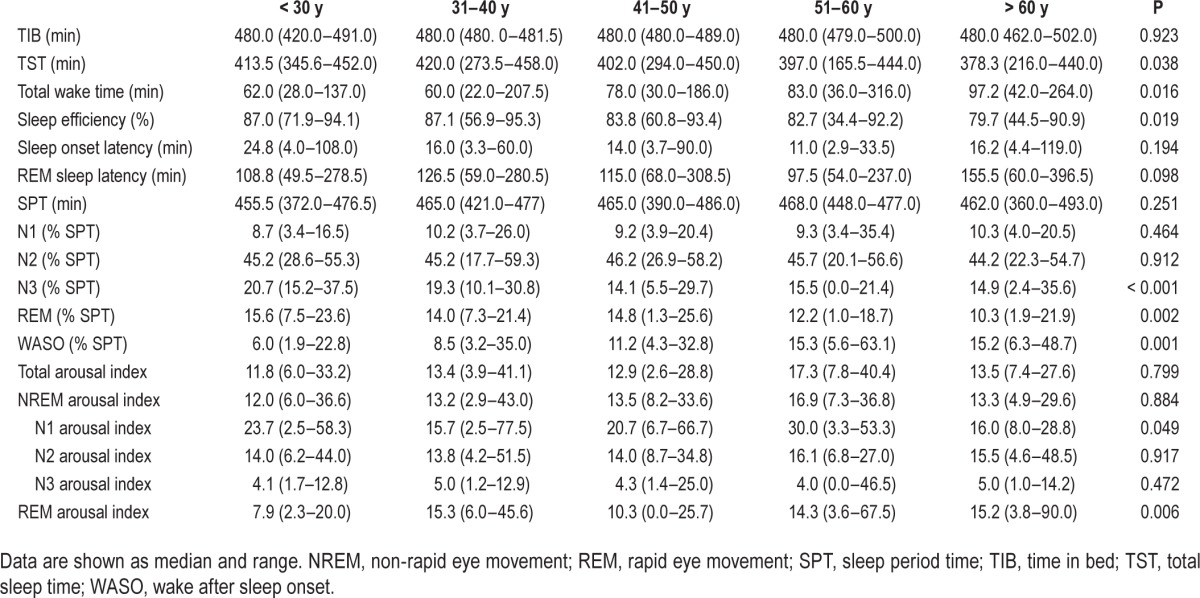
Table 3.
Ninetieth percentile of sleep and arousal data for age decades.
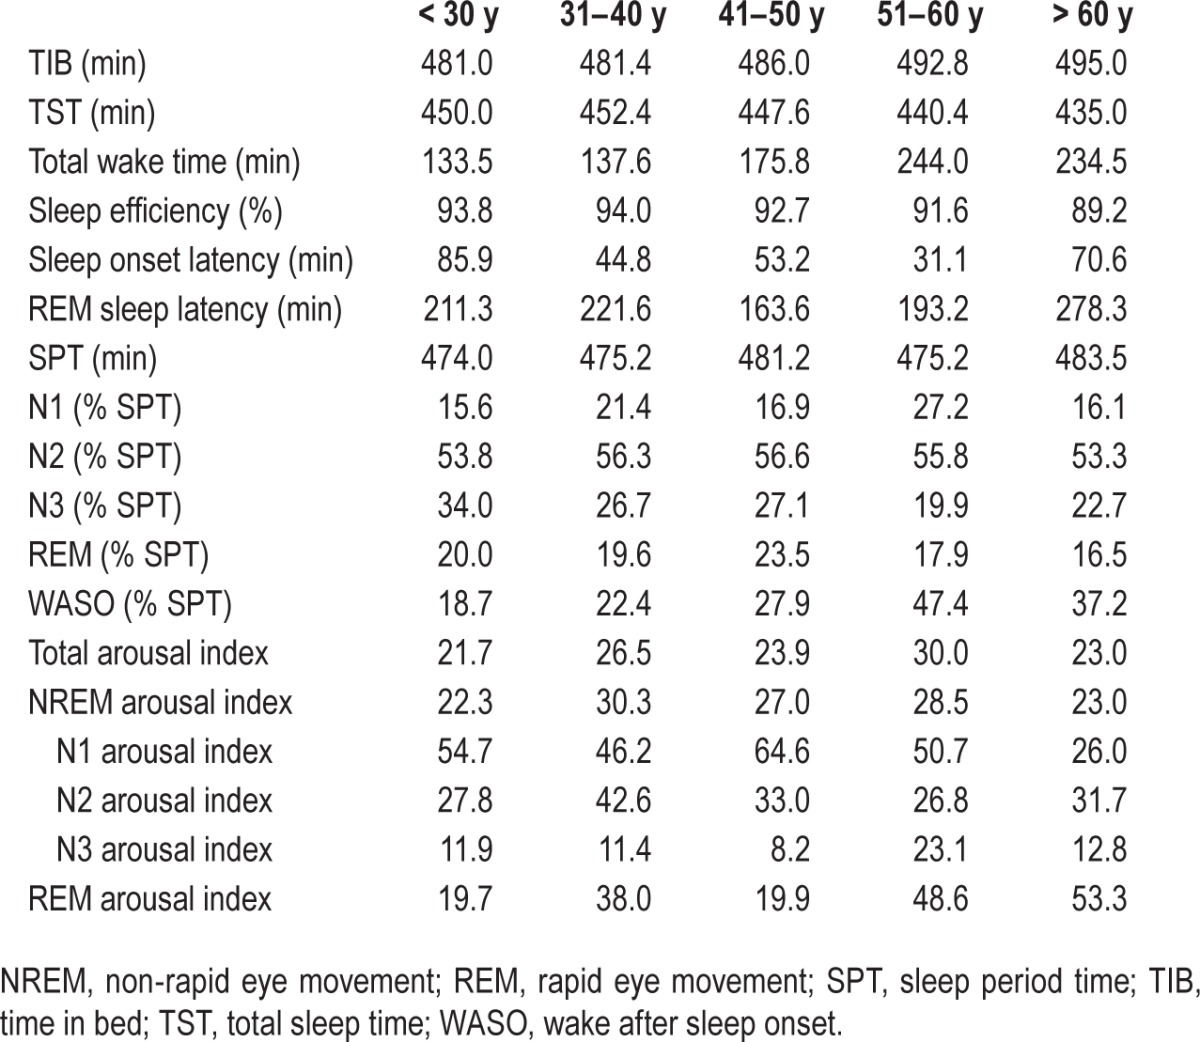
Figure 1.

Age-related percentile curves for sleep macrostructure and arousals. (A) Total sleep time. (B) Sleep efficiency. (C) N1%. (D) N2%. (E) N3%. (F) REM%. (G) WASO%. (H) Total arousal index. Circles represent women, squares represent men; figures show 10th, 25th, 50th, 75th and 90th percentile. REM, rapid eye movement; WASO, wake after sleep onset.
With respect to sex differences, women and men differed for the percentage of N1 sleep (women versus men: 9.2 [3.4–21.7] versus 11.3 [3.4–35.4], P = 0.010) and N2 sleep (women versus men: 47.5 [20.1–58.2] versus 42.9 [17.7–59.3], P = 0.012). Both differences remained unaffected by adjustment for age (N1 sleep: standardized coefficient: −0.300, P = 0.003 ; N2 sleep: standardized coefficient: 0.216, P = 0.035). All other sleep parameters were equally distributed (see Table 1).
Arousal Indices
Arousal indices for the entire sample are shown in Table 1. Age-related changes are shown in Tables 2 and 3. The rate of arousals did not differ between non-rapid eye movement (NREM) and REM sleep (P = 0.514).
Although no differences between the different age groups were found for total EEG arousal index (P = 0.799, see Table 2 and Figure 1H), the NREM arousal index (P = 0.884) the N2 arousal index (P = 0.917) and the N3 arousal index (P = 0.472), the REM arousal index increased with age (P = 0.006). The N1 arousal index was stable up to the age of 60 y and had a drop for subjects older than 60 y (P = 0.049). After adjustment for sex, only the differences of the REM arousal index remained significant (REM arousal index: standardized coefficient: 0.280, P = 0.006; N1 arousal index standardized coefficient: −0.161, P = 0.117).
No significant differences were revealed comparing women and men (all Ps > 0.05; for details see Table 1). These results did not change after adjustment for age (total arousal index: standardized coefficient: −0.103, P = 0.317; NREM arousal index: standardized coefficient: −0.133, P = 0.197; N1 arousal index: standardized coefficient: 0.016, P = 0.872; N2 arousal index: standardized coefficient: −0.144, P = 0.164; N3 arousal index: standardized coefficient: 0.054, P = 0.607; REM arousal index: standardized coefficient: −0.116; P = 0.248).
Respiratory Events According to AASM 2007 Versus AASM 2012 Version 2.0
Indices on respiratory events according to AASM 2007 and AASM 2012 are shown in Table 4, and age-related changes are shown in Tables 5 and 6 and Figure 2.
Table 4.
Respiratory parameters for the sample (n = 100).
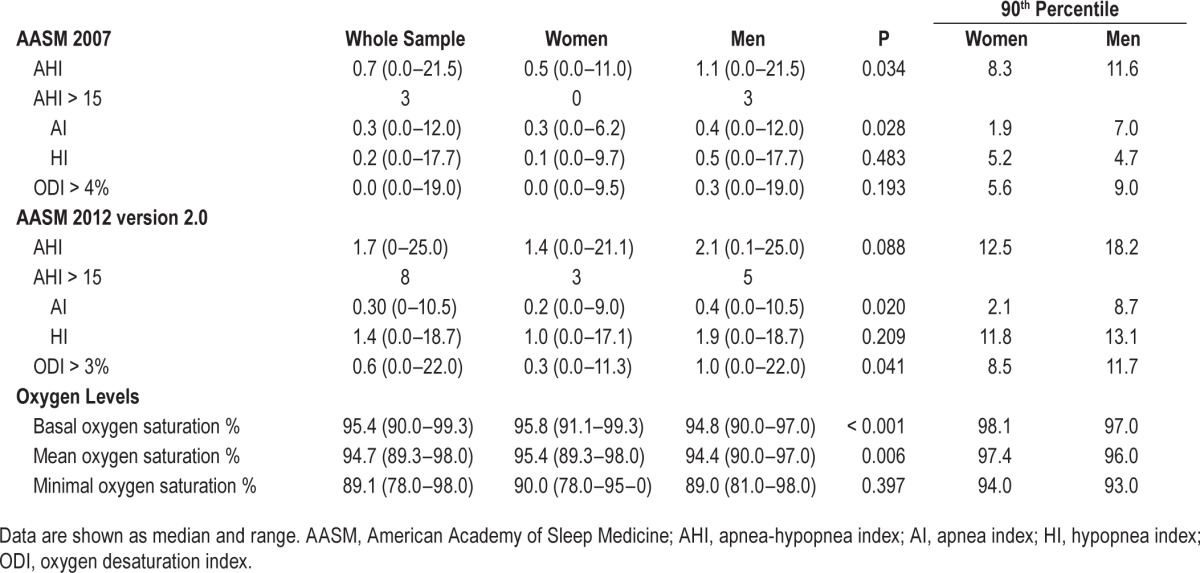
Table 5.
Respiratory parameters for age decades.
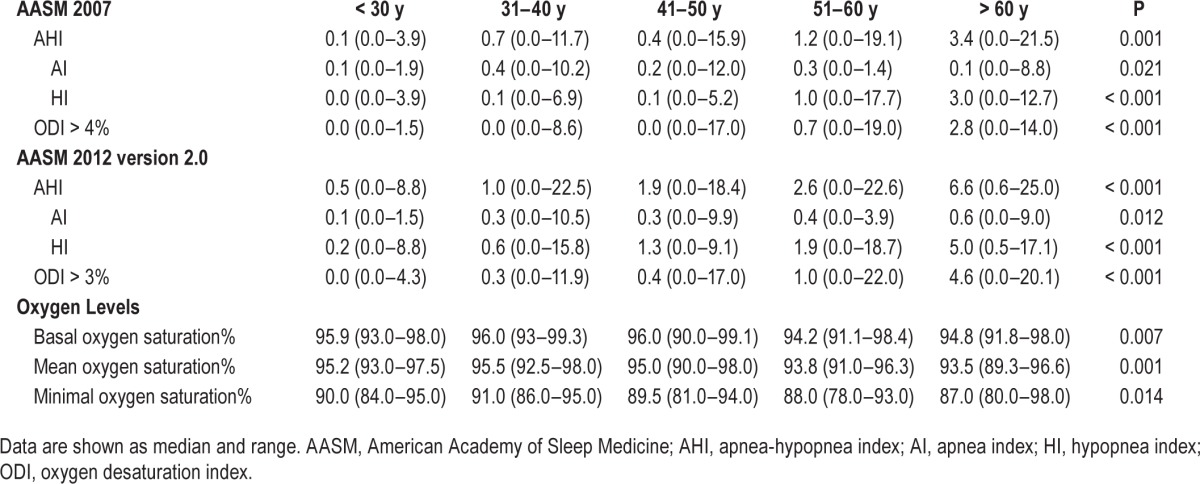
Table 6.
Ninetieth percentile of respiratory parameters for age decades.
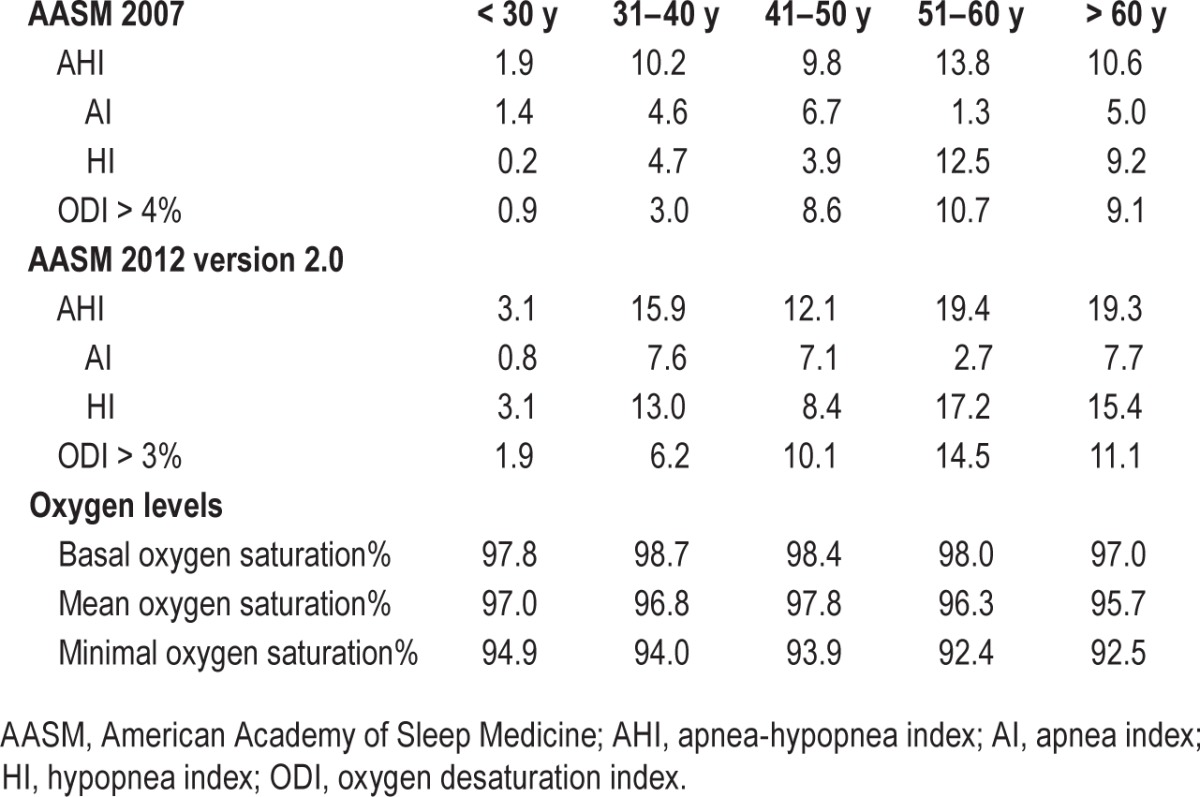
Figure 2.

Age-related percentile curves of the apnea-hypopnea index (AHI) and the oxygen desaturation index (ODI) according to AASM 2007 and AASM 2012 version 2.0 criteria. (A) AHI according to AASM 2007. (B) AHI according to AASM 2012 version 2.0. (C) ODI > 4%. (D) ODI > 3%. Circles represent women, squares represent men; figures show 10th, 25th, 50th, 75th, and 90th percentile.
Respiratory Events According to AASM 2007
Respiratory events according to AASM 2007 are given in Tables 4, 5, and 6 (upper panel). The apnea-hypopnea index (AHI) increased with age, especially in those subjects older than 50 y (P = 0.001, for details see Table 5, upper panel and Figure 2A). The same was true for the apnea index and the hypopnea index (P = 0.021 and P < 0.001, respectively). Adjustment for sex did not change these results (AHI: standardized coefficient: 0.534, P < 0.001; apnea index: standardized coefficient: 0.315, P = 0.009 ; hypopnea index: standardized coefficient: 0.387, P = 0.003). Three subjects had an AHI > 15/h, two of whom were older than 50 y.
The 4% oxygen desaturation index increased with age (P < 0.001, see Table 5, upper panel and Figure 2C). After adjustment for sex this result was no longer significant (standardized coefficient: 0.243, P = 0.114).
With respect to sex differences, the AHI and the apnea index were higher in men than in women but had a very low value for both sexes (AHI: women: 0.5 [0.0–11.0]/h versus men: 1.1 [0.0–21.5]/h, [median (range)]; P = 0.034; apnea index: women: 0.3 [0.0–6.2]/h versus men: 0.4 [0.0–12.0]/h, [median (range)]; P = 0.028). Three men had an apnea hypopnea index > 15/h. The hypopnea index and 4% oxygen desaturation index did not differ between men and women (for details see Table 4, upper panel). Adjustment for age did not change these results (AHI: standardized coefficient: −0.337, P = 0.001; apnea index: standardized coefficient: −0.292, P = 0.015).
Respiratory Scoring According to AASM 2012 Version 2.0
Respiratory events according to AASM 2012 version 2.0 are given in Tables 4, 5, and 6 (middle panel). The AHI increased significantly with increasing age (P < 0.001, for details see Table 5 and Figure 2B). Eight subjects had an AHI > 15/h; five of them were older than 50 y. The same age-dependent changes were found for the 3% oxygen desaturation index, apnea index, and hypopnea index (3% oxygen desaturation index: P < 0.001. Table 5 and Figure 2D; apnea index: P = 0.012; hypopnea index: P < 0.001). These results did not change when adjusting for sex (AHI: standardized coefficient: 0.423, P < 0.001; oxygen desaturation index 3%: standardized coefficient: 0.421, P < 0.001; apnea index: standardized coefficient: 0.253, P = 0.011; hypopnea index: standardized coefficient: 0.423, P < 0.001).
No significant differences were found when comparing the AHI and hypopnea index of women and men (P = 0.088 and 0.209, respectively); however, oxygen de-saturation index 3% and apnea index were different (P = 0.041 and 0.020, respectively). For details see Table 4. These results remained significant after adjustment for age (oxygen desaturation index 3%: standardized coefficient: −0.268, P = 0.005; apnea index: standardized coefficient: −0.243, P = 0.015).
Comparison of Respiratory Indices Between AASM 2007 and AASM 2012 Version 2.0
The comparison of respiratory indices between AASM 2007 and 2012 version 2.0 revealed significant differences. An increase from 2007 to 2012 version 2.0 was found for the AHI (2007: 0.7/h versus 2012 version 2.0: 1.7/h; P < 0.001), the oxygen desaturation index (2007: 0.0 % versus 2012 version 2.0: 0.6 %; P < 0.001), and for the hypopnea index (2007: 0.2/h versus 2012 version 2.0: 1.4/h; P < 0.001), whereas no differences were found for the apnea index (2007: 0.3/h versus 2012 version 2.0: 0.3/h; P > 0.05).
Oxygen Levels
Oxygen levels for the entire sample are shown in Table 4, and age-dependent changes in Tables 5 and 6 (lower panel). All three measures decreased with increasing age (basal oxygen saturation: P = 0.007; mean oxygen saturation: P = 0.001; minimal oxygen saturation: P = 0.014). Adjustment for sex did not influence the results for these measures (mean oxygen saturation: standardized coefficient: −0.461, P < 0.001; minimal oxygen saturation: standardized coefficient: −0.335, P = 0.001; basal oxygen saturation: −0.341, P < 0.001).
With respect to sex differences, men had a significantly lower basal oxygen saturation and mean oxygen saturation than women (P < 0.001 and P = 0.006, respectively) (for details see Table 4). The minimum oxygen saturation did not differ between the sexes. Adjustment for age did not change these results (basal oxygen saturation: standardized coefficient: 0.433, P < 0.001; mean oxygen saturation: standardized coefficient: 0.344; P < 0.001).
DISCUSSION
This study describes normative data on sleep macrostructure and microstructure as well as respiratory variables according to currently valid scoring criteria in a thoroughly selected sample of 100 healthy sleepers. Moreover, it is the first study to compare scoring criteria for respiratory events according to AASM 2007 and the new AASM 2012 version 2.0 criteria in healthy adults. In addition to age-dependent changes of general sleep and respiratory variables, we demonstrated that the respiratory indices are considerably higher when using the AASM 2012 version 2.0 scoring criteria.
General Sleep Data Demonstrate Age-Related Changes
General sleep data changed over the investigated age decades in healthy adults. Although sleep efficiency, total sleep time, and the percentages of REM and N3 sleep stages were decreasing, the amount of the percentage of wake time after sleep onset increased with advancing age. In contrast, sleep onset latency, the percentages of N1 and N2 sleep, REM latency, and sleep period time did not change with advancing age. The reported age-dependent changes are in line with the existing literature,18 and probably reflect physiological changes of normal aging.
Percentile Curves for General Sleep Data According to AASM are Not Identical to Those According to Rechtschaffen and Kales
Although trends of changes for general sleep data are comparable to the literature,18 percentile curves differ from past reports. In comparison with previous studies, percentages for sleep stages N1, N3, and wake time after sleep onset in the current study were higher, whereas percentages for sleep stages N2 and REM were lower than values reported previously.18 Although all these studies were published several decades apart, they were conducted using the Rechtschaffen and Kales scoring criteria (R&K) or comparable scoring approaches.19 The main differences between the AASM and the R&K scoring criteria are apart from its terminology and simplification (e.g., grouping of S3 and S4 sleep to stage N3, elimination of movement time), the requirement of a minimum of three derivations to record frontal, central, and occipital EEG activity as well as further clarifications and specifications concerning the transitions between the different sleep stages. The fact that the use of scoring criteria influences the polysomnographic scoring—although their difference seems to be only marginal at first glance—has been demonstrated by a study in which the same polysomnographic recordings were scored independently according to R&K and AASM 2007 scoring methods.10 This latter finding raises the need of AASM normative data and underlines the importance of the current study.
The REM Arousal Index Increases with Age
We found age-dependent differences only for the REM arousal index that increased with more advanced age, whereas the total arousal index and the NREM arousal index did not differ over the investigated age groups. This latter finding is unexpected and surprising considering the existing literature obtained from 40 to 70 subjects20–22 that showed a clear age-dependent increase of the arousal index over the lifespan. The reason for this divergent result remains unclear as no obvious difference in the chosen study populations is evident, albeit one of the previous studies had the exact opposite sex distribution as in our study.22
Respiratory Events Increase with Advancing Age
Respiratory indices increased with advancing age. Up to 8% of subjects (five of them were older than 50 y) had an AHI > 15/h, which is the currently used cutoff considered abnormal when evaluating subjects with suspected sleep apnea syndrome with no subjective symptoms.14,23 Because all of these subjects were clinically healthy, it is unclear whether these results reflect a status of preclinical sleep apnea syndrome (SAS) and if these subjects will develop symptoms such as daytime sleepiness or cardiovascular disease.
An increased cardiovascular risk for subjects with SAS is well known from the literature. In observational studies, the presence of SAS, expressed by an AHI > 5/h, represented a risk factor for the development of coronary artery disease, stroke, and death.24,25 In addition, a long-term follow up of the Wisconsin sleep cohort showed that cardiovascular mortality is considerably higher in subjects with severe SAS (AHI > 30/h) compared to subjects without SAS (AHI < 5/h) and that overall survival significantly decreases with increasing SAS severity.26 All our subjects represented nonobese healthy volunteers. Our findings therefore raise the question of whether an increase in respiratory disturbance is an integral part of normal aging resulting in the need of age-adjusted cutoff values for respiratory indices. The final answer to this question, however, can only be provided by large long-term follow-up studies of elderly subjects focusing on consecutive cardiovascular disease manifestation.
Elevations of respiratory variables in elderly subjects have been reported prior to this study.27–29 One recently published study on healthy subjects applied scoring criteria that almost resemble AASM 2012 version 2.0 criteria, and found a dramatic increase of respiratory disturbance with increasing age.7 However, the extent of respiratory disturbance reported in this study was higher than in the current study, which is best explained by different measures reported. Although the AHI, reported in the current study, comprises the apneas and hypopneas per hour of sleep, the respiratory disturbance index additionally includes respiratory event-related arousals, which were not analyzed in the current study.
Measures for Respiratory Disturbance are Higher when Scored According to AASM 2012 Version 2.0 Compared to AASM 2007
This is the first study to compare scoring criteria for respiratory variables according to AASM 2007 and AASM 2012 version 2.0 in healthy adults. In accordance with a recently published study on subjects with suspected SAS,30 our analysis showed that the change in criteria leads to significant increase of measures of respiratory disturbance, namely AHI and hypopnea index. As expected, the apnea index did not change from 2007 to 2012 version 2.0 criteria; consequently, the increase in AHI is caused by an increase of hypopnea. The main changes in scoring respiration between AASM 2007 and 2012 version 2.0 were made in definition of hypopnea. Although for 2007 criteria only hypopnea associated with a ≥ 4% oxygen de-saturation were scored, current criteria require a ≥ 3% oxygen desaturation or association with an arousal.8,9 Yet, because we did not distinguish between desaturation-associated hypopnea and arousal-associated hypopnea in the current study, we cannot rule out either one of which had more influence.
One recent study focused on inspiratory flow limitations in healthy individuals and showed that 5% of normal individuals present with > 30% of total sleep time with inspiratory flow limitations, which the authors judged likely to reflect abnormality.31 Scoring of respiratory event-related arousals and flow limitations, however, was not performed in the current study and therefore we cannot judge the effect of these respiratory events in our cohort.
A study comparing the effect of three different hypopnea definitions (i.e., Chicago criteria, AASM 2007 recommended and AASM 2007 alternative scoring) in subjects with suspected SAS found a considerable variation of AHI.11 This latter findings are of major importance since although all sleep centers might use the same cutoff values for SAS the scoring criteria might vary from one sleep center to the other.
STRENGTHS AND POTENTIAL LIMITATIONS
The major strength of the current study is the careful and thorough selection of the participating healthy subjects. To further ensure that our final study population consisted of truly healthy sleepers, all potential subjects underwent a standardized initial screening interview at the point of first contact and then a subsequent personal interview and examination by a trained sleep physician to eliminate further sleep pathology. One potential limitation is the skewed sex distribution with more women in the older age groups than men. Especially in the age group of 60 y and older, up to 10 subjects had to be screened to obtain one eligible study candidate, making the recruitment process of the current study very difficult as also reported by other authors.32 To counteract this potential limitation, we performed a sex-adjusted statistical analysis to investigate the effect of age on sleep macrostructure, micro-structure, and respiration. A further limitation might be seen in the single-night PSG setting, especially in light of the well-known first night effect.33 However, because most laboratories currently perform one-night diagnostic sleep studies, this reflects clinical routine.
In summary, this is the first study on normative data on sleep macrostructure, microstructure, and respiratory variables over the lifespan in healthy adult sleepers applying the currently valid AASM scoring criteria. Furthermore, we demonstrated that the choice of scoring criteria for respiratory events considerably affects the extent of the AHI. This, however, is crucial when interpreting existing studies on the AHI and its attributed cardiovascular risk. Moreover, because of the clear age-dependency of the AHI, our data challenge the use of uniform cutoff values for the definition of SAS as currently practiced.
DISCLOSURE STATEMENT
This was not an industry supported study. This study was supported by the Austrian Science Fund (FWF), project KLI 236. The recruitment of the healthy volunteers was supported by the intramural funding program of Innsbruck Medical University for young scientists, project 2010012005. Dr. Mitterling has received travel support from AOP Orphan. Dr. Högl has participated in speaker engagements and/or consulted for UCB, Mundipharma, Otsuka, Respironics, and Sanofi. She has received travel support from Habel Medizintechnik and Vivisol. A grant to her institution was provided by UCB. The other authors have indicated no financial conflicts of interest. The work was performed at the Department of Neurology, Innsbruck Medical University, Innsbruck, Austria.
ACKNOWLEDGMENTS
The authors thank Professor Arthur S. Walters, MD, for the very constructive discussion of the data of the current study.
SUPPLEMENTAL MATERIAL
Age-related percentile curves for sleep macrostructure. (A) Sleep onset latency. (B) Rapid eye movement sleep latency. (C) Sleep period time. Circles represent women, squares represent men; figures show 10th, 25th, 50th, 75th, and 90th percentile.
REFERENCES
- 1.Feinberg I. Changes in sleep cycle patterns with age. J Psychiatr Res. 1974;10:283–306. doi: 10.1016/0022-3956(74)90011-9. [DOI] [PubMed] [Google Scholar]
- 2.Williams RL, Karacan I, Hursch CJ. New York: Wiley; 1974. Electroencephalography (EEG) of human sleep: clinical applications. [Google Scholar]
- 3.Bixler EO, Kales A, Jacoby JA, Soldatos CR, Vela-Bueno A. Nocturnal sleep and wakefulness: effects of age and sex in normal sleepers. Intern J Neurosci. 1984;23:33–42. doi: 10.3109/00207458408985343. [DOI] [PubMed] [Google Scholar]
- 4.Hirshkowitz M, Moore CA, Hamilton CR, Rando KC, Karacan I. Polysomnography of adults and elderly: sleep architecture, respiration, and leg movement. J Clin Neurophysiol. 1992;9:56–62. [PubMed] [Google Scholar]
- 5.Danker-Hopfe H, Schäfer M, Dorn H, et al. Percentile reference charts for selected sleep parameters for 20- to 80-year-old healthy subjects from the SIESTA database. Somnology. 2005;9:3–14. [Google Scholar]
- 6.Hoch CC, Reynolds CF, Monk TH, et al. Comparison of sleep-disordered breathing among healthy elderly in the seventh, eighth, and ninth decades of life. Sleep. 1990;13:502–11. doi: 10.1093/sleep/13.6.502. [DOI] [PubMed] [Google Scholar]
- 7.Pavlova MK, Duffy JF, Shea SA. Polysomnographic respiratory abnormalities in asymptomatic individuals. Sleep. 2008;31:241–8. doi: 10.1093/sleep/31.2.241. [DOI] [PMC free article] [PubMed] [Google Scholar]
- 8.Iber C, Ancoli-Israel C, Chesson A, Quan SF for the American Academy of Sleep Medicine. The AASM manual for the scoring of sleep and associated events: rules, terminology and technical specifications. 1st edition. Westchester, IL: American Academy of Sleep Medicine; 2007. [Google Scholar]
- 9.Berry RB, Brooks R, Gamaldo CE, Harding SM, Marcus CL, Vaughn BV for the American Academy of Sleep Medicine. Darien, IL: American Academy of Sleep Medicine; 2012. The AASM manual for the scoring of sleep and associated events: rules, terminology and technical specifications, version 2.0. www.aasmnet.org. [Google Scholar]
- 10.Moser D, Anderer P, Gruber G, et al. Sleep classification according to AASM and Rechtschaffen & Kales: effects on sleep scoring parameters. Sleep. 2009;32:139–49. doi: 10.1093/sleep/32.2.139. [DOI] [PMC free article] [PubMed] [Google Scholar]
- 11.Ruehland WR, Rochford PD, O'Donoghue FJ, Pierce RJ, Singh P, Thornton AT. The new AASM criteria for scoring hypopneas: impact on the apnea hypopnea index. Sleep. 2009;32:150–7. doi: 10.1093/sleep/32.2.150. [DOI] [PMC free article] [PubMed] [Google Scholar]
- 12.Frauscher B, Gabelia D, Mitterling T, et al. Motor events during healthy sleep: a quantitative polysomnographic study. Sleep. 2014;37:763–73. doi: 10.5665/sleep.3586. [DOI] [PMC free article] [PubMed] [Google Scholar]
- 13.Frauscher B, Mitterling T, Bode A, et al. A prospective questionnaire study in 100 healthy sleepers: non-bothersome forms of recognizable sleep disorders are still present. J Clin Sleep Med. 2014;10:623–9. doi: 10.5664/jcsm.3784. [DOI] [PMC free article] [PubMed] [Google Scholar]
- 14.American Academy of Sleep Medicine. International classification of sleep disorders; diagnostic and coding manual. 2nd edition. Westchester, IL: American Academy of Sleep Medicine; 2005. [Google Scholar]
- 15.Johns MW. A new method for measuring daytime sleepiness: the Epworth sleepiness scale. Sleep. 1991;14:540–5. doi: 10.1093/sleep/14.6.540. [DOI] [PubMed] [Google Scholar]
- 16.Frauscher B, Iranzo A, Gaig C, et al. Normative EMG values during REM sleep for the diagnosis of REM sleep behavior disorder. Sleep. 2012;35:835–47. doi: 10.5665/sleep.1886. [DOI] [PMC free article] [PubMed] [Google Scholar]
- 17.Cole TJ, Green PJ. Smoothing reference centile curve: the LMS method penalized likelihood. Stat Med. 1992;11:1305–19. doi: 10.1002/sim.4780111005. [DOI] [PubMed] [Google Scholar]
- 18.Ohayon MM, Carskadon MA, Guilleminault C, Vitiello MV. Meta-analysis of quantitative sleep parameters from childhood to old age in healthy individuals: developing normative sleep values across the human lifespan. Sleep. 2004;27:1255–73. doi: 10.1093/sleep/27.7.1255. [DOI] [PubMed] [Google Scholar]
- 19.Rechtschaffen A, Kales A, editors. A manual of standardized terminology, techniques and scoring system of sleep stages in human subjects. Los Angeles: Brain Information Service/Brain Research Institute, University of California; 1968. [Google Scholar]
- 20.Mathur R, Douglas NJ. Frequency of EEG arousals from nocturnal sleep in normal subjects. Sleep. 1995;18:330–3. doi: 10.1093/sleep/18.5.330. [DOI] [PubMed] [Google Scholar]
- 21.Boselli M, Parrino L, Smerieri A, Terzano MG. Effect of age on EEG arousals in normal sleep. Sleep. 1998;21:351–7. [PubMed] [Google Scholar]
- 22.Bonnet MH, Arand DL. EEG arousal norms by age. J Clin Sleep Med. 2007;3:271–4. [PMC free article] [PubMed] [Google Scholar]
- 23.American Academy of Sleep Medicine. International classification of sleep disorders. 3rd edition. Darien, IL: American Academy of Sleep Medicine; 2014. [Google Scholar]
- 24.Peker Y, Carlson J, Hedner J. Increased incidence of coronary artery disease in sleep apnoea: a long-term follow-up. Eur Respir J. 2006;28:596–602. doi: 10.1183/09031936.06.00107805. [DOI] [PubMed] [Google Scholar]
- 25.Yaggi HK, Concato J, Kernan WN, Lichtman JH, Brass LM, Mohsenin V. Obstructive sleep apnea as a risk factor for stroke and death. N Engl J Med. 2005;353:2034–41. doi: 10.1056/NEJMoa043104. [DOI] [PubMed] [Google Scholar]
- 26.Young T, Finn L, Peppard PE, et al. Sleep disordered breathing and mortality: eighteen-year follow-up of the Wisconsin sleep cohort. Sleep. 2008;31:1071–8. [PMC free article] [PubMed] [Google Scholar]
- 27.Ancoli-Israel S, Kripke DF, Klauber MR, Mason WJ, Fell R, Kaplan O. Sleep-disordered breathing in community-dwelling elderly. Sleep. 1991;14:486–95. doi: 10.1093/sleep/14.6.486. [DOI] [PMC free article] [PubMed] [Google Scholar]
- 28.Lavie P. Incidence of sleep apnea in a presumably healthy working population: a significant relationship with excessive daytime sleepiness. Sleep. 1983;4:312–8. [PubMed] [Google Scholar]
- 29.Young T, Palta M, Dempsey J, Skatrud J, Weber S, Badr S. The occurrence of sleep-disordered breathing among middle-aged adults. N Engl J Med. 1993;328:1230–5. doi: 10.1056/NEJM199304293281704. [DOI] [PubMed] [Google Scholar]
- 30.BaHammam AS, Obeidat A, Barataman K, Bahammam SA, Olaish AH, Sharif MM. A comparison between the AASM 2012 and 2007 definitions for detecting hypopnea. Sleep Breath. 2014;18:767–73. doi: 10.1007/s11325-014-0939-3. [DOI] [PubMed] [Google Scholar]
- 31.Palombini L, Tufik S, Rapoport DM, et al. Inspiratory flow limitation in a normal population of adults in São Paulo, Brazil. Sleep. 2013;36:1663–8. doi: 10.5665/sleep.3122. [DOI] [PMC free article] [PubMed] [Google Scholar]
- 32.Fietze I, Diefenbach K. Healthy sleepers are rare: problems and success rates in establishing a control group for sleep studies. Neuropsychopharmacology. 2003;28:558–61. doi: 10.1038/sj.npp.1300082. [DOI] [PubMed] [Google Scholar]
- 33.Agnew HW, Webb WB, Williams RL. The first night effect: an EEG study of sleep. Psychophysiology. 1966;2:263–6. doi: 10.1111/j.1469-8986.1966.tb02650.x. [DOI] [PubMed] [Google Scholar]
Associated Data
This section collects any data citations, data availability statements, or supplementary materials included in this article.
Supplementary Materials
Age-related percentile curves for sleep macrostructure. (A) Sleep onset latency. (B) Rapid eye movement sleep latency. (C) Sleep period time. Circles represent women, squares represent men; figures show 10th, 25th, 50th, 75th, and 90th percentile.