

Abstract
Purpose
Medications can have unintended effects. High medication use populations may benefit from increased regimen oversight. Limited knowledge exists concerning racial and regional polypharmacy variation. We estimated total medication distributions (excluding supplements) of American black and white adults and assessed racial and regional polypharmacy variation.
Methods
REasons for Geographic And Racial Differences in Stroke (REGARDS) cohort data (N=30,239 U.S. blacks/whites ages ≥45 years) were analyzed. Home pill-bottle inspections assessed the last two weeks’ medications. Polypharmacy (≥ 8 medications) was determined by summing prescription and/or OTC ingredients. Population-weighted logistic regression assessed polypharmacy’s association with census region, race, and gender.
Results
The mean ingredient number was 4.12 (SE = 0.039), with 15.7% of REGARDS using ≥8 ingredients. In crude comparisons, women used more medications than men, and blacks and whites reported similar mean ingredients. A cross-sectional, logistic model adjusting for demographics, socioeconomics, and comorbidities showed increased polypharmacy prevalence in whites vs. blacks (OR, [95% CI]: 0.63, [0.55–0.72]), women (1.94, [1.68–2.23]), and Southerners {broadly Southeasterners and Texans} (1.48, [1.17–1.87]) vs. Northeasterners {broadly New England and upper Mid-Atlantic}. Possible limitations include polypharmacy misclassification and model mis-specification.
Conclusion
Polypharmacy is common. Race and geography are associated with polypharmacy variation. Further study of underlying factors explaining these differences is warranted.
Keywords: pharmacoepidemiology, medications, REGARDS, polypharmacy, geographic variations, and race
INTRODUCTION
Adult Americans take many prescription and over-the-counter (OTC) medications1, each year purchasing approximately four billion prescriptions.2 There are over 300,000 distinct OTC products.3 Over $300 billion is spent annually in the United States on prescriptions.4
In addition to pharmaceuticals’ well-established benefits, medication errors also occur, the most frequent class of medical error.5 Based on a meta-analysis, if categorized as a disease, adverse drug reactions (ADRs) are estimated to be up to the fourth leading cause of death.6
Polypharmacy, broadly conceptualized as high medication use, encapsulates the dual potential for poly-therapeutic effects and/or poly-toxicities.7 Unfortunately, polypharmacy has no universally accepted definition.8 Polypharmacy sometimes has negative connotations, suggesting inappropriate/excessive medication use; however, it can also reflect appropriate care for patients with multiple health conditions and/or conditions requiring multiple medications. Nevertheless, polypharmacy has been associated with adverse health events, including cognitive decline,9,supp ref falls,10,supp ref ADRs,11 and drug-drug interactions.12
Although some data on America’s medication use have begun emerging,13 population-based medication variation according to geography and race merit further elucidation. Large-scale, national studies assessing multivariable-adjusted racial and/or geographic polypharmacy variations in the general black and white adult population are, to our knowledge, largely unavailable. Here we use data from a large, population-based cohort to characterize cross-sectional racial and geographic polypharmacy patterns in the United States.
MATERIAL and METHODS
Study Design and Population
We used the REasons for Geographic And Racial Differences in Stroke (REGARDS) cohort study data.14 REGARDS utilized a two-stage survey design, with simple random sampling within strata defined by three geographic areas [stroke buckle (coastal plains of the Carolinas and Georgia)/stroke belt (eight Southern states: North Carolina, South Carolina, Georgia, Tennessee, Alabama, Mississippi, Arkansas, Louisiana)/stroke nonbelt (the rest of the continental United States)], two race categories (black/white), age groups, and sex (male/female).14 After excluding 58 participants with data anomalies or missing medication information, the analytic cohort included 30,181 community-dwelling black and white Americans ages ≥45 years residing in the contiguous United States. The population-based cohort was sampled from Genesys’15 commercial database, with oversampling of blacks and “stroke belt”16,17 residents.
Detailed REGARDS methodology is presented elsewhere.14 Briefly, a study pamphlet was mailed to potential participants; a telephone interviewer then called to inquire about participation. Individuals were excluded for non-black/non-white race, ongoing cancer treatment, poor English proficiency, cognitive impairment judged by the telephone interviewer, having a medical condition preventing long-term follow-up, or current nursing home residence or presence on a nursing home waiting list. The cooperation rate (number of study participants enrolled divided by the number who were contacted and met inclusion criteria) was 49%.18,19 For those agreeing to participate, the interviewer obtained verbal informed consent and began a computer-assisted telephone interview (CATI).
CATI-derived data included information about demographics, socioeconomic status (SES) including education (nine levels ranging from never attended/kindergarten only to graduate/professional school) and annual income (nine levels ranging from < $5,000 to > $150,000), and comorbidities (cardiovascular disease history, hypertension, diabetes, dyslipidemia, and chronic kidney disease). Each participant’s race was self-reported as black or white. Following the CATI, an in-home exam was conducted. Participants were asked to collect all medicines used in the previous two weeks prior to the exam. Blood pressure was measured during the in-home exam. Blood samples were analyzed at a central laboratory, and the results were used to estimate glomerular filtration rate to define chronic kidney disease. Institutional Review Boards reviewed the research at all participating institutions, and signed informed consent was obtained.
Drug Data Collection/Classification and Polypharmacy Definition
Cohort members were called prior to in-home exam and reminded to assemble their medications. Health professionals trained in the study protocol examined each medication provided (i.e. “pill bottle inspection”) and recorded the name (generic/brand) on a standardized form with space for up to 20 medication names. All rendered medications taken in the past two weeks (including medications administered ophthalmically, dermally, via injection, etc.) were recorded. Neither dosage nor use frequency/history was recorded. These records were processed into an electronic database of 34,776 distinct recorded medication names.
All medications were assigned a generic name (e.g., acetaminophen instead of Tylenol) by a research pharmacist and graduate students using primarily data from Drugs.com.20 For combination formulations (e.g., 3 ingredient-component antihypertensive), the drug count was the total number of ingredients. For 1.62% of recorded medications, a generic name could not be assigned, and these were marked as “unknown.” Each “unknown” medication was assumed to correspond to one drug ingredient.
Polypharmacy status was expressed as a binary variable, indicating whether or not ≥ 8 total ingredients (excluding supplements) were documented. This cut-point was chosen a priori, because it is an approximate midpoint between possible thresholds of 5 or 10 medications21,supp ref and because it corresponds to the highest quintile of medication-use (21.1%) in the REGARDS cohort. To study whether the associations examined were sensitive to the polypharmacy definition, an alternative analysis was conducted in which the polypharmacy threshold was set at ≥ 5 instead of ≥ 8. Some participants had the same ingredient listed multiple times, whether due to different medication formulations (e.g., long-, medium-, and short-acting insulin) or using the same medicine twice (e.g., two acetaminophen-containing, multi-component analgesics); in such cases the total ingredient sum counted the medication as many times as it was recorded.
Because of their heterogeneity and limited regulatory oversight (the Food and Drug Administration’s purview is very different for prescription/OTCs than with supplements),22 supplements (vitamins/minerals, herbal preparations, and nutraceuticals) were not considered. Some vitamins and minerals are available both as supplements and prescriptions; we tried to distinguish the prescription forms which counted towards polypharmacy (e.g., isotretinoin) from the OTC-available forms (e.g., vitamin A) that were considered supplements.
On the standardized medication form, there was a box to check if the medication inventory were complete of all medications used within the previous two weeks. Of the 20,586 participants who reported medication use and checked the box, 98.3% indicated that their medication inventories were complete.
Statistical Analysis
Sampling fractions from region-age-race-sex strata were used to provide weighted, nation-level estimates. Analyses for this report incorporated sampling weights using Statistical Analysis Software (SAS) 9.3 survey procedures.
Medication counts and their distributions were determined from participants’ two-week total medication (prescriptions/OTCs) ingredient sums. Logistic regression was used to assess the multivariable-adjusted association between the independent variables listed in Table 1 and polypharmacy. The three exposures of interest were: race [black, white], census-defined regions [South, West, Midwest, Northeast], and gender [female, male]. The covariates were as follows:
Table 1.
REGARDS Cohort’s (Sampling-Unweighted) Covariate Distribution According to Census Region, Race, and Gender
| Covariate | Cov. Val. | Tot. N | Census Region %* | Race %* | Gender %* | |||||
|---|---|---|---|---|---|---|---|---|---|---|
| NE | MW | W | S | B | W | M | F | |||
| Age | 85+ | 590 | 2.14 | 2.15 | 3.15 | 1.72 | 1.66 | 2.16 | 2.06 | 1.87 |
| 75–84 | 4,580 | 17.2 | 16.0 | 18.2 | 14.3 | 13.0 | 16.7 | 16.3 | 14.3 | |
| 65–74 | 9,685 | 30.9 | 32.2 | 31.5 | 32.3 | 31.2 | 32.8 | 33.7 | 30.8 | |
| 55–64 | 11,539 | 40.6 | 38.7 | 34.2 | 38.5 | 40.1 | 36.9 | 37.5 | 38.9 | |
| 45–54 | 3,787 | 9.20 | 10.9 | 12.9 | 13.2 | 14.1 | 11.5 | 10.5 | 14.2 | |
| Region | South | 20,386 | - | - | - | 100 | 64.6 | 69.6 | 66.4 | 68.5 |
| West | 2,953 | - | - | 100 | - | 9.09 | 10.3 | 9.48 | 10.0 | |
| Midwest | 4,689 | - | 100 | - | - | 18.5 | 13.5 | 16.7 | 14.6 | |
| Northeast | 2,153 | 100 | - | - | - | 7.82 | 6.64 | 7.50 | 6.84 | |
| Race | Black | 12,513 | 45.5 | 49.3 | 38.5 | 39.7 | 100 | - | 35.0 | 46.7 |
| White | 17,668 | 54.5 | 50.7 | 61.5 | 60.3 | - | 100 | 65.0 | 53.3 | |
| Gender | Female | 16,630 | 52.8 | 51.8 | 56.5 | 55.9 | 62.1 | 50.2 | - | 100 |
| Male | 13,551 | 47.2 | 48.2 | 43.5 | 44.1 | 37.9 | 49.8 | 100 | - | |
| Education | ≥ HS | 26,364 | 88.7 | 86.7 | 95.6 | 86.3 | 80.0 | 92.7 | 88.5 | 86.6 |
| < HS | 3,792 | 11.3 | 13.3 | 4.40 | 13.7 | 20.0 | 7.33 | 11.5 | 13.4 | |
| Income | < $20k | 5,478 | 17.4 | 18.8 | 10.2 | 19.2 | 26.9 | 12.0 | 12.1 | 23.1 |
| $20k – $34k | 7,306 | 22.6 | 26.6 | 20.5 | 24.4 | 26.4 | 22.7 | 23.3 | 24.9 | |
| $35k – $74k | 8,914 | 29.6 | 28.7 | 33.2 | 29.2 | 25.2 | 32.6 | 34.3 | 25.7 | |
| ≥ $75k | 4,754 | 18.3 | 13.9 | 24.4 | 14.6 | 8.88 | 20.6 | 21.0 | 11.4 | |
| Refused | 3,729 | 12.0 | 12.0 | 11.7 | 12.6 | 12.7 | 12.1 | 9.30 | 14.8 | |
| Dyslipidemia | Yes | 17,228 | 57.5 | 58.7 | 57.1 | 60.0 | 55.3 | 62.1 | 67.2 | 52.8 |
| No | 11,817 | 42.5 | 41.3 | 42.9 | 40.0 | 44.7 | 37.9 | 32.8 | 47.2 | |
| Diabetes | Yes | 6,398 | 21.7 | 21.1 | 18.0 | 22.8 | 30.9 | 15.8 | 22.9 | 21.3 |
| No | 22,654 | 78.3 | 78.9 | 82.0 | 77.2 | 69.1 | 84.2 | 77.1 | 78.7 | |
| Hypertension | Yes | 17,846 | 57.6 | 60.0 | 52.9 | 60.2 | 71.3 | 50.7 | 58.3 | 60.0 |
| No | 12,262 | 42.4 | 40.0 | 47.1 | 39.8 | 28.7 | 49.3 | 41.7 | 40.0 | |
| CVD Hist. | Yes | 6,501 | 21.2 | 24.0 | 18.8 | 22.1 | 20.9 | 22.8 | 28.2 | 16.9 |
| No | 23,019 | 78.8 | 76.0 | 81.2 | 77.9 | 79.1 | 77.2 | 71.8 | 83.1 | |
| CKD | Yes | 3,295 | 10.7 | 12.0 | 11.4 | 11.4 | 12.1 | 10.9 | 11.4 | 11.4 |
| No | 25,583 | 89.3 | 88.0 | 88.6 | 88.6 | 87.9 | 89.1 | 88.6 | 88.6 | |
Tot. N: Cohort N--For example, there were 590 cohort members age 85+.
Column percent
B: Black; CKD: Chronic Kidney Disease; CVD: Cardiovascular Disease; F: Female; HS: High School; M: Male; MW: Midwest; NE: Northeast; S: South; W: West; W: White; -: Not Applic.
Demographics: age [45–54, 55–64, 65–74, 75–84, 85+ years]
SES: education [< High School (HS), ≥ HS]; income [<$20k, $20–34k, $35k–74k, ≥$75k, “refused”])
Comorbidities: chronic kidney disease [yes/no: self-reported dialysis or estimated glomerular filtration rate ≤ 60 mL/min/1.73m2]; cardiovascular disease history [yes/no: self-reported MI (myocardial infarction), bypass, angioplasty, stenting or electrocardio-gram MI evidence or self-reported stroke]; diabetes [yes/no: fasting glucose ≥ 126 mg/dL, non-fasting ≥ 200 mg/dL, or self-reported use of anti-hyperglycemic medication or insulin]; hypertension [yes/no: systolic blood pressure ≥ 140 mmHg, diastolic blood pressure ≥ 90 mmHg, or self-reported antihypertensive use]; and dyslipidemia [yes/no: total cholesterol ≥ 240 mg/dL, low-density lipoprotein ≥ 160 mg/dL, high-density lipoprotein ≤ 40 mg/dL, or self-reported use of lipid-lowering medication].
Sampling weights allowed geographic estimates following the census regions23 boundaries (Figure 1) of South, Midwest, West, and Northeast.
Figure 1. Census Regions Used.
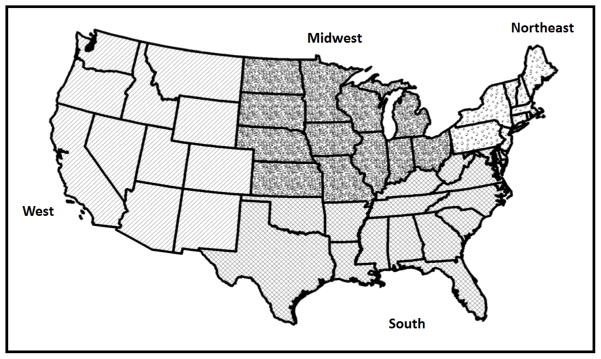
The four census regions are shown.
Three distinct logistic regression models were constructed. The level of statistical significance was α = 0.05. For all models, census region, race, and gender were the exposures of interest and polypharmacy was the outcome. Model 1 adjusted for age categories. Model 2 also adjusted for education and income. Model 3 included all variables used in Model 2 and added comorbidities (chronic kidney disease, hypertension, dyslipidemia, diabetes, and cardiovascular disease history). Model collinearity was checked using the SAS macro’s condition indices/variance decomposition proportions.supp ref All models were a priori no-interaction models.
RESULTS
Characteristics of the Cohort and Their Medications
A total of 171,573 drug names were obtained and transcribed from the medication inventories conducted during in-home visits. Among sampling-weighted, non-supplemental medications, 91.8% were single-ingredient drugs and 16.0% of transcribed medications were available OTC. The mean age of participants was 65 years; 42% were black; 45% were male; 68% resided in the South (Table 1). The prevalences of dyslipidemia and hypertension were both nearly 60%, and the prevalence of diabetes was 22%.
The Midwest had the highest proportion of black cohort members. The West had the highest proportion of cohort members with at least a HS education and with an annual income ≥ $75,000. There was relatively little regional variability with regards to comorbidities.
Among black cohort members, a greater proportion was female and fewer had completed HS relative to whites. Black cohort members reported lower incomes and had higher rates of diabetes and hypertension relative to whites.
Males reported higher incomes than females. Males also had higher prevalences of dyslipidemia and cardiovascular disease history.
Prevalence of Medication Use and Mean Ingredient Counts
Overall, 27,060 participants (89.7%) used ≥ 1 medication ingredient(s) in the two weeks preceding the in-home visit. Figure 2 shows sampling-weighted ingredient sum prevalence distribution in the entire analytic cohort (national estimate) and according to gender, race, and census region. As these are sampling-weighted calculations, they represent national estimates for black and white adults age ≥ 45 years.
Figure 2. Ingredient Sum Prevalence Distribution for Entire Cohort and According to Gender, Race, and Geographic Region, Adjusted for Sampling Weights.

The percent corresponding to the respective total ingredient sums (excluding supplements) is found within the labeled bars. Because of space constraints, these percentages are not shown for the 12–14 meds and 15+ meds categories.
Meds: total ingredient sum
For the overall national estimate, less than 15% of participants reported taking no medications in the preceding two weeks. The prevalence of polypharmacy (≥8 drug ingredients) was 15.7%. The mean (standard error [SE]) ingredient count was 4.12 (0.039).
Females had higher mean ingredient counts [4.53 (0.057)] than males [3.66 (0.054)]. Females also had a higher rate of polypharmacy (18.4%) than males (12.7%).
Mean ingredient counts (blacks = 4.08, whites = 4.13) and polypharmacy proportions (blacks = 16.3%, whites = 15.7%) were similar regardless of race (Figure 2).
The South’s mean number of total ingredients was 4.53 (SE = 0.057), substantially higher than that of the West (3.90, [0.099]), the Midwest (3.87, [0.082]), and the Northeast (3.83, [0.12]). Similarly, the polypharmacy prevalence in the South (19.3%) was higher than in the West (13.9%), the Midwest (13.5%), and the Northeast (13.0%).
Multivariable Race- /Census Region- /Gender-Polypharmacy Associations
The multivariable-adjusted odds ratios (ORs) for the three exposures of interest (race, census region, and gender) in the three models constructed are shown in Table 2. Analogous sensitivity analyses using the alternate polypharmacy definition did not yield substantially different ORs. Crude, sampling-weighted odds ratios (ORs) and 95% confidence intervals (CI) are also shown.
Table 2.
Results from Sampling-Weighted, Multivariable-Adjusted Logistic Regression Models of Polypharmacy Associations
| Exposures | Sampling-Weighted Polypharmacy Model ORs (95% CI) | ||||
|---|---|---|---|---|---|
| Crude (CI) | Model 1* (CI) | Model 2† (CI) | Model 3‡ (CI) | ||
| Region | Northeast | Ref | Ref | Ref | Ref |
| Midwest | 1.04 (0.83–1.31) | 1.07 (0.86–1.34) | 1.03 (0.82–1.29) | 1.01 (0.78–1.32) | |
| West | 1.08 (0.86–1.37) | 1.08 (0.86–1.37) | 1.14 (0.90–1.45) | 1.23 (0.93–1.62) | |
| South | 1.61 (1.32–1.96) | 1.59 (1.30–1.94) | 1.51 (1.23–1.85) | 1.48 (1.17–1.87) | |
| Race | White | Ref | Ref | Ref | Ref |
| Black | 1.05 (0.96–1.15) | 1.07 (0.97–1.18) | 0.90 (0.81–1.00) | 0.63 (0.55–0.72) | |
| Gender | Male | Ref | Ref | Ref | Ref |
| Female | 1.55 (1.39–1.73) | 1.50 (1.34–1.68) | 1.35 (1.20–1.51) | 1.94 (1.68–2.23) | |
Statistically Significant Estimates are Bolded
For model covariate possible values see Table 1
Adjusted for Demographics (Age, Race, Gender, Region)
Adjusted for Demographics + SES Factors (Education, Income)
Adjusted for Demographics + SES Factors + Comorbidities (Chronic Kidney Disease, Hypertension, Dyslipidemia, Diabetes, Cardiovascular Disease History)
CI: confidence interval
OR: odds ratio for being polypharmacy (≥ 8 total ingredients) positive
Ref: reference group
In the crude analysis and in all multivariable models, polypharmacy was more common in the South than the Northeast, with ORs (95% CIs) ranging from 1.61 (1.32–1.96) in the crude analysis to 1.48 (1.17–1.87) in Model 3. The point estimates for the Midwest and West (relative to the Northeast) were all non-significant.
In crude analysis and in models that did not adjust for comorbidities, there was no statistically significant difference in the prevalence of polypharmacy among blacks compared to whites. However, in Model 3 (which adjusted for demographics, SES factors, and comorbidities), blacks were statistically significantly (OR = 0.63; 95% CI: 0.55–0.72) less likely to have polypharmacy.
For gender, in crude analyses and multivariable-adjusted analyses, women were more likely than men to have polypharmacy. The association was strongest in Model 3 (OR = 1.94; 95% CI: 1.68–2.23).
DISCUSSION
Medications are a cornerstone of medical care, and medication regimens are often exceedingly complex, making managing polypharmacy a major challenge across multiple domains (e.g., patients, physicians, pharmacists, insurers, etc.). While not the focus of this research, an obvious implication is that an improved understanding of medication patterns may foster more economical and efficacious drug utilization, while minimizing risks (e.g., embedded electronic medical record software applications to suggest regimen simplification in cases of therapeutic redundancies or pop-up reminders to try to minimize anti-cholinergic burdens in geriatrics).
Consistent with other large studies, the overwhelming majority of REGARDS participants were taking medication(s).1,13 This widespread medication use highlights the need for nurses, physicians, pharmacists, and allied health providers to remain cognizant to patients’ medication regimens, retaining awareness that new signs/symptoms may be medication-induced. Paradoxically, polypharmacy may indicate lost therapeutic opportunities, as polypharmacy is a risk factor for underprescribing,24 so polypharmacy should not be considered synonymous with overprescribing. Although many REGARDS cohort member’s drugs may be appropriately prescribed and properly used, the high mean ingredient count (4.12) and a significant proportion using ≥ 8 ingredients (15.7%) may indicate increased risks for ADRs and drug interactions.11,12 In this study, however, we could not distinguish “appropriate” from “inappropriate” polypharmacy.
Our most important findings were that, after adjustment for demographics, SES factors, and comorbidities, whites and Southern residents had significantly greater prevalence of polypharmacy. To our knowledge, this is the first time that a multivariate model of the American adult population ages 45 and older has reported findings of racial and geographic medication use differences.
This analysis of REGARDS medication use has several strengths. First, the large sample (N=30,239 for the total cohort, 58 participants were excluded in the presented analyses), allowed for detailed subgroup comparisons. Additionally, medication use was assessed rigorously through pill-bottle verification by trained health professionals. Furthermore, raw drug data coding by trained staff using a systematic strategy for ascertaining misspelled medications’ identities ensured accurate classification. Finally, despite considerable effort, 1.62% of collected medications could not be assigned a generic name (“unknowns”). These unknowns were not excluded but instead were assumed to represent a single non-supplemental ingredient.
This study also has a number of limitations. Data were not collected on medication dose or use frequency/history, which would help distinguish sporadic from persistent polypharmacy. However, defining polypharmacy by ingredient sums (excluding supplements) may be the most biologically plausible approach, since supplements do not undergo the same regulation and often contain many “active” ingredients (e.g., multivitamin). Polypharmacy misclassification could occur at multiple steps—not all medications were assembled or medications not used in the previous two weeks were included, medication transcription mistakes, electronic medication list scanner errors, and generic assignment misclassification. Some residual selection bias from sampling-weight misspecification could occur. The reasons for medication use are multifactorial and variable; the polypharmacy models may be mis-specified (e.g., important confounders and effect modifiers may have been omitted or the models may have been “overfit” with variables not needed to correct for confounding by indication).
In crude comparisons, blacks and whites had similar mean ingredient counts and polypharmacy prevalences. However, upon multivariable adjustment that included comorbidities, blacks had less polypharmacy than whites. The lack of a crude race-polypharmacy association (but a significant adjusted association) may be attributable to blacks’ greater comorbidities. To our knowledge, this is the first time a multivariable-adjusted model has reported racial polypharmacy disparities for the general, biracial American adult (≥ 45 years) population.
Our findings are consistent with Dwyer et al.25 who reported that “black/other” nursing home residents were less likely than whites to be exposed to polypharmacy. Among two cohorts of hospitalized elderly with heart failure from 1998–2001, Masoudi et al. also reported higher mean multivariable-adjusted prescription counts at hospital discharge among whites than blacks.26 By contrast, Hanlon et al. found no crude black-white difference in polypharmacy among Veterans Affairs nursing home extended-stay residents.supp ref Similarly, in a study of community-dwelling American adults, Qato et al. reported no statistically significant racial differences in a multivariable model of “no regular medication use,” although this study had a significantly smaller sample than REGARDS.13
In geographic analyses, the South had the highest prevalence of polypharmacy compared to all other census regions. To our knowledge, no previous studies have reported significant, multivariable, American regional variation in aggregate medication use. The reasons for higher medication utilization in the South relative to the rest of the country are unclear. Regional variation in healthcare has been reported by others,27,supp ref and prescribing quality geographic differences have been documented.supp ref
Aparasu et al. documented crude, but not multivariable, regional variation in elderly office visit polypharmacy.28 Similarly, Perry and Turner reported crude mean prescription count regional variation among National Health and Nutrition Examination Survey III 65+ year olds.29 Additionally, Gupta et al. noted intrastate geographic variation with prescription count in Louisiana geriatric Medicaid beneficiaries.30 Other researchers have investigated different dimensions of medication use geographic variation (e.g., inter- and intra-regional variation abroad and urban/rural variation).supp ref Moreover, although not a composite pharmacological assessment like polypharmacy, some United States data on the spatial distributions of use of specific medication classes are available.supp ref
CONCLUSIONS
In summary, this research documents a high frequency of polypharmacy in the United States and shows that polypharmacy is not equally distributed across racial groups and census regions. The geographic variation should be explored at the community level; further investigation into factors that explain the observed polypharmacy racial disparities is merited. Also, future studies should investigate potential consequences of polypharmacy including direct toxicity, drug interactions, and ADRs. Finally, it should be noted that as polypharmacy is appropriate and the standard of care for some patients, higher prevalences of polypharmacy in the South and among whites should not be equated with excessive medication use in these groups.
Supplementary Material
Highlights.
There is a high frequency of polypharmacy (using ≥ 8 total prescription and/or OTC ingredients) among American adults.
Polypharmacy is not equally distributed across racial groups and census regions.
Future research should investigate potential deleterious consequences of polypharmacy (e.g., drug interactions)
However, it should be noted that polypharmacy is appropriate and the standard of care for some patients. As such, higher prevalences of polypharmacy in the South and among whites should not a priori be equated with excessive medication use in these groups.
Acknowledgments
This research project is supported by a cooperative agreement U01 NS041588 from the National Institute of Neurological Disorders and Stroke, National Institutes of Health, Department of Health and Human Services. The content is solely the responsibility of the authors and does not necessarily represent the official views of the National Institute of Neurological Disorders and Stroke or the National Institutes of Health. Representatives of the funding agency were not directly involved in the collection, management, analysis or interpretation of the data.
The authors acknowledge the participating REGARDS cohort members, investigators, and institutions for their valuable contributions.
WC had full access to all study data and takes responsibility for the integrity of the data and the accuracy of the data analysis.
Abbreviations/Acronyms
- ADR
adverse drug reaction
- CATI
computer-assisted telephone interview
- CI
confidence interval
- HS
high school
- MI
myocardial infarction
- OTC
over-the-counter
- REGARDS
REasons for Geographic And Racial Differences in Stroke
- SAS
statistical analysis software
- SE
standard error
- SES
socioeconomic status
Footnotes
Conflict of Interest Statement Funding: This research project is supported by a cooperative agreement U01 NS041588 from the National Institute of Neurological Disorders and Stroke, National Institutes of Health, Department of Health and Human Services. Further funding for WC was provided by a Medical Scientist Training Program Grant 2T32GM008169-28. PM receives grant support from Amgen Inc. No other authors report any conflicts of interest.
Publisher's Disclaimer: This is a PDF file of an unedited manuscript that has been accepted for publication. As a service to our customers we are providing this early version of the manuscript. The manuscript will undergo copyediting, typesetting, and review of the resulting proof before it is published in its final citable form. Please note that during the production process errors may be discovered which could affect the content, and all legal disclaimers that apply to the journal pertain.
References
- 1.Kaufman DW, Kelly JP, Rosenberg L, Anderson TE, Mitchell AA. Recent patterns of medication use in the ambulatory adult population of the United States: the Slone survey. JAMA. 2002;287:337–44. doi: 10.1001/jama.287.3.337. [DOI] [PubMed] [Google Scholar]
- 2.Lindsley CW. The top prescription drugs of 2011 in the United States: antipsychotics and antidepressants once again lead CNS therapeutics. ACS Chem Neurosci. 2012;3:630–1. doi: 10.1021/cn3000923. [DOI] [PMC free article] [PubMed] [Google Scholar]
- 3.U.S. Food and Drug Administration. Drug applications for over-the-counter (OTC) drugs. Silver Spring, MD: [accessed 2013 July 30]. [Internet] [updated 2012 Oct 18. Available: http://www.fda.gov/Drugs/DevelopmentApprovalProcess/HowDrugsareDevelopedandApproved/ApprovalApplications/Over-the-CounterDrugs/default.htm. [Google Scholar]
- 4.Aitken M, Kleinrock M. Declining medicine use and costs: for better or worse? A review of the use of medicines in the United States in 2012 [Internet] Parsippany, NJ: IMS Institute for Healthcare Informatics; 2013. [accessed 2013 Jul 30]. Available from: http://www.imshealth.com/deployedfiles/ims/Global/Content/Insights/IMS%20Institute%20for%20Healthcare%20Informatics/2012%20U.S.%20Medicines%20Report/2012_U.S.Medicines_Report.pdf. [Google Scholar]
- 5.Aspden P, Wolcott J, Bootman JL, Cronenwett LR, editors. Preventing medication errors: quality chasm series. Washington, DC: National Academy of Sciences; 2007. [Google Scholar]
- 6.Lazarou J, Pomeranz BH, Corey PN. Incidence of adverse drug reactions in hospitalized patients: a meta-analysis of prospective studies. JAMA. 1998;279:1200–5. doi: 10.1001/jama.279.15.1200. [DOI] [PubMed] [Google Scholar]
- 7.Werder SF, Preskorn SH. Managing polypharmacy: Walking the fine line between help and harm. Current Psychiatry. 2003;2:24–36. [Google Scholar]
- 8.Bushardt RL, Massey EB, Simpson TW, Ariail JC, Simpson KN. Polypharmacy: misleading, but manageable. Clin Interv Aging. 2008;3:383–9. doi: 10.2147/CIA.S2468. [DOI] [PMC free article] [PubMed] [Google Scholar]
- 9.Lai SW, Lin CH, Liao KF, Su LT, Sung FC, Lin CC. Association between polypharmacy and dementia in older people: a population-based case-control study in Taiwan. Geriatr Gerontol Int. 2012;12:491–8. doi: 10.1111/j.1447-0594.2011.00800.x. Epub 2012 Jan 10. [DOI] [PubMed] [Google Scholar]
- 10.Ziere G, Dieleman JP, Hofman A, Pols HA, van der Cammen TJ, Stricker BH. Polypharmacy and falls in the middle age and elderly population. Br J Clin Pharmacol. 2006;61:218–23. doi: 10.1111/j.1365-2125.2005.02543.x. [DOI] [PMC free article] [PubMed] [Google Scholar]
- 11.Katzung BG. Special aspects of geriatric pharmacology. In: Katzung BG, Masters SB, Trevor AJ, editors. Basic & Clinical Pharmacology. 12. New York: McGraw-Hill; 2012. pp. 1051–60. [Google Scholar]
- 12.Johnell K, Klarin I. The relationship between number of drugs and potential drug-drug interactions in the elderly: a study of over 600,000 elderly patients from the Swedish Prescribed Drug Register. Drug Saf. 2007;30:911–8. doi: 10.2165/00002018-200730100-00009. [DOI] [PubMed] [Google Scholar]
- 13.Qato DM, Alexander GC, Conti RM, Johnson M, Schumm P, Lindau ST. Use of prescription and over-the-counter medications and dietary supplements among older adults in the United States. JAMA. 2008;300:2867–78. doi: 10.1001/jama.2008.892. [DOI] [PMC free article] [PubMed] [Google Scholar]
- 14.Howard VJ, Cushman M, Pulley L, et al. The reasons for geographic and racial differences in stroke study: objectives and design. Neuroepidemiology. 2005;25:135–43. doi: 10.1159/000086678. Epub 2005 Jun 29. [DOI] [PubMed] [Google Scholar]
- 15.Genesys, Inc. [internet] Pennsylvania: Marketing Systems Group’s; pp. c1987–12. [cited 2013 Aug 15]. Available from: http://www.m-s-g.com/Web/genesys/Index.aspx. [Google Scholar]
- 16.Borhani NO. Changes and geographic distribution of mortality from cerebrovascular disease. Am J Public Health. 1965;55:673–81. doi: 10.2105/ajph.55.5.673. [DOI] [PMC free article] [PubMed] [Google Scholar]
- 17.Howard G, Anderson R, Johnson NJ, Sorlie P, Russell G, Howard VJ. Evaluation of social status as a contributing factor to the Stroke Belt region of the United States. Stroke. 1997;28:936–40. doi: 10.1161/01.STR.28.5.936. [DOI] [PubMed] [Google Scholar]
- 18.Howard VJ, Kleindorfer DO, Judd SE, et al. Disparities in stroke incidence contributing to disparities in stroke mortality. Ann Neurol. 2011;69:619–27. doi: 10.1002/ana.22385. Epub 2011 Mar 17. [DOI] [PMC free article] [PubMed] [Google Scholar]
- 19.Morton LM, Cahill J, Hartge P. Reporting participation in epidemiologic studies: a survey of practice. Am J Epidemiol. 2006;163:197–203. doi: 10.1093/aje/kwj036. Epub 2005 Dec 7. [DOI] [PubMed] [Google Scholar]
- 20.Drug Information Online--Drugs.com [Internet] Virginia: Drugsite Trust in collaboration with Wolters Kluwer Health, American Society of Health-System Pharmacists, Cerner Multum, and Thomson Reuters Micromedex; pp. c2000–13. [cited 2013 Aug 15]. Available from: http://www.drugs.com/ [Google Scholar]
- 21.Hovstadius B, Petersson G. The impact of increasing polypharmacy on prescribed drug expenditure-a register-based study in Sweden 2005–2009. Health Policy. 2013;109:166–74. doi: 10.1016/j.healthpol.2012.09.005. Epub 2012 Nov 26. [DOI] [PubMed] [Google Scholar]
- 22.U.S. Food and Drug Administration. Dietary Supplements; [about 2 screens] Maryland: [Internet] updated 2013 May 21; cited 2013 Aug 17. Available from: http://www.fda.gov/Food/DietarySupplements/default.htm. [Google Scholar]
- 23.United States Census Bureau. 2007 Economic Census: Regions and Divisions; [about 1 screen] Washington, DC: [Internet] updated 2013 April 25; cited 2013 Aug 18. Available from: http://www.census.gov/econ/census07/www/geography/regions_and_divisions.html. [Google Scholar]
- 24.Kuijpers MA, van Marum RJ, Egberts AC, Jansen PA OLDY Study Group. Relationship between polypharmacy and underprescribing. Br J Clin Pharmacol. 2008;65:130–3. doi: 10.1111/j.1365-2125.2007.02961.x. Epub 2007 Jun 19. [DOI] [PMC free article] [PubMed] [Google Scholar]
- 25.Dwyer LL, Han B, Woodwell DA, Rechtsteiner EA. Polypharmacy in nursing home residents in the United States: results of the 2004 national nursing home survey. Am J Geriatr Pharmacother. 2010;8:63–72. doi: 10.1016/j.amjopharm.2010.01.001. [DOI] [PubMed] [Google Scholar]
- 26.Masoudi FA, Baillie CA, Wang Y, et al. The Complexity and cost of drug regimens of older patients hospitalized with heart failure in the United States, 1998–2001. Arch Intern Med. 2005;165:2069–76. doi: 10.1001/archinte.165.18.2069. [DOI] [PubMed] [Google Scholar]
- 27.New Hampshire. The Dartmouth Atlas of Health Care; Trustees of Dartmouth College [Internet] cited 2013 Sept 26. Available from: http://www.dartmouthatlas.org. [Google Scholar]
- 28.Aparasu RR, Mort JR, Brandt H. Polypharmacy trends in office visits by the elderly in the United States, 1990 and 2000. Res Social Adm Pharm. 2005;1:446–59. doi: 10.1016/j.sapharm.2005.06.004. [DOI] [PubMed] [Google Scholar]
- 29.Perry BA, Turner LW. A prediction model for polypharmacy: are older, educated women more susceptible to an adverse drug event? J Women Aging. 2001;13:39–51. doi: 10.1300/J074v13n04_04. [DOI] [PubMed] [Google Scholar]
- 30.Gupta S, Rappaport HM, Bennett LT. Polypharmacy among nursing home geriatric Medicaid recipients. Ann Pharmacother. 1996;30:946–50. doi: 10.1177/106002809603000905. [DOI] [PubMed] [Google Scholar]
Associated Data
This section collects any data citations, data availability statements, or supplementary materials included in this article.