

Summary
Glioblastoma is a highly lethal cancer for which novel therapeutics are urgently needed. Two distinct subtypes of glioblastoma stem-like cells (GSCs) were recently identified: mesenchymal (MES) and proneural (PN). To identify mechanisms to target the more aggressive MES GSCs, we combined transcriptomic expression analysis and kinome-wide short hairpin RNA screening of MES and PN GSCs. In comparison to PN GSCs, we found significant upregulation and phosphorylation of the receptor tyrosine kinase AXL in MES GSCs. Knockdown of AXL significantly decreased MES GSC self-renewal capacity in vitro and inhibited the growth of glioblastoma patient-derived xenografts. Moreover, inhibition of AXL with shRNA or pharmacologic inhibitors also increased cell death significantly more in MES GSCs. Clinically, AXL expression was elevated in the MES GBM subtype and significantly correlated with poor prognosis in multiple cancers. In conclusion, we identified AXL as a potential molecular target for novel approaches to treat glioblastoma and other solid cancers.
Highlights
-
•
shRNA screen identified kinases that alter GSC viability in a subtype-dependent manner
-
•
AXL is highly expressed in mesenchymal GSCs
-
•
Targeting AXL decreases mesenchymal GSC self-renewal, viability, and tumorigenicity
-
•
AXL expression predicts poor prognosis in several tumor types
To identify mechanistic differences between the mesenchymal and proneural glioblastoma subtypes, Goidts, Nakano, and colleagues performed a phenotypic screen, silencing the whole kinome in patient-derived mesenchymal and proneural glioblastoma stem-like cells (GSCs). AXL was identified as an important regulator of mesenchymal GSC viability and tumorigenicity, making it an attractive therapeutic target.
Introduction
Glioblastoma (GBM) is the most common primary malignant brain tumor in adults. Despite multimodal aggressive therapies, survival of a vast majority of the patients is less than 2 years with the 5-year survival rate as low as 5% (Stupp et al., 2009). Previous efforts in the development of therapeutics for GBM have largely depended on studies with conventional GBM cell lines. While providing some benefits, genetic and phenotypic drift is inevitable in these long-term in vitro cell cultures. Importantly, the standard GBM cell lines cannot recapitulate the heterogeneous cellular populations of GBM (Ernst et al., 2009; Lee et al., 2006). These limitations may partially explain the large gap between promising in vitro data and disappointing GBM clinical trial outcomes. The identification of effective therapeutics has been hindered, in part, by the lack of more clinically relevant GBM models. Tumor-initiating GBM stem-like cells (GSCs) isolated from patients propagate the heterogeneity of the original GBMs in immunocompromised mice and preserve specific genetic alterations found in the original tumor (Hemmati et al., 2003; Singh et al., 2004).
In the past decade, transcriptomic and methylation analyses have classified GBM tumors into several subtypes (Phillips et al., 2006; Sturm et al., 2012; Verhaak et al., 2010), including proneural (PN), classical, and mesenchymal (MES) GBMs. While these signatures are based on the predominant gene expression patterns in the tumor and correlate with mutation and epigenetic status, GBMs are very heterogeneous, and data demonstrate the presence of cells of multiple subtypes within a single tumor as well as transitions between subtypes (Bhat et al., 2013; Patel et al., 2014; Piao et al., 2013). Our work has classified the majority of GSCs as MES or PN based on transcriptomic signatures. In comparison to PN GSCs, MES GSCs display highly aggressive and radioresistant phenotypes (Mao et al., 2013). The core MES GSC gene signature also correlates with poor GBM patient prognosis, indicating the importance of understanding molecular mechanisms driving MES-specific biology. These patient-derived and subtype-specific GSCs provide a powerful model for the heterogeneous human disease and future therapy development.
Kinases are often activated in cancer, indicating the potential of kinase inhibitors for cancer therapy. Kinases control a wide variety of cell functions related to tumorigenesis, including survival/apoptosis, cell-cycle progression/proliferation, stem cell maintenance, DNA damage repair, cell motility/invasion, and therapeutic resistance. Indeed, the discovery of oncogenic kinases and development of target-specific inhibitors have already revolutionized the treatment of certain groups of cancers, exemplified by the success of Gleevec for chronic myeloid leukemia (Druker et al., 2001). Protein kinases are now firmly established as a major class of anti-cancer therapeutic targets. There has been an explosion in the number of kinase inhibitors that have successfully entered the clinic or have produced promising data in preclinical drug development pipelines (Zhang et al., 2009). While such success has not yet been achieved for GBM, identification of kinases whose inhibition attenuates GSC properties may pave the way toward novel therapeutics (Mellinghoff et al., 2012).
Here, we sought to identify new druggable therapeutic targets for GBM. We combined transcriptome expression profiling and loss-of-function approaches to identify human kinases that play differential roles in PN and/or MES GSCs. Using a human kinome-wide lentiviral shRNA library, we identified 82 candidates that are essential for the proliferation and viability of MES and/or PN GSC-containing neurosphere cultures in vitro. Among them, 54 specifically regulated MES GSCs, underlining the dependence of these GSC subtypes on differential oncogenic signals. Subsequently, the receptor tyrosine kinases (RTKs) MET and AXL were the only two genes that were significantly differentially expressed in PN and MES GSCs and the silencing of which caused a significantly different phenotype between PN and MES GSCs. Since an inhibitor against AXL has recently entered phase I clinical trials for hematopoietic malignancy (Holland et al., 2010; Janning et al., 2015), in this study, we decided to characterize AXL in GSCs derived from GBM tumors.
Results
Patient-Derived GSCs Display MES or PN Characteristics
The new “omics” data available for GBM suggesting the existence of several subtypes of GBM calls for detailed characterization of the tumor models used in vitro. As previously described (Mao et al., 2013), we successfully isolated GSCs from GBM patients that can readily recapitulate the original tumor’s phenotype in vivo (Figure 1A), express GSC cell surface markers (Figure 1B), and are more self-renewing than cells that are CD133 derived from the same tumor (Figure 1C). Supervised clustering using The Cancer Genome Atlas (TCGA) classification of the genome-wide expression profiles obtained from the isolated GSCs allowed us to classify them as MES or PN. Despite the abundance of data provided, these profiling methods do not yield information on genes that are directly involved in cell fate decisions. To fill this gap, we combined data from the genome-wide transcriptome profiles (Mao et al., 2013) with a loss-of-function screen. Based on the highly aggressive nature of MES GSCs, we specifically sought to identify kinases that (1) impair the viability of MES GSCs upon knockdown and (2) are differentially expressed in MES GSCs in comparison to PN GSCs and neural progenitor cells (NPs) derived from human fetal brains (Miyazaki et al., 2012; Nakano et al., 2011) (Figure 1D).
Figure 1.
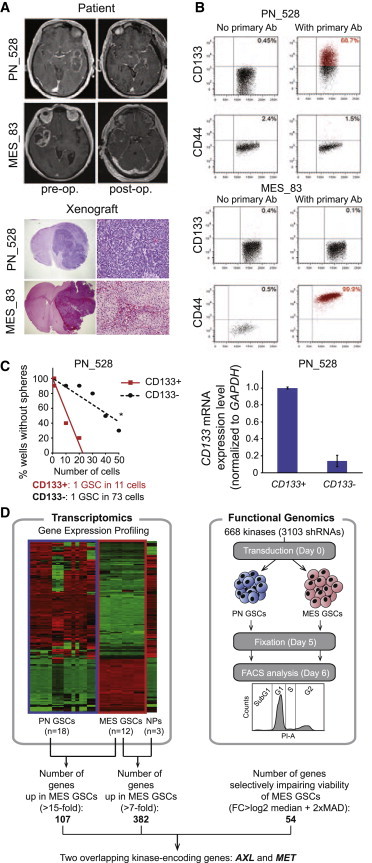
Patient-Derived PN and MES GSCs Used for In Vitro Screening
(A) MRI captions taken pre-operation and post-operation of GBM patients (upper) and H&E staining of the xenotransplanted cells in NOD/SCID mice (lower). Magnification is 20× (left) and 100× (right).
(B) Representative FACS plots demonstrating expression of CD133 and CD44 PN GSCs (PN_528) and in MES GSCs (MES_83).
(C) Neurosphere formation assay of CD133+ versus CD133- PN_528 GBM cells. CD133 mRNA expression level in sorted cells was verified by qRT-PCR (RT-PCR). Error bars represent the SD from three technical replicates. Stem cell frequency was calculated by ELDA analysis.
(D) Flowchart depicting the experimental procedure used to investigate kinases whose silencing induces cell death or impairs proliferation.
See also Figure S1.
Identification of Kinases that Impair Both MES and PN GSC Viability and Alter Cell Cycle
In order to identify kinases that induce cell death and/or cell-cycle arrest upon knockdown in GSCs of the PN and/or MES subtype, we performed a lentiviral-based silencing screen in vitro. We transduced the MES GSC line 83 and the PN GSC line 528 with a subset of the TRC library specifically targeting the human kinome. Using fluorescence-activated cell sorting (FACS) analysis with propidium iodide staining, we simultaneously detected cell death and characterized the different phases of the cell cycle. The significance of cell percentage in the G1, S, and G2 phases of the cell cycle was assessed after subtraction of the SubG1 phase.
Kinases that were equally relevant in both MES and PN GSCs were defined for each cycle phase separately. Analysis was based on normalized data averaged from shRNAs from both cell lines using one-sided adjusted p values (p < 0.05) and a threshold of the median fold change (FC) plus two median absolute deviations (MADs). Among the 668 kinases represented in the tested panel, knockdown of 7 kinases significantly increased the percentage of cells in the SubG1 phase in MES and PN GSCs in comparison to non-targeting controls (shNT), including FYN, RIPK3, and the RET kinases (Figure S1A). Another 13 kinases significantly altered the cell cycle by increasing the number of cells entering the S (such as CARKL, EPHA5, and MAP4K2) or the G2 phases (EGFR and DAPK2) in both MES and PN GSCs (Figure S1B).
Identification of Kinases Specifically Regulating MES or PN GSC Viability
In order to identify kinases that specifically regulate the viability of MES or PN GSCs, ratios of SubG1 cell number for each targeting shRNA to the shNT were calculated. This analysis was based on one-sided adjusted p values (p < 0.05) and a threshold of the median FC between PN and MES +2 times the MAD. Several of the identified kinases impaired viability of the MES GSCs only, as indicated by increased percentages of cells in the SubG1 phase of the cell cycle (Figure 2A). For example, knockdown of genes such as PKN3, PDPK1, and AXL significantly increased the percentage of SubG1 cells in MES GSCs in comparison to PN GSCs (Figures 2A and 2B). In contrast, targeting CDC2L5 and DYRK2 more strongly affected the percentage of SubG1 cells in PN GSCs (Figures 2A and 2B). Of the top three kinase hits in MES GSCs, AXL was the only one highly overexpressed in MES GSCs in comparison to PN GSCs at the mRNA level in our microarray analysis (Figure 2A). Therefore, our functional shRNA screen identified targets whose importance would not have been recognized in analysis of gene expression changes alone.
Figure 2.
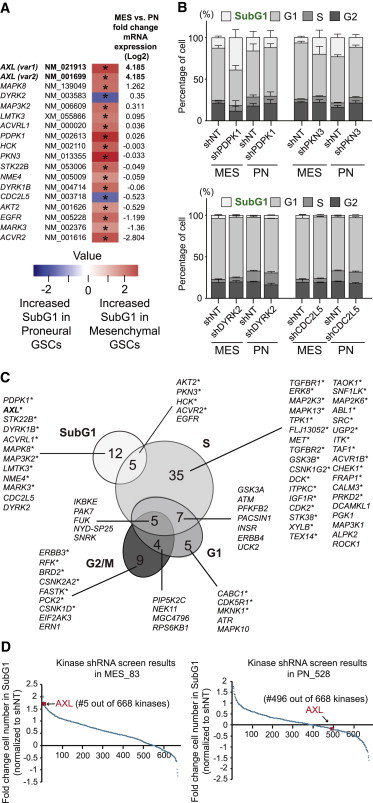
Knockdown of a Subset of Kinases Differentially Induces Cell Death in MES or PN GSCs
(A) List of kinases that induce cell death significantly (∗, adjusted p < 0.05) in MES GSCs (red) or in PN GSCs (blue). mRNA expression FC between PN and MES GSCs is indicated on the right side of the heatmap.
(B) Stacked bar charts of the top two genes inducing cell death in MES (above) or in PN (below) GSCs. Average of the shNT used for normalization and the shRNAs targeting the indicated gene is shown. Error bars represent the SD.
(C) Venn diagram grouping kinases whose silencing induces a significant change of the cell-cycle phases specific to MES or to PN GSCs (see also Figures S2 and S3). Asterisks highlight 54 kinases whose silencing altered the cell cycle specifically in MES GSCs.
(D) Ranking of AXL according to the cell number FC in SubG1 in MES and PN GSCs. Data are all initially normalized to the non-targeting shRNA.
Identification of Kinases Specifically Altering MES or PN GSC Cell Cycle Phase
After assessing the impact of the kinase directed shRNAs on the SubG1 phase, we further analyzed the cell-cycle data to identify kinases that differentially altered the G1, S, or G2 phases in MES or PN GSCs. We identified 70 kinases with specific activity in at least one of these three cell-cycle phases (Figure 2C). Differential cell-cycle effects of kinase directed shRNAs were most prominent in the S phase for MES GSCs, where GSK3A and AKT2 were found to significantly reduce the percentage of dividing cells (Figure S2). In PN GSCs, ROCK1, ALPK2, and MAP3K1 had differential S-phase effects. Moreover, the knockdown of certain kinases, such as IKBKE, PAK7, or FUK, resulted in effects on multiple cell-cycle phases, emphasizing the importance of those genes for the proliferation of the targeted GSCs (Figures 2C and S2). To assess the relevance of the identified kinases, we performed a gene ontology analysis using the DAVID bioinformatics resource. As depicted in Figure S3, shRNAs that specifically impaired the MES GSC cell cycle were directed against kinases enriched for known biological processes regulating cell cycle. In contrast, shRNAs specifically altering the PN GSC cell cycle were directed against kinases associated with neurological processes.
A Combination of Transcriptomics and Functional Genomics Identifies AXL
Genome-wide mRNA expression profiling was performed on GBM neurosphere lines each cultivated from six PN and four MES high-grade glioma patients in triplicate (Mao et al., 2013). Genes that showed an increase of mRNA expression in MES GSCs of >15-fold as compared with PN GSCs were designated as MES specific. To assess the specificity of the gene expression for GSCs in comparison to non-neoplastic NPs, three independent cultures from a normal NP line were included in the analysis. We selected candidate genes with mRNA expression >7-fold higher in MES GSCs compared with the NPs. In order to identify genes that selectively impair the viability of MES GSCs, we compared the list of identified genes based on these transcriptomics data with the ones from the functional genomics screen. The genes encoding the AXL RTK (AXL) and the MET Proto-Oncogene (MET) proteins were the only two genes that appeared in both datasets (Figures 1C, 2A, 2C, and 2D). As recent studies indicate that AXL is a potentially attractive therapeutic target and one of its kinase inhibitors has entered the phase I clinical trial for hematologic malignancy, we focused on AXL for further characterization in GSCs in this study.
AXL Is Highly Expressed in MES but Not PN GSCs
To characterize the pathophysiological role of AXL in MES and PN GSCs, we further analyzed the data from the transcriptome microarray (Mao et al., 2013). In these data, including 18 patient-derived PN GSC samples, 12 patient-derived MES GSC samples, 5 astrocyte samples, and 3 normal NPs, all 12 MES GSC samples revealed high expression of AXL. In contrast, 18 PN samples showed either undetectable AXL expression by microarray analysis or substantially lower expression (Figure 3A). These results were confirmed by qRT-PCR using three PN and three MES GSC samples (Figure 3B). AXL expression in MES GSCs was also elevated in comparison to NPs (Figure 3A). Concordant with the mRNA expression, AXL protein expression was increased in MES compared with PN GSCs, as determined via immunoblotting (Figure 3C) and immunofluorescence (Figure 3D). In addition, the phosphorylated form of AXL (pY779) was only detected in MES GSCs (Figures 3C and 3D), suggesting that the AXL pathway is specifically activated in MES but not PN GSCs. Our data are in accordance with other datasets of patient-derived GBM spheres (Figures 3E and 3F; Bhat et al., 2013; De Bacco et al., 2012) and GBM patient specimens (Figures 3G and 3H; Brennan et al., 2013; Sturm et al., 2012). Together, these data demonstrate that AXL is preferentially expressed and activated in MES GBM.
Figure 3.
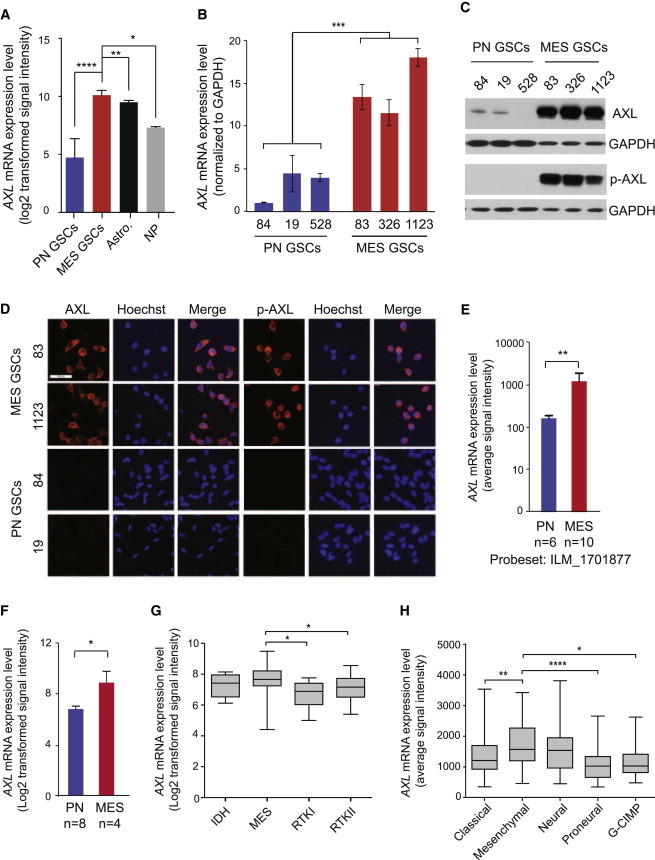
AXL Is More Highly Expressed in MES Than PN GSCs
(A) Microarray analysis of AXL mRNA expression in PN GSCs from individual patients (n = 18), MES GSCs (n = 12), astrocytes (n = 5), and neural progenitors (n = 3) (Mao et al., 2013) (∗p < 0.05; ∗∗p < 0.01; ∗∗∗∗p < 0.0001; Mann Whitney t test in comparison to MES GSCs).
(B) AXL mRNA expression as determined by qRT-PCR in PN (n = 3) and MES (n = 3) (∗∗∗p < 0.0001; t test). Error bars represent the SD from three technical replicates.
(C) Representative western blot of total AXL and phospho-AXL (pY779) expression in PN (528, 19, and 84) and MES GSCs (83, 326, and 1123).
(D) Representative immunofluorescent images of total AXL and phospho-AXL staining in MES and PN GSCs (scale bar represents 50 μm).
(E and F) mRNA expression of AXL as determined by gene expression profiling from previously published datasets: (E) De Bacco et al. (2012) (∗∗p < 0.01, unpaired t test) and (F) Bhat et al. (2013) (∗p = 0.0124, unpaired t test).
(G) AXL expression is higher in the MES subtype (n = 18) compared with the IDH (n = 5), RTKI (n = 5), and RTKII (n = 28) subtypes, as determined by RNaseq data from individual patients (TCGA dataset, classification by Sturm et al., 2012). Error bars represent the minimum and maximum data points (∗p < 0.05; unpaired t test).
(H) AXL is higher in the MES subtype (n = 55) compared with the classical (n = 42), PN (n = 31), and G-CIMP (n = 8) subtypes but not to the neural (n = 28) subtype, as determined by RNaseq data from individual patients (TCGA dataset) (∗p < 0.05, ∗∗p < 0.01, ∗∗∗∗p < 0.0001; unpaired t test). Error bars represent the minimum and maximum data points.
Knockdown of AXL Decreased Clonogenicity of MES GSCs In Vitro
To further confirm the high-throughput screening results indicating that AXL shRNA increased the number of SubG1 cells (Figure 4A) and to investigate the function of AXL in MES GSCs, we transduced two MES GBM sphere samples (83 and 1123) with two gene-specific shRNAs for AXL (shAXL#1 and shAXL#2) and shNT as a control. The knockdown of AXL protein by the directed shRNAs after transduction was confirmed using immunoblotting (Figure 4B). In vitro growth assays demonstrated that knockdown of AXL decreased the growth of 83 and 1123 MES GSCs (Figure 4C) in comparison to the shNT. In vitro limiting dilution assays showed a decreased capacity to form neurospheres in 83 and 1123 GBM upon AXL knockdown, indicating a reduced clonogenicity of the GSCs (Figures 4D and 4E). These observations were concordant with an increase in apoptosis, as demonstrated by significantly higher Caspase 3/7 activity with AXL targeting (Figure 4F). As suggested by its expression level, the knockdown of AXL in the PN GSC line did not impair clonogenicity (Figure 4E) nor increase apoptosis (Figure 4F). Interestingly, MES GSCs also showed higher sensitivity than the PN_528 GSC line to BGB324, an AXL inhibitor (Figure 4G). Sigmoidal dose-response analysis indicated a lower IC50 in the MES versus the PN GSCs tested (IC50 of 1.027 and 2.035 μM, respectively). The specificity of BGB324 for AXL was assessed by the level of AXL phosphorylation with and without inhibitor treatment (Figure 4G).
Figure 4.
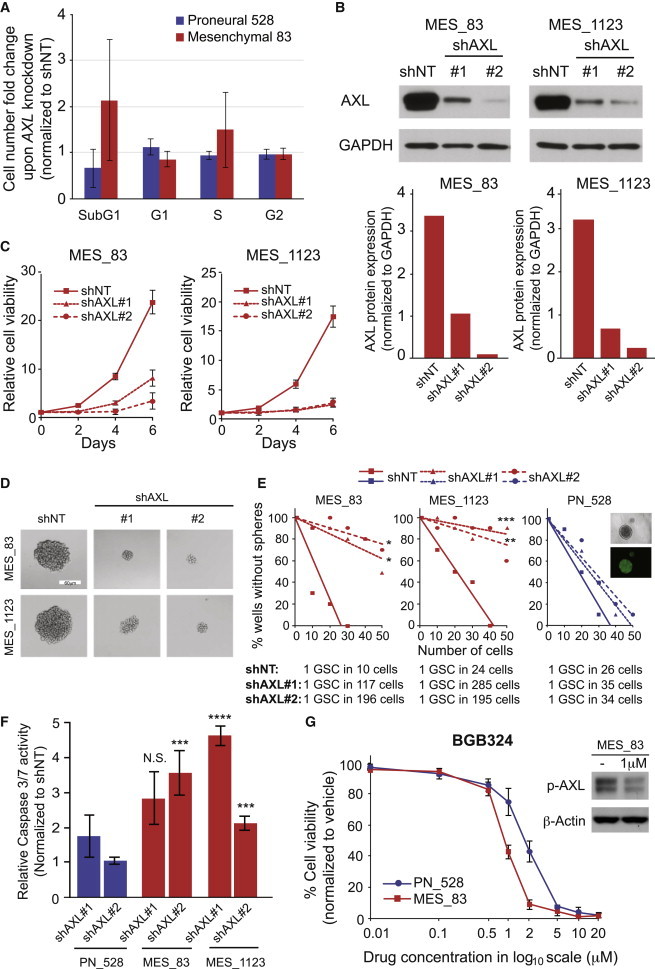
AXL Is Required for the Growth and Clonogenicity of MES GSCs
(A) Average FC of cell number in different phases of the cell cycle upon AXL knockdown normalized to shNT. Error bars represent the SD from 5 independent shRNAs targeting AXL.
(B) Representative western blot results of shNT and shAXL samples from 83 and 1123 GSCs with GAPDH as a loading control (upper). AXL expression was quantified and normalized to GAPDH (lower).
(C) In vitro growth assay in 83 and 1123 MES GSCs transduced with shNT or two different shRNA targeting AXL (shAXL#1 and #2) measured at days 2, 4, and 6. Error bars represent the SD of three technical replicates.
(D) Representative pictures of GSCs cultivated as neurospheres transduced with shNT or AXL directed shAXL#1 or shAXL#2. Pictures were taken 5 days after transduction. Scale bar represents 60 μm.
(E) Limiting dilution neurosphere formation assay in MES (83 and 1123) and PN (528) GSCs. Cells were transduced with shNT or shAXL#1 or shAXL#2 in ten technical replicates. Readout was performed 12 days after transduction (∗p < 0.5; ∗∗p < 0.01; ∗∗∗p < 0.001; linear regression analysis). Stem cell frequency was calculated by ELDA analysis.
(F) Caspase activity assay of PN 528 GSCs and MES GSCs (83 and 1123) 4 days after transduction with shNT and shAXL#1 and shAXL#2. Results are normalized to shNT. Error bars represent the SD of three biological replicates. Significance was assessed by comparing the rate of caspase activity for each shRNA in the PN GSC line with the MES GSC lines (N.S. = not significant; ∗∗∗p < 0.005; ∗∗∗∗p < 0.001; paired t test).
(G) AXL inhibitor treatment effects on MES_83 and PN_528 GSC growth. Results were obtained 72 hr after BGB324 treatment at the indicated concentrations (IC50 of 1.027 μM [MES_83] and 2.035 μM [PN_528]). Error bars represent the SD of three technical replicates. Western blot phospho-AXL expression in MES 83 GSCs with or without BGB324 treatment for 24 hr. β-Actin served as loading control.
AXL Regulates In Vivo Tumorigenicity of MES GSCs
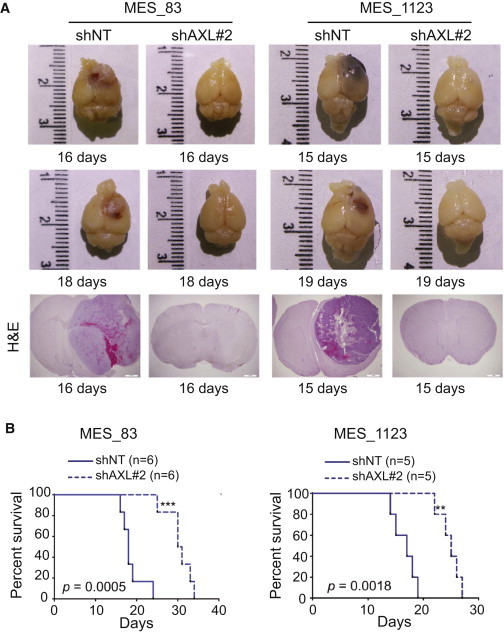
We next assessed the role of AXL in MES GSC tumorigenic potential. To this end, we knocked down AXL in 83 and 1123 GSCs using shALX#2 and used shNT as a control. Transduced cells were orthotopically injected into the striatum of immunocompromised mice. Mice receiving shAXL#2 transduced 83 or 1123 GSCs did not show any signs of tumors 2 weeks after transplantation, whereas mice injected with shNT transduced cells had large GBMs (Figure 5A). Knockdown of AXL also significantly increased the survival of mice until the development of neurological signs in comparison to shNT controls (n = 12 with 83 GBM, p = 0.0005, with log-rank test, and n = 10 with 1123 GBM, p = 0.0018, with log-rank test). However, animals that received shAXL-infected 83 or 1123 GSCs developed tumors about a month after transplantation (Figure S4). These results suggest that AXL is an important regulator of MES GBM growth, but not absolutely required for tumor initiation.
Figure 5.
AXL Contributes to Tumor Propagation of MES GSCs
(A) Representative photographs of mouse brains injected with 83 and 1123 GSCs transduced with shNT or shAXL#2 and representative H&E staining of shNT and shAXL mouse xenografts at the indicated time points.
(B) Kaplan-Meier survival curves for mice injected with 83 and 1123 GSCs transduced with shNT (n = 6 and n = 5, respectively) and shAXL#2 (n = 6 and n = 5, respectively) (see also Figure S4).
AXL Expression Correlates with CD44 Expression and Is Highly Expressed in Glioma Samples
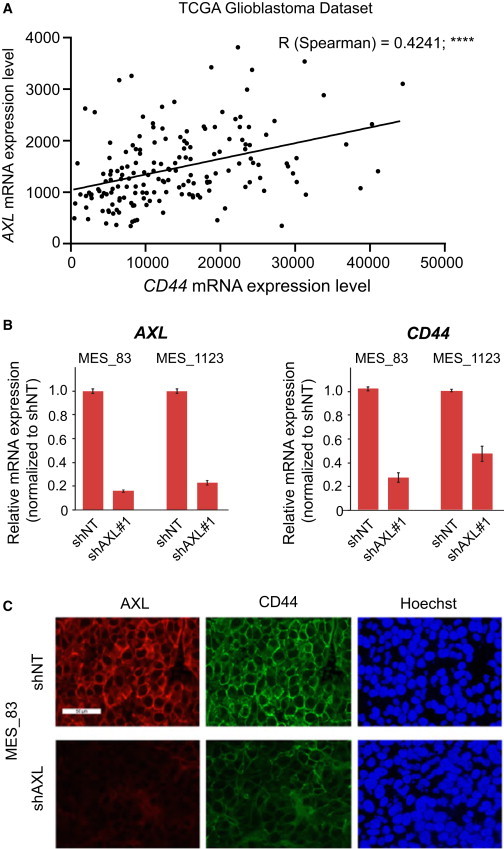
In view of the importance of AXL for the viability of GSCs from the MES subtype, we investigated whether AXL mRNA expression correlated with the mRNA expression of the MES marker CD44. The RNaseq data generated by the TCGA Research Network (http://cancergenome.nih.gov/) showed a significant correlation between the expression of both genes (Figure 6A). Interestingly, the silencing of AXL in two MES GSC lines (83 and 1123) decreased the mRNA expression of CD44 (Figure 6B), suggesting a co-regulation of both genes. These data were confirmed at the protein level by immunofluorescent staining of orthotopically injected 83 GSCs transduced with shNT or shRNA targeting AXL (shAXL#2) (Figure 6C). Supporting this finding, in orthotopically xenografted tumors derived from patient GSCs, AXL co-expressed with CD44 preferentially in perinecrotic pseudopallisading areas (Figure S5). Moreover, AXL and CD44 co-expression correlated with the clinical survival time of glioma patients. The data generated by TCGA Research Network, visualized using the GBM-Bio Discovery Portal, shows that the co-upregulation of AXL and CD44 is a predictor of poor survival in GBM patients (Figure 7A).
Figure 6.
AXL Expression Correlates with CD44
(A) AXL mRNA expression significantly correlates with CD44 mRNA expression. RNaseq data from n = 169 GBM patients are represented.
(B) Relative mRNA expression of AXL and CD44 upon AXL knockdown. Data are normalized to shNT and are represented as mean of technical replicates ± SD.
(C) Immunofluorescent staining of AXL and CD44 on MES_83 GSCs in the mouse brain with (shAXL#2) or without (shNT) knockdown of AXL. Tumors were removed 24 days after injection (see also Figure S5). Scale bar represents 50 μm.
Figure 7.
AXL Is Highly Expressed in Clinical High-Grade Glioma Tumors
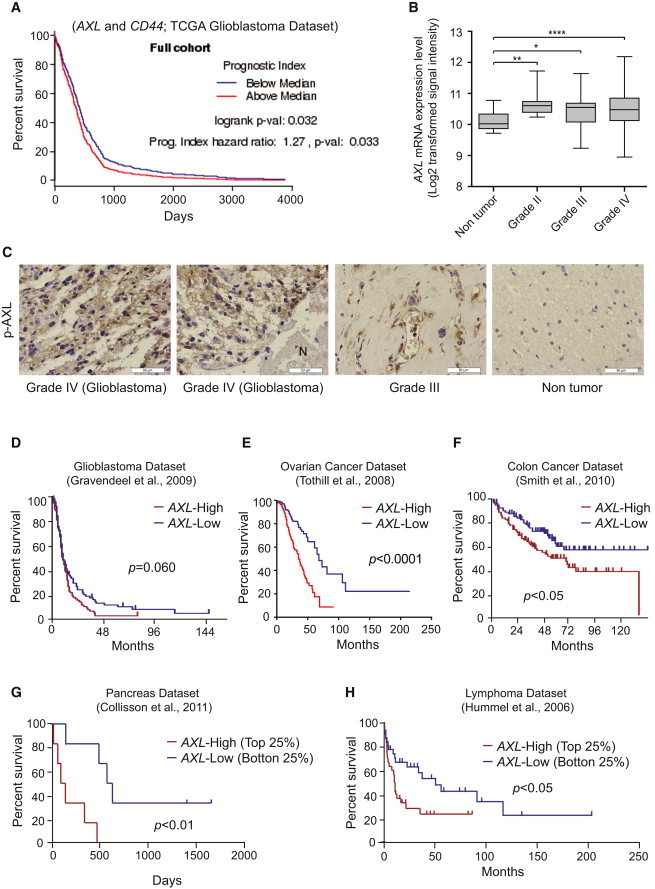
(A) Survival analysis based on the impact of the multi-gene prognostic index. Affymetrix data generated by TCGA Research Network that are available at the TCGA data portal were used. Visualization of the data was performed using the GBM-BioDP (Celiku et al., 2014).
(B) AXL is more highly expressed in astrocytoma and GBM than in non-tumor tissue (Sun et al., 2006) (n = 23 non-tumor; n = 7 grade II; n = 19 grade III; n = 81 GBM). ∗p < 0.05, ∗∗p < 0.01, ∗∗∗∗p < 0.0001 (Mann-Whitney test).
(C) Representative immunohistochemistry (ICH) staining of phospho-AXL in WHO grade IV (GBM), grade III and non-tumor samples. Scale bar represents 50 μm.
(D–H) Patient survival data based on AXL expression. (D) GBM dataset. The cutoff was based on the median, n = 156, p = 0.060 with log-rank test. (E) Ovarian cancer dataset through Oncomine. The cutoff was based on the median, n = 288, p < 0.0001 with log-rank test. (F) Poorly and moderately differentiated colon cancer samples. The cutoff was based on the median, n = 164, p < 0.05 with log-rank test. (G) Top and bottom 25% samples from the pancreatic ductal carcinoma dataset through Oncomine, n = 13, p < 0.01 with log-rank test. (H) Top and bottom 25% samples from the Burkitt’s lymphoma dataset through Oncomine, n = 60, p < 0.05 with log-rank test.
Finally, we assessed the relevance of AXL as a potential therapeutic target for GBM and other tumor entities. Evaluating the Sun et al. (2006) dataset, elevated AXL expression was observed in glioma compared with non-tumor (n = 23 non-tumor group; n = 7 grade II astrocytoma; n = 19 grade III astrocytoma; n = 81 GBM group; p < 0.01, p < 0.05, and p < 0.0001, respectively, probeset: 202686_s_at) (Figure 7B). Supporting this expression pattern, we found that AXL was highly expressed in high-grade gliomas, including GBM, but not in normal brain tissues or lower grade gliomas (Figure 7C), as determined by evaluating phospho-AXL immunoreactivities in glioma patient sections. In the GBM samples from the Gravendeel et al. (2009) dataset through the R2 microarray analysis and visualization platform (http://r2.amc.nl), AXL expression trended toward poor survival of GBM patients, although the data did not meet statistical significance (Figure 7D; p = 0.060 with log-rank test). In silico analysis of existing datasets for other cancer types, including ovarian, colon, pancreatic, and Burkitt’s lymphoma cancer, also linked AXL to poor prognosis, although this was not true for every tumor type or dataset (Figures 7E–7H) (Collisson et al., 2011; Hummel et al., 2006; Smith et al., 2010; Tothill et al., 2008). Collectively, these results indicate that AXL is a potential molecular target for anti-cancer therapy.
Discussion
In this study, we took a stepwise approach with transcriptome expression analysis and a functional shRNA screen in order to identify common and differential regulators of PN and MES GSC growth.
AXL is a member of the TAM (TYRO3-, AXL-, MER-TK) subfamily of RTKs (O’Bryan et al., 1991). This family shares structural homology, including a conserved sequence within the kinase domain (Linger et al., 2008). In contrast to little or no expression in normal brain tissue, aberrant AXL expression in GBM has been described, raising the possibility that AXL could be an attractive therapeutic target for GBM. Earlier work has established the physiological roles of AXL in glioma cell lines using both in vitro cell culture systems and in vivo xenografted tumor models (Keating et al., 2010; Vajkoczy et al., 2006). Gene-specific knockdown of AXL has been shown to induce cell apoptosis, decrease cell proliferation and migration, and improve sensitivity to temozolomide—the current first-line chemotherapy for GBM (Keating et al., 2010; Vajkoczy et al., 2006). Our data demonstrate that a subset of GSCs in GBM tumors—MES but not PN GSCs—is sensitive to AXL knockdown both in vitro and in vivo. Supporting these differential sensitivities, a phosphorylated form of AXL is detected only in the MES GSCs. Knubel et al. (2014) recently reported that foretinib treatment hindered tumor growth in a mouse model of GBM using the glioma cell line U251 in vivo. Notably, foretinib is a multikinase inhibitor with the most potent effect on another TAM RTK, MER-TK, with comparable inhibitory effects on AXL, c-Met, and VEFRR2/KDR (Liu et al., 2009; Qian et al., 2009). Several phase II clinical trials with foretinib are in progress, addressing breast, liver, renal, gastric, and other cancers (Choueiri et al., 2013; Liu et al., 2009; Shah et al., 2013). Zhang et al. (2012) recently identified that activation of the AXL kinase is a mechanism by which resistance is acquired to EGFR-targeted tyrosine kinase inhibitors (TKIs) in EGFR mutant non-small-cell lung cancers. In some cases, they found that AXL upregulation occurs in the context of what appeared to be epithelial to MES transition (EMT) and EMT-associated transcriptional reprogramming, leading to acquired resistance. Vuoriluoto et al. (2011) also reported similar data for AXL-mediated EMT-like changes in breast cancer cells. These studies raise the possibility that secondary molecular events may occur in GBM cells or GSCs that facilitate escape from AXL targeting therapies. For example, AXL inhibition may lead to the activation of other TAM family members such as MerTK and Tyro3. Indeed, TAM family members form heterodimers and cross-talk with each other (Linger et al., 2008). Since they share the common ligand Gas6 and the common downstream signaling pathways PI3K and MAPK, targeting AXL alone may lead to a switch to other TAM family members to persist the activation of the same ligand-driven oncogenic pathways. Our data illustrate that AXL silencing significantly prolongs survival of mice bearing GSC-derived brain tumors, yet eventually these mice die due to tumor burden. As tumors can arise from AXL-shRNA-transduced MES GSCs, it will be important to investigate how these tumors escape from AXL inhibition in additional studies. Of note, foretinib treatment reduces growth of U251-derived mouse subcutaneous tumors, whereas when this treatment is discontinued, tumors showed a quick upturn reaching growth rates even more aggressive than naive tumors (Knubel et al., 2014). These studies indicate a risk for advancing malignancy if tumors are treated with AXL inhibition solely. Future studies will need to explore downstream molecular changes after AXL inhibition in GSCs and GSC-derived tumors in order to avoid establishing acquired resistance in GBM patients after AXL-targeted therapies.
In conclusion, our experimental setting allowed the identification of differences in survival and proliferation pathways between PN and MES GSCs. The sensitivity of MES GSCs to the silencing of AXL highlights its importance in this subgroup of GSCs and suggests its potential for use as a therapeutic target.
Experimental Procedures
GSC Isolation and Cell Culture
GSC samples were collected at The Ohio State University in accordance with an institutional review board-approved protocol. GSCs were isolated as previously described (Gu et al., 2013; Mao et al., 2013). Neurospheres were cultured in DMEM/F12 (Invitrogen) containing 2% B27 supplement (Invitrogen) (vol/vol), heparin (2.5 μg/ml), basic fibroblast growth factor (bFGF) (Peprotech, 20 ng/ml), and epidermal growth factor (EGF) (Peprotech, 20 ng/ml). bFGF and EGF were added twice a week. The phenotypes of these neurospheres were characterized according to the methods described previously (Guvenc et al., 2013; Jijiwa et al., 2011). All of the neurospheres used in this study were maintained <30 passages. The human fetal neural stem cell sample (16wf) was established at the University of California at Los Angeles as described previously (Miyazaki et al., 2012; Nakano et al., 2011). Astrocytes were derived from fetal neurospheres (16wf) (Guvenc et al., 2013; Miyazaki et al., 2012; Nakano et al., 2011).
Lentivirus Production and Transduction
Screening of the kinase panel shRNA from The Mission RNAi library (Sigma-Aldrich) was performed in 96-well plates as previously described (Goidts et al., 2012). Briefly, DNA preparations were obtained using a large-scale plasmid purification kit (QIAGEN and Roche). HEK293T packaging cells were co-transfected with the pLKO.1 vector encoding the shRNA and the helper plasmids for virus production (psPAX2 and pMGD2), using Trans-IT (Mirus). Before transduction, spheres were dissociated mechanically (83 MES GSC) or with trypsin (528 PN GSC). Cells were seeded in 96-well plates at 10,000 cells per well in a final volume of 100 μl and transduced at a multiplicity of infection of 10. At 24 hr after transduction, medium was renewed upon plate centrifugation for 2 min at 800 rpm. Further details about the controls are available in the Supplemental Information.
The production of single shRNAs targeting AXL (shAXL#1: GCGGTCTGCATGAAGGAATTT, shAXL#2: GCTGTGAAGACGATGAAGATT) was performed in 6-cm petri dishes. After 72 hr, produced lentiviruses were concentrated by ultracentrifugation of the HEK293T supernatant at 25,000 rpm.
High-Throughput FACS Analysis
Cell-cycle analysis was performed using a propidium iodide (PI) staining assay. Briefly, cells were fixed using 70% ethanol 5 days after viral transduction. After incubation at 4°C overnight, plates were centrifuged at 1,000 rpm for 5 min. Ethanol was removed, and 200-μl room temperature cell-cycle staining reagent (0.1% Triton X-100,PBS, 200-μg/ml DNase-free RNase, 250-μg/ml PI) was added. Cells were resuspended, and the plates were incubated at room temperature for 30 min, followed by cell-cycle analysis using a flow cytometer equipped with a high-throughput sampler. To minimize potential artifacts caused by edge effects, the outermost wells were not used.
Gene Expression Analysis
Gene expression data were downloaded from GEO datasets: Mao et al. (2013) (GSE 67089), Bhat et al. (2013) (GSE49009), De Bacco et al. (2012) (GSE36426), Sun et al. (2006) (GSE4290). R Bioconductor was used for the analysis of raw .cel files. The heatmap of transcriptomics analysis was made by Cluster and Treeview.
In Vitro Proliferation and Apoptosis Assay
After 83 and 1123 MES GSCs had been infected with AXL shRNA lentivirus for 5 days, 1,000 cells were seeded into wells of 96-well plates. AlamarBlue (Life Technologies) was used for the evaluation of cell number following the protocol provided by manufacturer at different time points (days 0, 2, 4, and 6). In order to measure apoptosis upon AXL silencing, 5,000 cells were seeded per well in a 96-well plate and transduced with shNT or shAXL. After 4 days, caspase 3 and 7 activities were measured using a Caspase-Glo 3/7 Assay (Promega), according to the manufacturer’s instructions. BGB324 was used to treat cells at final concentrations of 0.01, 0.1, 0.5, 1, 2, 5, 10, and 20 μM. After dissociation into single-cell suspensions, 1,000 cells per well were seeded into 96-well plates. At 72 hr after treatment, cell viability was measured using AlamarBlue.
Limiting Dilution Neurosphere Formation Assay
After infection with shNT and shAXL lentivirus as described above, 83 and 1123 MES GSCs were seeded into 96-well plates at densities of 1, 10, 20, 30, 40, and 50 cells per well. Spheres with diameters >60 μm were counted at day 7 under an inverted microscope with a digital camera (Olympus). Extreme limiting dilution assay (ELDA) analysis were performed using the software available at http://bioinf.wehi.edu.au/software/elda/.
Western Blot Analysis
A detailed protocol can be found in the supplemental information. The membranes were treated with anti-AXL (Cell Signaling #8661), anti-phospho-AXL (R&D AF2228), and anti-GAPDH antibodies (Abcam ab9482). Protein expression was visualized with Amersham ECL western blot system (GE Healthcare Life Sciences). GAPDH served as a loading control, and band intensity was quantified using Image J software.
RNA Extraction and qRT-PCR
Total RNA was prepared using RNeasy mini kit (QIAGEN) according to the manufacturer’s instructions. A detailed protocol and primer sequences are listed in the Supplemental Information.
Immunohistochemistry
Immunohistochemistry (IHC) was carried out as previously described (Jijiwa et al., 2011). After perfusion with ice-cold PBS and 4% (wt/vol) paraformaldehyde (PFA), mice brains were fixed in 4% PFA for 24 hr and then transferred into 10% formalin. Tissue embedding and sectioning were performed at the Comparative Pathology and Mouse Phenotyping Shared Resource of Ohio State University. The slides were treated with primary antibody overnight at 4°C and incubated with a horseradish peroxidase (HRP)-conjugated secondary antibody for 1 hr at room temperature. Slides incubated without primary antibodies served as negative controls. Chromogenic visualization followed using a DAB substrate kit (Vector), and nuclei were counterstained with hematoxylin.
Immunocytochemistry and Immunofluorescence
For immunocytochemistry, neurospheres were dissociated into single cells and seeded onto coverslips coated with 0.5% laminin (2 × 10⁴ per well). After 24 hr, the cells were fixed with 4% (wt/vol) PFA, blocked with 1% BSA containing 0.3% Triton-X, and treated with primary antibody at 4°C overnight. The cells were then incubated with Alexa Flour 555-conjugated secondary antibody for 45 min at room temperature. Nuclei were counterstained with Hoechst 35228, and the coverslips were mounted with anti-fade reagent (Life Technologies). Images were captured using a fluorescence upright microscope (Olympus DP71). Identical filters, objectives, and acquisition parameters were used for each experiment.
For immunofluorescence, mouse brains were fixed, embedded, and sectioned as described above. After blocking for 1 hr with 10% normal goat serum, the slides were co-incubated with rabbit anti-AXL (Cell Signaling, #8661) and mouse anti-CD44 antibody (Cell Signaling, #3570) overnight at 4°C and treated with anti-mouse Alexa Fluor 488 (Cell Signaling) and anti-rabbit Alexa Fluor 555 (Cell Signaling) conjugated secondary antibodies for 1 hr at room temperature. Counterstaining was performed with Hoechst 35228 (Cell Signaling), and images were captured as described above.
In Vivo Tumor Propagation
Six-week-old nude mice were obtained from the animal research facilities of The Ohio State University. All animal experiments were carried out at The Ohio State University under an Institutional Animal Care and Use Committee (IACUC)-approved protocol according to NIH guidelines (IACUC Number: 2009A0241); 83 and 1123 MES GSC suspensions expressing shNT and shAXL#2 (1 × 10⁴ cells in 2 μl of PBS) were injected into the brains of nude mice as previously described (Guvenc et al., 2013; Miyazaki et al., 2012; Nakano and Kornblum, 2009). Animals were monitored until the development of neuropathological symptoms.
Statistical Analysis
For analysis of FACS data, measurements with less than 2,000 cell counts were excluded. Measurements were standardized by the average of the non-target shRNA measurements separately for each plate. Ratios were log2 transformed to more closely follow a normal distribution. Relevant kinase directed shRNAs were identified using the empirical Bayes approach (Smyth, 2004) based on moderated t statistics as implemented in the Bioconductor package limma (Smyth, 2005). All p values were adjusted for multiple testing using Benjamini-Hochberg correction in order to control the false discovery rate. Adjusted p values below 0.05 were considered statistically significant. All analyses were carried out using software R 3.0.1. (RDC Team, 2011). A detailed method is described in the Supplemental Information.
Functional data were analyzed using Graphpad prism 6 and presented as mean ± SD. Statistical significance of Kaplan-Meier survival plot was determined by log-rank test; p < 0.05 was considered as statistically significant for all statistical methods.
Author Contributions
P.C. and E.P. designed experiments, performed experiments, and analyzed data. S.-H.K. performed experiments and analyzed data. D.T. and L.P. performed experiments. T.H. analyzed data. A.H. and P.L. wrote the manuscript. I.N. designed experiments, analyzed data, and wrote manuscript. V.G. designed experiments, performed experiments, analyzed data, and wrote the manuscript.
Acknowledgments
We would like to thank David Jones for fruitful discussion and suggestions. P.C. was supported by The First Hospital of China Medical University. E.P. was supported by the Helmholtz International Graduate School for Cancer Research. This work was supported by a fund of the Bundesministerium für Bildung und Forschung, BMBF (NGFNplus, #01GS0883) to V.G. and CA163205-01A1, NS083767-01, CA175875-01A1, and NS087913-01 to I.N. and P30 CA016058 to the Comparative Pathology and Mouse Phenotyping Shared Resource of Ohio State University.
Footnotes
This is an open access article under the CC BY-NC-ND license (http://creativecommons.org/licenses/by-nc-nd/4.0/).
Contributor Information
Ichiro Nakano, Email: ichiro.nakano@osumc.edu.
Violaine Goidts, Email: v.goidts@dkfz.de.
Supplemental Information
References
- Bhat K.P., Balasubramaniyan V., Vaillant B., Ezhilarasan R., Hummelink K., Hollingsworth F., Wani K., Heathcock L., James J.D., Goodman L.D. Mesenchymal differentiation mediated by NF-κB promotes radiation resistance in glioblastoma. Cancer Cell. 2013;24:331–346. doi: 10.1016/j.ccr.2013.08.001. [DOI] [PMC free article] [PubMed] [Google Scholar]
- Brennan C.W., Verhaak R.G., McKenna A., Campos B., Noushmehr H., Salama S.R., Zheng S., Chakravarty D., Sanborn J.Z., Berman S.H., TCGA Research Network The somatic genomic landscape of glioblastoma. Cell. 2013;155:462–477. doi: 10.1016/j.cell.2013.09.034. [DOI] [PMC free article] [PubMed] [Google Scholar]
- Celiku O., Johnson S., Zhao S., Camphausen K., Shankavaram U. Visualizing molecular profiles of glioblastoma with GBM-BioDP. PLoS ONE. 2014;9:e101239. doi: 10.1371/journal.pone.0101239. [DOI] [PMC free article] [PubMed] [Google Scholar]
- Choueiri T.K., Vaishampayan U., Rosenberg J.E., Logan T.F., Harzstark A.L., Bukowski R.M., Rini B.I., Srinivas S., Stein M.N., Adams L.M. Phase II and biomarker study of the dual MET/VEGFR2 inhibitor foretinib in patients with papillary renal cell carcinoma. J. Clin. Oncol. 2013;31:181–186. doi: 10.1200/JCO.2012.43.3383. [DOI] [PMC free article] [PubMed] [Google Scholar]
- Collisson E.A., Sadanandam A., Olson P., Gibb W.J., Truitt M., Gu S., Cooc J., Weinkle J., Kim G.E., Jakkula L. Subtypes of pancreatic ductal adenocarcinoma and their differing responses to therapy. Nat. Med. 2011;17:500–503. doi: 10.1038/nm.2344. [DOI] [PMC free article] [PubMed] [Google Scholar]
- De Bacco F., Casanova E., Medico E., Pellegatta S., Orzan F., Albano R., Luraghi P., Reato G., D’Ambrosio A., Porrati P. The MET oncogene is a functional marker of a glioblastoma stem cell subtype. Cancer Res. 2012;72:4537–4550. doi: 10.1158/0008-5472.CAN-11-3490. [DOI] [PubMed] [Google Scholar]
- Druker B.J., Sawyers C.L., Kantarjian H., Resta D.J., Reese S.F., Ford J.M., Capdeville R., Talpaz M. Activity of a specific inhibitor of the BCR-ABL tyrosine kinase in the blast crisis of chronic myeloid leukemia and acute lymphoblastic leukemia with the Philadelphia chromosome. N. Engl. J. Med. 2001;344:1038–1042. doi: 10.1056/NEJM200104053441402. [DOI] [PubMed] [Google Scholar]
- Ernst A., Hofmann S., Ahmadi R., Becker N., Korshunov A., Engel F., Hartmann C., Felsberg J., Sabel M., Peterziel H. Genomic and expression profiling of glioblastoma stem cell-like spheroid cultures identifies novel tumor-relevant genes associated with survival. Clin. Cancer Res. 2009;15:6541–6550. doi: 10.1158/1078-0432.CCR-09-0695. [DOI] [PubMed] [Google Scholar]
- Goidts V., Bageritz J., Puccio L., Nakata S., Zapatka M., Barbus S., Toedt G., Campos B., Korshunov A., Momma S. RNAi screening in glioma stem-like cells identifies PFKFB4 as a key molecule important for cancer cell survival. Oncogene. 2012;31:3235–3243. doi: 10.1038/onc.2011.490. [DOI] [PubMed] [Google Scholar]
- Gravendeel L.A., Kouwenhoven M.C., Gevaert O., de Rooi J.J., Stubbs A.P., Duijm J.E., Daemen A., Bleeker F.E., Bralten L.B., Kloosterhof N.K. Intrinsic gene expression profiles of gliomas are a better predictor of survival than histology. Cancer Res. 2009;69:9065–9072. doi: 10.1158/0008-5472.CAN-09-2307. [DOI] [PubMed] [Google Scholar]
- Gu C., Banasavadi-Siddegowda Y.K., Joshi K., Nakamura Y., Kurt H., Gupta S., Nakano I. Tumor-specific activation of the C-JUN/MELK pathway regulates glioma stem cell growth in a p53-dependent manner. Stem Cells. 2013;31:870–881. doi: 10.1002/stem.1322. [DOI] [PMC free article] [PubMed] [Google Scholar]
- Guvenc H., Pavlyukov M.S., Joshi K., Kurt H., Banasavadi-Siddegowda Y.K., Mao P., Hong C., Yamada R., Kwon C.H., Bhasin D. Impairment of glioma stem cell survival and growth by a novel inhibitor for Survivin-Ran protein complex. Clin. Cancer Res. 2013;19:631–642. doi: 10.1158/1078-0432.CCR-12-0647. [DOI] [PMC free article] [PubMed] [Google Scholar]
- Hemmati H.D., Nakano I., Lazareff J.A., Masterman-Smith M., Geschwind D.H., Bronner-Fraser M., Kornblum H.I. Cancerous stem cells can arise from pediatric brain tumors. Proc. Natl. Acad. Sci. USA. 2003;100:15178–15183. doi: 10.1073/pnas.2036535100. [DOI] [PMC free article] [PubMed] [Google Scholar]
- Holland S.J., Pan A., Franci C., Hu Y., Chang B., Li W., Duan M., Torneros A., Yu J., Heckrodt T.J. R428, a selective small molecule inhibitor of Axl kinase, blocks tumor spread and prolongs survival in models of metastatic breast cancer. Cancer Res. 2010;70:1544–1554. doi: 10.1158/0008-5472.CAN-09-2997. [DOI] [PubMed] [Google Scholar]
- Hummel M., Bentink S., Berger H., Klapper W., Wessendorf S., Barth T.F., Bernd H.W., Cogliatti S.B., Dierlamm J., Feller A.C., Molecular Mechanisms in Malignant Lymphomas Network Project of the Deutsche Krebshilfe A biologic definition of Burkitt’s lymphoma from transcriptional and genomic profiling. N. Engl. J. Med. 2006;354:2419–2430. doi: 10.1056/NEJMoa055351. [DOI] [PubMed] [Google Scholar]
- Janning M., Ben-Batalla I., Loges S. Axl inhibition: a potential road to a novel acute myeloid leukemia therapy? Expert Rev Hematol. 2015;8:135–138. doi: 10.1586/17474086.2015.997704. [DOI] [PubMed] [Google Scholar]
- Jijiwa M., Demir H., Gupta S., Leung C., Joshi K., Orozco N., Huang T., Yildiz V.O., Shibahara I., de Jesus J.A. CD44v6 regulates growth of brain tumor stem cells partially through the AKT-mediated pathway. PLoS ONE. 2011;6:e24217. doi: 10.1371/journal.pone.0024217. [DOI] [PMC free article] [PubMed] [Google Scholar]
- Keating A.K., Kim G.K., Jones A.E., Donson A.M., Ware K., Mulcahy J.M., Salzberg D.B., Foreman N.K., Liang X., Thorburn A., Graham D.K. Inhibition of Mer and Axl receptor tyrosine kinases in astrocytoma cells leads to increased apoptosis and improved chemosensitivity. Mol. Cancer Ther. 2010;9:1298–1307. doi: 10.1158/1535-7163.MCT-09-0707. [DOI] [PMC free article] [PubMed] [Google Scholar]
- Knubel K.H., Pernu B.M., Sufit A., Nelson S., Pierce A.M., Keating A.K. MerTK inhibition is a novel therapeutic approach for glioblastoma multiforme. Oncotarget. 2014;5:1338–1351. doi: 10.18632/oncotarget.1793. [DOI] [PMC free article] [PubMed] [Google Scholar]
- Lee J., Kotliarova S., Kotliarov Y., Li A., Su Q., Donin N.M., Pastorino S., Purow B.W., Christopher N., Zhang W. Tumor stem cells derived from glioblastomas cultured in bFGF and EGF more closely mirror the phenotype and genotype of primary tumors than do serum-cultured cell lines. Cancer Cell. 2006;9:391–403. doi: 10.1016/j.ccr.2006.03.030. [DOI] [PubMed] [Google Scholar]
- Linger R.M., Keating A.K., Earp H.S., Graham D.K. TAM receptor tyrosine kinases: biologic functions, signaling, and potential therapeutic targeting in human cancer. Adv. Cancer Res. 2008;100:35–83. doi: 10.1016/S0065-230X(08)00002-X. [DOI] [PMC free article] [PubMed] [Google Scholar]
- Liu L., Greger J., Shi H., Liu Y., Greshock J., Annan R., Halsey W., Sathe G.M., Martin A.M., Gilmer T.M. Novel mechanism of lapatinib resistance in HER2-positive breast tumor cells: activation of AXL. Cancer Res. 2009;69:6871–6878. doi: 10.1158/0008-5472.CAN-08-4490. [DOI] [PubMed] [Google Scholar]
- Mao P., Joshi K., Li J., Kim S.H., Li P., Santana-Santos L., Luthra S., Chandran U.R., Benos P.V., Smith L. Mesenchymal glioma stem cells are maintained by activated glycolytic metabolism involving aldehyde dehydrogenase 1A3. Proc. Natl. Acad. Sci. USA. 2013;110:8644–8649. doi: 10.1073/pnas.1221478110. [DOI] [PMC free article] [PubMed] [Google Scholar]
- Mellinghoff I.K., Schultz N., Mischel P.S., Cloughesy T.F. Will kinase inhibitors make it as glioblastoma drugs? Curr. Top. Microbiol. Immunol. 2012;355:135–169. doi: 10.1007/82_2011_178. [DOI] [PMC free article] [PubMed] [Google Scholar]
- Miyazaki T., Pan Y., Joshi K., Purohit D., Hu B., Demir H., Mazumder S., Okabe S., Yamori T., Viapiano M. Telomestatin impairs glioma stem cell survival and growth through the disruption of telomeric G-quadruplex and inhibition of the proto-oncogene, c-Myb. Clin. Cancer Res. 2012;18:1268–1280. doi: 10.1158/1078-0432.CCR-11-1795. [DOI] [PMC free article] [PubMed] [Google Scholar]
- Nakano I., Kornblum H.I. Methods for analysis of brain tumor stem cell and neural stem cell self-renewal. Methods Mol. Biol. 2009;568:37–56. doi: 10.1007/978-1-59745-280-9_4. [DOI] [PubMed] [Google Scholar]
- Nakano I., Joshi K., Visnyei K., Hu B., Watanabe M., Lam D., Wexler E., Saigusa K., Nakamura Y., Laks D.R. Siomycin A targets brain tumor stem cells partially through a MELK-mediated pathway. Neuro-oncol. 2011;13:622–634. doi: 10.1093/neuonc/nor023. [DOI] [PMC free article] [PubMed] [Google Scholar]
- O’Bryan J.P., Frye R.A., Cogswell P.C., Neubauer A., Kitch B., Prokop C., Espinosa R., 3rd, Le Beau M.M., Earp H.S., Liu E.T. axl, a transforming gene isolated from primary human myeloid leukemia cells, encodes a novel receptor tyrosine kinase. Mol. Cell. Biol. 1991;11:5016–5031. doi: 10.1128/mcb.11.10.5016. [DOI] [PMC free article] [PubMed] [Google Scholar]
- Patel A.P., Tirosh I., Trombetta J.J., Shalek A.K., Gillespie S.M., Wakimoto H., Cahill D.P., Nahed B.V., Curry W.T., Martuza R.L. Single-cell RNA-seq highlights intratumoral heterogeneity in primary glioblastoma. Science. 2014;344:1396–1401. doi: 10.1126/science.1254257. [DOI] [PMC free article] [PubMed] [Google Scholar]
- Phillips H.S., Kharbanda S., Chen R., Forrest W.F., Soriano R.H., Wu T.D., Misra A., Nigro J.M., Colman H., Soroceanu L. Molecular subclasses of high-grade glioma predict prognosis, delineate a pattern of disease progression, and resemble stages in neurogenesis. Cancer Cell. 2006;9:157–173. doi: 10.1016/j.ccr.2006.02.019. [DOI] [PubMed] [Google Scholar]
- Piao Y., Liang J., Holmes L., Henry V., Sulman E., de Groot J.F. Acquired resistance to anti-VEGF therapy in glioblastoma is associated with a mesenchymal transition. Clin. Cancer Res. 2013;19:4392–4403. doi: 10.1158/1078-0432.CCR-12-1557. [DOI] [PubMed] [Google Scholar]
- Qian F., Engst S., Yamaguchi K., Yu P., Won K.A., Mock L., Lou T., Tan J., Li C., Tam D. Inhibition of tumor cell growth, invasion, and metastasis by EXEL-2880 (XL880, GSK1363089), a novel inhibitor of HGF and VEGF receptor tyrosine kinases. Cancer Res. 2009;69:8009–8016. doi: 10.1158/0008-5472.CAN-08-4889. [DOI] [PubMed] [Google Scholar]
- RDC Team . R Foundation for Statistical Computing; Vienna: 2011. R: A Language and Environment for Statistical Computing. [Google Scholar]
- Shah M.A., Wainberg Z.A., Catenacci D.V., Hochster H.S., Ford J., Kunz P., Lee F.C., Kallender H., Cecchi F., Rabe D.C. Phase II study evaluating 2 dosing schedules of oral foretinib (GSK1363089), cMET/VEGFR2 inhibitor, in patients with metastatic gastric cancer. PLoS ONE. 2013;8:e54014. doi: 10.1371/journal.pone.0054014. [DOI] [PMC free article] [PubMed] [Google Scholar]
- Singh S.K., Hawkins C., Clarke I.D., Squire J.A., Bayani J., Hide T., Henkelman R.M., Cusimano M.D., Dirks P.B. Identification of human brain tumour initiating cells. Nature. 2004;432:396–401. doi: 10.1038/nature03128. [DOI] [PubMed] [Google Scholar]
- Smith J.J., Deane N.G., Wu F., Merchant N.B., Zhang B., Jiang A., Lu P., Johnson J.C., Schmidt C., Bailey C.E. Experimentally derived metastasis gene expression profile predicts recurrence and death in patients with colon cancer. Gastroenterology. 2010;138:958–968. doi: 10.1053/j.gastro.2009.11.005. [DOI] [PMC free article] [PubMed] [Google Scholar]
- Smyth G.K. Linear models and empirical bayes methods for assessing differential expression in microarray experiments. Stat. Appl. Genet. Mol. Biol. 2004;3:e3. doi: 10.2202/1544-6115.1027. [DOI] [PubMed] [Google Scholar]
- Smyth G.K. Springer; New York: 2005. Limma: Linear Models for Microarray Data. [Google Scholar]
- Stupp R., Hegi M.E., Mason W.P., van den Bent M.J., Taphoorn M.J., Janzer R.C., Ludwin S.K., Allgeier A., Fisher B., Belanger K., European Organisation for Research and Treatment of Cancer Brain Tumour and Radiation Oncology Groups. National Cancer Institute of Canada Clinical Trials Group Effects of radiotherapy with concomitant and adjuvant temozolomide versus radiotherapy alone on survival in glioblastoma in a randomised phase III study: 5-year analysis of the EORTC-NCIC trial. Lancet Oncol. 2009;10:459–466. doi: 10.1016/S1470-2045(09)70025-7. [DOI] [PubMed] [Google Scholar]
- Sturm D., Witt H., Hovestadt V., Khuong-Quang D.A., Jones D.T., Konermann C., Pfaff E., Tönjes M., Sill M., Bender S. Hotspot mutations in H3F3A and IDH1 define distinct epigenetic and biological subgroups of glioblastoma. Cancer Cell. 2012;22:425–437. doi: 10.1016/j.ccr.2012.08.024. [DOI] [PubMed] [Google Scholar]
- Sun L., Hui A.M., Su Q., Vortmeyer A., Kotliarov Y., Pastorino S., Passaniti A., Menon J., Walling J., Bailey R. Neuronal and glioma-derived stem cell factor induces angiogenesis within the brain. Cancer Cell. 2006;9:287–300. doi: 10.1016/j.ccr.2006.03.003. [DOI] [PubMed] [Google Scholar]
- Tothill R.W., Tinker A.V., George J., Brown R., Fox S.B., Lade S., Johnson D.S., Trivett M.K., Etemadmoghadam D., Locandro B., Australian Ovarian Cancer Study Group Novel molecular subtypes of serous and endometrioid ovarian cancer linked to clinical outcome. Clin. Cancer Res. 2008;14:5198–5208. doi: 10.1158/1078-0432.CCR-08-0196. [DOI] [PubMed] [Google Scholar]
- Vajkoczy P., Knyazev P., Kunkel A., Capelle H.H., Behrndt S., von Tengg-Kobligk H., Kiessling F., Eichelsbacher U., Essig M., Read T.A. Dominant-negative inhibition of the Axl receptor tyrosine kinase suppresses brain tumor cell growth and invasion and prolongs survival. Proc. Natl. Acad. Sci. USA. 2006;103:5799–5804. doi: 10.1073/pnas.0510923103. [DOI] [PMC free article] [PubMed] [Google Scholar]
- Verhaak R.G., Hoadley K.A., Purdom E., Wang V., Qi Y., Wilkerson M.D., Miller C.R., Ding L., Golub T., Mesirov J.P., Cancer Genome Atlas Research Network Integrated genomic analysis identifies clinically relevant subtypes of glioblastoma characterized by abnormalities in PDGFRA, IDH1, EGFR, and NF1. Cancer Cell. 2010;17:98–110. doi: 10.1016/j.ccr.2009.12.020. [DOI] [PMC free article] [PubMed] [Google Scholar]
- Vuoriluoto K., Haugen H., Kiviluoto S., Mpindi J.P., Nevo J., Gjerdrum C., Tiron C., Lorens J.B., Ivaska J. Vimentin regulates EMT induction by Slug and oncogenic H-Ras and migration by governing Axl expression in breast cancer. Oncogene. 2011;30:1436–1448. doi: 10.1038/onc.2010.509. [DOI] [PubMed] [Google Scholar]
- Zhang J., Yang P.L., Gray N.S. Targeting cancer with small molecule kinase inhibitors. Nat. Rev. Cancer. 2009;9:28–39. doi: 10.1038/nrc2559. [DOI] [PMC free article] [PubMed] [Google Scholar]
- Zhang Z., Lee J.C., Lin L., Olivas V., Au V., LaFramboise T., Abdel-Rahman M., Wang X., Levine A.D., Rho J.K. Activation of the AXL kinase causes resistance to EGFR-targeted therapy in lung cancer. Nat. Genet. 2012;44:852–860. doi: 10.1038/ng.2330. [DOI] [PMC free article] [PubMed] [Google Scholar]
Associated Data
This section collects any data citations, data availability statements, or supplementary materials included in this article.