

Abstract
Memory B cells play essential roles in the maintenance of long-term immunity and may be important in the pathogenesis of autoimmune disease, but how these cells are distinguished from their naive precursors is poorly understood. To address this, it would be important to understand how gene expression differs between memory and naive B cells to elucidate memory-specific functions. Using model systems that help overcome the lack of murine memory-specific markers and the low frequency of Agspecific memory and naive cells, we undertook a global comparison of gene expression between memory B cells and their naive precursors. We identified genes with differential expression and confirmed the differential expression of many of these by quantitative RT-PCR and of some of these at the protein level. Our initial analysis revealed differential expression patterns of genes that regulate signaling. Memory B cells have increased expression of genes important in regulating adenosine signaling and in modulating cAMP responses. Furthermore, memory B cells up-regulate receptors that are essential for embryonic stem cell self-renewal. We further demonstrate that one of these, leukemia inhibitory factor receptor, can initiate functional signaling in memory B cells whereas it does not in naive B cells. Thus, memory and naive B cells are intrinsically wired to signal differently from one another and express a functional signaling pathway that is known to maintain stem cells in other lineages.
Immunological memory, the ability to respond rapidly and effectively to Ag upon re-exposure long after initial encounter, is the hallmark of the adaptive immune system. Memory is an emergent property that stems from increased precursor frequencies of Ag-specific B and T cells, long-lived Ab-forming cells, pre-existing Ab, and memory lymphocytes with functional properties different from those of their naive precursors. The secondary response is faster, of greater magnitude and of higher affinity, but it is difficult to dissect out the contribution of memory B cells per se. To do so, it is important to understand the inherent differences between naive and memory cells themselves.
By definition, a memory B cell has responded to Ag and survived for a long time afterward. However, it is difficult to definitively identify such cells. As isotype class-switch and somatic mutation frequently accompany the Ag response, these features (1–4), or markers that are correlated with them, such as CD27 expression on human B cells (5–8), have been used as proxies. However, not all memory cells are switched or mutated (5, 9–11). Therefore, this approach does not address a proportion of memory cells. Furthermore, and most importantly, because not all switched and/or mutated B cells are true long-lived memory cells, recently activated B cells cannot be definitively distinguished from true resting memory cells with these methods. Nonetheless, with these limitations in mind, use of such proxies has facilitated considerable progress in understanding memory B cell properties (1, 2, 8, 12–18).
We and others (3, 19–21) have used a BrdU-labeling approach to identify memory cells solely based on their history of a proliferative response to Ag. In this strategy, B cells are labeled in vivo with BrdU during the proliferative phase of the response; a subset of these that had differentiated into memory cells after labeling will remain BrdU+ weeks to months later. Coupled with a method to identify Ag binding, this approach identifies B cells that meet the definition of memory without relying on a priori assumptions.
Using either surrogate markers or the BrdU-labeling strategy to identify memory cells, several groups have compared the expression of surface proteins that mediate immunological functions between naive and Ag-experienced B cells. CD80, and to a lesser extent CD86, are up-regulated on human IgG+ and CD27+ B cells (2, 22, 23). A parallel up-regulation has been observed among murine memory B cells (3, 24). Murine memory and naive B cells also differ in surface expression of CD73 (3), CD95 (3, 16), Ccr6 (24), and CD62L expression (3, 24, 25). Recently, using combinations of these markers, phenotypic subsets of murine memory B cells have been identified (3, 24), although their significance remains largely unexplored.
Various approaches have been used to define specific functional properties of memory B cells. Compared with naive cells, the lifespan of murine memory B cells is longer (19, 20, 26), suggesting that memory cells have different requirements for survival. Memory but not naive B cells undergo slow homeostatic proliferation (19, 27), and thus have acquired the ability to self-renew. Murine IgG+ memory but not naive B cells require intact Ras-MEK signaling for Ab production in response to T-independent Ag stimulation in vitro (1). Human CD27+ cells respond differently in vitro to a variety of stimuli (14, 15, 18, 28, 29). Although such observations point to profound distinctions between memory and naive B cells, the underlying molecular pathways responsible for these differences are mainly unknown.
While such phenotypic and functional studies have been informative, they have been limited in scope and mainly tested molecules well-known to be involved in the immune response. A genome-wide transcriptional profiling approach would provide an unbiased and complete assessment of inherent differences between naive and memory B cells, enabling predictions of specialized memory B cell functions. Because of the relative ease of isolation and purification of human CD27+ B cells, the first transcriptional profiling studies of memory B cells were done in humans. A pioneering study of B cell lymphomas and several normal human B cell populations demonstrated that gene expression among CD27+ peripheral blood cells was most similar to, yet distinct from, naive B cells (30). A subsequent study also found strikingly similar expression profiles between memory and naive B cells (8). Recently, another microarray study demonstrated that human CD27+ B cells down-regulate transcription factors that maintain quiescence (31). Despite the availability of human CD27+ cells, in the long-term, the murine system will best facilitate genetic approaches to evaluate the function of genes important in memory B cell development, survival, self-renewal, and response to Ag. Therefore, it is critical that intrinsic genetic differences between naive and memory B cells in the mouse be characterized and studied. One group recently reported an analysis of murine memory B cells, defined as rare IgG+ Ag-specific cells (500–8000/spleen), which were compared with total λ+ naive cells (4, 24). Overall, naive and memory B cells were found to be similar, as in the human. Additionally, as a cluster of ~31 genes was commonly expressed between memory B and T cells and hematopoietic stem cells, the investigators suggested that these cell types may share self-renewal mechanisms. This study has recently been expanded to better describe and further characterize several of the differentially expressed genes (24).
We have been developing and characterizing systems that generate Ag-specific memory cells and have validated them using BrdU labeling, somatic hypermutation analysis, as well as surface marker expression characteristic of memory cells. These systems (19, 25), and variants we describe here, generate large numbers of such cells (~13 million and ~3 million nitrophenyl (NP)5-specific splenic memory B cells per mouse, respectively). The availability of large numbers of memory cells has enabled us to conduct a microarray-based comparison of gene expression differences between naive and memory B cells that has several key advantages over the wild-type system. In addition to large numbers of highly purified memory cells, our systems provide large numbers of the direct naive precursors to memory B cells, so expression differences between the populations are primarily due to memory-intrinsic changes, and not due, for example, to different isotype usage or different specificity. They also enabled the purification of sufficient quantities of RNA to conduct microarray analysis without additional rounds of amplification, which can introduce artifactual heterogeneity; to perform multiple replicates of each condition, considerably strengthening statistical reliability; and to allow extensive validation using quantitative RT-PCR (qPCR) and at the protein level.
In this study, we report the identification of many genes that are differentially expressed by naive and memory B cells, including a large number that were not previously identified with other approaches. Given the wide variety of differentially expressed genes, we have chosen to focus here on the altered regulation of several genes encoding proteins that interact in specific signaling pathways. The differential expression of these genes suggests that memory B cells are programmed to respond to environmental cues differently than naive B cells. In addition to reporting the comprehensive results of our survey and its qPCR validation, we demonstrate differential protein expression of a number of key molecules involved in signaling particularly, as well as the differential function of a receptor that was previously known for its role in the maintenance of the stem cell state. Together, these results substantially enhance our insight into the nature of murine memory B cells globally and with regard to key specific signaling pathways.
Materials and Methods
Mice, transfers, and immunizations
The mVH186.2-transgenic (Tg) and AM14 Vκ8R CB.17 mouse strains have been previously described (32–36). mVH186.2 Tg mice were maintained on the JH knockout (KO) strain (37) to ensure all B cells expressed the IgH Tg, and for specified experiments—additionally on the Jκ KO strain (38)—to enrich the frequency of λ+ NP-specific B cells. They were given water with sulfatrim biweekly. C57BL/6 mice were purchased from The Jackson Laboratory. All animal immunizations and experiments were approved by the Yale Institutional Animal Care and Use Committee.
Generation of murine memory and naive B cells
For the first microarray screen, qPCR validation, Western blot analysis, and in vitro experiments, NP-binding memory B cells were generated in mVH186.2 Tg JH KO mice immunized i.p. twice with 50 μg of NP25-chicken gammaglobulin (NP-CGG) precipitated in alum. Mice were rested a minimum of 12-wk postsecondary immunization to ensure the exclusion of recently activated B cells and ongoing germinal centers (GCs) (3, 16). Memory B cells were identified as B220+ (4-hydroxy-5-iodo-3-nitropheny-l)acetyl (NIP)-binding κlow live lymphocytes. This method yields ~13 million NP-binding B cells per spleen, most of which were memory cells, as naive mice had only ~2 million NP-binding B cells per spleen. Naive B cells were identified as B220+ NIP-binding κlow live lymphocytes from unimmunized mice. For all experiments except the first microarray screen, mVH186.2 mice crossed onto the Jκ KO strain were used to increase the frequency of naive NP-binding cells from 1 to 3% to ~51% of splenic B cells. In these mice and in subsequent screens, AA4.1+ transitional B cells (39) were excluded from mature naive cells by FACS sorting (see Fig. 2). Thus, naive B cells were identified as B220+ NIP-binding AA4.1− live lymphocytes.
FIGURE 2.

Isolation of memory and naive B cells for the second-generation Affymetrix screen. A, Schematic of use of cell transfer to generate Ag-specific memory B cells in the absence of newly generated naive precursors. B, Sorting strategy. Splenocytes were stained and single, live B lymphocytes were gated by FSC and SSC profiles and PI exclusion (data not shown). B220+ NIP-binding B cells lacking IgMb (the recipient allotype) were gated as shown. Percentages of the parental population are indicated. Presort, live B cells are shown; postsort, all live cells are shown. For comparison, plots are shown from a control animal given donor mVH186.2 splenocytes and immunized with alum alone and in a nontransferred recipient immunized with NP25-CGG. NP-binding B cells were negligible in control mice. C, Naive B cells were purified from spleens of unimmunized 8-wk-old female mVH186.2 Tg JH KO Jκ KO mice. Single, live B lymphocytes were gated by FSC and SSC profiles, PI exclusion, and anti-B220-binding on a FACSAria. AA4.1− NIP-binding cells were sorted. D, Overview of the microarray approach. Differences between this and the first Affymetrix screens (Fig. 1) are shown in bold.
To generate memory B cells for the second microarray screen, splenocytes from mVH186.2 Tg JH KO mice containing 1 × 10⁶ NP-specific B cells were transferred i.v. into AM14 Vκ8R double Tg CB.17 mice. Recipient mice were immunized 6 h later, as described above. In this system, the vast majority of recipient B cells did not respond to the immunizing Ag due to their usage of the IgH and Igκ Tg. The rare population of responding recipient cells uses the endogenous Igb H chain and was readily distinguished from donor cells by allotype. Twelve weeks posttransfer and immunization, NP-specific donor-derived cells B cells averaged ~3.9 million per spleen in comparison to ~44,000 per spleen in adjuvant-only treated animals. Thus, in immunized animals, ~1% of NP-specific B cells were naive while ~99% were memory. Memory B cells were purified by flow cytometry as B220+ NIP-binding IgMb− live lymphocytes.
Purification and analysis of cells by flow cytometry
Single-cell suspensions of RBC-depleted splenocytes were stained for flow cytometric analysis as described (33) and analyzed on a FACSCalibur or an LSRII (BD Immunocytometry Systems). For sorting, a FACSVantage DIVA or FACSAria (BD Immunocytometry Systems) was used. Live/dead discrimination was accomplished based on forward/side scatter (FSC/SSC) and ethidium monoazide or propidium iodide (PI) exclusion. For sorting, cells were kept at 4°C in buffers containing 0.05% sodium azide to minimize alterations in gene expression. Data were analyzed with FlowJo (Tree Star). Phospho-flow staining was performed as described (40). A total of 100,000–250,000 events per replicate were collected.
Magnetic-activated cell sorting
For the first Affymetrix screen, B cells were purified by negative selection by MACS using anti-Thy1.2/CD90.2 and anti-CD43 biotinylated Abs coupled with streptavidin (SA)-coated beads and an AutoMACS (Miltenyi Biotec) before staining for flow cytometric analysis and sorting. For culture experiments, RBC-depleted splenic B cells were purified by negative selection using the EasySep Mouse B Cell Enrichment magnetic system (StemCell Technologies) according to the manufacturer's instructions.
FACS Abs and reagents
The following reagents were produced in our laboratory: anti-Thy1.2/CD90.2 (30H12)-biot, anti-CD43 (S7)-biot, anti-B220/CD45 (RA3-6B2)-Alexa 488, anti-IgMb-biot, anti-κ (187.1)-biot- or Pacific Blue, NIP-allophycocyanin, anti-λ-Alexa 647, and anti-FcγR (24G2). Alexa 488, Pacific Blue, and biotin were obtained from Invitrogen and allophycocyanin was obtained from ProZyme. The following Abs were purchased: anti-AA4.1-PE, anti-B220/CD45 (RA3-6B2)-allophycocyanin/Cy7, and mouse IgG2a (eBioscience), anti-Adora2a (7F6-G5-A2; Upstate Biotechnology), anti-phospho-Stat3 (Y705)-PE (BD Biosciences), and anti-mouse IgG2a-PE (Southern Biotechnology Associates). Additional purchased reagents were SA-PE (eBioscience), SA microbeads (Miltenyi Biotec), ethidium monoazide (Molecular Probes) and PI (Invitrogen).
Microarray analysis of gene expression
Total RNA was extracted from FACS-sorted B cells using the RNeasy Mini kit with on-column DNase digestion (Qiagen) and 1–4 μg were used to prepare biotinylated cRNA. For the first screen, cRNA was synthesized according to the Affymetrix protocol (41), as previously described (42). For the second screen, biotinylated cRNA was synthesized similarly, but with the Message-Amp aRNA kit (Ambion), according to the manufacturer's instructions.
A total of 15 μg of labeled cRNA was chemically fragmented at 94°C for 35 min in a 40 mM Tris-acetate (pH 8.1), 100 mM potassium acetate, 30 mM magnesium acetate buffer, and then hybridized to Affymetrix Mouse 430 2.0 oligonucleotide chips and scanned according to the manufacturer's protocol (41). The first and second screens were conducted at the Yale University Keck Facility and the University of Minnesota Biomedical Genomics Center Facility, respectively.
For the first screen, Affymetrix Microarray Suite (MAS) 4.0 software with default settings was used to generate relative expression values for each gene. A scaling factor of 1500 was set to control for minor differences in hybridization intensities. For the second screen, Affymetrix image files (.cel) were collectively analyzed and background-corrected, and probe level was normalized and summarized using the GeneChip Robust Multi-Array algorithm (43, 44). Statistical analysis was performed using Gene-Spring GX software (Agilent Technologies). Expression flags (first screen) and raw expression value cutoffs (both screens) were used to identify genes with expression reliably above background; t tests and fold difference cutoffs were used to identify differentially expressed genes. All normalized gene expression values and raw .cel data set files are available at www.ncbi.nlm.nih.gov/geo (accession number GSE11386).
Quantitative PCR
Total RNA was isolated from FACS-sorted naive and twice-immunized VH186.2 NP-binding B cells using the Qiagen RNeasy system with on-column DNase treatment. First-strand cDNA was synthesized using random hexamers and mutant Moloney murine leukemia virus reverse transcriptase (SuperScript II; Invitrogen), in accordance with the manufacturer's protocol. Primers were designed according to the Primer-Bank algorithm (45) when possible and with the Primer3 algorithm (46) otherwise. Primers spanned introns whenever possible. Each primer pair was validated using melting curve analysis and detection on an agarose gel. Relative quantification qPCR on replicate samples was performed with SYBR Green normalized to β-actin. Hot-start amplification was performed on a Stratagene Mx3000 system with SureStart TaqDNA polymerase (Stratagene) using a passive reference dye and analyzed with MxPro software. Primer sequences, product sizes, and melting temperatures are detailed in supplemental table Ia.6 qPCR experiments were conducted with replicate cDNAs and SEM values were calculated.
Western blot
Cells were lysed in radioimmunoprecipitation buffer with 50 mM sodium fluoride and 50 μM sodium orthovanadate. A modified SDS-PAGE method was used (47). Samples were boiled, separated in a (5–10%) acrylamide gel and blotted with a semidry apparatus onto polyvinylidene difluoride in 24 mM Tris, 192 mM glycine, 20% methanol. Membranes were probed with primary Ab in Superblock (Pierce) with 0.1% Tween 20, washed, and incubated with HRP-conjugated secondary Ab. The presence of Ab was detected using ECL (Western Lightning Reagent Plus; PerkinElmer). The density of specific bands was quantified and normalized to actin using ImageJ software (http://rsb. info.nih.gov/ij; Ref. 48). Primary Abs used were mouse-anti-protein kinase A regulatory subunit 2β (Prkar2b) (BD Pharmingen), mouse-anti-leukemia inhibitory factor receptor (Lifr; C-19), rabbit-anti-protein kinase C (PKC) ζ (C-20; Santa Cruz Biotechnology) and anti-actin-HRP (Santa Cruz Biotechnology). Secondary Abs were goat anti-mouse IgG1-HRP (Santa Cruz Biotechnology), goat anti-rabbit HRP (Southern Biotechnology Associates).
Splenocyte culture
RBC-depleted splenic B cells were purified by negative selection using the EasySep Mouse B Cell Enrichment magnetic system (see above). B cells were then rested for 2 h at 37°C with 5% CO2 in standard culture medium of complete RPMI 1640 (10 mM HEPES, 50 μM 2-ME, 2 mM l-glutamine) with 10% FetalPlex before stimulation with recombinant mouse Lif (Chemicon International).
Results
Gene expression in murine naive vs memory B cells
We conducted a microarray-based comparison of gene expression between memory B cells and their naive precursors. For the first screen, NP-binding memory B cells were generated as described in Fig. 1 and Materials and Methods. The mVH186.2 Tg restricts H chain usage to IgM and limits affinity maturation. Thus, gene expression differences between memory and naive populations are not a result of different isotype usage, different BCR specificities, or widely differing BCR affinities and are more likely to represent intrinsic differences. Another important advantage of the mVH186.2 system is that there is no cytophilic Ab to confound the identification of rare memory cell populations (49).
FIGURE 1.

Isolation of memory and naive B cells for the first-generation Affymetrix screen. A, A schematic depicting the strain of mice and immunization strategy used to generate naive and memory B cells. Naive B cells were purified from spleens of unimmunized 6- to 8-wk-old mVH186.2 Tg JH KO mice. Memory B cells were isolated from spleens of mice 12–28 wk postsecondary immunization with 50 μg of NP25-CGG in alum i.p. B, Representative plots, gating strategies, and population frequencies for memory (top) and naive (bottom) FACS sorts. Splenic B cells were first purified by negative selection using anti-Thy1.2 and -CD43 by AutoMACS (Miltenyi Biotec) and subsequently stained and sorted with a FACSVantage (BD Biosciences). Live lymphocytes were gated by FSC and SSC profiles and by PI exclusion (data not shown) then B220+ (left) and subsequently NIP-binding κlow/neg (right) B cells were sorted. C, Postsort purities of memory (top) and naive (bottom) cells among all live cells are shown. D, An overview of the microarray approach. Differences between the first and second Affymetrix screens are highlighted in bold.
For the second screen, memory B cells were generated from NP-specific mVH186.2 B cells immunized after adoptive transfer into AM14 Vκ8R double Tg CB.17 recipients (34–36), as described in Fig. 2 and Materials and Methods. Donor B cells mount a rigorous primary response and form a stable memory population (Fig. 2). By comparing frequencies of NP-specific B cells in immunized and alum-treated animals, we estimate the ratio of memory to naive cells to be 99:1 in this second system, compared with 9:1 in the first system. Naive NP-binding splenocytes were isolated from unimmunized mVH186.2 Tg Jκ KO mice (Fig. 2). AA4.1 expression was used to exclude transitional B cells (39). Thus, the purity of isolated memory and naive B cells in the second screen was superior to the first.
To analyze normalized microarray data, we considered genes that met conservative guidelines for being expressed. In the first screen, these were genes flagged “present” by Affymetrix software and that had raw expression values of ≥200 in two of three naive or three of four memory samples. In the second screen, these were genes with raw expression values of ≥125 in three of four naive or memory samples. These cutoffs were chosen to minimize false identification of expression differences, though this approach potentially excludes some truly expressed genes with smaller numbers of transcripts. Because the second screen used a more sensitive method to amplify cRNA, lower raw value cutoffs were used. In the first and second screen, respectively, 35% and 33% of total probe sets met expression criteria and 2.5 and 12.4% were differentially expressed according to the criterion of the Welch t test, p < 0.05, between the two populations (Table I), though it should be noted that these p values are not corrected for multiple comparisons. Of these, 268 and 783 demonstrated ≥2-fold expression differences between memory and naive B cells in the first and second screen, respectively. Thus, the second screen was potentially more sensitive than the first at detecting expression differences.
Table I.
Memory and naive B cell gene expression differences detected by Affymetrix-based profiling
| 1st Screen |
2nd Screen |
|||||
|---|---|---|---|---|---|---|
| Probes or Genes |
Probes or Genes |
|||||
| Statistical Filtering | Probes | M > N | N>M | Probes | M> N | N>M |
| Total | 45,101 | 45,101 | ||||
| Expression above backgrounda | 15,677 | 15,036 | ||||
| t test p < 0.05 | 1,144 | 5,586 | ||||
| ≥1.5-fold probes | 652 | 203 | 449 | 1682 | 731 | 951 |
| ≥2-fold probes | 268 | 119 | 149 | 783 | 358 | 425 |
| ≥3-fold probes | 90 | 55 | 35 | 313 | 167 | 146 |
| ≥3-fold genes | 36 | 29 | ||||
| qPCR confirmed genes (of 3-fold list) | 31/34 | 17/29 | ||||
| ≥4-fold probes | 54 | 39 | 15 | 180 | 108 | 72 |
First screen: flagged present and raw signal intensity ≥ 200 in at least two of three naive or three of four memory samples. Second screen: raw signal intensity ≥ 125 in at least three of four naive or three of four memory samples.
Of the 90 probe sets with ≥3-fold differences in expression between naive and memory cells in the first screen, 83 (92%) also showed significant ( p < 0.05) and parallel expression differences in the second screen. Of the seven probes sets that were not differently expressed in the second screen, only two were confirmed by qPCR (data not shown). Thus, the second-generation screen confirmed the findings of the first.
qPCR validation of predicted mRNA expression differences
To validate the microarray findings, we systematically evaluated the relative expression by qPCR of genes identified in the first screen as being ≥3-fold differently expressed between naive and memory cells. After excluding redundant genes, Ig sequences, most expressed sequence tags and integrated viral sequences, 63 genes remained for validation by qPCR. qPCR confirmed 31 of 34 genes (91%) that were up-regulated and 17 of 29 genes (59%) that were down-regulated among memory B cells (Table I). Expression differences were often larger by qPCR than Affymetrix. The expression differences found by Affymetrix and qPCR analysis, plotted as log2 values, correlated well with one another (Pearson correlation r = 0.819, Fig. 3). Thus, the microarray analysis generated a reliable data set reflecting differences between naive and memory cells, particularly for those genes that are up-regulated among memory cells. Given the increased sensitivity and comparable expression patterns with the first screen, quoted Affymetrix expression differences hereafter will be derived from the second screen.
FIGURE 3.

Correlation between Affymetrix and qPCR determinations of differential gene expression. Log2 values of fold differences in mRNA levels (memory/naive) determined by the first Affymetrix screen and by qPCR are compared. Each point represents an individual gene that was identified in the first Affymetrix screen as differentially expressed between memory and naive B cells with a Welch t test p ≤ 0.05 and a fold difference ≥3. The Pearson's correlation coefficient was 0.835.
Signal transduction gene expression differences between naive and memory B cells
Of the many gene expression differences between memory B cells and their naive precursors, there was a striking pattern of differential expression of genes encoding proteins important in modulating signal transduction. We confirmed the expression of these genes at the mRNA level by qPCR, and at the protein level by FACS or Western blot when feasible. mRNA expression differences estimated by microarray and qPCR are summarized in Table II and detailed microarray data are in supplemental Table Ib.
Table II.
Summary of mRNA expression of key genes
| qPCR |
Microarray |
|||
|---|---|---|---|---|
| Gene | Average Fold (M/N) | SEM | Average Fold (M/N)a | p Valueb |
| Adora2a | 18.15 | 0.90 | 4.83 | <0.001 |
| 5.71 | <0.001 | |||
| Bmpr1a | 14.96 | 1.43 | 2.12 | 0.018 |
| 2.56 | 0.006 | |||
| 2.63 | 0.013 | |||
| Bmpr1b | No product | 1.01 | 0.800 | |
| 1.13 | 0.124 | |||
| 1.01 | 0.960 | |||
| Bmpr2 | 1/1.27 | 0.21 | 1/1.30 | 0.560 |
| Lifr | 81.08 | 2.11 | 25.40 | 0.001 |
| Prkar2a | ND | 1.82 | <0.001 | |
| 1.69 | <0.001 | |||
| Prkar2b | 20.65 | 0.70 | 21.83 | <0.001 |
| 39.86 | <0.001 | |||
| 34.83 | <0.001 | |||
| Prkcc | 5.37 | 0.80 | 14.28 | <0.001 |
| 30.84 | <0.001 | |||
| Prkcz | 3.14 | 0.18 | 3.62 | 0.001 |
| 6.38 | <0.001 | |||
| Rgs1 | 1/5.17 | 0.07 | 1/1.55 | 0.082 |
| Rgs10 | 1/3.57 | 0.90 | 1/7.28 | <0.001 |
| Rgs12 | 1/3.65 | 1.14 | 1/1.96 | 0.001 |
| Rgs13 | 1/1.64 | 0.29 | 1/2.29 | <0.001 |
| Rgs18 | 1/2.22 | 0.10 | 1/1.62 | 0.001 |
| 1/1.69 | 0.001 | |||
| Rgs2 | 1/1.74 | 0.19 | 1/3.63 | <0.001 |
| 1/3.30 | <0.001 | |||
| Smad1 | 1.40 | 0.15 | 1/1.99 | 0.002 |
| 1.02 | 0.204 | |||
| 1/1.28 | 0.057 | |||
| Smad4 | 1.54 | 0.16 | 1.07 | 0.150 |
| 1/1.15 | 0.066 | |||
| 1/1.05 | 0.276 | |||
| Smad5 | ND | 1/1.09 | 0.091 | |
| Smad6 | No product | 1.01 | 0.656 | |
| Smad7 | 1.08 | 0.14 | 1/1.69 | <0.001 |
| 1/1.65 | 0.001 | |||
| Smad9 (8) | ND | 1.02 | 0.090 | |
Multiple microarray values represent different Affymetrix probe sets for the same gene.
Student's t test.
Memory B cells up-regulate proteins that initiate adenosine signaling
Signaling through the G-protein coupled receptor (GPCR) adeno-sine receptor A2A (encoded by the Adora2a gene) plays an important role modulating inflammation (50–52). We previously demonstrated that CD73, an enzyme that catalyzes the conversion of AMP to adenosine at the plasma membrane, thus providing ligand for this adenosine receptor (53, 54), was up-regulated among a subset of memory B cells (3). Microarray data indicated that Adora2a transcript was also up-regulated in memory cells (Table II). qPCR confirmed that Adora2a mRNA was increased 18.2-fold (SEM = 0.895) in memory cells (Table II). Evaluation of Adora2a protein expression by FACS demonstrated a small but consistent increase in expression among memory B cells (Fig. 4). Thus, the cellular apparatus for initiating adenosine signaling via Adora2a is up-regulated by memory B cells.
FIGURE 4.

Expression of the adenosine receptor A2A protein is elevated among memory B cells. Surface expression of the adenosine receptor A2A was compared by flow cytometry in memory and naive B cells. Naive splenic B cells were from unimmunized mVH186.2 Tg JH KO Jκ KO mice. In the top histogram, memory cells were from mVH186.2 Tg JH KO mice ≥12-wk postsecondary immunization with NP25-CGG (system 1). In the bottom histogram, memory B cells were derived from NP-specific B cells from mVH186.2 JH KO Jκ KO donors after transfer into AM14 Tg Vκ8R Tg CB.17 recipients and subsequent immunization (system 2). Shown are live lymphocyte-gated B220+ NP-binding κlow/neg B lymphocytes. Expression among memory B cells is shown in dark black and naive in gray. Isotype control stain is shaded. Shown are representative plots from four (system 1) and two (system 2) mice.
Memory B cells down-regulate regulator of G-protein signaling (Rgs) protein-encoding genes
Signaling through the A2a receptor and other GPCRs is down-modulated by Rgs proteins (55, 56). Our microarray data indicated that the mRNAs encoding several Rgs molecules were decreased among memory B cells and we confirmed the differential expression of several of these by qPCR. Rgs1, Rgs2, Rgs10, Rgs12, Rgs13, and Rgs 18 were down-regulated an average of 5.2-, 1.7-, 3.6-, 3.7-, 1.6-, and 2.2-fold (SEMs 0.068, 0.188, 0.902, 1.14, 0.285, 0.097, respectively) among memory B cells compared with their naive precursors (Table II).
Protein kinase A (PKA) regulatory subunit 2β (Prkar2b) is markedly up-regulated among memory B cells
GPCR activation classically results in cAMP production and PKA activation (57). PKA has two functionally nonredundant isozymes, PKA-I and PKA-II, defined by the use of specific regulatory (R) subunits (58, 59). Microarray analysis indicated that the mRNA encoding Prkar2b was low to absent among naive B cells and markedly up-regulated among memory B cells (Table II). qPCR analysis confirmed this finding, demonstrating that Prkar2b mRNA was 20.6-fold (SEM 0.703) more abundant among memory cells (Table II). There was a parallel increase in Prkar2b protein expression, as Western blot analysis demonstrated a 64-kDa band corresponding to Prkar2b protein in memory B cells, while the protein was barely detectable among naive precursors (Fig. 5). Quantitation of band intensity, after normalizing for actin expression, indicated that Prkar2b protein was expressed at least 31.4-fold higher ( p = 0.008) among memory B cells.
FIGURE 5.
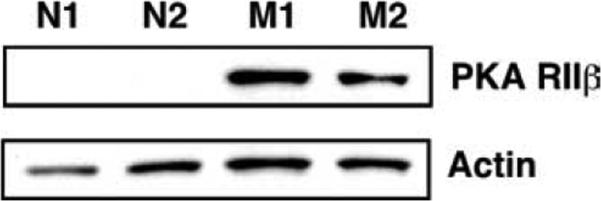
Expression of the protein kinase A regulatory subunit IIβ (PKA RIIβ) is up-regulated in memory B cells. Protein expression of PKA RIIβ and actin were compared in memory and naive B cells by Western blot analysis. Naive B cells were generated and FACS purified as described in Fig. 2. Memory B cells were generated and purified as in Fig. 1, omitting the MACS presorting step. Shown is a representative blot of two mice, from a total of five each of naive (N) and memory (M) mice.
Functional PKA-II protein requires regulatory subunits encoded by both Prkar2a and Prkar2b (59). By microarray, Prkar2a mRNA was expressed in both naive and memory B cells and modestly up-regulated in memory cells (Table II). Thus, both RII regulatory subunits are up-regulated in memory cells. Because RII levels influence PKA-I expression and activity and because the outcome of PKA-I and PKA-II signaling oppose one another (60), we examined expression of mRNAs encoding RI subunits by microarray (supplemental Table Ib). Prkar1a mRNA was readily detected at equal levels in both naive and memory B cells. Prkar1b mRNA was low but equal on both B cell populations. Thus, the required components for cAMP-mediated PKA-II but not PKA-I signaling are elevated among memory B cells.
PKA target specificity is regulated in part by A-kinase anchoring proteins (AKAPs), which constrain PKA subcellular localization (61, 62). Microarray data indicated that memory B cells expressed several PKA-II-interacting AKAPs, particularly Akap 2, 8, 9, 10, 11, 13, and 8L (supplemental Table Ib). Other than Akap13, which was 2-fold more abundant in memory cells ( p = 0.001), differences in expression between memory and naive B cells were at best modest.
Memory B cells up-regulate specific PKC isoforms
B cells express several PKC family isoforms that play important and distinct roles in B cell activation (63). Microarray analysis indicated that the genes encoding two PKC isoforms, PKCζ (Prkcz) and PKCγ (Prkcc), were up-regulated in memory B cells (Table II). These findings were confirmed by qPCR, demonstrating a 3.1-fold (SEM 0.18) and 5.4 (SEM 0.80) elevation in Prkcz and Prkcc mRNA, respectively (Table II). Western blot analysis demonstrated that PKCζ was up-regulated an average of 2.9-fold ( p = 0.006) in memory B cells (Fig. 6).
FIGURE 6.
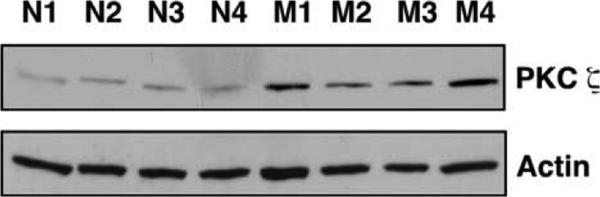
Expression of the protein kinase C ζ (PKC ζ) is up-regulated in memory B cells. Protein expression of PKC ζ and actin were compared in memory (M) and naive (N) B cells by Western blot analysis. Naive B cells were purified from spleens of unimmunized mVH186.2 Tg JH KO Jκ KO mice. To analyze memory B cells, total B cells, of which ~15% are NP-binding memory B cells, were purified from spleens of mVH186.2 Tg JH KO mice >12-wk postsecondary immunization with NP25-CGG in alum i.p. B cells were isolated by negative selection using the EasySep magnetic separation system. Thus, this level of expression underrepresents by as much as a factor of 6 the expression that would be seen in 100% pure memory cells. Each lane represents cells purified from an individual mouse.
Memory B cells up-regulate Bmpr1a mRNA expression
Signaling through bone morphogenic protein receptor 1a (Bmpr1a) is essential for embryonic stem cell self-renewal (64) and plays important roles regulating the differentiation of somatic stem cell populations in tissues such as the hair follicle (65) and intestine (66). Affymetrix expression analysis indicated that Bmpr1a mRNA was up-regulated on memory B cells (Table II). qPCR comparison demonstrated that memory B cells expressed 15.0-fold (SEM 1.4) more Bmpr1a mRNA (Table II). Bmpr1a is one of the most up-regulated mRNAs that we have identified in memory B cells. Due to technical issues with multiple reagents, we were unable to evaluate Bmpr1a protein expression by Western blot.
We determined whether memory B cells expressed the mRNAs encoding required Bmpr1a signaling components (67, 68). The mRNA encoding the classic Bmpr1a coreceptor, Bmpr2, was amplified by qPCR from mRNA of both naive and memory B cells, despite its low signal intensity by microarray (Table II). The Bmpr1a/Bmpr2 complex signals via receptor Smads 1/5/8 and subsequent activation of co-Smad4. Smad1 transcript was detectable by qPCR, despite its relatively low signal intensity by Affymetrix, while Smad5 mRNA displayed a strong signal intensity by microarray (Table II). Smad8 (gene name Smad9) showed low to absent signal intensity by Affymetrix (Table II). Finally, the expression of co-Smad4 was readily detectable by qPCR at approximately equal levels in memory and naive B cells (Table II).
As Bmpr1a signaling is down-modulated by several signaling components, we determined whether the transcripts encoding these were differentially expressed by memory cells and their naive precursors. Bmpr1b, which competes with Bmpr1a for interaction with Bmpr2, does not appear to be expressed by memory B cells, as all three Affymetrix probe sets demonstrated very low average signal intensities (supplemental Table Ib) and qPCR failed to amplify product using three separate primer sets. Bmp-induced Smad signaling can be dampened by inhibitory Smads 6 and 7 (68). Memory cells seemed not to express Smad 6, as the signal intensity by microarray was quite low (supplemental Table Ib) and we were unable to amplify a product by qPCR. Smad7 transcript was detectable at equal levels among memory and naive B cells by qPCR (Table II). We conclude that the signaling apparatus for Bmpr1a is robustly expressed in memory B cells with the key receptor Bmpr1a itself being highly overexpressed at the mRNA level; whereas, there is some but limited evidence that regulatory elements are also expressed.
Memory B cells up-regulate Lifr expression and are more sensitive to Lifr-induced signaling than naive B cells
In murine embryonic stem cell populations, signaling through Bmpr1a and Lifr together regulates self-renewal and lineage differentiation (64) and Lif signaling appears to be required for the survival of murine hematopoietic stem cells (69). Microarray data indicated that the mRNA encoding Lifr was low to absent among naive precursors and dramatically increased in memory cells (Table II). qPCR analysis demonstrated an 81.1-fold (SEM 2.1) elevation in Lifr expression among memory B cells, the largest mRNA expression difference between memory and naive cells we have identified (Table II).
To determine whether this increase in mRNA expression was accompanied by an increase in protein expression, lysates from sorted naive and memory B cells were analyzed by Western blot. Naive B cells demonstrated little expression of the 190-kDa Lifr protein, whereas it was readily apparent in memory B cell lysates (Fig. 7A). Normalizing to actin, Lifr expression averaged 41.7-fold more ( p = 0.0018) in memory cells compared with naive.
FIGURE 7.

Memory B cells up-regulate Lifr and phosphorylate Stat3 in response to Lif stimulation more robustly than do naive B cells. A, Protein expression of Lifr and actin were compared in memory and naive B cells by Western blot analysis, as described in Fig. 5. Each lane represents cells from an individual mouse. Data are representative of findings in five mice of each type. B–D, Splenocytes from 6- to 10-wk-old naive mVH186.2 JHD KO Jκ KO mice or mVH186.2 Tg JHD KO mice 15–20 wk postsecondary immunization with NP-CGG in alum i.p. were rested in culture for 2 h at 37°C in standard medium of RPMI 1640 with 10% FetalPlex and then stimulated with 1 ng/ml (B), 0.1, 1, or 10 ng/ml (C) or 10 ng/ml (D) mouse Lif for 0, 15, or 30 min. Cells were then fixed with 1.6% PFA, methanol permeabilized, and stained with PE-anti-phospho-Stat3 or PE-mouse IgG2a isotype control. Shown are data from live-gated (by FSC and SSC) B220+ λ+ B cells. B, Representative FACS plots of changing P-Stat3 levels. C, Lif-induced P-Stat3 dose-response curves of memory and naive B cells. P-Stat3 levels are plotted as isotype control-corrected median fluorescent intensities (MFIs). D, For memory (Mem) and naive (Nve) B cells, change in phosphorylated Stat3 or isotype control (IC) staining intensity between 0 and 15 min is shown.
To test whether elevated Lifr expression renders memory B cells more sensitive to Lifr activation, primary naive and memory splenic B cells were cultured with Lifr agonists. Canonical Lifr signaling is through the Jak/Stat3 pathway (70, 71). Therefore, at intervals following stimulation, cells were fixed, permeabilized, and stained to detect phosphorylation of Stat3 via flow cytometry.
At baseline, unstimulated naive and memory B cells demonstrated approximately equal levels of phosphorylated Stat3 (Fig. 7). Memory B cells, but not their naive precursors, showed a definite increase in Stat3 phosphorylation following Lifr stimulation. This phosphorylation was apparent following stimulation with either Lif (1 or 10 ng/ml, Fig. 7) or the related Lifr agonist cytokine, cardiotrophin-like cytokine factor 1 (Clcf1, also known as Nnt-1/ Bsf-3, 50 ng/ml; data not shown). The increase in Stat3 phosphor-ylation was dose-dependent, as the response to 10 ng/ml Lif was more robust than 0.1 or 1 ng/ml Lif (Fig. 7) and was most pronounced 15 min poststimulation (Fig. 7). Overall, the mean fold increase in phosphorylated Stat3 among memory cells was 1.8-fold ± 0.49 ( p < 0.001) when stimulated with 10 ng/ml Lif for 15 min (Fig. 7). In contrast to memory B cells, naive B cells showed low to absent Lif-induced Stat3 phosphorylation. Therefore, the increased expression of Lifr expression among memory B cells is accompanied by an increased sensitivity to Lifr-induced signal transduction.
Comparison with previously published microarray data
There is one previously published global gene expression comparison of B cells from naive and immunized mice (24). This study isolated IgG+ NP-reactive splenic B cells from immune wild-type C57BL/6 mice. A major distinction between this approach and ours was that the number of cells isolated was very low (500–2000 per spleen), necessitating two rounds of RNA amplification. Furthermore, the Statistical Analysis of Microarray algorithm (72) was used to compare expression of genes with raw expression values >20. We directly compared the list of genes differentially expressed ≥2-fold between memory and naive B cells in this study with ours and found definite similarities (Fig. 8). Thirty-six and 26% of probe sets up- and down-regulated, respectively, ≥2-fold in our memory cells were also up- or down-regulated ≥2-fold in this previous analysis. The nonrandom overlap in our findings (χ2 test p < 0.0001 each for both up- and down-regulated genes) supports the presumption that we are both studying similar cells and confirms that “memory B cells” from our systems display many expression changes found among class-switched B cells from previously immunized wild-type animals.
FIGURE 8.

Venn diagram of genes identified by Bhattacharya et al. (24) and this study. The Bhattacharya et al. (24) lists of genes expressed ≥2-fold differently between naive and memory B cells were taken directly from the published manuscript. The lists labeled “Tomayko et al.” were generated from the second-generation microarray screen as described in Table I, using a 2-fold memory vs naive cutoff. Bolded numbers indicate numbers of Affymetrix probe sets found in one vs both lists. Select specific genes discussed in either manuscript are included. Italicized genes in the Bhattacharya et al. only list had a trend toward similar expression in our data set (Ccr6, Rgs18) or have been previously demonstrated by us to be differentially expressed among memory and naive B cells at the protein level by FACS (CD62L) (3, 25). For genes found only in the Bhattacharya et al. list, corresponding average fold-differences and Student's t test p values for the Tomayko et al. data are listed (raw data are detailed in supplemental Table Ib). For genes with multiple probe sets, all fold values were averaged, except for Bcl2, Mll3, and Tcf4, in which case only probe sets with p values <0.05 were considered.
Despite these similarities, the differences between our expression findings were greater than the similarities. We identified 229 and 313 probe sets up- and down-regulated among memory cells, respectively, that were not identified by the prior study. Importantly, many of the differentially expressed genes that we confirmed at the mRNA and protein levels and most that are the focus of this manuscript were identified only in our data sets. Conversely, of probe sets identified as up- or down-regulated in this previous analysis, 93 and 89%, respectively, were not similarly differentially expressed among our memory and naive populations. These discrepancies are likely due to a combination of false positives in their set, false negatives in ours, and intrinsic differences (such as IgG isotype) in the specific memory populations being studied. It was difficult to assess directly the influence of false positives in this other analysis, however, as there was relatively little confirmation of expression findings. The differential expression of three genes (CD80, CD62L, and Ccr6) was confirmed at the protein level by FACS and it appears that qPCR confirmation was done for only approximately five differentially expressed genes.
Starting with the raw data, we next conducted a new comparison of the two data sets using the normalization and statistical filtering algorithm described above for our second-generation analysis. The two data sets demonstrated similar numbers of probe sets with 2-fold differences in expression. However, using the Benjamini and Hochberg false-discovery rate calculation to limit the expected false positive rate to 5%, only 64 probe sets were identified as differentially expressed in the Bhattacharya et al. (24) data, regardless of fold change, compared with 2927 in ours. Furthermore, at the 2-fold level of differential expression, excluding IgG-encoding mRNAs, this represented only 38 genes. This striking difference in sensitivity suggests that there is significantly more variability between replicates in this other data set compared with ours. Indeed, Pearson's correlation around zero between our replicates averaged 0.874 and 0.875 for naive and memory, respectively, vs 0.623 and 0.619 in the other data set. Overall, we conclude that the two data sets are complementary in some ways, but statistical and methodological considerations indicate that the ones we report here are likely to be more reliable and have been validated to a substantially greater extent.
Discussion
It has long been presumed that memory B cells function differently from their precursors. However, functional differences remain poorly described, and there is little molecular understanding of how memory and naive B cells might differ in their functions. A better understanding of murine memory B cell properties is important because only in mice is it practical to test the roles of individual proteins by genetic means and to perform in vivo functional experiments. This report presents valuable data sets that offer molecular and functional clues to the nature of inherent differences between murine naive and memory B cells.
The utility of any large-scale expression screen depends to a great degree on the integrity of the data and analysis. We have taken several approaches to ensure that the data presented here are reliable. Memory and naive B cells were derived from two unique and validated systems. One system was previously published (19, 25) and the other is presented here. In these systems, we have shown that multiple surface markers are expressed in the same way as in wild-type memory cells generated in B6 mice (Refs. 11 and 12 and our unpublished data). These systems enabled the isolation of much larger quantities of more highly purified naive and memory B cells than would have been possible from wild-type mice. The large number of cells allowed the synthesis of RNA probes without secondary rounds of amplification, which can introduce artifactual biases. Within each screen, we performed multiple biological replicates and demonstrated that their expression profiles correlated highly with one another. Thus, we were able to use a conservative approach to evaluate the data.
We confirmed the expression differences of nearly 100 genes with qPCR. In a systematic evaluation of our first generation screen, qPCR data confirmed the up-regulation of 31 of 34 and down-regulation of 17 of 29 genes predicted to be differentially expressed by ≥3-fold. We also extended beyond the initial microarray screens to investigate expression by qPCR of multiple key genes involved in relevant signaling pathways. Because there is sometimes a lack of correlation between expression at the mRNA and protein levels, demonstration of alteration of expression at the protein level remains the gold standard for predicting functional outcomes. For the signaling molecules we focused on, in some cases, we could not find suitable reagents. However, we confirmed the up-regulation at the protein level of four of the major genes we focused on (Adora2a, Prkar2b, Prkcz, and Lifr). Lastly, we used phospho-flow analysis to demonstrate that the up-regulation of Lifr imparts differential memory cell function.
To date, there is one other published data set comparing global gene expression between murine memory and naive B cells (24). Like most of studies of B cell memory in the mouse, this study used class-switch as a proxy to identify memory B cells in immunized wild-type animals, and hence was limited by small cell numbers, requiring extensive probe amplification and presumably limiting ability to verify putative differences. Although there is nonrandom overlap between genes identified in the two studies, indicating that both are examining similar cells, and despite the large list of differentially expressed genes generated by Bhattacharya et al. (24), most of these genes were not identified in our analysis. Some of these discrepancies could be due to differences in IgM vs IgG memory cells or strain differences between C57BL/6 and BALB/c. However, it is also likely that this other data set has more false positives, due to a combination of second-round amplification of rare RNAs, and from abundant mRNAs expressed by contaminating cells that are relatively overrepresented among rare flow cytometry purified populations. Such contamination of rare memory populations with recently activated cells may be an explanation for why expression of Aicda mRNA was found to be up-regulated by Bhattacharya et al. (24) but in our data set it was, if anything, decreased in memory cells compared with naive (5.2-fold decreased, p = 0.26). Aicda expression is highly up-regulated in activated GC cells (73), which are a likely contaminant of rare cell sorting to isolate memory cells in wild-type mice, particularly in the absence of a marker to exclude GC cells (16). Consistent with low activation-induced deaminase expression in memory B cells, we recently showed that memory B cells do not accumulate mutations between weeks 12 and >24 postimmunization (3). Perhaps more importantly, analysis of our data reveled many differentially expressed genes that were not identified in this other study—including Adora2a, Prkar2b, and Lifr—that we confirmed at the mRNA, protein, or functional levels.
Overall, gene expression in memory B cells and their naive precursors is much more similar than different, in agreement with other studies comparing naive and memory B cells from humans and mice (3, 8, 24, 30). Nonetheless, the absolute number of genes that we identified as being differentially expressed is quite large. Therefore, there are many potential directions that could be pursued further. Our analysis revealed a number of genes that function in signaling, suggesting that compared with their precursors, memory B cells are rewired to react to environmental cues differently from naive cells. We have focused on more in-depth analysis of such genes.
Memory B cells up-regulate the ectoenzyme CD73, which catalyzes the conversion of extracellular AMP to adenosine, thus providing a ligand for the adenosine receptor Adora2a (53, 54). Adora2a is a GPCR which signals via adenyl cyclase to generate cAMP and activate PKA (74). Adora2a signaling inhibits inflammation in conditions such as endotoxic shock (50, 75, 76). Adora2a activation also attenuates TCR-mediated T cell activation (77). The role of Adora2a signaling in B cells has been little studied, but there is evidence that adenosine signaling and resultant PKA activation suppress BCR-mediated NF-κB activation (78). Together, these findings suggest that memory B cells may use adenosine signaling to dampen responses to antigenic stimulation in comparison to naive B cells and via CD73, generate adenosine that could regulate other cells in trans. This will need to be addressed in the future using genetic approaches.
The down-regulation in memory B cells of mRNAs encoding several Rgs proteins suggests that the response to GPCR ligand binding, including adenosine, should be quantitatively enhanced in memory compared with naive B cells. As chemokine receptors are GPCRs, another functional consequence of Rgs down-regulation expression may be to alter memory B cell migration. Rgs1and Rgs13 are both up-regulated among GC B cells (79, 80) and influence B cell migration to Cxcl12 and Cxcl13 (80–82). Studies in KO mice indicate that Rgs1 expression may be important for migration of cells out of the GC (82). Rgs proteins likely modulate other signaling events in memory cells as well.
The striking up-regulation of the PKA regulatory subunit 2β in memory B cells strongly suggests that response to GPCR ligand binding would preferentially activate PKA-II rather than PKA-I in memory B cells. PKA-I and PKA-II isozymes have identical catalytic subunits but distinct regulatory (RI vs RII) subunits (58, 59). These isozymes affect opposing downstream signaling events, and overexpression of RII suppresses RI expression and resultant PKA-I activity (83–85). In several systems, PKA-II activity induces differentiation, while PKA-I activity induces proliferation (reviewed in Ref. 60). It is thus possible that via preferential signaling through PKA-II vs PKA-I, memory and naive B cells mount divergent responses, such as Ab-forming cell differentiation vs proliferation, to identical stimulation.
Memory B cells up-regulate two PKC isoforms, PCKγ and PKCζ. Interestingly, PKCζ is also a target of PKA (86). It is well-established that PKC function is important in B lymphocytes (reviewed in Ref. 63). B cells express multiple PKC isoforms, most of which have been demonstrated to be activated upon BCR engagement, but precisely how their expression and function differs across B cell development has not been established (63). PKCβ is part of the BCR signalosome and is required for BCR-initiated NF-κB signaling while PKCδ regulates B cell tolerance (63). The roles of PKCγ and PKCζ in particular are not well-studied, most likely because naive B cells do not express these proteins at high levels. PKCζ KO mice have delayed development of B cell follicles in secondary lymphoid organs (87) and demonstrate impaired T-dependent Ab responses, although they do make GCs (88). PKCγ KO mice do not have apparent B lymphocyte defects (89, 90).
In contrast to their naive precursors, memory cells are longer-lived and self-renew (19). They also undergo asymmetrical differentiation. Thus, memory cells have properties similar to secondary stem cells, a concept also suggested by others (4, 27, 91). This notion is strongly supported by the discovery of striking overexpression of Lifr and Bmpr1a in memory B cells, given the importance of these proteins in maintaining the homeostatic proliferative state of various stem cell populations (64–66, 69, 92–95). It is intriguing to speculate that Bmpr1a and Lifr serve a similar function in memory B cells. Particularly important in this regard is the finding that memory B cells, but not naive B cells, respond to Lifr ligands in vitro. Establishing the role that Lifr and Bmpr1a play in memory B cell survival in vivo, maintenance, and differentiation potential will require complicated genetic approaches, but this work is underway.
In conclusion, our analysis has revealed a number of unsuspected differences between memory and naive B cells. Memory B cells appear programmed to conduct adenosine, GPCR, PKA, PKC, Bmpr1a, and Lifr signaling differently than naive B cells. Such findings highlight the power and strength of taking an unbiased approach in the exploratory phase of uncovering fundamental differences between developmentally related cells. Even within the signaling realm that is the focus of this article, there are many more potential directions than we can possibly follow. Therefore, it is important to realize that these findings open many new avenues of investigation for a variety of investigators interested in signaling pathways and/or B cell immune responses. In this and other respects, our gene expression data sets make unique and important contributions to the study of B cell biology and signaling.
Supplementary Material
Acknowledgments
We thank A. Haberman, S. Kleinstein, D. S. Navaratnam, and J. Liu for insightful discussion. Additionally, we thank D. S. Navaratnam and J. Liu for generously sharing technical expertise, and A. Haberman, S. Kleinstein, and K. Good for critical reading of the manuscript.
Footnotes
The costs of publication of this article were defrayed in part by the payment of page charges. This article must therefore be hereby marked advertisement in accordance with 18 U.S.C. Section 1734 solely to indicate this fact.
This work was supported by National Institutes of Health Grant A143603. M.M.T. was supported by the Dermatology Foundation and the Arthritis Foundation.
Abbreviations used in this paper: NP, nitrophenyl; qPCR, quantitative RT-PCR; Tg, transgenic; KO, knockout; CGG, chicken gammaglobulin; GC, germinal center; NIP, (4-hydroxy-5-iodo-3-nitrophenyl)acetyl; PI, propidium iodide; SA, streptavidin; Lifr, leukemia inhibitory factor receptor; PKC, protein kinase C; GPCR, G protein-coupled receptor; Rgs, regulator of G protein signaling; PKA, protein kinase A; AKAP, A-kinase anchoring protein.
The online version of this article contains supplemental material.
Disclosures
The authors have no financial conflict of interest.
References
- 1.Takahashi Y, Inamine A, Hashimoto S, Haraguchi S, Yoshioka E, Kojima N, Abe R, Takemori T. Novel role of the Ras cascade in memory B cell response. Immunity. 2005;23:127–138. doi: 10.1016/j.immuni.2005.06.010. [DOI] [PubMed] [Google Scholar]
- 2.Liu YJ, Barthelemy C, de Bouteiller O, Arpin C, Durand I, Banchereau J. Memory B cells from human tonsils colonize mucosal epithelium and directly present antigen to T cells by rapid up-regulation of B7-1 and B7-2. Immunity. 1995;2:239–248. doi: 10.1016/1074-7613(95)90048-9. [DOI] [PubMed] [Google Scholar]
- 3.Anderson SM, Tomayko MM, Ahuja A, Haberman AM, Shlomchik MJ. New markers for murine memory B cells that define mutated and unmutated subsets. J. Exp. Med. 2007;204:2103–2114. doi: 10.1084/jem.20062571. [DOI] [PMC free article] [PubMed] [Google Scholar]
- 4.Luckey CJ, Bhattacharya D, Goldrath AW, Weissman IL, Benoist C, Mathis D. Memory T and memory B cells share a transcriptional program of self-renewal with long-term hematopoietic stem cells. Proc. Natl. Acad. Sci. USA. 2006;103:3304–3309. doi: 10.1073/pnas.0511137103. [DOI] [PMC free article] [PubMed] [Google Scholar]
- 5.Klein U, Kuppers R, Rajewsky K. Evidence for a large compartment of IgM-expressing memory B cells in humans. Blood. 1997;89:1288–1298. [PubMed] [Google Scholar]
- 6.Agematsu K, Nagumo H, Yang FC, Nakazawa T, Fukushima K, Ito S, Sugita K, Mori T, Kobata T, Morimoto C, Komiyama A. B cell subpopulations separated by CD27 and crucial collaboration of CD27+ B cells and helper T cells in immunoglobulin production. Eur. J. Immunol. 1997;27:2073–2079. doi: 10.1002/eji.1830270835. [DOI] [PubMed] [Google Scholar]
- 7.Maurer D, Holter W, Majdic O, Fischer GF, Knapp W. CD27 expression by a distinct subpopulation of human B lymphocytes. Eur. J. Immunol. 1990;20:2679–2684. doi: 10.1002/eji.1830201223. [DOI] [PubMed] [Google Scholar]
- 8.Klein U, Tu Y, Stolovitzky GA, Keller JL, Haddad J, Jr., Miljkovic V, Cattoretti G, Califano A, Dalla-Favera R. Transcriptional analysis of the B cell germinal center reaction. Proc. Natl. Acad. Sci. USA. 2003;100:2639–2644. doi: 10.1073/pnas.0437996100. [DOI] [PMC free article] [PubMed] [Google Scholar]
- 9.Pascual V, Liu YJ, Magalski A, de Bouteiller O, Banchereau J, Capra JD. Analysis of somatic mutation in five B cell subsets of human tonsil. J. Exp. Med. 1994;180:329–339. doi: 10.1084/jem.180.1.329. [DOI] [PMC free article] [PubMed] [Google Scholar]
- 10.van Es JH, Meyling FH, Logtenberg T. High frequency of somatically mutated IgM molecules in the human adult blood B cell repertoire. Eur. J. Immunol. 1992;22:2761–2764. doi: 10.1002/eji.1830221046. [DOI] [PubMed] [Google Scholar]
- 11.Toyama H, Okada S, Hatano M, Takahashi Y, Takeda N, Ichii H, Takemori T, Kuroda Y, Tokuhisa T. Memory B cells without somatic hypermutation are generated from Bcl6-deficient B cells. Immunity. 2002;17:329. doi: 10.1016/s1074-7613(02)00387-4. [DOI] [PubMed] [Google Scholar]
- 12.Ridderstad A, Tarlinton DM. Kinetics of establishing the memory B cell population as revealed by CD38 expression. J. Immunol. 1998;160:4688–4695. [PubMed] [Google Scholar]
- 13.Blink EJ, Light A, Kallies A, Nutt SL, Hodgkin PD, Tarlinton DM. Early appearance of germinal center-derived memory B cells and plasma cells in blood after primary immunization. J. Exp. Med. 2005;201:545–554. doi: 10.1084/jem.20042060. [DOI] [PMC free article] [PubMed] [Google Scholar]
- 14.Tangye SG, Avery DT, Deenick EK, Hodgkin PD. Intrinsic differences in the proliferation of naive and memory human B cells as a mechanism for enhanced secondary immune responses. J. Immunol. 2003;170:686–694. doi: 10.4049/jimmunol.170.2.686. [DOI] [PubMed] [Google Scholar]
- 15.Tangye SG, Avery DT, Hodgkin PD. A division-linked mechanism for the rapid generation of Ig-secreting cells from human memory B cells. J. Immunol. 2003;170:261–269. doi: 10.4049/jimmunol.170.1.261. [DOI] [PubMed] [Google Scholar]
- 16.Takahashi Y, Ohta H, Takemori T. Fas is required for clonal selection in germinal centers and the subsequent establishment of the memory B cell repertoire. Immunity. 2001;14:181–192. doi: 10.1016/s1074-7613(01)00100-5. [DOI] [PubMed] [Google Scholar]
- 17.Chappell CP, Jacob J. Identification of memory B cells using a novel transgenic mouse model. J. Immunol. 2006;176:4706–4715. doi: 10.4049/jimmunol.176.8.4706. [DOI] [PubMed] [Google Scholar]
- 18.Ettinger R, Sims GP, Robbins R, Withers D, Fischer RT, Grammer AC, Kuchen S, Lipsky PE. IL-21 and BAFF/BLyS synergize in stimulating plasma cell differentiation from a unique population of human splenic memory B cells. J. Immunol. 2007;178:2872–2882. doi: 10.4049/jimmunol.178.5.2872. [DOI] [PubMed] [Google Scholar]
- 19.Anderson SM, Hannum LG, Shlomchik MJ. Memory B cell survival and function in the absence of secreted antibody and immune complexes on follicular dendritic cells. J. Immunol. 2006;176:4515–4519. doi: 10.4049/jimmunol.176.8.4515. [DOI] [PubMed] [Google Scholar]
- 20.Schittek B, Rajewsky K. Maintenance of B-cell memory by long-lived cells generated from proliferating precursors. Nature. 1990;346:749–751. doi: 10.1038/346749a0. [DOI] [PubMed] [Google Scholar]
- 21.Obukhanych TV, Nussenzweig MC. T-independent type II immune responses generate memory B cells. J. Exp. Med. 2006;203:305–310. doi: 10.1084/jem.20052036. [DOI] [PMC free article] [PubMed] [Google Scholar]
- 22.Bar-Or A, Oliveira EM, Anderson DE, Krieger JI, Duddy M, O'Connor KC, Hafler DA. Immunological memory: contribution of memory B cells expressing costimulatory molecules in the resting state. J. Immunol. 2001;167:5669–5677. doi: 10.4049/jimmunol.167.10.5669. [DOI] [PubMed] [Google Scholar]
- 23.Tangye SG, Liu YJ, Aversa G, Phillips JH, de Vries JE. Identification of functional human splenic memory B cells by expression of CD148 and CD27. J. Exp. Med. 1998;188:1691–1703. doi: 10.1084/jem.188.9.1691. [DOI] [PMC free article] [PubMed] [Google Scholar]
- 24.Bhattacharya D, Cheah MT, Franco CB, Hosen N, Pin CL, Sha WC, Weissman IL. Transcriptional profiling of antigen-dependent murine B cell differentiation and memory formation. J. Immunol. 2007;179:6808–6819. doi: 10.4049/jimmunol.179.10.6808. [DOI] [PMC free article] [PubMed] [Google Scholar]
- 25.Anderson SM, Tomayko MM, Shlomchik MJ. Intrinsic properties of human and murine memory B cells. Immunol. Rev. 2006;211:280–294. doi: 10.1111/j.0105-2896.2006.00398.x. [DOI] [PubMed] [Google Scholar]
- 26.Maruyama M, Lam KP, Rajewsky K. Memory B-cell persistence is independent of persisting immunizing antigen. Nature. 2000;407:636–642. doi: 10.1038/35036600. [DOI] [PubMed] [Google Scholar]
- 27.Fearon DT, Manders P, Wagner SD. Arrested differentiation, the self-renewing memory lymphocyte, and vaccination. Science. 2001;293:248–250. doi: 10.1126/science.1062589. [DOI] [PubMed] [Google Scholar]
- 28.Bernasconi NL, Traggiai E, Lanzavecchia A. Maintenance of serological memory by polyclonal activation of human memory B cells. Science. 2002;298:2199–2202. doi: 10.1126/science.1076071. [DOI] [PubMed] [Google Scholar]
- 29.Bryant VL, Ma CS, Avery DT, Li Y, Good KL, Corcoran LM, de Waal Malefyt R, Tangye SG. Cytokine-mediated regulation of human B cell differentiation into Ig-secreting cells: predominant role of IL-21 produced by CXCR5+ T follicular helper cells. J. Immunol. 2007;179:8180–8190. doi: 10.4049/jimmunol.179.12.8180. [DOI] [PubMed] [Google Scholar]
- 30.Alizadeh AA, Eisen MB, Davis RE, Ma C, Lossos IS, Rosenwald A, Boldrick JC, Sabet H, Tran T, Yu X, et al. Distinct types of diffuse large B-cell lymphoma identified by gene expression profiling. Nature. 2000;403:503–511. doi: 10.1038/35000501. [DOI] [PubMed] [Google Scholar]
- 31.Good KL, Tangye SG. Decreased expression of Kruppel-like factors in memory B cells induces the rapid response typical of secondary antibody responses. Proc. Natl. Acad. Sci. USA. 2007;104:13420–13425. doi: 10.1073/pnas.0703872104. [DOI] [PMC free article] [PubMed] [Google Scholar]
- 32.Hannum LG, Haberman AM, Anderson SM, Shlomchik MJ. Germinal center initiation, variable gene region hypermutation, and mutant B cell selection without detectable immune complexes on follicular dendritic cells. J. Exp. Med. 2000;192:931–942. doi: 10.1084/jem.192.7.931. [DOI] [PMC free article] [PubMed] [Google Scholar]
- 33.Shlomchik MJ, Zharhary D, Saunders T, Camper SA, Weigert MG. A rheumatoid factor transgenic mouse model of autoantibody regulation. Int. Immunol. 1993;5:1329–1341. doi: 10.1093/intimm/5.10.1329. [DOI] [PubMed] [Google Scholar]
- 34.Prak EL, Weigert M. Light chain replacement: a new model for antibody gene rearrangement. J. Exp. Med. 1995;182:541–548. doi: 10.1084/jem.182.2.541. [DOI] [PMC free article] [PubMed] [Google Scholar]
- 35.Wang H, Shlomchik MJ. Autoantigen-specific B cell activation in Fas-deficient rheumatoid factor immunoglobulin transgenic mice. J. Exp. Med. 1999;190:639–649. doi: 10.1084/jem.190.5.639. [DOI] [PMC free article] [PubMed] [Google Scholar]
- 36.Hannum LG, Ni D, Haberman AM, Weigert MG, Shlomchik MJ. A disease-related RF autoantibody is not tolerized in a normal mouse: implications for the origins of autoantibodies in autoimmune disease. J. Exp. Med. 1996;184:1269–1278. doi: 10.1084/jem.184.4.1269. [DOI] [PMC free article] [PubMed] [Google Scholar]
- 37.Chen J, Trounstine M, Alt FW, Young F, Kurahara C, Loring JF, Huszar D. Immunoglobulin gene rearrangement in B cell deficient mice generated by targeted deletion of the JH locus. Int. Immunol. 1993;5:647–656. doi: 10.1093/intimm/5.6.647. [DOI] [PubMed] [Google Scholar]
- 38.Chen J, Trounstine M, Kurahara C, Young F, Kuo CC, Xu Y, Loring JF, Alt FW, Huszar D. B cell development in mice that lack one or both immunoglobulin κ light chain genes. EMBO J. 1993;12:821–823. doi: 10.1002/j.1460-2075.1993.tb05722.x. [DOI] [PMC free article] [PubMed] [Google Scholar]
- 39.Allman D, Lindsley RC, DeMuth W, Rudd K, Shinton SA, Hardy RR. Resolution of three nonproliferative immature splenic B cell subsets reveals multiple selection points during peripheral B cell maturation. J. Immunol. 2001;167:6834–6840. doi: 10.4049/jimmunol.167.12.6834. [DOI] [PubMed] [Google Scholar]
- 40.Sachs K, Perez O, Pe'er D, Lauffenburger DA, Nolan GP. Causal protein-signaling networks derived from multiparameter single-cell data. Science. 2005;308:523–529. doi: 10.1126/science.1105809. [DOI] [PubMed] [Google Scholar]
- 41.Affymetrix, Inc. GeneChip® Expression Analysis Technical Manual. Affymetrix, Inc.; Santa Clara, CA.: c2004. Eukaryotic sample and array processing. pp. 2.1.3–2.3.18. 701021 Rev. 5. [Google Scholar]
- 42.Liu J, Karypis G, Hippen KL, Vegoe AL, Ruiz P, Gilkeson GS, Behrens TW. Genomic view of systemic autoimmunity in MRLlpr mice. Genes Immun. 2006;7:156–168. doi: 10.1038/sj.gene.6364286. [DOI] [PubMed] [Google Scholar]
- 43.Wu Z, Irizarry RA, Gentleman R, Martinez-Murillo F, Forrest Spencer F. A model-based background adjustment for oligonucleotide expression arrays. J. Am. Stat. Assoc. 2004;9:909–917. [Google Scholar]
- 44.Wu Z, Irizarry RA. Preprocessing of oligonucleotide array data. Nat. Biotechnol. 2004;22:656–658. doi: 10.1038/nbt0604-656b. [DOI] [PubMed] [Google Scholar]
- 45.Wang X, Seed B. A PCR primer bank for quantitative gene expression analysis. Nucleic Acids Res. 2003;31:e154. doi: 10.1093/nar/gng154. [DOI] [PMC free article] [PubMed] [Google Scholar]
- 46.Rozen S, Skaletsky H. Primer3 on the WWW for general users and for biologist programmers. Methods Mol. Biol. 2000;132:365–386. doi: 10.1385/1-59259-192-2:365. [DOI] [PubMed] [Google Scholar]
- 47.Laemmli UK. Cleavage of structural proteins during the assembly of the head of bacteriophage T4. Nature. 1970;227:680–685. doi: 10.1038/227680a0. [DOI] [PubMed] [Google Scholar]
- 48.Abramoff MD, Magelhaes PJ, Ram SJ. Image processing with ImageJ. Biophotonics International. 2004;11:36–42. [Google Scholar]
- 49.Bell J, Gray D. Antigen-capturing cells can masquerade as memory B cells. J. Exp. Med. 2003;197:1233–1244. doi: 10.1084/jem.20020270. [DOI] [PMC free article] [PubMed] [Google Scholar]
- 50.Ohta A, Sitkovsky M. Role of G-protein-coupled adenosine receptors in downregulation of inflammation and protection from tissue damage. Nature. 2001;414:916–920. doi: 10.1038/414916a. [DOI] [PubMed] [Google Scholar]
- 51.Sitkovsky MV, Lukashev D, Apasov S, Kojima H, Koshiba M, Caldwell C, Ohta A, Thiel M. Physiological control of immune response and inflammatory tissue damage by hypoxia-inducible factors and adenosine A2A receptors. Annu. Rev. Immunol. 2004;22:657–682. doi: 10.1146/annurev.immunol.22.012703.104731. [DOI] [PubMed] [Google Scholar]
- 52.Deaglio S, Dwyer KM, Gao W, Friedman D, Usheva A, Erat A, Chen JF, Enjyoji K, Linden J, Oukka M, et al. Adenosine generation catalyzed by CD39 and CD73 expressed on regulatory T cells mediates immune suppression. J. Exp. Med. 2007;204:1257–1265. doi: 10.1084/jem.20062512. [DOI] [PMC free article] [PubMed] [Google Scholar]
- 53.Resta R, Yamashita Y, Thompson LF. Ecto-enzyme and signaling functions of lymphocyte CD73. Immunol. Rev. 1998;161:95–109. doi: 10.1111/j.1600-065x.1998.tb01574.x. [DOI] [PubMed] [Google Scholar]
- 54.Godecke A. cAMP: fuel for extracellular adenosine formation? Br. J. Pharmacol. 2008;153:1087–1089. doi: 10.1038/bjp.2008.7. [DOI] [PMC free article] [PubMed] [Google Scholar]
- 55.Siderovski DP, Willard FS. The GAPs, GEFs, and GDIs of heterotrimeric G-protein α subunits. Int. J. Biol. Sci. 2005;1:51–66. doi: 10.7150/ijbs.1.51. [DOI] [PMC free article] [PubMed] [Google Scholar]
- 56.Xie GX, Palmer PP. How regulators of G protein signaling achieve selective regulation. J. Mol. Biol. 2007;366:349–365. doi: 10.1016/j.jmb.2006.11.045. [DOI] [PMC free article] [PubMed] [Google Scholar]
- 57.Gilman AG. G proteins and dual control of adenylate cyclase. Cell. 1984;36:577–579. doi: 10.1016/0092-8674(84)90336-2. [DOI] [PubMed] [Google Scholar]
- 58.Sugden PH, Corbin JD. Adenosine 3′:5′-cyclic monophosphate-binding proteins in bovine and rat tissues. Biochem. J. 1976;159:423–437. doi: 10.1042/bj1590423. [DOI] [PMC free article] [PubMed] [Google Scholar]
- 59.Scott JD. Cyclic nucleotide-dependent protein kinases. Pharmacol. Ther. 1991;50:123–145. doi: 10.1016/0163-7258(91)90075-w. [DOI] [PubMed] [Google Scholar]
- 60.Cho-Chung YS, Nesterova M, Pepe S, Lee GR, Noguchi K, Srivastava RK, Srivastava AR, Alper O, Park YG, Lee YN. Antisense DNA-targeting protein kinase A-RIA subunit: a novel approach to cancer treatment. Front. Biosci. 1999;4:D898–D907. doi: 10.2741/cho-chung. [DOI] [PubMed] [Google Scholar]
- 61.Gold MG, Lygren B, Dokurno P, Hoshi N, McConnachie G, Tasken K, Carlson CR, Scott JD, Barford D. Molecular basis of AKAP specificity for PKA regulatory subunits. Mol. Cell. 2006;24:383–395. doi: 10.1016/j.molcel.2006.09.006. [DOI] [PubMed] [Google Scholar]
- 62.Beene DL, Scott JD. A-kinase anchoring proteins take shape. Curr. Opin. Cell Biol. 2007;19:192–198. doi: 10.1016/j.ceb.2007.02.011. [DOI] [PMC free article] [PubMed] [Google Scholar]
- 63.Guo B, Su TT, Rawlings DJ. Protein kinase C family functions in B-cell activation. Curr. Opin. Immunol. 2004;16:367–373. doi: 10.1016/j.coi.2004.03.012. [DOI] [PubMed] [Google Scholar]
- 64.Ying QL, Nichols J, Chambers I, Smith A. BMP induction of Id proteins suppresses differentiation and sustains embryonic stem cell self-renewal in collaboration with STAT3. Cell. 2003;115:281–292. doi: 10.1016/s0092-8674(03)00847-x. [DOI] [PubMed] [Google Scholar]
- 65.Andl T, Ahn K, Kairo A, Chu EY, Wine-Lee L, Reddy ST, Croft NJ, Cebra-Thomas JA, Metzger D, Chambon P, et al. Epithelial Bmpr1a regulates differentiation and proliferation in postnatal hair follicles and is essential for tooth development. Development. 2004;131:2257–2268. doi: 10.1242/dev.01125. [DOI] [PubMed] [Google Scholar]
- 66.He XC, Zhang J, Tong WG, Tawfik O, Ross J, Scoville DH, Tian Q, Zeng X, He X, Wiedemann LM, et al. BMP signaling inhibits intestinal stem cell self-renewal through suppression of Wnt-β-catenin signaling. Nat. Genet. 2004;36:1117–1121. doi: 10.1038/ng1430. [DOI] [PubMed] [Google Scholar]
- 67.ten Dijke P, Korchynskyi O, Valdimarsdottir G, Goumans MJ. Controlling cell fate by bone morphogenetic protein receptors. Mol. Cell. Endocrinol. 2003;211:105–113. doi: 10.1016/j.mce.2003.09.016. [DOI] [PubMed] [Google Scholar]
- 68.Miyazono K, Maeda S, Imamura T. BMP receptor signaling: transcriptional targets, regulation of signals, and signaling cross-talk. Cytokine Growth Factor Rev. 2005;16:251–263. doi: 10.1016/j.cytogfr.2005.01.009. [DOI] [PubMed] [Google Scholar]
- 69.Escary JL, Perreau J, Dumenil D, Ezine S, Brulet P. Leukaemia inhibitory factor is necessary for maintenance of haematopoietic stem cells and thymocyte stimulation. Nature. 1993;363:361–364. doi: 10.1038/363361a0. [DOI] [PubMed] [Google Scholar]
- 70.Burdon T, Smith A, Savatier P. Signalling, cell cycle and pluripotency in embryonic stem cells. Trends Cell Biol. 2002;12:432–438. doi: 10.1016/s0962-8924(02)02352-8. [DOI] [PubMed] [Google Scholar]
- 71.Kristensen DM, Kalisz M, Nielsen JH. Cytokine signalling in embryonic stem cells. APMIS. 2005;113:756–772. doi: 10.1111/j.1600-0463.2005.apm_391.x. [DOI] [PubMed] [Google Scholar]
- 72.Tusher VG, Tibshirani R, Chu G. Significance analysis of microar-rays applied to the ionizing radiation response. Proc. Natl. Acad. Sci. USA. 2001;98:5116–5121. doi: 10.1073/pnas.091062498. [DOI] [PMC free article] [PubMed] [Google Scholar]
- 73.Muramatsu M, Sankaranand VS, Anant S, Sugai M, Kinoshita K, Davidson NO, Honjo T. Specific expression of activation-induced cytidine deaminase (AID), a novel member of the RNA-editing deaminase family in germinal center B cells. J. Biol. Chem. 1999;274:18470–18476. doi: 10.1074/jbc.274.26.18470. [DOI] [PubMed] [Google Scholar]
- 74.Fredholm BB, Chern Y, Franco R, Sitkovsky M. Aspects of the general biology of adenosine A2A signaling. Prog. Neurobiol. 2007;83:263–276. doi: 10.1016/j.pneurobio.2007.07.005. [DOI] [PubMed] [Google Scholar]
- 75.Nemeth ZH, Csoka B, Wilmanski J, Xu D, Lu Q, Ledent C, Deitch EA, Pacher P, Spolarics Z, Hasko G. Adenosine A2A receptor inactivation increases survival in polymicrobial sepsis. J. Immunol. 2006;176:5616–5626. doi: 10.4049/jimmunol.176.9.5616. [DOI] [PMC free article] [PubMed] [Google Scholar]
- 76.Sullivan GW, Fang G, Linden J, Scheld WM. A2A adenosine receptor activation improves survival in mouse models of endotoxemia and sepsis. J. Infect. Dis. 2004;189:1897–1904. doi: 10.1086/386311. [DOI] [PubMed] [Google Scholar]
- 77.Lappas CM, Rieger JM, Linden J. A2A adenosine receptor induction inhibits IFN-γ production in murine CD4+ T cells. J. Immunol. 2005;174:1073–1080. doi: 10.4049/jimmunol.174.2.1073. [DOI] [PubMed] [Google Scholar]
- 78.Minguet S, Huber M, Rosenkranz L, Schamel WW, Reth M, Brummer T. Adenosine and cAMP are potent inhibitors of the NF-κB pathway downstream of immunoreceptors. Eur. J. Immunol. 2005;35:31–41. doi: 10.1002/eji.200425524. [DOI] [PubMed] [Google Scholar]
- 79.Hong JX, Wilson GL, Fox CH, Kehrl JH. Isolation and characterization of a novel B cell activation gene. J. Immunol. 1993;150:3895–3904. [PubMed] [Google Scholar]
- 80.Shi GX, Harrison K, Wilson GL, Moratz C, Kehrl JH. RGS13 regulates germinal center B lymphocytes responsiveness to CXC chemokine ligand (CXCL)12 and CXCL13. J. Immunol. 2002;169:2507–2515. doi: 10.4049/jimmunol.169.5.2507. [DOI] [PubMed] [Google Scholar]
- 81.Reif K, Cyster JG. RGS molecule expression in murine B lymphocytes and ability to down-regulate chemotaxis to lymphoid chemokines. J. Immunol. 2000;164:4720–4729. doi: 10.4049/jimmunol.164.9.4720. [DOI] [PubMed] [Google Scholar]
- 82.Moratz C, Hayman JR, Gu H, Kehrl JH. Abnormal B-cell responses to chemokines, disturbed plasma cell localization, and distorted immune tissue architecture in Rgs1–/– mice. Mol. Cell. Biol. 2004;24:5767–5775. doi: 10.1128/MCB.24.13.5767-5775.2004. [DOI] [PMC free article] [PubMed] [Google Scholar]
- 83.Nesterova M, Yokozaki H, McDuffie E, Cho-Chung YS. Over-expression of RII β regulatory subunit of protein kinase A in human colon carcinoma cell induces growth arrest and phenotypic changes that are abolished by site-directed mutation of RII β. Eur. J. Biochem. 1996;235:486–494. doi: 10.1111/j.1432-1033.1996.00486.x. [DOI] [PubMed] [Google Scholar]
- 84.Neary CL, Nesterova M, Cho YS, Cheadle C, Becker KG, Cho-Chung YS. Protein kinase A isozyme switching: eliciting differential cAMP signaling and tumor reversion. Oncogene. 2004;23:8847–8856. doi: 10.1038/sj.onc.1208165. [DOI] [PubMed] [Google Scholar]
- 85.Otten AD, McKnight GS. Overexpression of the type II regulatory subunit of the cAMP-dependent protein kinase eliminates the type I holoenzyme in mouse cells. J. Biol. Chem. 1989;264:20255–20260. [PubMed] [Google Scholar]
- 86.Huang NK, Lin YW, Huang CL, Messing RO, Chern Y. Activation of protein kinase A and atypical protein kinase C by A2A adenosine receptors antagonizes apoptosis due to serum deprivation in PC12 cells. J. Biol. Chem. 2001;276:13838–13846. doi: 10.1074/jbc.M008589200. [DOI] [PubMed] [Google Scholar]
- 87.Leitges M, Sanz L, Martin P, Duran A, Braun U, Garcia JF, Camacho F, Diaz-Meco MT, Rennert PD, Moscat J. Targeted disruption of the ζPKC gene results in the impairment of the NF-κB pathway. Mol. Cell. 2001;8:771–780. doi: 10.1016/s1097-2765(01)00361-6. [DOI] [PubMed] [Google Scholar]
- 88.Martin P, Duran A, Minguet S, Gaspar ML, Diaz-Meco MT, Rennert P, Leitges M, Moscat J. Role of ζ PKC in B-cell signaling and function. EMBO J. 2002;21:4049–4057. doi: 10.1093/emboj/cdf407. [DOI] [PMC free article] [PubMed] [Google Scholar]
- 89.Abeliovich A, Paylor R, Chen C, Kim JJ, Wehner JM, Tonegawa S. PKC γ mutant mice exhibit mild deficits in spatial and contextual learning. Cell. 1993;75:1263–1271. doi: 10.1016/0092-8674(93)90614-v. [DOI] [PubMed] [Google Scholar]
- 90.Abeliovich A, Chen C, Goda Y, Silva AJ, Stevens CF, Tonegawa S. Modified hippocampal long-term potentiation in PKC γ-mutant mice. Cell. 1993;75:1253–1262. doi: 10.1016/0092-8674(93)90613-u. [DOI] [PubMed] [Google Scholar]
- 91.Joshi NS, Kaech SM. Effector CD8 T cell development: a balancing act between memory cell potential and terminal differentiation. J. Immunol. 2008;180:1309–1315. doi: 10.4049/jimmunol.180.3.1309. [DOI] [PubMed] [Google Scholar]
- 92.Smith AG, Heath JK, Donaldson DD, Wong GG, Moreau J, Stahl M, Rogers D. Inhibition of pluripotential embryonic stem cell differentiation by purified polypeptides. Nature. 1988;336:688–690. doi: 10.1038/336688a0. [DOI] [PubMed] [Google Scholar]
- 93.Williams RL, Hilton DJ, Pease S, Willson TA, Stewart CL, Gearing DP, Wagner EF, Metcalf D, Nicola NA, Gough NM. Myeloid leukaemia inhibitory factor maintains the developmental potential of embryonic stem cells. Nature. 1988;336:684–687. doi: 10.1038/336684a0. [DOI] [PubMed] [Google Scholar]
- 94.Yoshida K, Chambers I, Nichols J, Smith A, Saito M, Yasukawa K, Shoyab M, Taga T, Kishimoto T. Maintenance of the pluripotential phenotype of embryonic stem cells through direct activation of gp130 signalling pathways. Mech. Dev. 1994;45:163–171. doi: 10.1016/0925-4773(94)90030-2. [DOI] [PubMed] [Google Scholar]
- 95.Zhang J, Li L. BMP signaling and stem cell regulation. Dev. Biol. 2005;284:1–11. doi: 10.1016/j.ydbio.2005.05.009. [DOI] [PubMed] [Google Scholar]
Associated Data
This section collects any data citations, data availability statements, or supplementary materials included in this article.