Abstract
On the basis of extensive studies in Joslin Clinic patients over 25 years, we propose a new model of diabetic nephropathy in type 1 diabetes. In this model, the predominant clinical feature of both early and late stages of diabetic nephropathy is progressive renal decline, not albuminuria. Progressive renal decline (estimated glomerular filtration rate loss >3.5 mL/min/year) is a unidirectional process that develops while patients have normal renal function. It progresses at an almost steady rate until end-stage renal disease is reached, albeit at widely differing rates among individuals. Progressive renal decline precedes the onset of microalbuminuria, and as it continues, it increases the risk of proteinuria. Therefore, study groups ascertained for microalbuminuria/proteinuria are enriched for patients with renal decline (decliners). We found prevalences of decliners in 10%, 32%, and 50% of patients with normoalbuminuria, microalbuminuria, and proteinuria, respectively. Whether the initial lesion of progressive renal decline is in the glomerulus, tubule, interstitium, or vasculature is unknown. Similarly unclear are the initiating mechanism and the driver of progression. No animal model mimics progressive renal decline, so etiological studies must be conducted in humans with diabetes. Prospective studies searching for biomarkers predictive of the onset and rate of progression of renal decline have already yielded positive findings that will help to develop not only accurate methods for early diagnosis but also new therapeutic approaches. Detecting in advance which patients will have rapid, moderate, or minimal rates of progression to end-stage renal disease will be the foundation for developing personalized methods of prevention and treatment of progressive renal decline in type 1 diabetes.
Risk of End-Stage Renal Disease in Type 1 Diabetes Is Still High
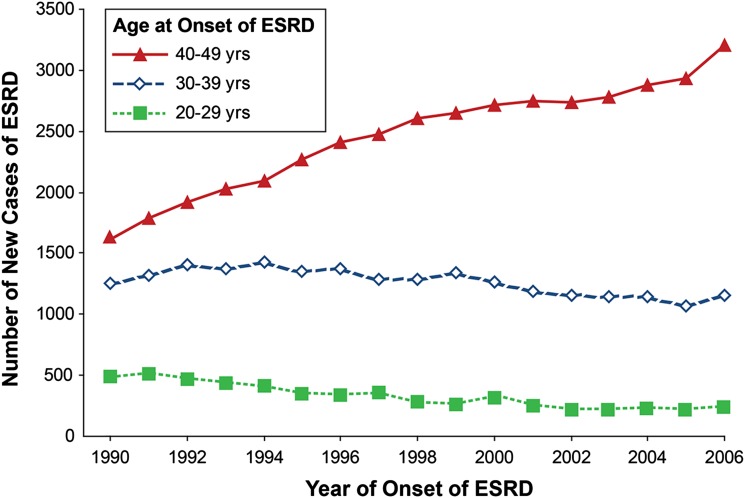
Despite almost universal implementation of renoprotective therapies over the past 25 years and attempts to improve glycemic control, the risk of end-stage renal disease (ESRD) in type 1 diabetes (T1D) is not decreasing but increasing (1). ESRD remains the major cause of excess morbidity and premature mortality in patients with T1D. Based on data of the U.S. Renal Data System (http://www.usrds.org/), we plotted in Fig. 1 the number of new cases of ESRD attributed to diabetes in the Caucasian U.S. population aged 20–49 years for years 1990–2006 according to age at onset of ESRD (1). In this age range, T1D is the predominant diabetes type with sufficient duration (at least 15 years) to develop ESRD due to diabetes. The total number of new cases of ESRD attributed to T1D was 3,359 in 1990, 3,972 in 1995, 4,287 in 2000, and 4,600 in 2006—an increase of about 9% per year. The age distribution also changed. While the number aged 20–29 or 30–39 years declined slightly, the number aged 40–49 years almost doubled. This suggests the improved care of T1D during the past 25 years has not reduced the overall risk of ESRD but may have postponed its occurrence to an older age or longer duration of T1D.
Figure 1.
Number of new cases of ESRD attributable to diabetes according to age at ESRD onset and calendar time. Total number of new cases among 20- to 49-year-olds in 1990 was 3,359; in 1995, it was 3,972; in 2000, it was 4,287; and in 2006, it was 4,600. We obtained from the U.S. Renal Data System (http://www.usrds.org/) the number of new cases of ESRD in the white U.S. population attributed to diabetes between 1990 and 2006. In these patients, T1D is the predominant diabetes type and the almost exclusive type in those with sufficient diabetes duration to develop diabetes-associated ESRD. Figure adapted with permission from Rosolowsky et al. (1).
This situation calls for action, beginning with learning more about the mechanisms underlying progressive renal decline and ESRD in diabetes. Our ignorance about these mechanisms stands as a glaring deficiency, resulting in part from the absence of an animal model that mimics progressive renal decline as seen in human diabetes (2). At the same time, studies in humans have been difficult. The collection of data on renal function changes over long periods of time has been hampered by a lack of consensus regarding the best method to measure renal function as the glomerular filtration rate (GFR) (3). Moreover, universal acceptance of a model of diabetic nephropathy centered on albuminuria has made examination of alternative models seem unnecessary (4–7). In the albuminuria-centric model, the onset of microalbuminuria (MA) is considered the initial manifestation of a disease process that leads to proteinuria, then GFR loss, and eventually ESRD. Thus, prevention or treatment of MA or proteinuria became the strategy to reduce risk of ESRD in T1D. Publications during the past 15 years and the trends shown in Fig. 1 suggest that the albuminuria-centric model and its implications might be incorrect (8–12).
Joslin Clinic Population: A Laboratory to Study the Natural History of Renal Decline in Diabetes
Joslin Clinic was established in 1898 to treat patients with diabetes. Currently the clinic provides long-term care for about 4,000 patients with T1D and 16,000 patients with type 2 diabetes of all ages. The majority of these patients reside in the eastern part of Massachusetts and 85% of them are Caucasian. A large proportion of patients remains under the care of the clinic for long time, frequently for life. Their complications develop while under observation in the clinic. The number of patients referred to the clinic due to kidney complications is negligible. Since 1991, we have been conducting longitudinal studies to examine determinants of renal function decline in patients with diabetes.
Recruitment of 1,600 patients into the 1st Joslin Kidney Study on Natural History of Microalbuminuria in T1D extended from 1991 through 1993, and follow-up continued through 2004 (12–15). Recruitment of 1,108 patients into the 2nd Joslin Kidney Study on Natural History of Early Renal Decline in T1D extended from 2003 through 2009, and follow-up is still ongoing (16–19). The Joslin Proteinuria Cohort was assembled from among patients with T1D who developed proteinuria while attending the clinic between 1991 and 2004, and follow-up is still ongoing (1,20–22). For recruitment and follow-up, all relevant data from medical records of the clinic were abstracted. Those data were supplemented with results of special examinations performed at enrollment and biannually afterward. Biobanks of blood and urine were established and specimens are stored at −85°C. Three phenotypes of diabetic nephropathy have been evaluated in all cohorts at enrollment and monitored during follow-up. These included 1) urinary albumin-to-creatinine ratio (ACR) in spot urine specimens; 2) estimated glomerular filtration rate (eGFR) that was determined based on serum concentration of creatinine, cystatin C, or both using recently developed formulas (3); and 3) onset of new ESRD diagnosed when a patient was placed on dialysis or received a kidney transplant.
In this review, I highlight previously published findings and unpublished data from the Joslin Studies relevant to supporting “progressive renal decline as the new paradigm of diabetic nephropathy in T1D.” As a result, attention to other possibly relevant publications is not exhaustive. This review also incorporates some of our earlier considerations regarding progressive renal decline (23,24).
Occurrence of Progressive Renal Decline in T1D
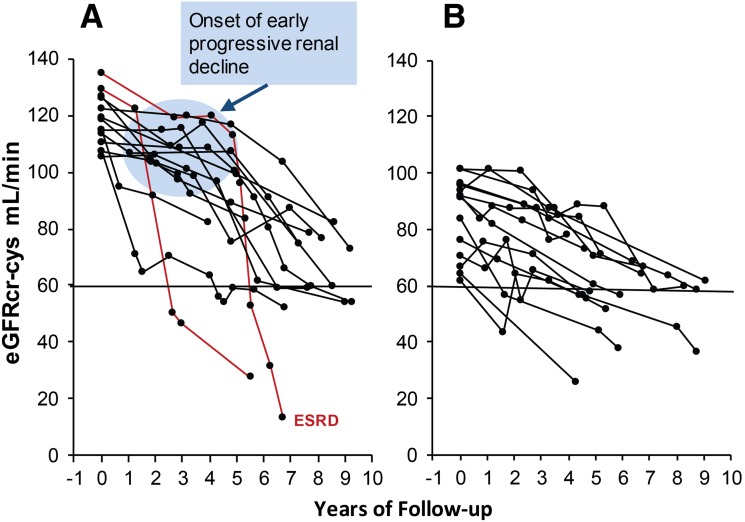
We refer to renal decline as progressive because, once started, it continues until renal failure develops and dialysis or kidney transplant is required (Figs. 2–5). We distinguish early renal decline that develops when patients have normal renal function from late decline in patients with impaired renal function (eGFR <60 mL/min) not because they differ but because other models have supposed different mechanisms are involved.
Figure 2.
eGFRcr-cys trajectories in patients with T1D with NA and progressive renal decline (eGFRcr-cys loss ≥3.3%/year) during 4–10 years of follow-up. The trajectories are plotted according to median (105 mL/min/1.73 m2) baseline eGFRcr-cys. Panel A shows decliners with baseline eGFRcr-cys above median. Panel B shows decliners below median. Lines in red indicate patients who developed proteinuria after onset of early renal decline. Half of the decliners in both panels had MA at the end of the follow-up. Figure adapted with permission from Krolewski et al. (19).
Figure 5.
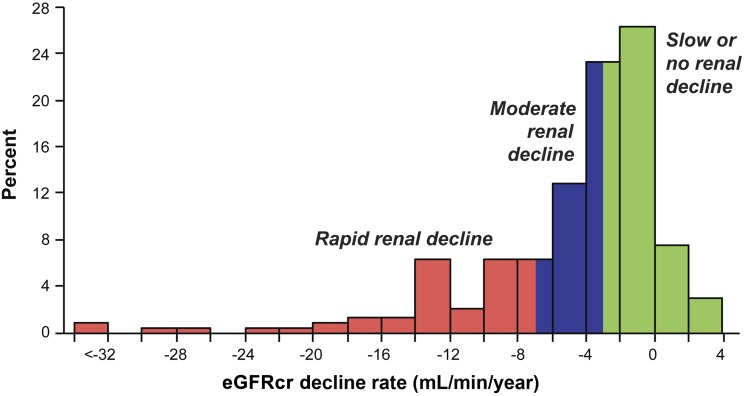
Distribution of slopes of eGFRcr changes in 240 subjects with proteinuria who entered the study with normal renal function and were followed for 7–18 years. The three patients in the interval <−32 had slopes −52.5, −56.4, and −70.5 mL/min/year. Adapted with permission from Skupien et al. (20).
Progressive Renal Decline Develops in Patients With Normoalbuminuria and MA
We examined in detail the onset of early progressive renal decline in the 2nd Joslin Kidney Study, comprising 595 patients with TID with normoalbuminuria (NA) and 513 with MA (19). During 4–10 years follow-up, longitudinal measurements of serum creatinine (cr) and cystatin C (cys) were used to trace individual trajectories of eGFRcr-cys changes over time. The distribution of the annual rate of eGFRcr-cys change was divided into rates consistent with “stable” renal function, eGFRcr-cys loss <3.3% per year (nondecliners), and rates reflecting progressive renal decline, eGFRcr-cys loss ≥3.3% per year (decliners). The frequency of decliners according to baseline eGFR and presence of NA and MA are shown in Table 1. Overall prevalence of decliners was 10% in patients with NA and 32% in those with MA. The frequency of decliners in each group increased with decreasing baseline eGFR. This association most likely resulted from ascertainment bias (i.e., decliners had higher risk of developing urinary albumin abnormalities). Interestingly, the prevalence of decliners in NA and MA in the 2nd Joslin Kidney Study is very similar as in the 1st Joslin Kidney Study (14).
Table 1.
Frequency of decliners (eGFRcr-cys loss ≥3.3 %/year)
| eGFRcr-cys (mL/min) | NA | MA |
|---|---|---|
| ≥90 | 505 (7) | 329 (24) |
| 60–89 | 71 (18) | 106 (40) |
| 30–59 | 19 (21) | 78 (48) |
| Total | 595 (10) | 513 (32) |
Data are n (%). Observed during 4–10 years of follow-up in the study group included in the 2nd Joslin Study on Natural History of Early Renal Decline in T1D according to CKD stages and presence of NA and MA at entry into the follow-up (A.S.K., unpublished data).
To determine time of initiation/onset of progressive renal decline, we plotted eGFRcr-cys trajectories in decliners with NA in Fig. 2 (19). For clarity, nondecliners are not shown and only patients who were enrolled during the first phase of recruitment (i.e., 2003–2006) are used. Decliners were divided arbitrarily into those with eGFRcr-cys above median (105 mL/min) at entry in panel A and below median in panel B. A striking difference was observed between the panels. Whereas in panel A (above median) almost all decliners had stable eGFRcr-cys (horizontal trajectories) for several years before progressive decline developed, in panel B (below median) almost all decliners had progressively declining eGFRcr-cys trajectories from entry. This unanticipated finding is novel and suggests that in patients with T1D the onset of progressive renal decline (the blue circle) happens suddenly when patients have normal renal function. Once the process begins, renal decline continues at an almost constant rate so the majority of trajectories of eGFRcr-cys in decliners appear linear and can be represented as simple regression slopes. The slopes of decline, however, varied tremendously among patients, ranging from a loss of 21% to 3.3% per year. The fastest decliners will reach ESRD within 5–15 years, while the slowest might need 25–30 years. It is interesting that during follow-up, MA developed in half of the decliners (19). Trajectories of eGFRcr-cys changes in the decliners in the corresponding data from the MA group in the 2nd Joslin Kidney Study are not presented because they are similar to those in the NA group.
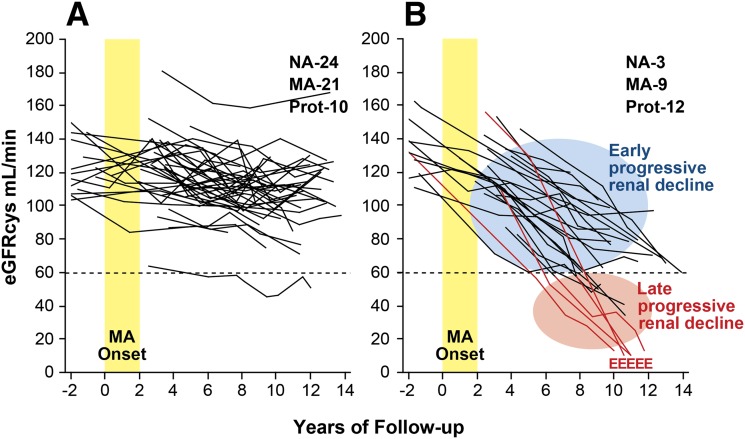
To explore the relation of progressive renal decline to changes in urinary albumin excretion, we examined the trajectories of renal function changes in patients as MA developed. In the 1st Joslin Kidney Study, MA developed in the early 1990s in 79 patients who were followed subsequently for 10 years (25). Trajectories of eGFRcys changes for these patients are plotted in Fig. 3. Renal function was stable in the majority (70%), despite the development of MA (Fig. 3A). The remaining trajectories (30%) qualified as progressive renal decline (i.e., eGFRcys loss ≥3.3% per year) (Fig. 3B), which was already established when MA developed and continued during subsequent follow-up. Similar to the decliners with NA in Fig. 2, eGFRcys losses in this group were well represented by simple regression slopes, albeit at rates varying widely among individuals. Within 10 years of follow-up, chronic kidney disease (CKD) stage ≥3 had been reached by half of them and ESRD had developed in five patients. If their trajectories of decline remain linear, CKD stage 3 will be reached by the rest during the next 10 years.
Figure 3.
Trajectories of eGFRcys in patients with T1D and new-onset MA who were followed for 12 years. A: Patients with stable renal function (nondecliners). The eGFRcys slopes of these patients reflect a loss of <3.3%/year. B: Patients with early progressive renal decline (decliners). The eGFRcys slopes of these patients reflect a loss ≥3.3%/year. MA onset indicates the 2-year interval when multiple determinations of ACR became elevated; E indicates the date of ESRD diagnosis. Insets: The numbers of patients at the end of follow-up according to category of albumin excretion rate: NA, MA, and proteinuria (Prot). Figure adapted with permission from Merchant et al. (25) and supplemented with unpublished data of patients who developed ESRD (A.S.K., unpublished data).
Early and late progressive renal decline are contrasted in Fig. 3B. The former refers to decline beginning while renal function is normal, a feature of diabetic nephropathy first described by us. The latter is a long-recognized feature of CKD observed by nephrologists when such patients are referred to them for follow-up. Visually striking is the absence of features distinguishing early from late decline except their starting point. Thus early and late decline might be successive segments of a uniform process.
Particularly relevant to the relation between renal decline and urinary albumin excretion is the observation that during the 2-year interval before the onset MA, the distribution of abnormal urinary albumin excretion did not differ between decliners and nondecliners (23). During follow-up one sees further uncoupling of changes in urinary albumin excretion and changes in eGFRcys. At the end of follow-up, and after many years of eGFR loss, proteinuria developed in only half of the decliners. NA was present in three patients and MA in the remainder. In contrast among nondecliners, MA persisted or progressed to proteinuria in half and regressed to NA in the other half. Similar results were obtained when eGFRcr trajectories were analyzed (26).
Not All Patients With Proteinuria Have Progressive Renal Decline
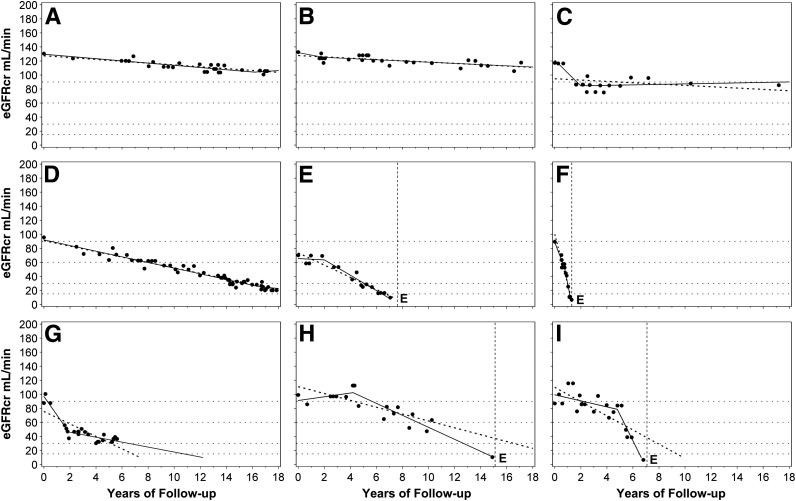
We recently examined the trajectories of renal function changes over time in patients with T1D included in the Joslin Proteinuria Cohort (20). In this cohort, 240 patients entered with eGFRcr above 60 mL/min and were followed for 7–18 years. We used serial measurements of serum creatinine to estimate eGFRcr and to determine trajectories of eGFRcr in this cohort (Fig. 4). For this illustration, we selected examples with the smallest deviations of eGFRcr values around regression lines. The first step in the classification of the trajectories was to distinguish stable versus declining renal function. In this analysis, a decline less steep than 3.5 mL/min/year was considered “stable” (examples in Fig. 4A–C), while a steeper slope was considered clinically significant decline (examples in Fig. 4D–F). For patients with declining renal function, the nonlinearity of a trajectory was considered clinically consequential if the estimated time of reaching an eGFR of 10 mL/min (expected time of ESRD) was more than 1 year from the observed time of ESRD (vertical dotted line). These nonlinear trajectories were further characterized as decelerating (Fig. 4G) or accelerating (Fig. 4H and I). Typically, acceleration interrupted a period of stable renal function (new-onset decline) as in panel H. Panel I illustrates a rare pattern, acceleration from one rate of decline to a faster one. In summary, the frequencies of these different patterns were stable eGFRcr (Fig. 4A–C) in 47% patients, significant linear loss (Fig. 4 D–F) in 37%, decelerating loss (Fig. 4G) in 12%, and accelerating loss (Fig. 4H and I) in only 4%. To gain an appreciation of the distribution of overall slopes of eGFRcr change in the whole group of 240 subjects, we extracted the linear component of each trajectory as a simple slope (Fig. 5). A few individuals had a positive slope (i.e., renal function improved at the end of follow-up), but the majority had negative slopes (i.e., decreased renal function). The median (25th, 75th percentiles) slope was –3 (–7, –1) mL/min/year. Reflecting the long tail of negative values, the 5th percentile was –16 and the minimum –71 mL/min/year (Fig. 4F). The available clinical information for this patient did not indicate any other cause of renal function decline than T1D (20). In summary, 25% of patients can be considered as having rapid progressive renal decline (eGFRcr slope <–7 mL/min/year) and they progressed to ESRD within 2–10 years. Another 25% had moderate progressive renal decline (eGFRcr slope –7 to –3 mL/min/year) and most progressed or will progress to ESRD within 10–30 years. The rest (50%) will have slow or no progressive renal decline and few may progress to ESRD during 30 years of follow-up.
Figure 4.
Patterns of renal decline during 7–18 years of follow-up. A–C: Nondecliners; D–F: linear decliners; G–I: nonlinear decliners (predictions of ESRD from linear and spline models differ by <2 years). G: Deceleration; H and I: acceleration; dots represent single eGFRcr measurements. Solid lines represent linear spline function. Dotted line represents linear regression. Vertical dotted lines mark the time of ESRD onset. E indicates the date of ESRD diagnosis. Figure adapted with permission from Skupien et al. (20).
Predictors/Determinants of Progressive Renal Decline
Demonstration of the existence of predictors of progressive renal decline lends credence to it as a disease process and its role as the dominant clinical feature of early and late stages of diabetic nephropathy.
Multiple Systemic Predictors of Early Progressive Renal Decline
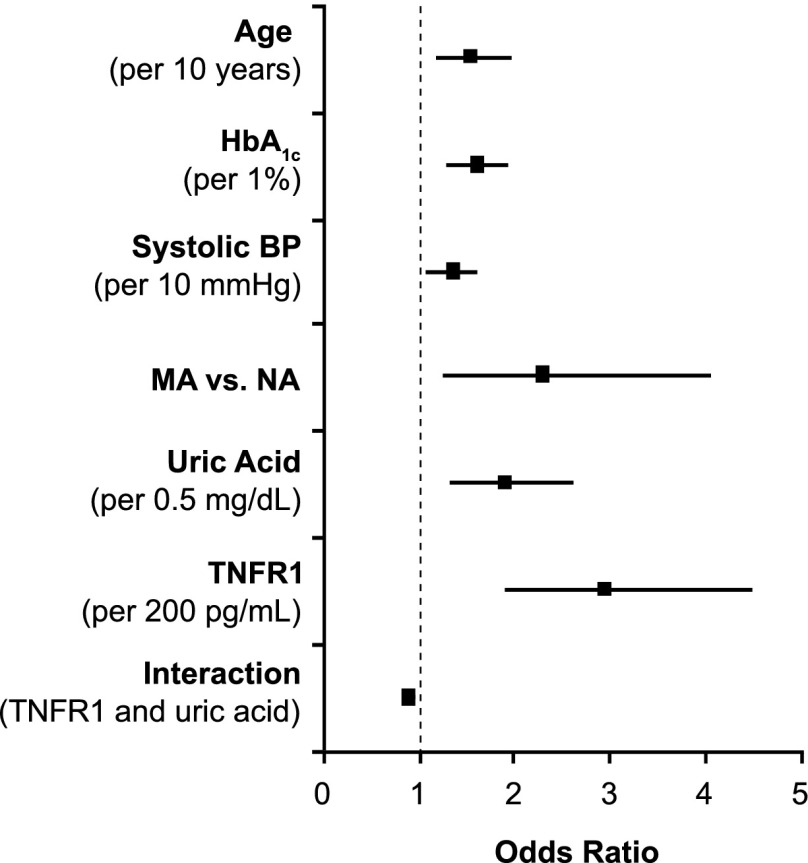
We have been searching systemic factors, both clinical characteristics and serum markers, for determinants of early progressive renal decline in patients with NA and MA enrolled into the first phase of the 2nd Joslin Study (19). We found multiple factors associated with the risk of renal decline, and the associations are similar regardless of whether patients entered the study with NA or MA. This finding supports the conclusion that early progressive renal decline is the primary clinical abnormality of diabetic nephropathy. Therefore, NA and MA were combined for this analysis. Factors associated with the risk of renal decline in multiple regression analysis are shown in Fig. 6. Although the exact mechanisms through which these factors contribute to early progressive renal decline are unknown, we discuss here possible mechanisms with regard to the two serum markers.
Figure 6.
Risk of progressive renal decline according to baseline clinical characteristics and serum markers in a cohort of patients with NA and MA enrolled in the 2nd Joslin Kidney Study and followed for 4–10 years. The results of multiple logistic analyses are presented. Data are derived from Krolewski et al. (19).
We showed that values of serum uric acid in the high normal range increased the risk of early progressive renal decline (17,19). Elevated serum uric acid has proinflammatory properties and may act as either a pro-oxidant or antioxidant molecule, depending on the circumstances (27). In vivo, rats rendered hyperuricemic by means of an uricase inhibitor develop an afferent arteriolopathy that decreases luminal diameter and produces renal ischemia, leading to glomerulosclerosis and tubulointerstitial fibrosis (28). Lowering serum uric acid concentration with allopurinol attenuates these histological and functional changes (29). It is intriguing to postulate that lowering serum uric acid in patients at risk for early progressive renal decline may reduce the risk of renal decline in T1D. A clinical trial, the Preventing Early Renal Loss in Diabetes (PERL) study, is being implemented to test this hypothesis (30).
Elevated serum concentrations of tumor necrosis factor receptors (TNFR) 1 or 2 are strongly associated with the risk of advanced stages of renal decline such as CKD stage 3 or ESRD (18,21,31). Our most recent study in patients with NA extends that association to include the onset of renal decline itself (19). While we do not know how elevated concentrations of TNFRs initiate renal decline and lead to renal failure, we have excluded some candidate hypotheses. For example, serum TNF-α itself is not involved directly or indirectly through regulation of serum TNFRs in the development of renal decline (18). Furthermore, serum concentrations of several potential downstream effectors of TNFRs (chemokines and circulating adhesion molecules, such as interleukin [IL]-8, IP-10, MCP1, vascular cell adhesion molecule, and intracellular adhesion molecule) are not associated with renal decline either (18). An intriguing finding is the negative interaction between serum uric acid and TNFR1 on the risk of renal decline in both NA and MA, meaning that the risk of renal decline for patients with elevated serum uric acid and serum TNFR1 is less than the sum of their individual risks (19). This suggests that the predisposing effects of serum uric acid and TNFR1 converge on some common pathway that cannot be further activated by one factor if it has already been turned on by the other. The nature of this putative pathway is unknown.
Urinary Biomarkers and Risk of Early Progressive Renal Decline
Although glomerulopathy has been assumed to be the major contributor to the pathogenesis of diabetic nephropathy, evidence is growing that tubulointerstitial injury mediated through an inflammation process also contributes to the development of diabetic nephropathy, particularly late progressive renal decline (32,33). For example in kidney biopsy studies, the severity of diabetic nephropathy (measured as GFR) is associated with the presence of specific inflammatory markers (34,35).
To pursue these cross-section findings prospectively, we investigated the role of chemokines in urine in the development of early progressive renal decline in patients with T1D (36)—the same patients whose trajectories of eGFRcys were presented in Fig. 3. In urine specimens obtained at entry into the study, we assayed 23 cytokines/chemokines, but only five (IL-6, IL-8, MCP1, IP-10, and MIP-1δ) were detected in a majority of specimens. Urinary concentrations of all five markers were significantly higher in decliners than nondecliners and identical in nondecliners regardless of whether MA or NA was present. The multiplicity of marker elevations distinguished decliners from nondecliners best. In multivariate analysis, elevation of two or more urinary cytokines/chemokines was strongly associated with future risk of early progressive renal decline (odds ratio 5.4 [95% CI 1.9, 15.6]). In contrast, concentration of CRP, IL-8, and MIP-1δ in serum did not differ between decliners and nondecliners (36).
In conclusion, our results are consistent with some previous studies in humans that implicated inflammation in the development and progression of renal injury in diabetes (37,38). However, we refined the characterization of its role in humans with T1D by demonstrating that elevated levels of markers of low-level inflammation in urine are not associated with MA per se but are specific for early progressive renal decline (36). The nature of the factors elevating the concentrations of urinary proinflammatory chemokines and cytokine in T1D remains unknown.
Progressive Renal Decline as the New Paradigm of Diabetic Nephropathy in T1D
New Paradigm and Search for Mechanisms
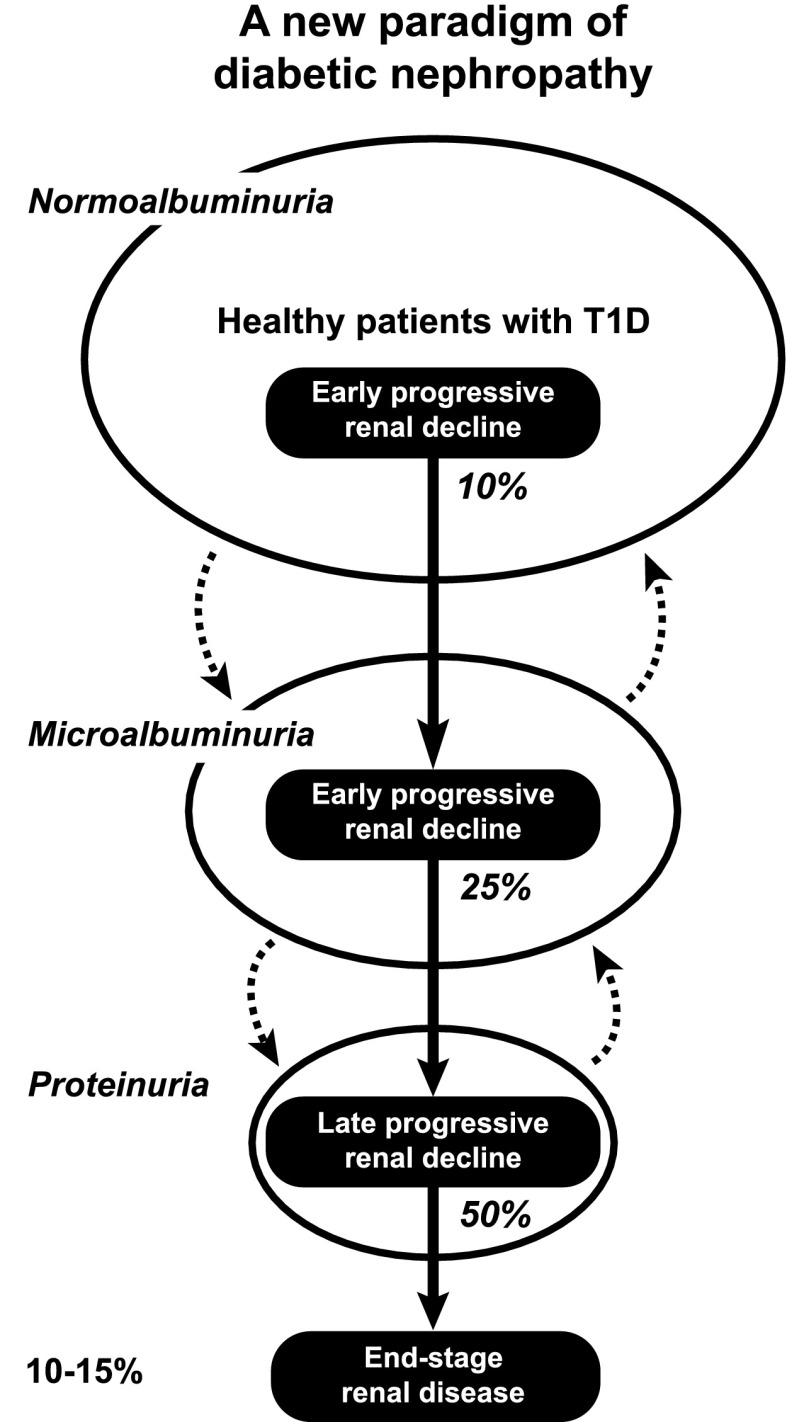
Having demonstrated unequivocally that progressive renal decline is the primary manifestation of diabetic nephropathy in T1D (Figs. 2–5), we propose that it be the new paradigm of diabetic nephropathy (23,24). As outlined in Fig. 7, progressive renal decline is represented as a one-directional process superimposed upon the natural course of abnormal urinary albumin excretion. The latter can regress, stay the same, or progress while renal decline, once initiated, progresses to ESRD, albeit at widely differing individual rates. Progressive renal decline is present in about 10%, 32%, and 50% of patients with NA, MA, and proteinuria, respectively. It increases the risk of MA in patients with NA and the risk of proteinuria in patients with MA. Therefore, a study group ascertained for MA will be enriched with decliners and a group ascertained for proteinuria enriched even more. In T1D, the lifetime risk of ESRD, the end of progressive renal decline that starts in patients with NA (Fig. 2), is estimated to be 10–15%. However, onsets of ESRD occur over a long span of T1D duration. For example, for the 172 cases of ESRD in the Joslin Proteinuria Cohort, the median (25th, 75th percentiles) duration of T1D at onset of ESRD was 28 (21, 37) years (1). The putative mechanisms that initiate and sustain progressive renal decline in T1D are not well known. To advance our understanding of these mechanisms while taking into account the salient features of progressive renal decline described above, the following questions should be investigated.
Figure 7.
Progressive renal decline as a new paradigm of diabetic nephropathy in T1D. Urinary albumin excretion increases in progressively smaller subsets and also regresses, while progressive renal decline develops early in a subset of patients with NA, MA, and proteinuria and almost always progresses to ESRD. Percentages in italics indicate proportion of patients with progressive renal decline in albumin excretion rate subgroups: NA, MA, and proteinuria. Figure adapted with permission from Krolewski and Bonventre (23).
First, in which kidney compartment, tissue, or cell type is the disease process initiated (Figs. 2 and 3B)? Candidates include the glomerulus, tubule, interstitium, or vasculature. The risk of developing progressive renal decline in patients with NA is strongly associated with the serum level of kidney injury molecule-1, a specific marker of tubular damage (39). Transgenic mice that overexpress kidney injury molecule-1 in tubules eventually develop morphological lesions and renal function decline as it is seen in human diabetes (40).
Second, are there differences in the mechanisms responsible for early and late progressive renal decline (Fig. 3B)? In the normal range of renal function, progressive eGFR loss may be due to unknown functional changes, while late progressive eGFR loss (CKD stage 3–5) is due to morphological lesions in some kidney compartment, tissue, or cell type. The similarity of the rates of eGFR loss during early and late phases of progressive renal decline argues against it (Figs. 3B and 4).
Third, to what extent does etiologic heterogeneity account for the wide individual variation in the rate of eGFR loss (Fig. 5)? The rates may be grouped as rapid, moderate, or slow and as nondecliners. Whether a patient has rapid loss, moderate or slow decline, or is protected against ESRD may be determined by genetic factors (41). Alternatively, different sets of environmental factors may be involved. For example, in a comparison of T1D cohorts with proteinuria from the Joslin Clinic and the Steno Diabetes Center, rapid decliners were significantly more frequent in the Joslin cohort (42).
Lacking an animal model of the progressive renal decline of human diabetes, we are left with clinical and epidemiological studies to investigate these questions. Application of new high-throughput technologies, such as genetics, genomics, proteomics, and metabolomics platforms, should help us understand the mechanisms of progressive renal decline in T1D. Recently we presented the results of such studies (43,44).
How to Diagnose Progressive Renal Decline?
An important message conveyed by Fig. 7 is that the majority of patients with NA and a large proportion of those with MA and proteinuria will never develop ESRD. On the other hand, among those at risk for ESRD the rate of eGFR loss varies widely (Figs. 2–5). Therefore, physicians face not only the challenge of identifying patients in whom progressive renal decline will develop from those who will be spared but also the challenge within the affected group of distinguishing rapid from moderate and slow decliners for estimating the time to onset of ESRD (Figs. 4 and 5).
At present, two tests are used to diagnose diabetic nephropathy in T1D: urinary albumin excretion (a measure of glomerular damage) and serum creatinine concentration (a measure of renal function loss). Positive results of these tests indicate the presence and extent of kidney damage at the time of examination. A recommendation has been made to use a combination of these tests in clinical practice to diagnose diabetic nephropathy (45), despite the fact that the results give no information about the rate of renal function loss or allow estimation of the time to ESRD.
Intensive research is under way to find better predictors. Recently, we showed in patients with diabetes and proteinuria that a single determination of serum cystatin C is superior to a simultaneous determination of serum creatinine in stratifying patients according to risk of developing ESRD (46). More recently, we showed that the serum concentration of TNFR1 or TNFR2 is a very good predictor of the future development of CKD stage ≥3 and ESRD in patients with T1D (18,21) and is similarly effective in predicting ESRD in patients with type 2 diabetes (31). Similar findings were obtained by other authors in different populations (47,48). Accordingly, we postulate that a suite of determinations, including urinary albumin excretion and serum concentrations of creatinine, cystatin C, and TNFR1, may be sufficient to construct an index for stratifying patients with T1D according to their risk of progressive renal decline and time of onset of ESRD (A.S.K., unpublished data).
Progressive Renal Decline and Interventions
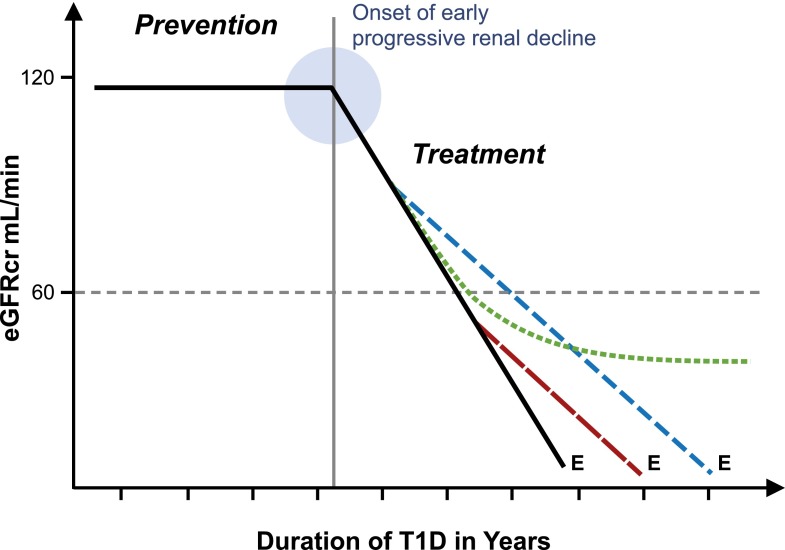
New effective therapies are desperately needed to reduce the risk of ESRD in T1D as discussed in a recent issue of Seminars in Nephrology (49). Strategies to prevent or delay the risk of ESRD are outlined in Fig. 8. The most desirable intervention is either complete prevention or postponement of the onset of early progressive renal decline by many years. The best example of such an intervention is the Diabetes Control and Complications Trial (DCCT) in which improved glycemic control in healthy patients with T1D delayed the onset of early progressive renal decline by 6 years (50). In contrast, treatment of similar patients with ACE inhibitors failed to delay this outcome (51).
Figure 8.
Schematic representation of progressive renal decline, the major feature of diabetic nephropathy, and possible modifications of it by interventions to reduce the risk of ESRD. Effective prevention postpones onset of early progressive renal decline (as described by de Boer et al. [50]) and does not alter the linear trajectory after onset. Effective treatment of patients after onset of progressive decline delays onset of ESRD by an interval depending on the time of intervention (broken vs. dashed line). Effective treatment may be followed by a lag interval (as described by Skupien et al. [22]) before deceleration becomes evident (dotted line). E indicates the date of ESRD diagnosis.
The other intervention is treatment to slow down the rate of eGFR loss in patients who already have early or late progressive renal decline (Fig. 8). Designing such interventions can be helped by taking into account some of the features of progressive renal decline discussed in this review.
First, as renal function loss seems to be linear, implementation of an effective treatment in patients with early progressive renal decline would result in longer postponement of onset of ESRD than its implementation in patients with late renal decline. Second, the effectiveness of new therapies to slow progressive renal decline cannot be evaluated in clinical trials that use changes in urinary albumin excretion as an outcome. The proper outcome measure is a change in the rate of renal decline as in the ongoing PERL study in which the effectiveness of treatment with allopurinol in reducing the rate of GFR loss in patients with early renal decline is being investigated (28). The U.S. Food and Drug Administration–recommended outcome measures (a doubling of serum creatinine or significant postponement of the onset of ESRD) for use in the 3–5 year clinical trial may not be sensitive enough to detect effects that are less than dramatic. Furthermore, such trials will not recognize an effective therapy that has a long lag interval before the effect is manifested. Our recent study illustrates precisely that type of delayed effect. In patients with T1D and proteinuria, an extended period of improved glycemic control was required before it decreased the rate of decline and postponed ESRD by many years (22). Third, the efficiency of clinical trials of new therapies is significantly reduced (and cost significantly increased) if patients who are nondecliners are included (Fig. 5). Recruitment of them is counterproductive despite their having proteinuria, hypertension, or impaired renal function. Finally, the wide variation in rates of renal decline illustrated in Fig. 5 may be determined by heterogeneous mechanisms. Prediction of the rate of renal function loss will allow not only stratification of patients according to risk of ESRD but also selection of different therapeutic strategies according to the urgency of ESRD risk. Rapid decliners (Fig. 5) may be suitable for aggressive interventions that have received little consideration so far. Such personalized approaches are being developed in other diseases and should be tried for progressive renal decline.
Article Information
Acknowledgments. The author thanks all patients in the Joslin Kidney Study for their generous participation and expresses his sincere gratitude to the collaborators, many research fellows, and supporting staff for making the Joslin Kidney Study a success.
Funding. This work was supported for the past 24 years by the National Institutes of Healthhttp://dx.doi.org/10.13039/100000098 grant DK-41526 to A.S.K. Support was also provided by the JDRFhttp://dx.doi.org/10.13039/100000901 grants 1-2008-1018 and 17-2013-8 to A.S.K.
Duality of Interest. A.S.K. is a co-inventor in a patent application on TNFRs as prognostic marker for ESRD, which is assigned to Joslin Diabetes Center and is licensed to EKF Diagnostics. No other potential conflicts of interest relevant to this article were reported.
References
- 1.Rosolowsky ET, Skupien J, Smiles AM, et al. Risk for ESRD in type 1 diabetes remains high despite renoprotection. J Am Soc Nephrol 2011;22:545–553 [DOI] [PMC free article] [PubMed] [Google Scholar]
- 2.Breyer MD, Böttinger E, Brosius FC 3rd, et al.; AMDCC . Mouse models of diabetic nephropathy. J Am Soc Nephrol 2005;16:27–45 [DOI] [PubMed] [Google Scholar]
- 3.Inker LA, Schmid CH, Tighiouart H, et al.; CKD-EPI Investigators . Estimating glomerular filtration rate from serum creatinine and cystatin C. N Engl J Med 2012;367:20–29 [DOI] [PMC free article] [PubMed] [Google Scholar]
- 4.Parving HH, Oxenbøll B, Svendsen PA, Christiansen JS, Andersen AR. Early detection of patients at risk of developing diabetic nephropathy. A longitudinal study of urinary albumin excretion. Acta Endocrinol (Copenh) 1982;100:550–555 [DOI] [PubMed] [Google Scholar]
- 5.Viberti GC, Jarrett RJ, Keen H. Microalbuminuria as prediction of nephropathy in diabetics. Lancet 1982;2:611. [DOI] [PubMed] [Google Scholar]
- 6.Mogensen CE, Christensen CK. Predicting diabetic nephropathy in insulin-dependent patients. N Engl J Med 1984;311:89–93 [DOI] [PubMed] [Google Scholar]
- 7.Parving HH, Mauer M, Ritz E Diabetic nephropathy. In The Kidney 7th ed. Brenner BM, Ed. Philadelphia, PA, Elsevier, 2004, p.1777–1818
- 8.Caramori ML, Fioretto P, Mauer M. The need for early predictors of diabetic nephropathy risk: is albumin excretion rate sufficient? Diabetes 2000;49:1399–1408 [DOI] [PubMed] [Google Scholar]
- 9.Perkins BA, Ficociello LH, Silva KH, Finkelstein DM, Warram JH, Krolewski AS. Regression of microalbuminuria in type 1 diabetes. N Engl J Med 2003;348:2285–2293 [DOI] [PubMed] [Google Scholar]
- 10.de Boer IH, Rue TC, Cleary PA, et al.; Diabetes Control and Complications Trial/Epidemiology of Diabetes Interventions and Complications Study Research Group . Long-term renal outcomes of patients with type 1 diabetes mellitus and microalbuminuria: an analysis of the Diabetes Control and Complications Trial/Epidemiology of Diabetes Interventions and Complications cohort. Arch Intern Med 2011;171:412–420 [DOI] [PMC free article] [PubMed] [Google Scholar]
- 11.Bakris GL, Molitch M. Microalbuminuria as a risk predictor in diabetes: the continuing saga. Diabetes Care 2014;37:867–875 [DOI] [PubMed] [Google Scholar]
- 12.Krolewski AS, Laffel LM, Krolewski M, Quinn M, Warram JH. Glycosylated hemoglobin and the risk of microalbuminuria in patients with insulin-dependent diabetes mellitus. N Engl J Med 1995;332:1251–1255 [DOI] [PubMed] [Google Scholar]
- 13.Scott LJ, Warram JH, Hanna LS, Laffel LM, Ryan L, Krolewski AS. A nonlinear effect of hyperglycemia and current cigarette smoking are major determinants of the onset of microalbuminuria in type 1 diabetes. Diabetes 2001;50:2842–2849 [DOI] [PubMed] [Google Scholar]
- 14.Perkins BA, Ficociello LH, Ostrander BE, et al. Microalbuminuria and the risk for early progressive renal function decline in type 1 diabetes. J Am Soc Nephrol 2007;18:1353–1361 [DOI] [PubMed] [Google Scholar]
- 15.Ficociello LH, Perkins BA, Roshan B, et al. Renal hyperfiltration and the development of microalbuminuria in type 1 diabetes. Diabetes Care 2009;32:889–893 [DOI] [PMC free article] [PubMed] [Google Scholar]
- 16.Niewczas MA, Ficociello LH, Johnson AC, et al. Serum concentrations of markers of TNFalpha and Fas-mediated pathways and renal function in nonproteinuric patients with type 1 diabetes. Clin J Am Soc Nephrol 2009;4:62–70 [DOI] [PMC free article] [PubMed] [Google Scholar]
- 17.Ficociello LH, Rosolowsky ET, Niewczas M, et al. High-normal serum uric acid increases risk of early progressive renal function loss in type 1 diabetes: results of 6-year follow-up. Diabetes Care 2010;33:1337–1343 [DOI] [PMC free article] [PubMed] [Google Scholar]
- 18.Gohda T, Niewczas MA, Ficociello LH, et al. Circulating TNF receptors 1 and 2 predict stage 3 CKD in type 1 diabetes. J Am Soc Nephrol 2012;23:516–524 [DOI] [PMC free article] [PubMed] [Google Scholar]
- 19.Krolewski AS, Niewczas MA, Skupien J, et al. Early progressive renal decline precedes the onset of microalbuminuria and its progression to macroalbuminuria. Diabetes Care 2014;37:226–234 [DOI] [PMC free article] [PubMed] [Google Scholar]
- 20.Skupien J, Warram JH, Smiles AM, et al. The early decline in renal function in patients with type 1 diabetes and proteinuria predicts the risk of end-stage renal disease. Kidney Int 2012;82:589–597 [DOI] [PMC free article] [PubMed] [Google Scholar]
- 21.Skupien J, Warram JH, Niewczas MA, et al. Synergism between circulating tumor necrosis factor receptor 2 and HbA(1c) in determining renal decline during 5-18 years of follow-up in patients with type 1 diabetes and proteinuria. Diabetes Care 2014;37:2601–2608 [DOI] [PMC free article] [PubMed] [Google Scholar]
- 22.Skupien J, Warram JH, Smiles A, Galecki A, Stanton R, Krolewski AS. Improved glycemic control and risk of ESRD in patients with type 1 diabetes and proteinuria. J Am Soc Nephrol 2014;25:2916–2925 [DOI] [PMC free article] [PubMed] [Google Scholar]
- 23.Krolewski AS, Bonventre JV. High risk of ESRD in type 1 diabetes: new strategies are needed to retard progressive renal function decline. Semin Nephrol 2012;32:407–414 [DOI] [PMC free article] [PubMed] [Google Scholar]
- 24.Krolewski AS, Gohda T, Niewczas MA. Progressive renal decline as the major feature of diabetic nephropathy in type 1 diabetes. Clin Exp Nephrol 2014;18:571–583 [DOI] [PMC free article] [PubMed] [Google Scholar]
- 25.Merchant ML, Perkins BA, Boratyn GM, et al. Urinary peptidome may predict renal function decline in type 1 diabetes and microalbuminuria. J Am Soc Nephrol 2009;20:2065–2074 [DOI] [PMC free article] [PubMed] [Google Scholar]
- 26.Perkins BA, Ficociello LH, Roshan B, Warram JH, Krolewski AS. In patients with type 1 diabetes and new-onset microalbuminuria the development of advanced chronic kidney disease may not require progression to proteinuria. Kidney Int 2010;77:57–64 [DOI] [PMC free article] [PubMed] [Google Scholar]
- 27.Yu MA, Sánchez-Lozada LG, Johnson RJ, Kang DH. Oxidative stress with an activation of the renin-angiotensin system in human vascular endothelial cells as a novel mechanism of uric acid-induced endothelial dysfunction. J Hypertens 2010;28:1234–1242 [PubMed] [Google Scholar]
- 28.Mazzali M, Kanellis J, Han L, et al. Hyperuricemia induces a primary renal arteriolopathy in rats by a blood pressure-independent mechanism. Am J Physiol Renal Physiol 2002;282:F991–F997 [DOI] [PubMed] [Google Scholar]
- 29.Siu YP, Leung KT, Tong MK, Kwan TH. Use of allopurinol in slowing the progression of renal disease through its ability to lower serum uric acid level. Am J Kidney Dis 2006;47:51–59 [DOI] [PubMed] [Google Scholar]
- 30.Maahs DM, Caramori L, Cherney DZI, et al.; PERL Consortium . Uric acid lowering to prevent kidney function loss in diabetes: the Preventing Early Renal Function Loss (PERL) allopurinol study. Curr Diab Rep 2013;13:550–559 [DOI] [PMC free article] [PubMed] [Google Scholar]
- 31.Niewczas MA, Gohda T, Skupien J, et al. Circulating TNF receptors 1 and 2 predict ESRD in type 2 diabetes. J Am Soc Nephrol 2012;23:507–515 [DOI] [PMC free article] [PubMed] [Google Scholar]
- 32.Bohle A, Wehrmann M, Bogenschütz O, Batz C, Müller CA, Müller GA. The pathogenesis of chronic renal failure in diabetic nephropathy. Investigation of 488 cases of diabetic glomerulosclerosis. Pathol Res Pract 1991;187:251–259 [DOI] [PubMed] [Google Scholar]
- 33.Gilbert RE, Cooper ME. The tubulointerstitium in progressive diabetic kidney disease: more than an aftermath of glomerular injury? Kidney Int 1999;56:1627–1637 [DOI] [PubMed] [Google Scholar]
- 34.Suzuki D, Miyazaki M, Naka R, et al. In situ hybridization of interleukin 6 in diabetic nephropathy. Diabetes 1995;44:1233–1238 [DOI] [PubMed] [Google Scholar]
- 35.Wada T, Furuichi K, Sakai N, et al. Up-regulation of monocyte chemoattractant protein-1 in tubulointerstitial lesions of human diabetic nephropathy. Kidney Int 2000;58:1492–1499 [DOI] [PubMed] [Google Scholar]
- 36.Wolkow PP, Niewczas MA, Perkins B, et al. Association of urinary inflammatory markers and renal decline in microalbuminuric type 1 diabetics. J Am Soc Nephrol 2008;19:789–797 [DOI] [PMC free article] [PubMed] [Google Scholar]
- 37.Saitoh A, Sekizuka K, Hayashi T, Kaneko S, Suzuki Y, Tomino Y. Detection of urinary MCP-1 in patients with diabetic nephropathy. Nephron 1998;80:99. [DOI] [PubMed] [Google Scholar]
- 38.Tashiro K, Koyanagi I, Saitoh A, et al. Urinary levels of monocyte chemoattractant protein-1 (MCP-1) and interleukin-8 (IL-8), and renal injuries in patients with type 2 diabetic nephropathy. J Clin Lab Anal 2002;16:1–4 [DOI] [PMC free article] [PubMed] [Google Scholar]
- 39.Nowak NZ, Niewczas MA, Walker W, Smiles A, Bonventre JV, Krolewski AS. Plasma KIM-1, a marker of tubular injury, predicts risk of early progressive renal decline in non-proteinuric patients with type 1 diabetes (T1D) [Abstract]. J Am Soc Nephrol 2014;25(Suppl.):691A–692A [Google Scholar]
- 40.Humphreys BD, Xu F, Sabbisetti V, et al. Chronic epithelial kidney injury molecule-1 expression causes murine kidney fibrosis. J Clin Invest 2013;123:4023–4035 [DOI] [PMC free article] [PubMed] [Google Scholar]
- 41.Pezzolesi MG, Poznik GD, Mychaleckyj JC, et al.; DCCT/EDIC Research Group . Genome-wide association scan for diabetic nephropathy susceptibility genes in type 1 diabetes. Diabetes 2009;58:1403–1410 [DOI] [PMC free article] [PubMed] [Google Scholar]
- 42.Rossing P, Lajer M, Smiles AM, Andressdottir G, Skupien J, Krolewski AS. Clinical outcomes of diabetic nephropathy in patients with type 1 diabetes attending the Steno and the Joslin [Abstract]. Diabetes 2014;63(Suppl. 1):A14 [Google Scholar]
- 43.Pezzolesi MG, Nikrad M, McDonnell KP, Smiles AM, Nowak N, Krolewski AS. Highly multiplexed proteomic analysis identifies novel plasma biomarkers for early progressive renal function decline leading to renal failure in type 1 diabetes [Abstract]. Diabetes 2014;63(Suppl. 1):A139 [Google Scholar]
- 44.Niewczas MA, Croall SE, Smiles AM, et al. Early renal decline in type 1 diabetes: metabolomic signature of resistors and progressors [Abstract]. Diabetes 2014;63(Suppl. 1):A13 [Google Scholar]
- 45.Jerums G, Panagiotopoulos S, Premaratne E, MacIsaac RJ. Integrating albuminuria and GFR in the assessment of diabetic nephropathy. Nat Rev Nephrol 2009;5:397–406 [DOI] [PubMed] [Google Scholar]
- 46.Krolewski AS, Warram JH, Forsblom C, et al. Serum concentration of cystatin C and risk of end-stage renal disease in diabetes. Diabetes Care 2012;35:2311–2316 [DOI] [PMC free article] [PubMed] [Google Scholar]
- 47.Forsblom C, Moran J, Harjutsalo V, et al. ; FinnDiane Study Group . Added value of soluble tumor necrosis factor-α receptor 1 as a biomarker of ESRD risk in patients with type 1 diabetes. Diabetes Care 2014;37:2334–2342 [DOI] [PubMed] [Google Scholar]
- 48.Pavkov ME, Nelson RG, Knowler WC, Cheng Y, Krolewski AS, Niewczas MA. Elevation of circulating TNF receptors 1 and 2 increases the risk of end-stage renal disease in American Indians with type 2 diabetes. Kidney Int 2015;87:812–819 [DOI] [PMC free article] [PubMed] [Google Scholar]
- 49.Krolewski AS, Bonventre JV. High risk of ESRD in type 1 diabetes: call for action: introduction. Semin Nephrol 2012;32:405–406 [DOI] [PubMed] [Google Scholar]
- 50.de Boer IH, Sun W, Cleary PA, et al.; DCCT/EDIC Research Group . Intensive diabetes therapy and glomerular filtration rate in type 1 diabetes. N Engl J Med 2011;365:2366–2376 [DOI] [PMC free article] [PubMed] [Google Scholar]
- 51.Mauer M, Zinman B, Gardiner R, et al. Renal and retinal effects of enalapril and losartan in type 1 diabetes. N Engl J Med 2009;361:40–51 [DOI] [PMC free article] [PubMed] [Google Scholar]


